- Reports
- Planning
- Dashboards
- Connectors
- Videos
Please be patient. It may take 5 - 15 seconds for your items to fully load on the page.

A Solver Report Design Overview
Learn how to use Solver’s Excel-based report designer to build a new custom report.
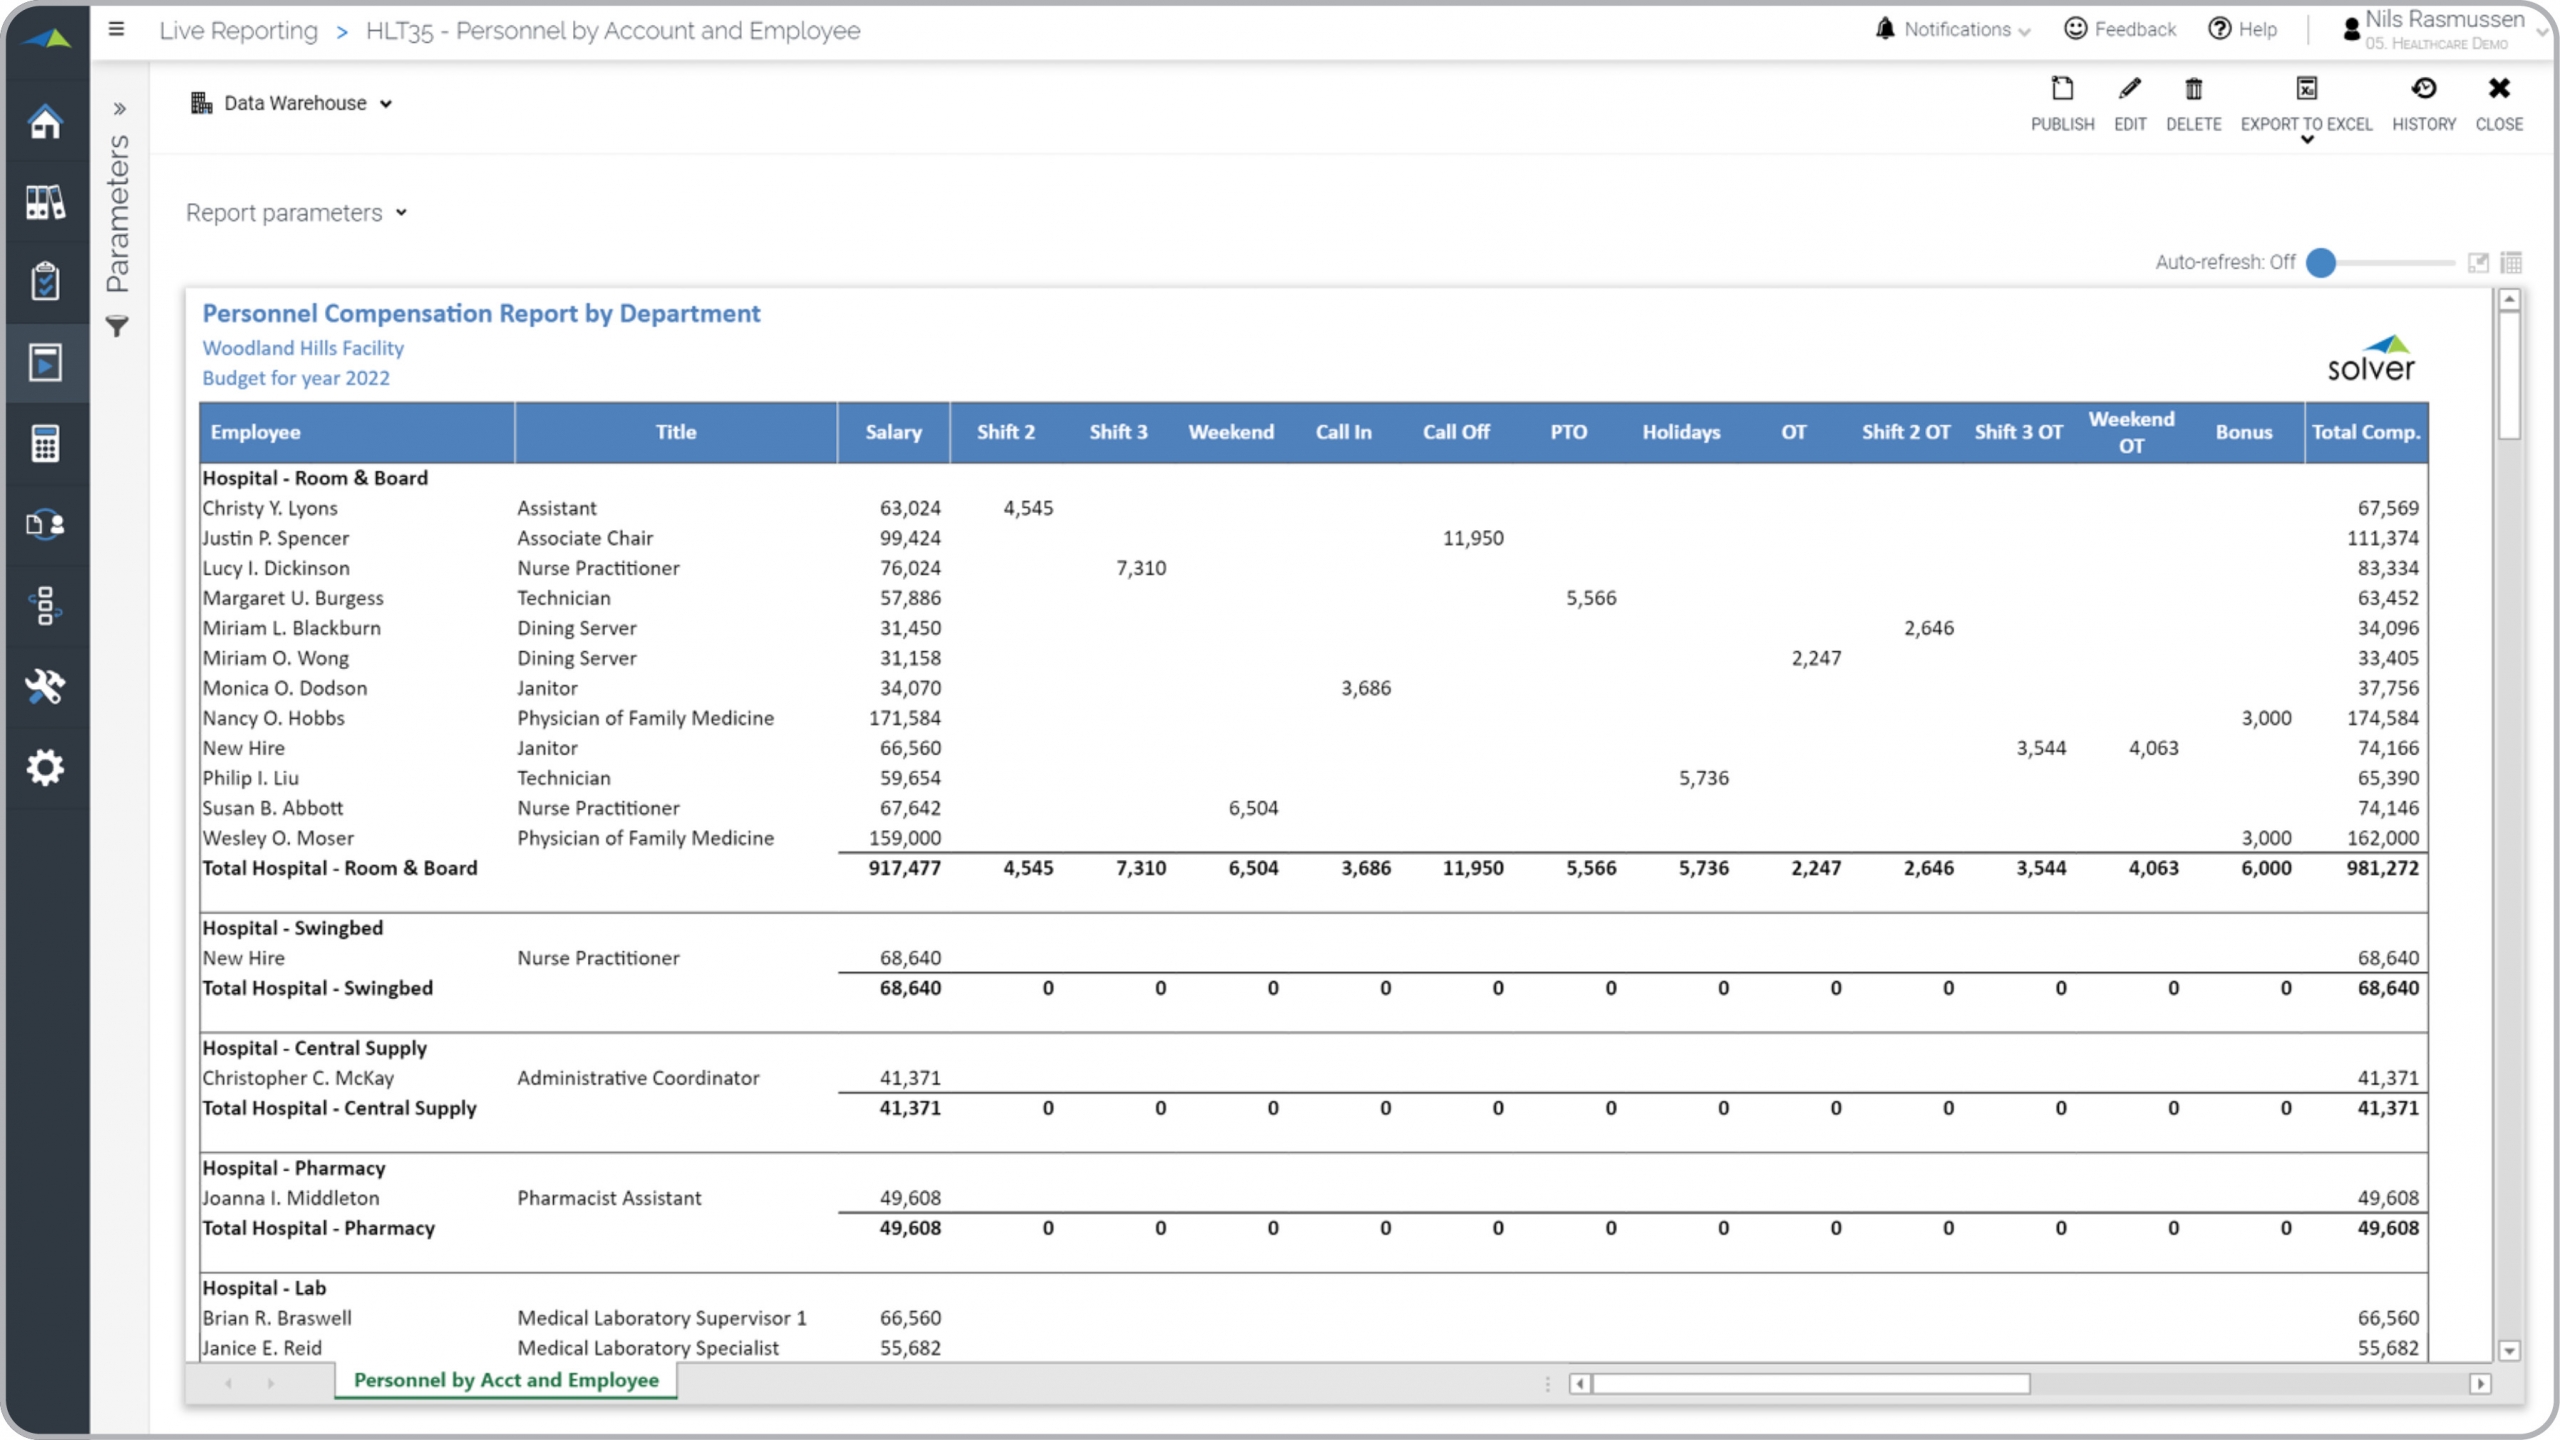
Health – Payroll Budget Report by Department
Payroll and compensation detail budget report by person by department.
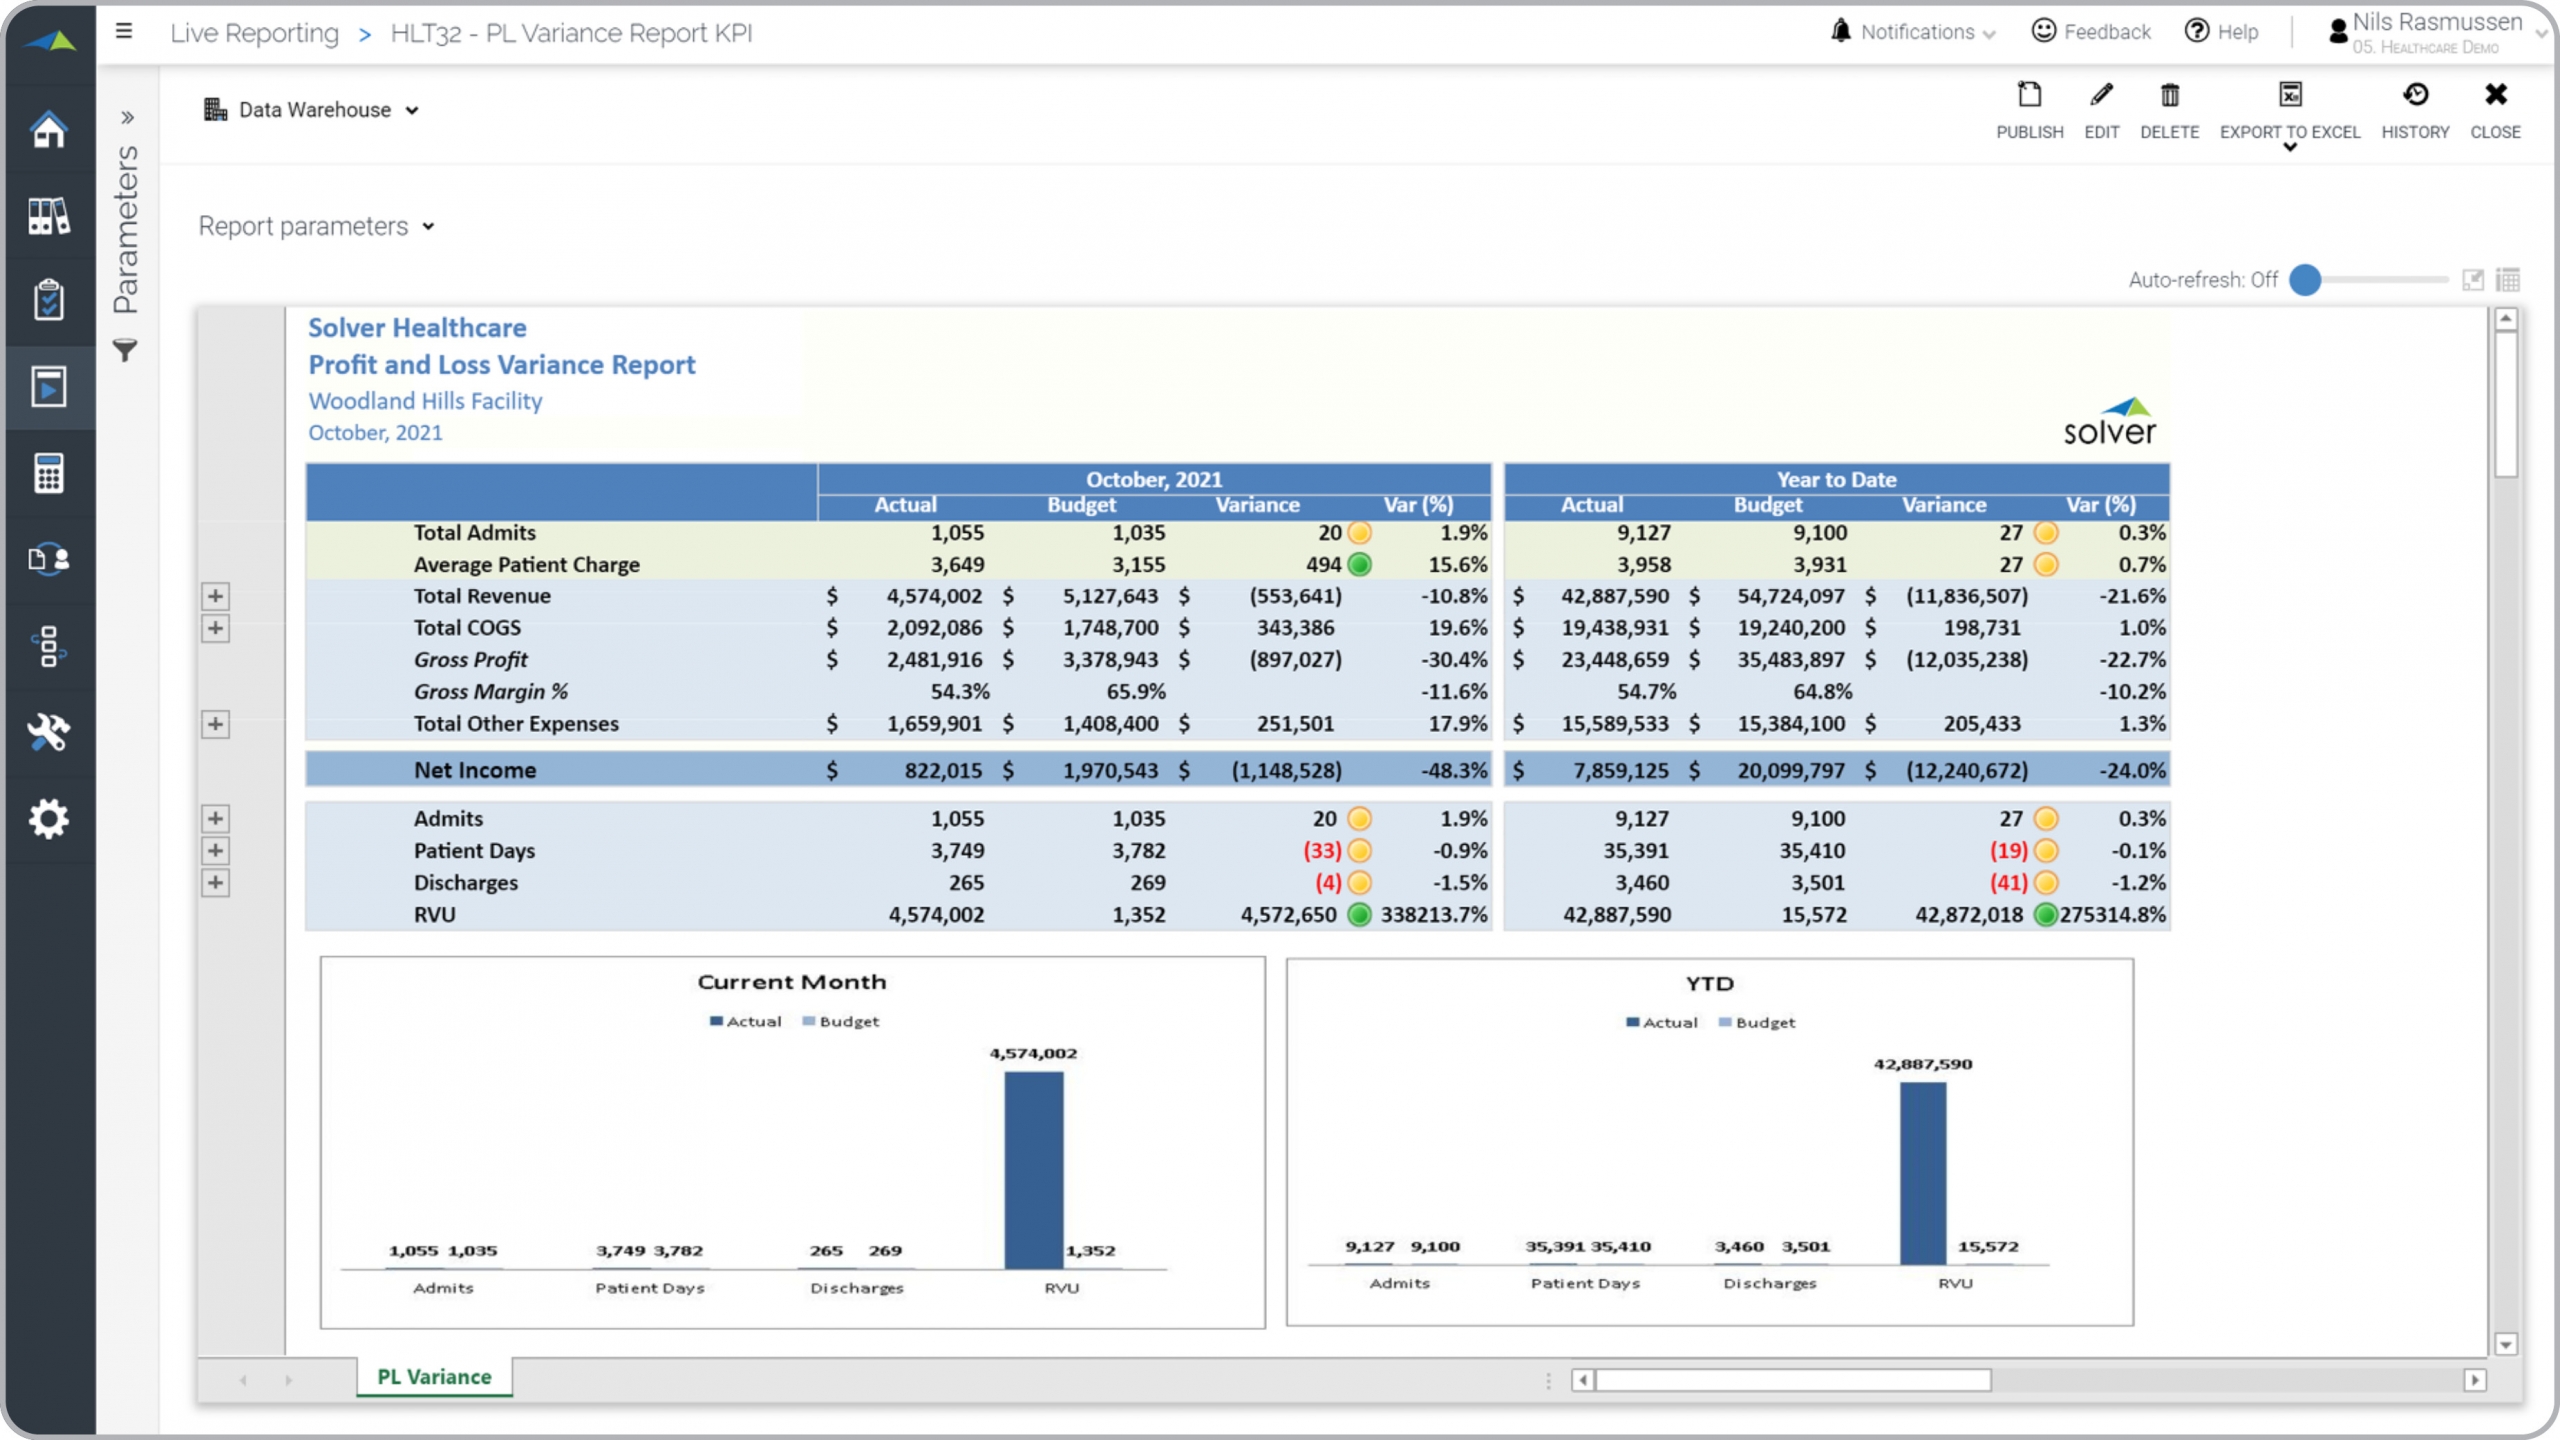
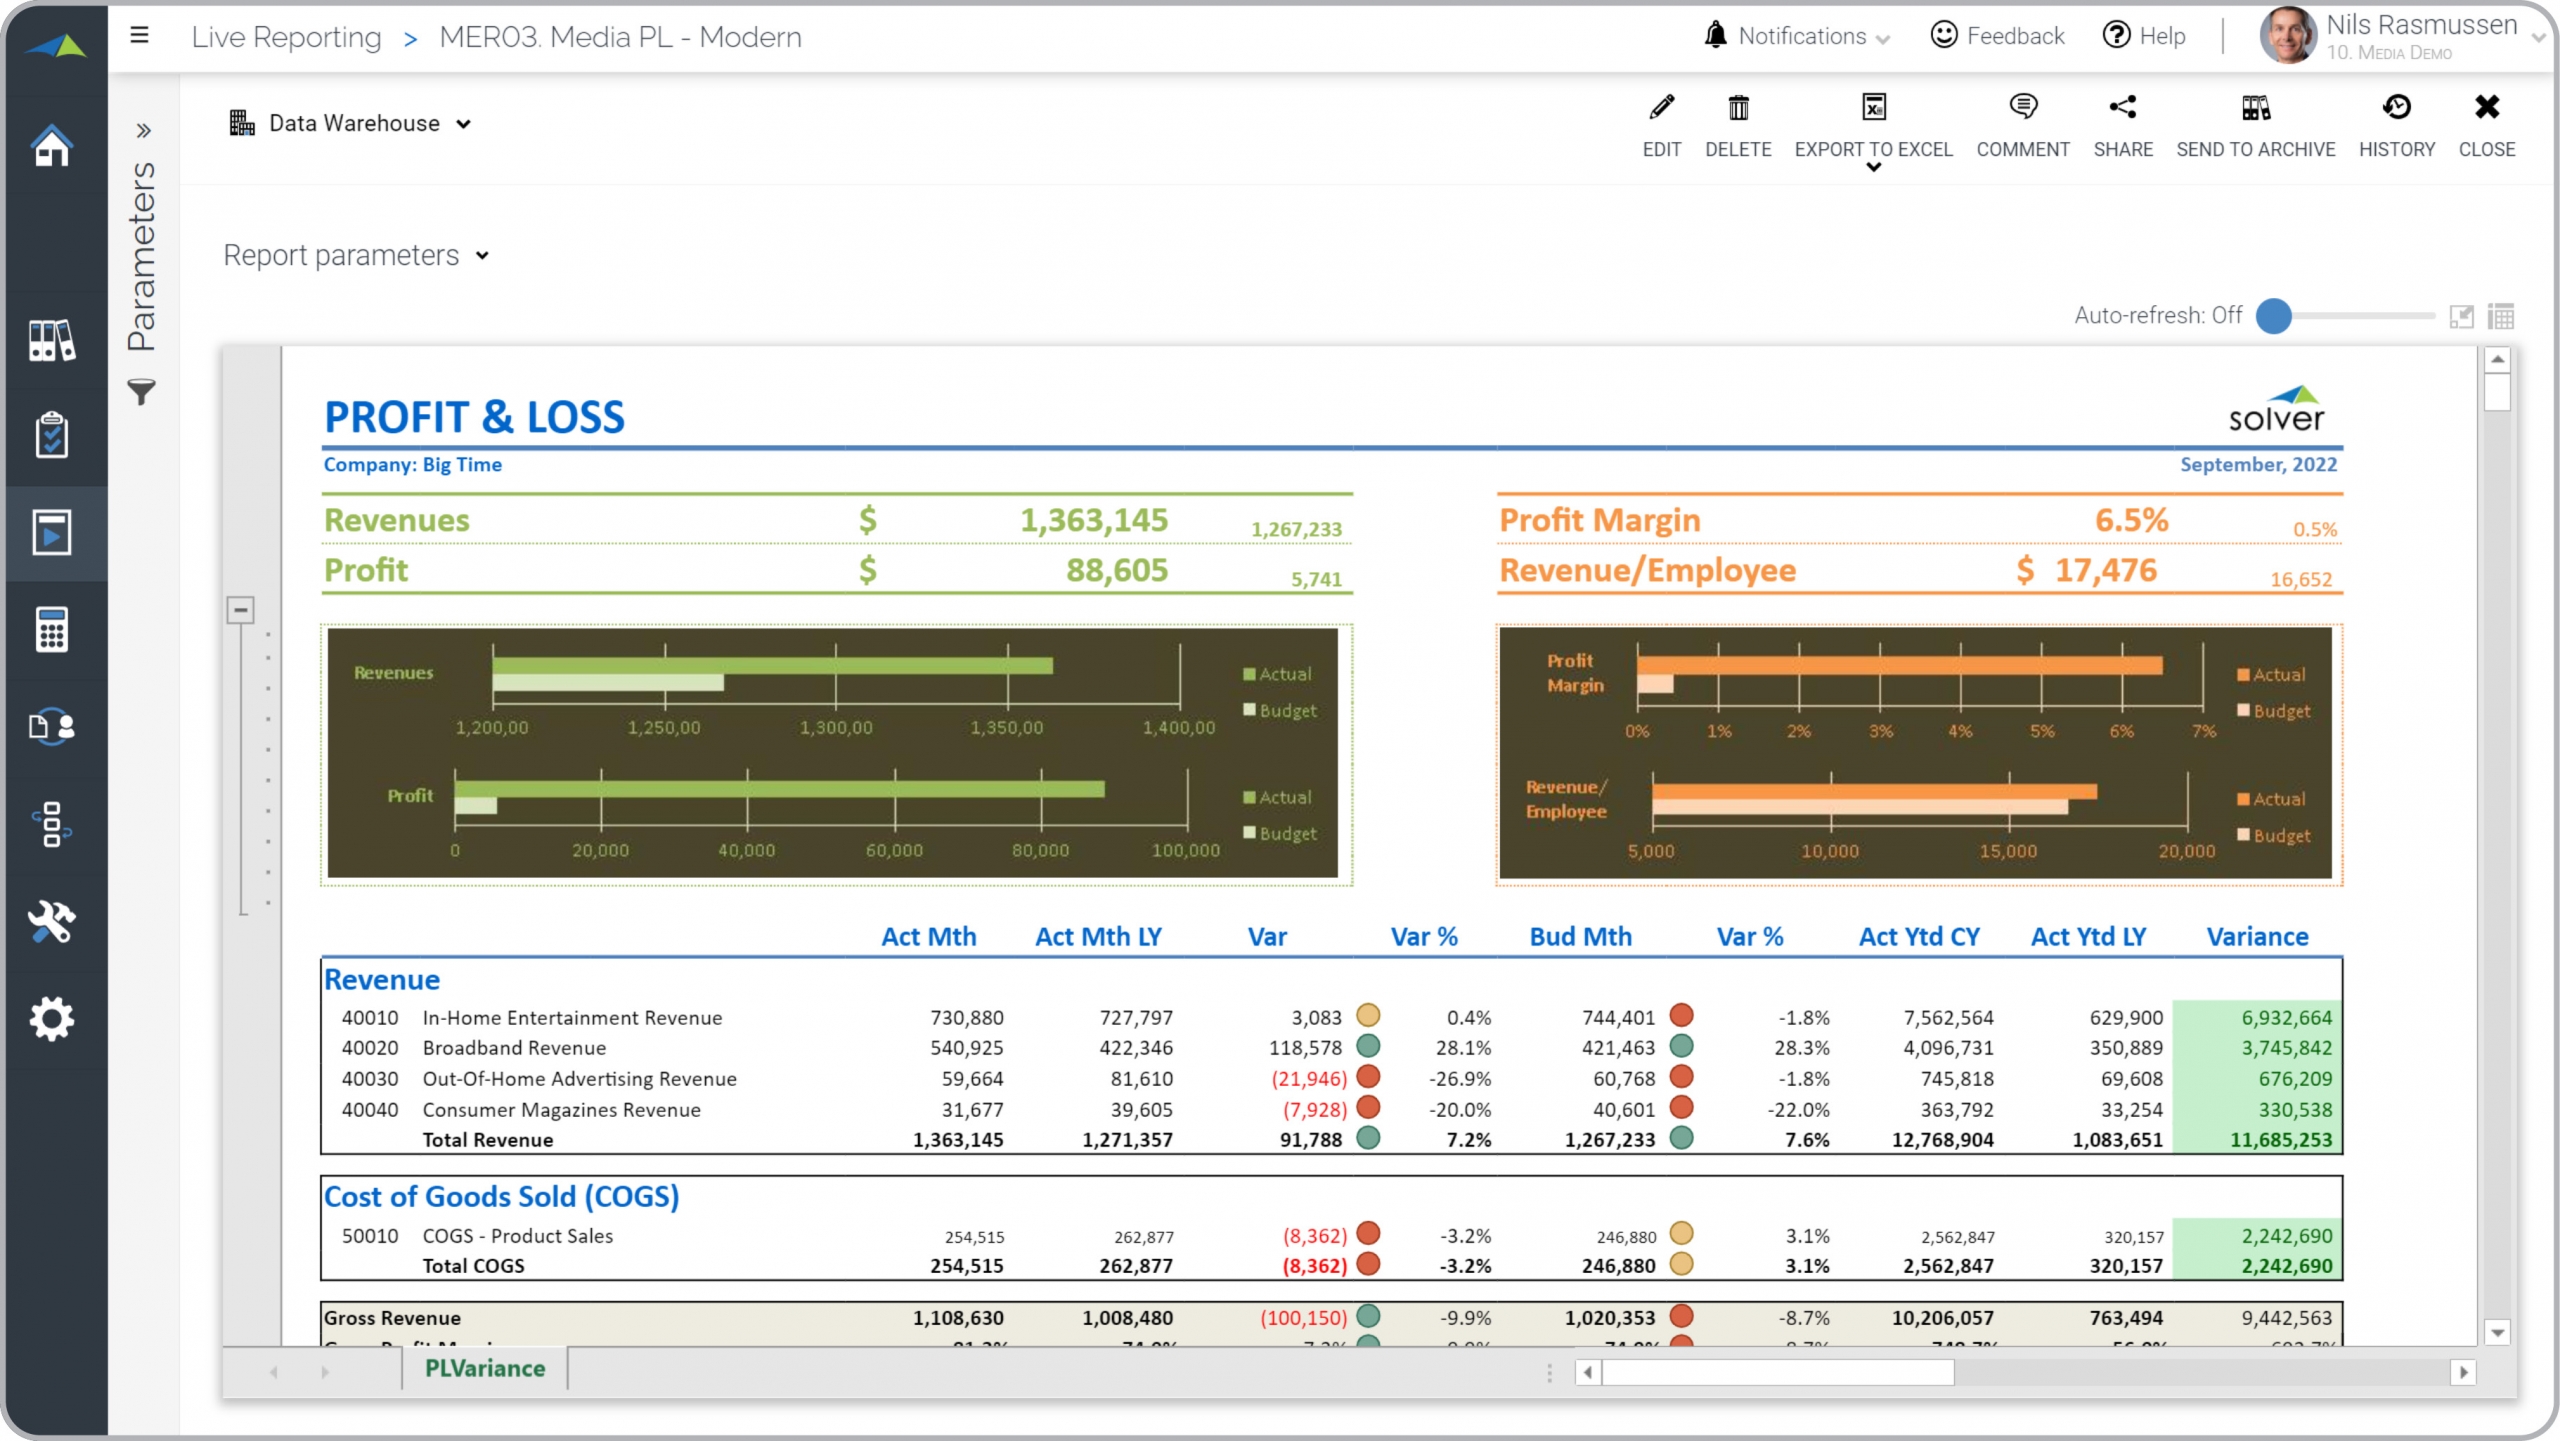
Health – P&L Variance with KPIs
P&L variance report with last 3 years of KPIs displayed at the bottom.
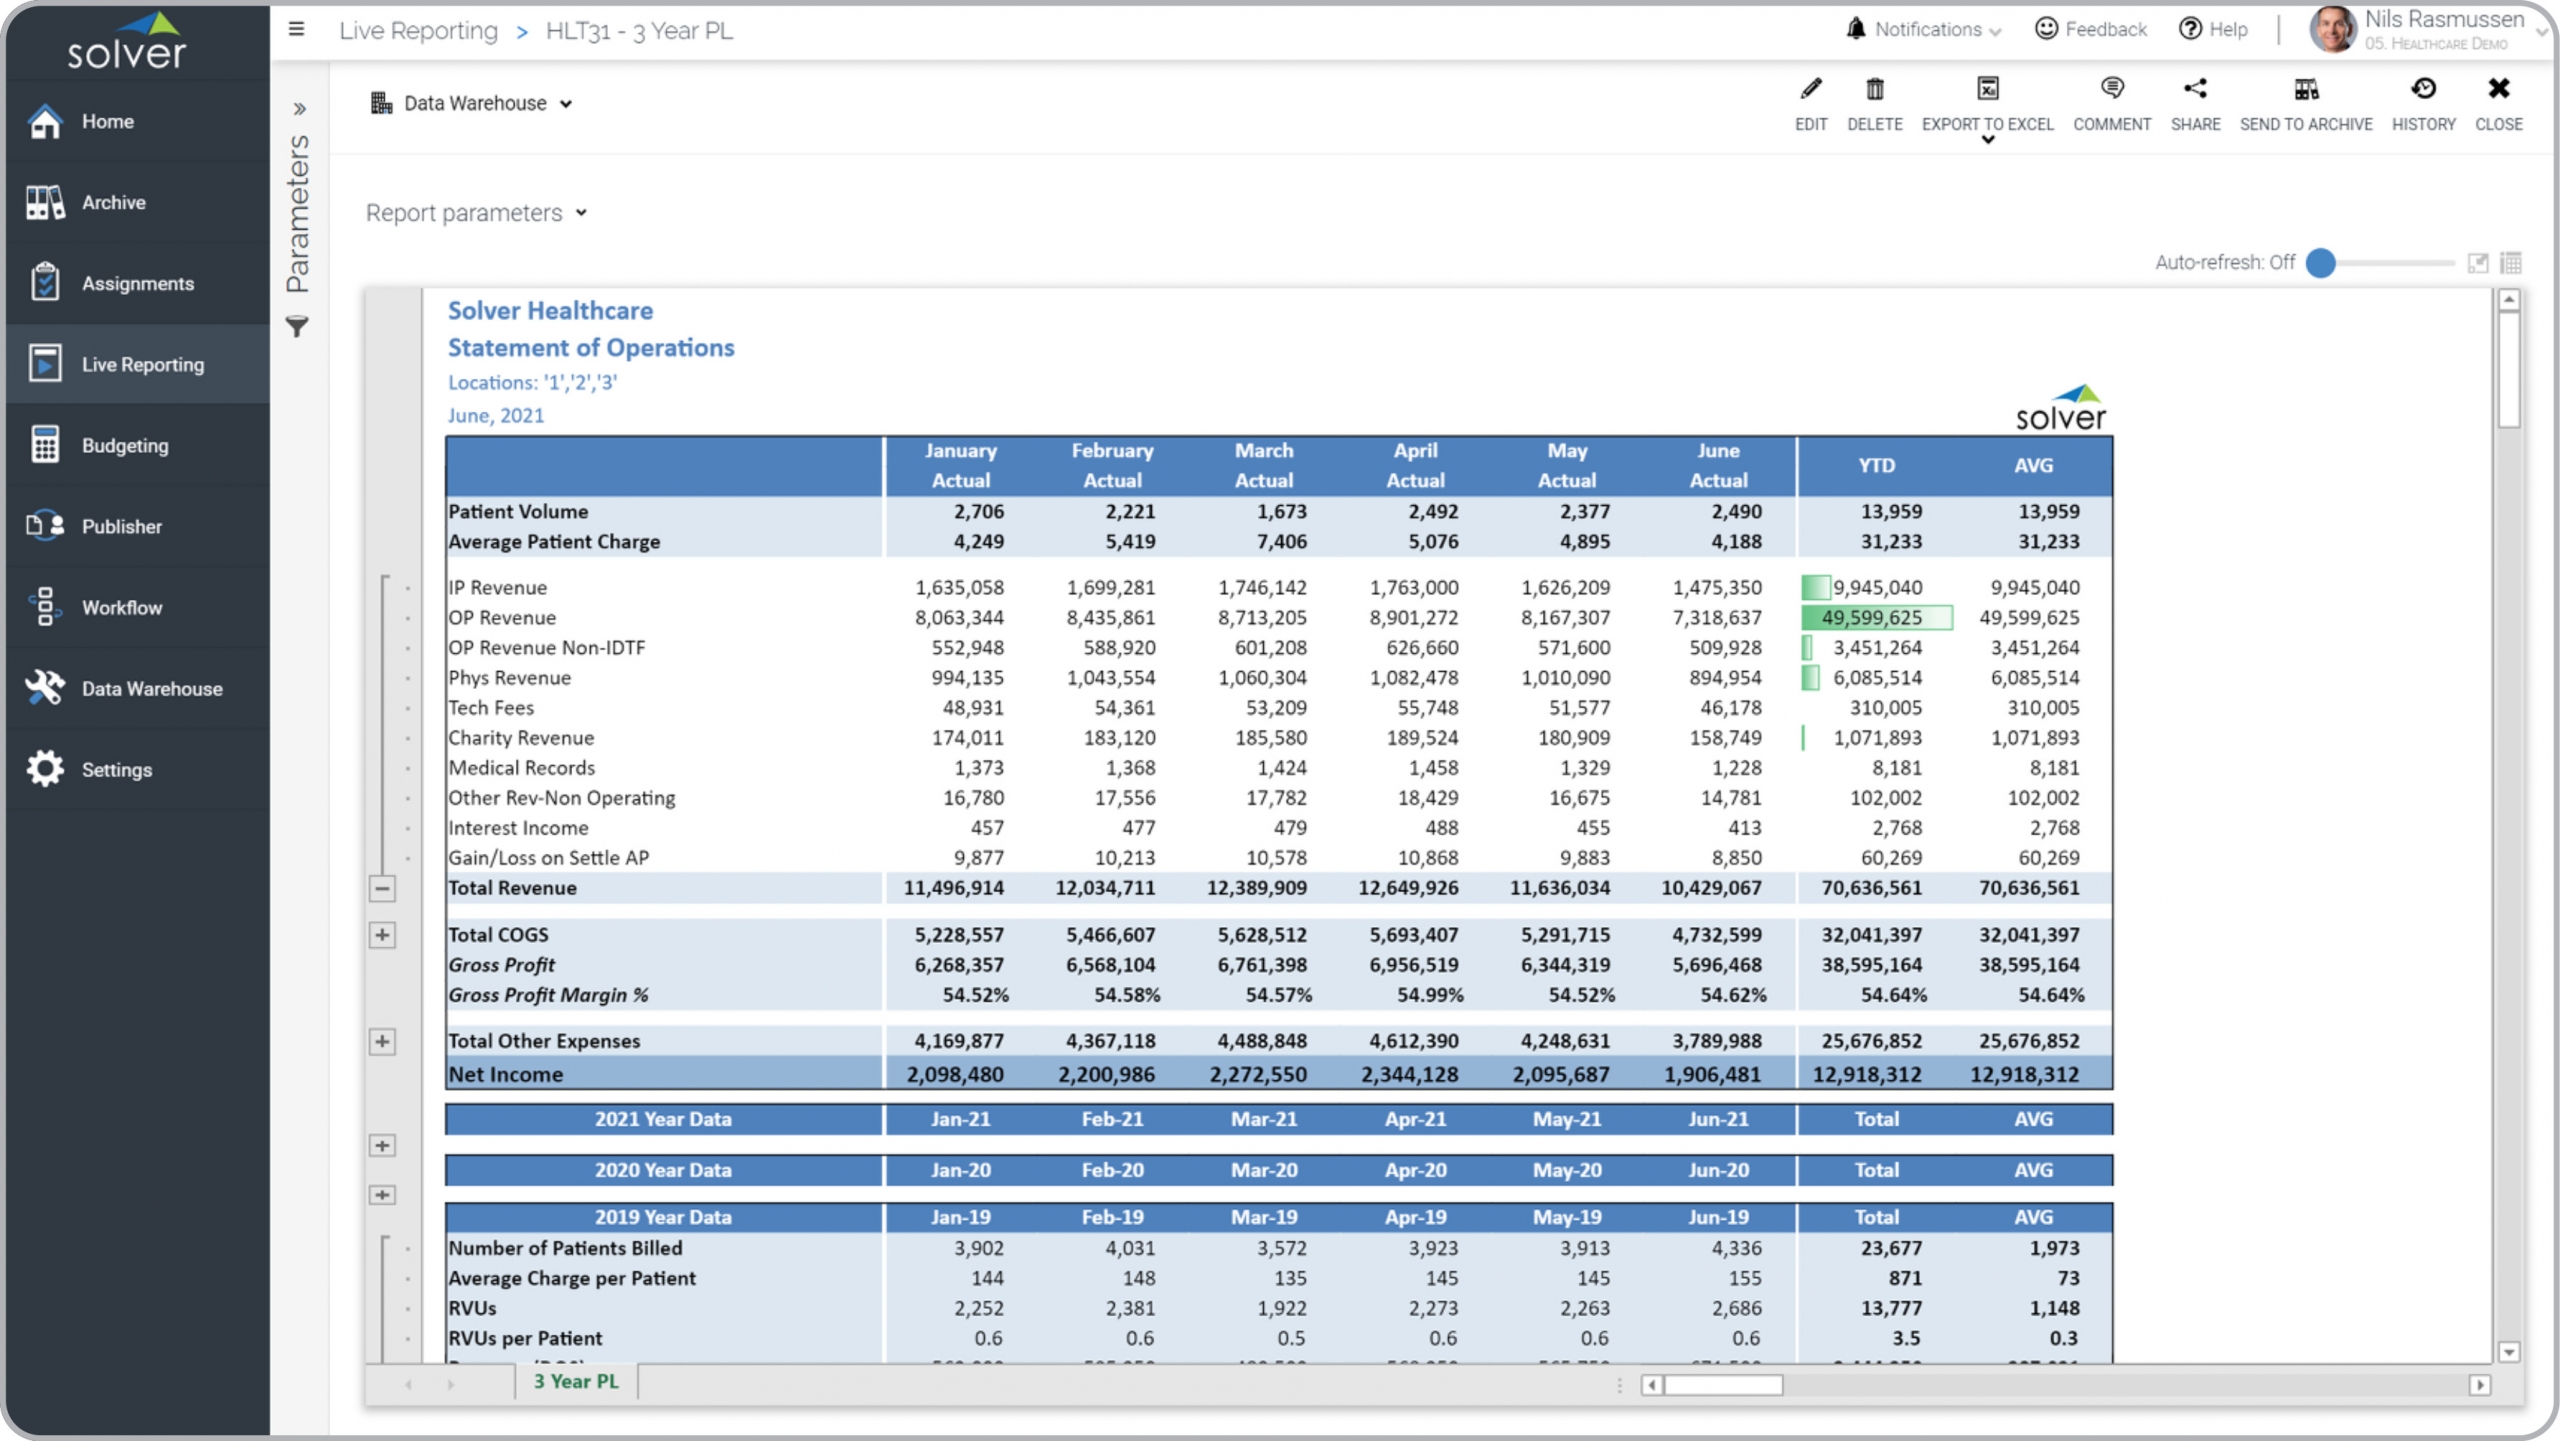
Health – 3 Year Profit & Loss with KPIs
P&L report by clinic with monthly figures across columns with YTD, average and KPIs.
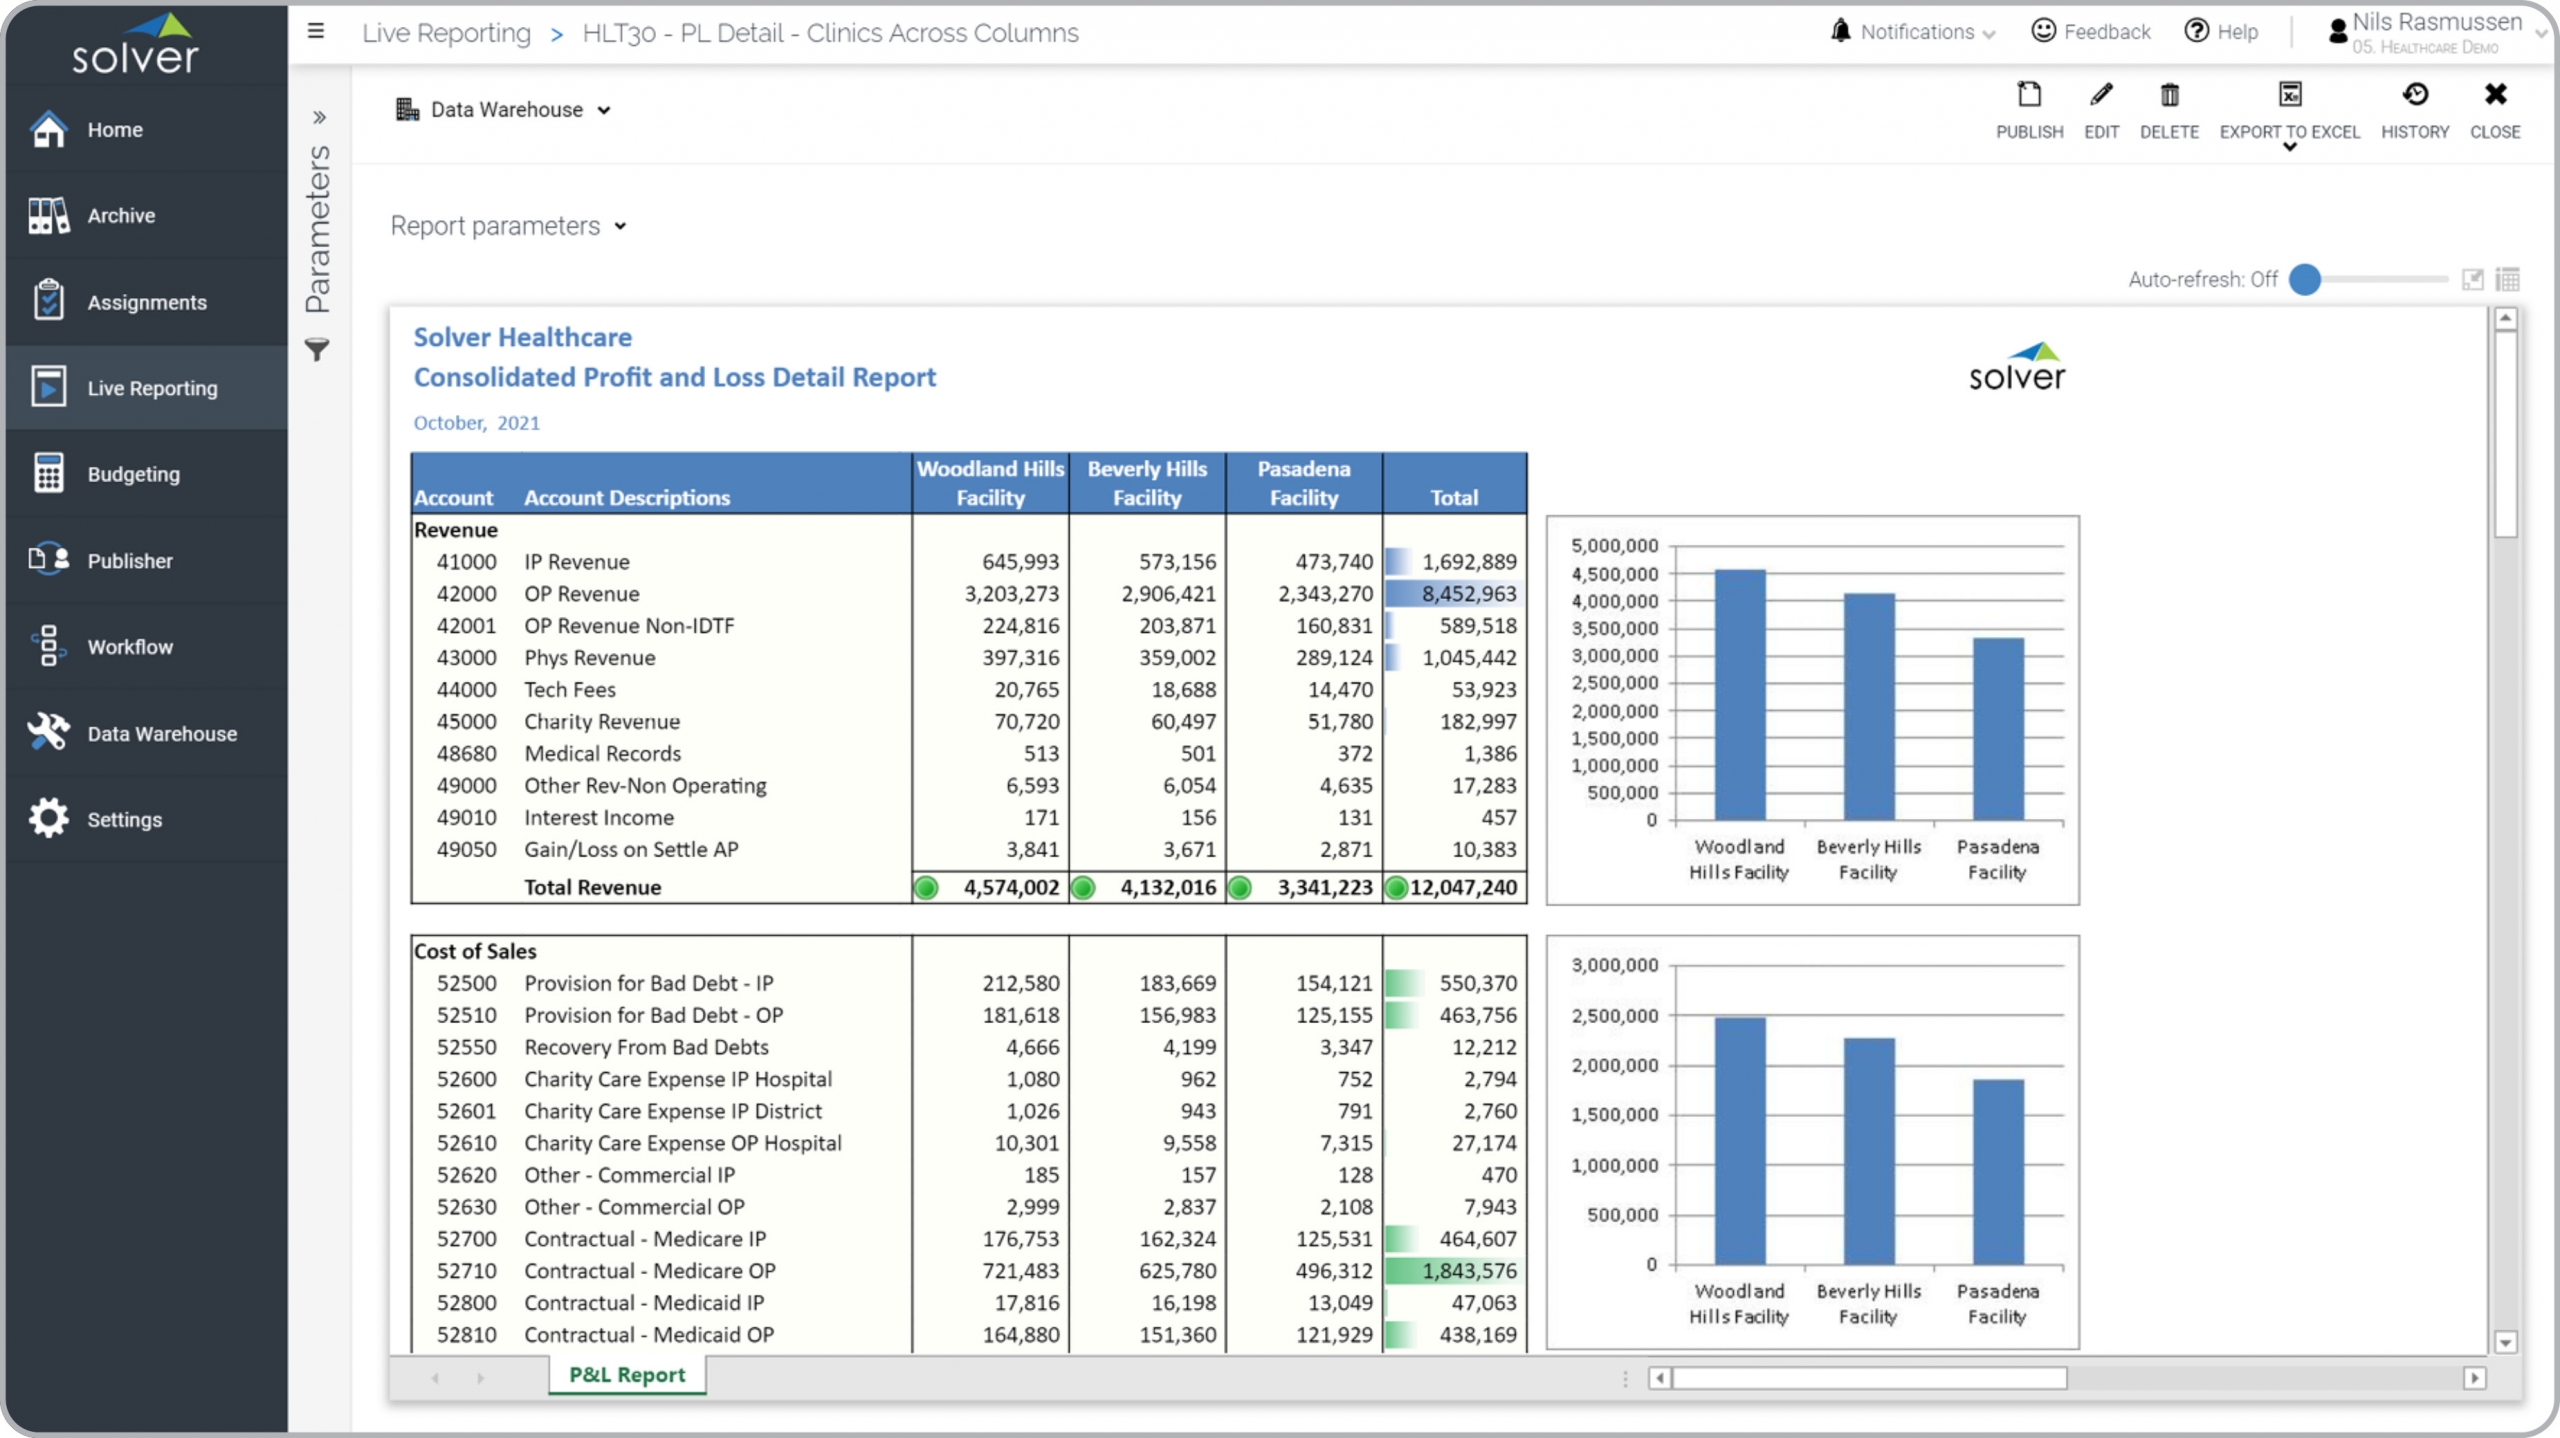
Health – Profit & Loss with Clinics
P&L report with clinics across the columns and a consolidated total.
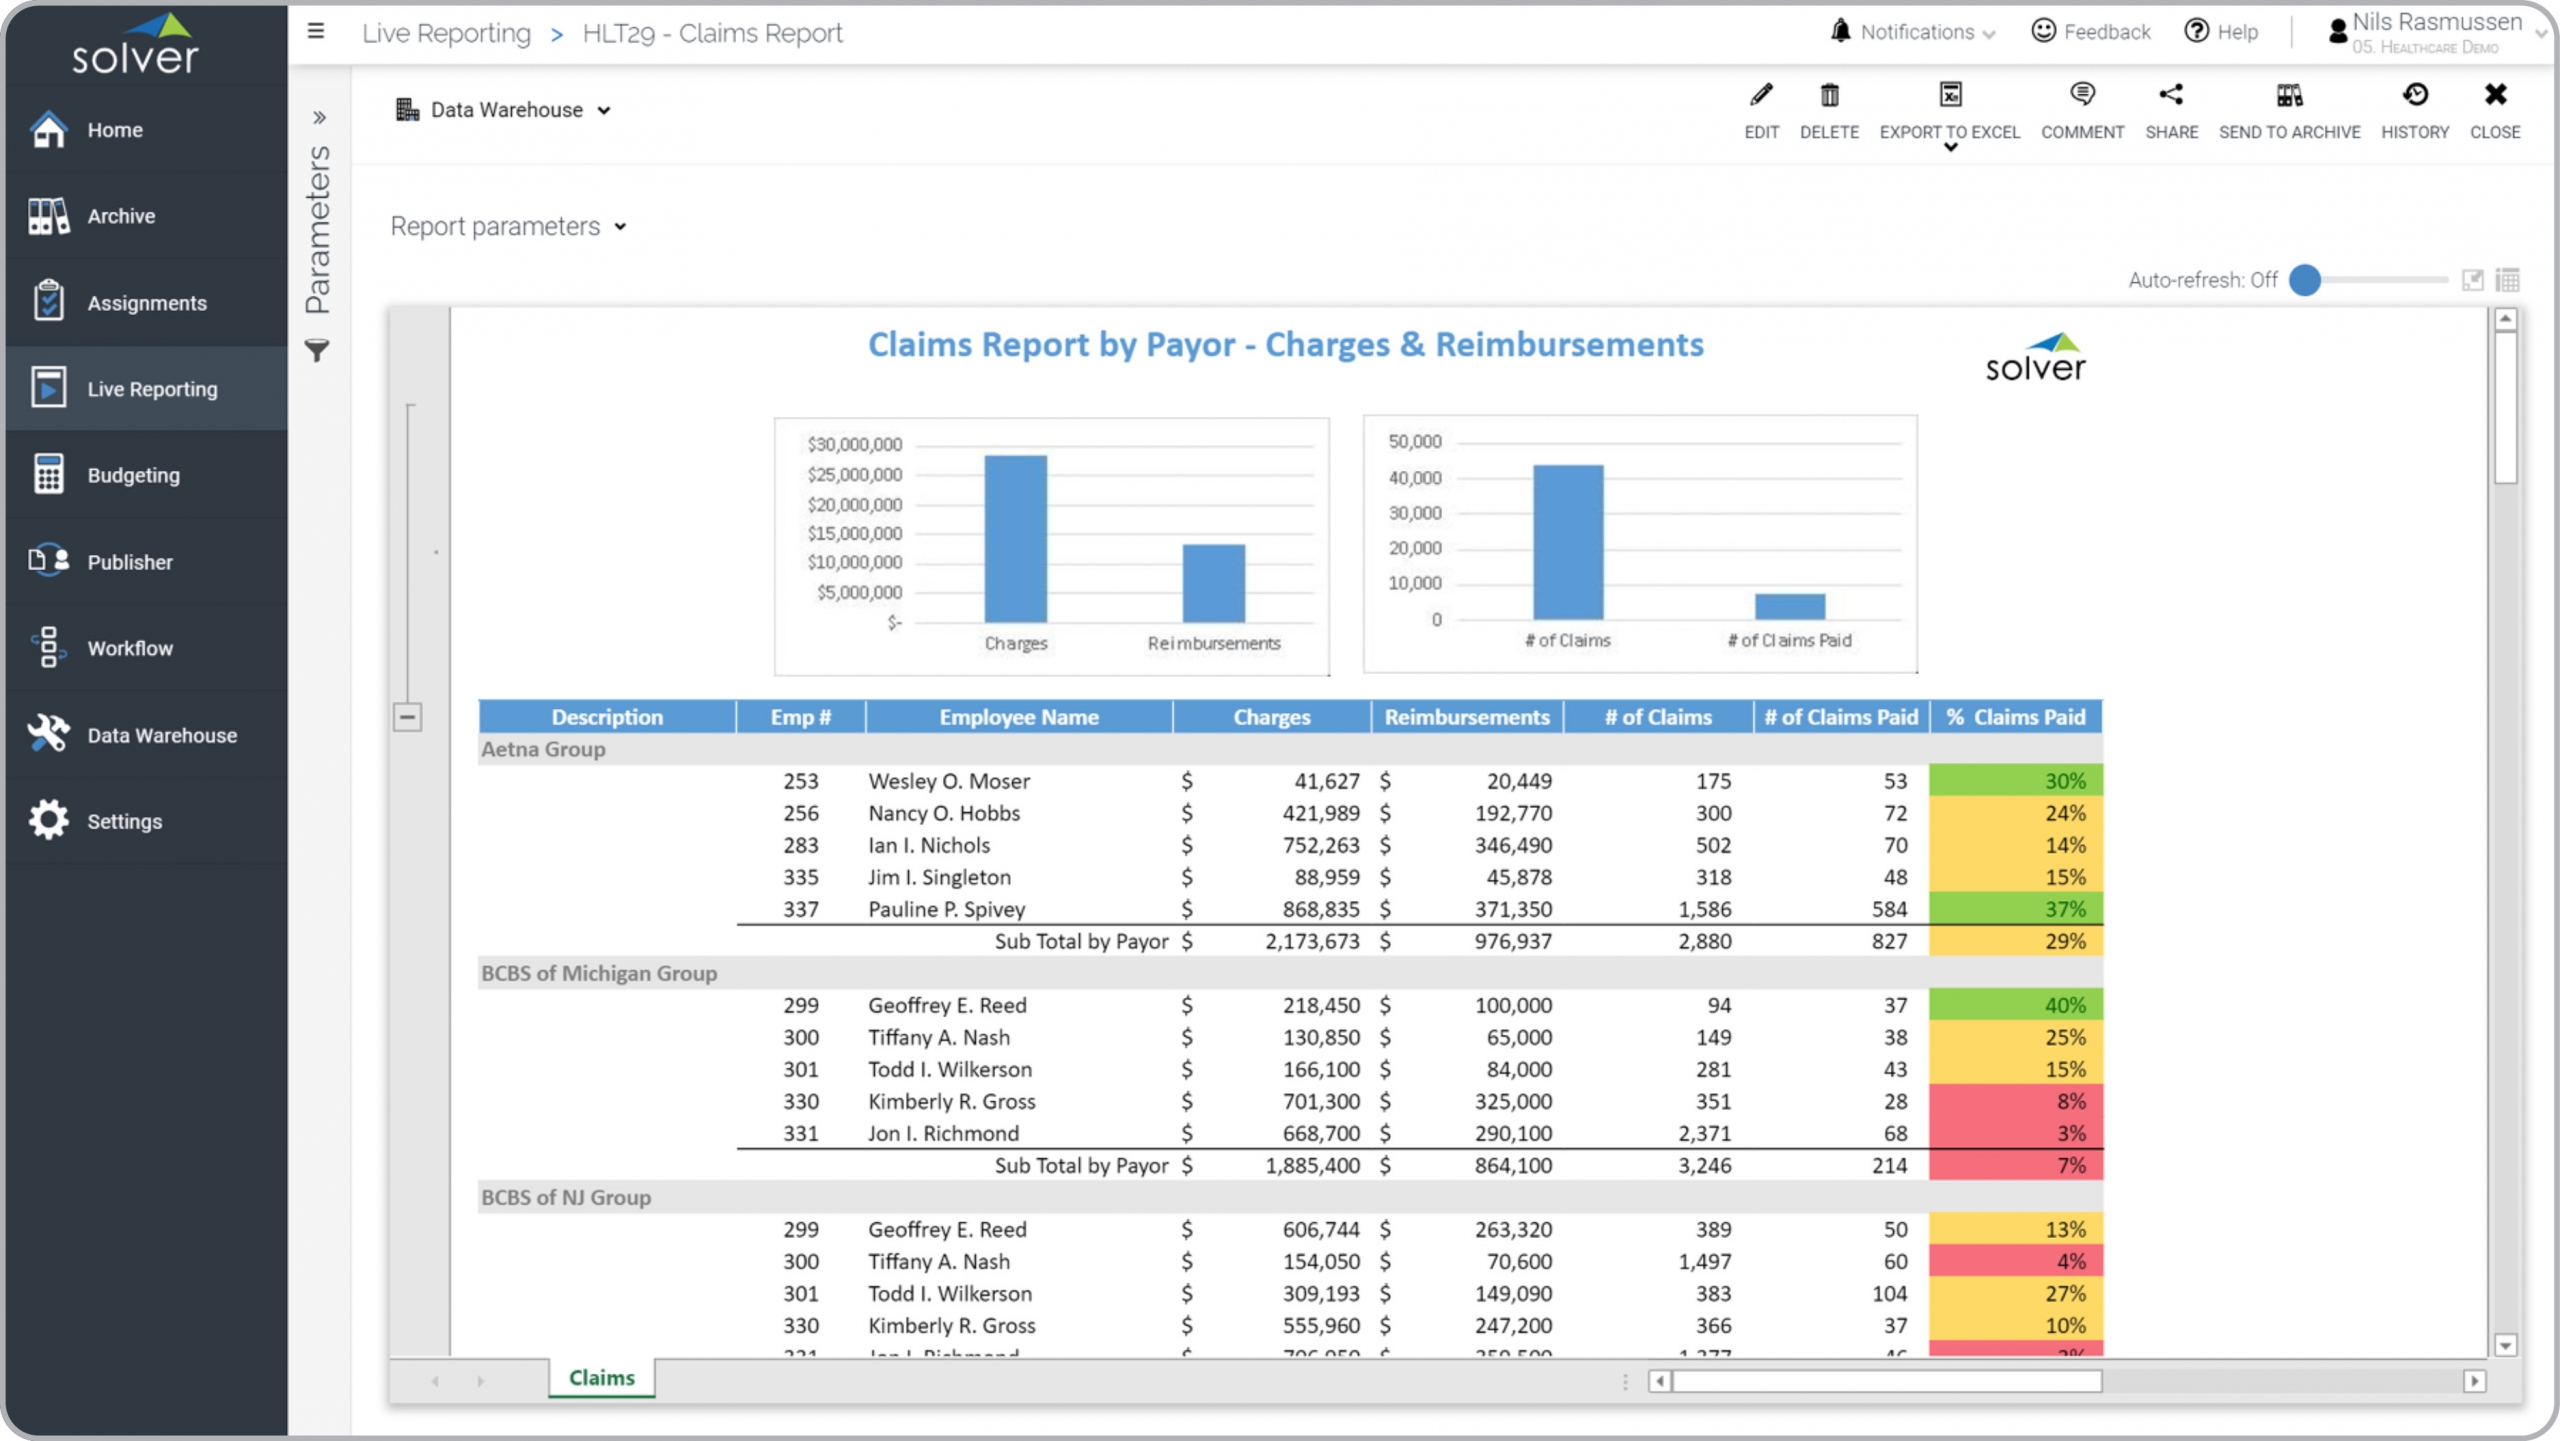
Health – Claims by Payor
Shows charges, reimbursements and claims by payor (insurance company).
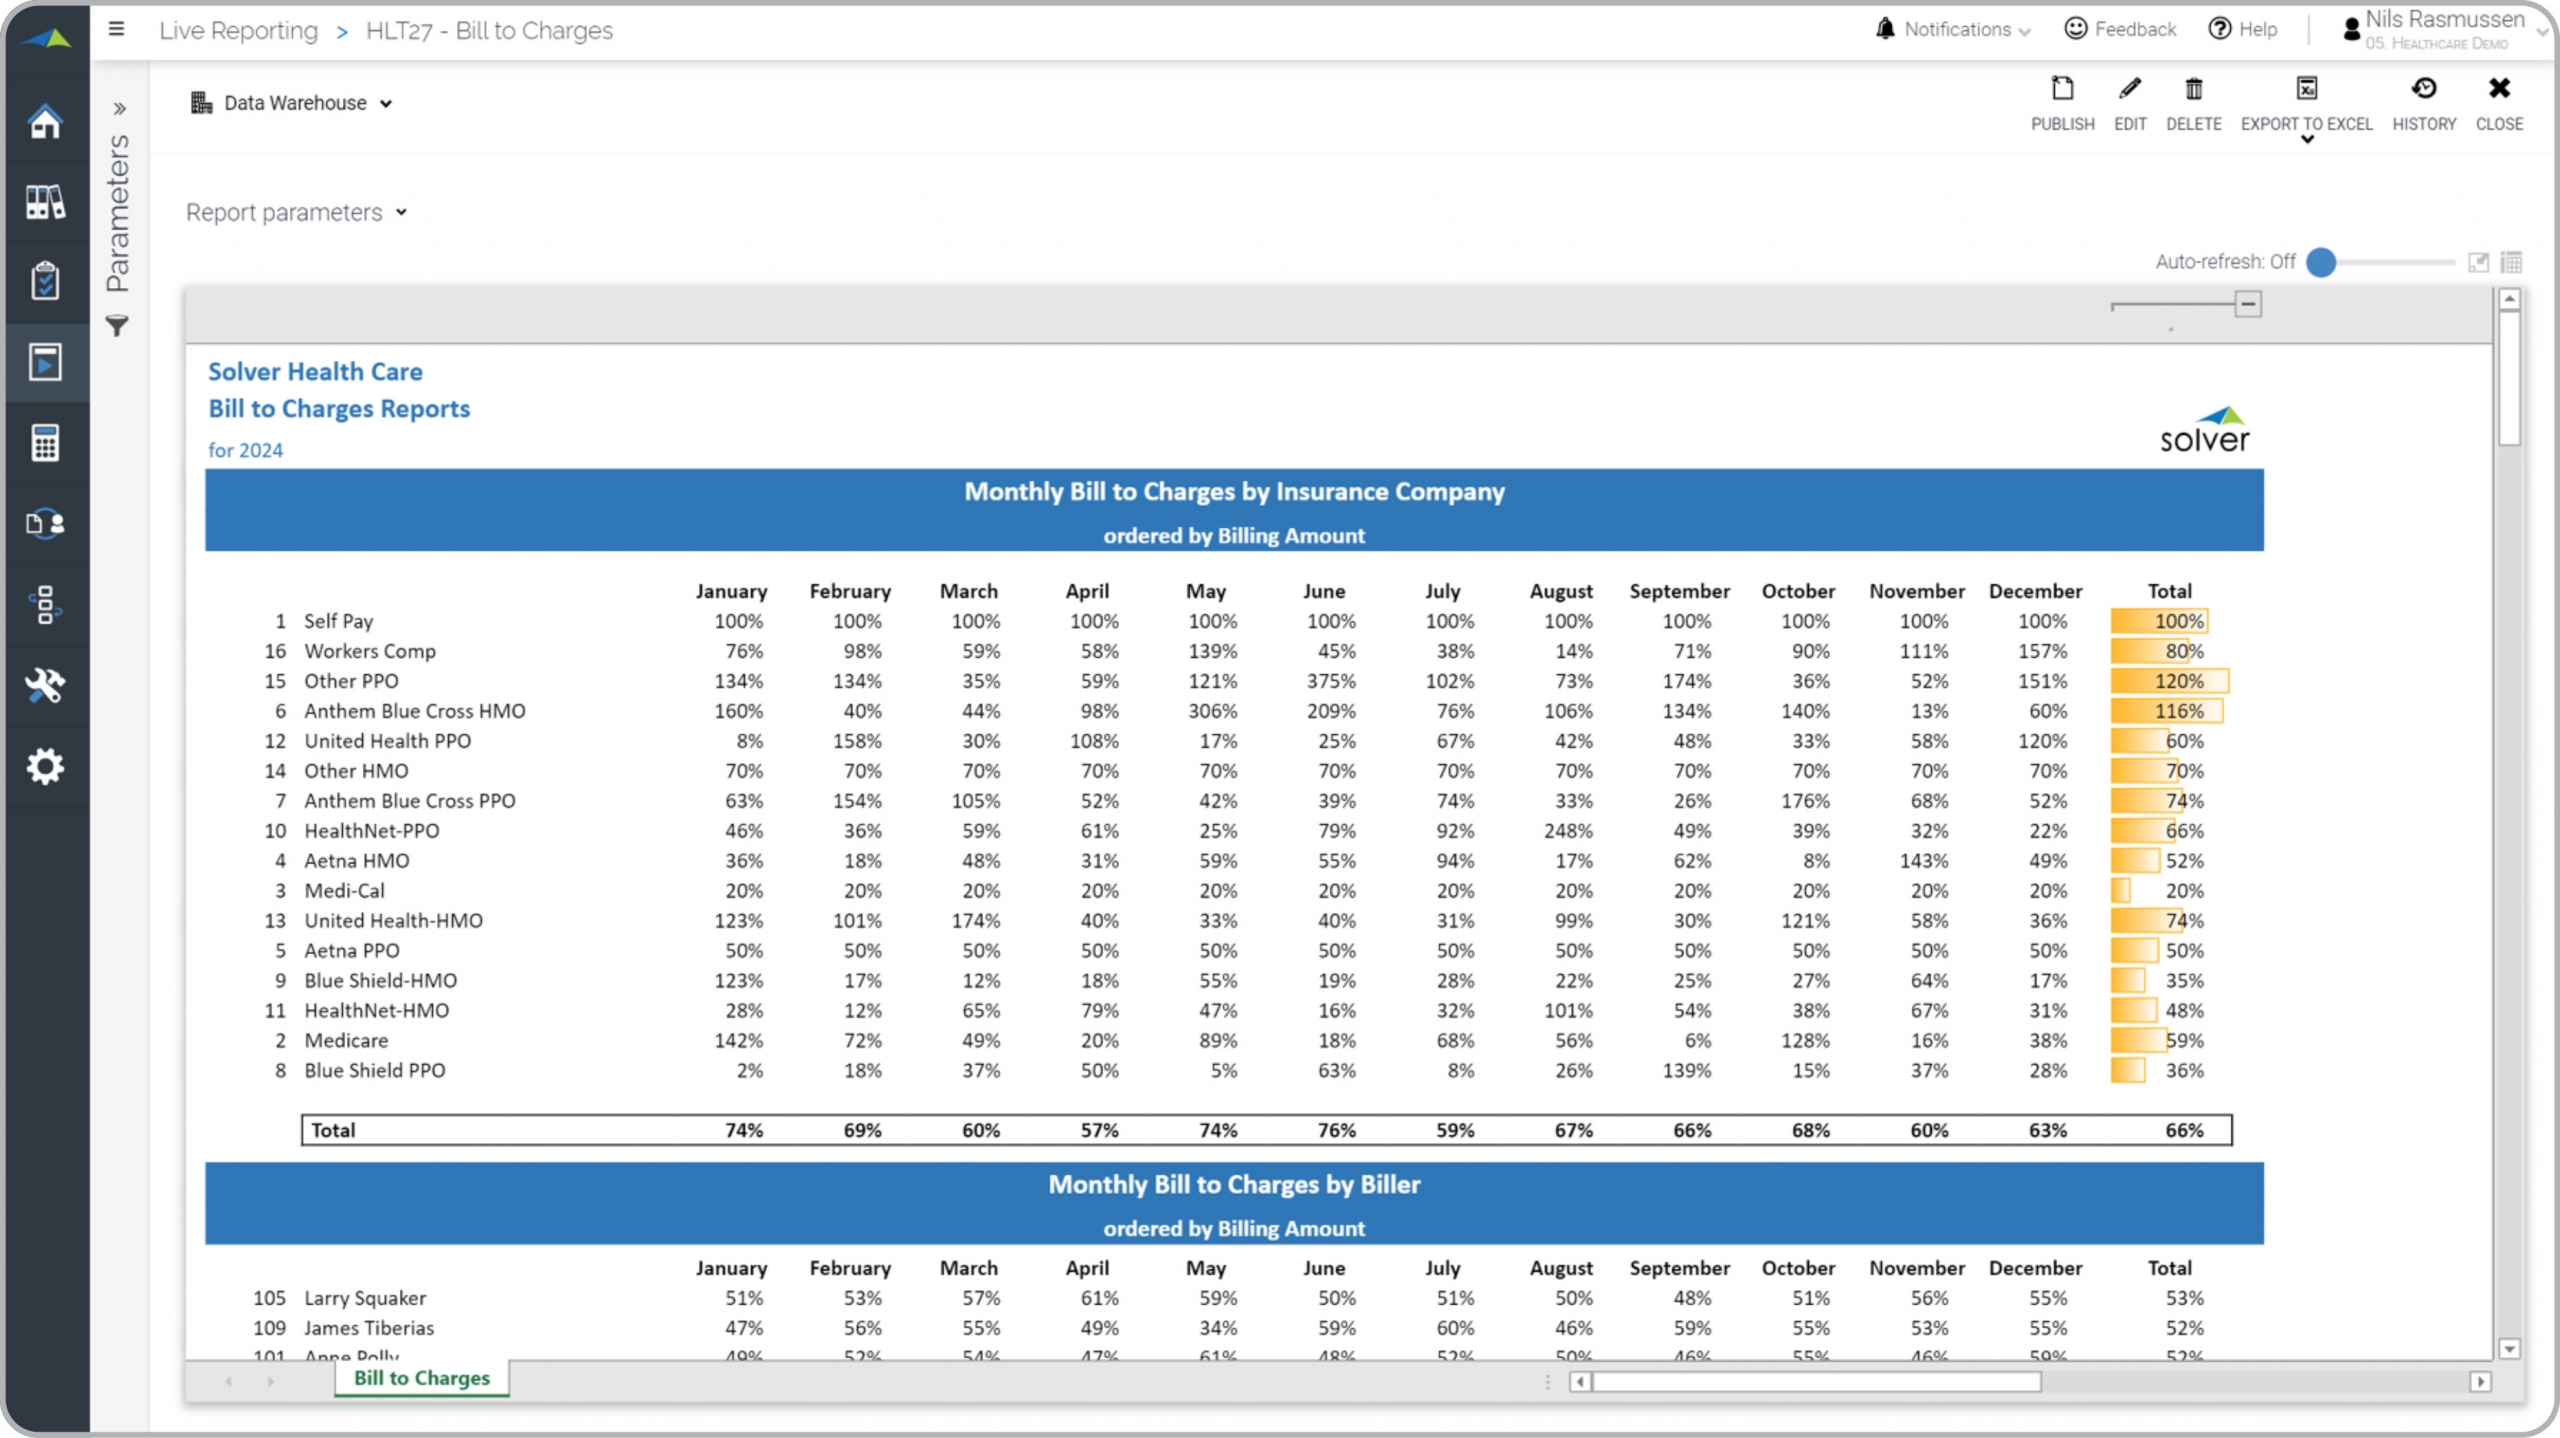
Health – Bill to Charges
View Bill To charges by insurance company, biller, physician and revenue group.
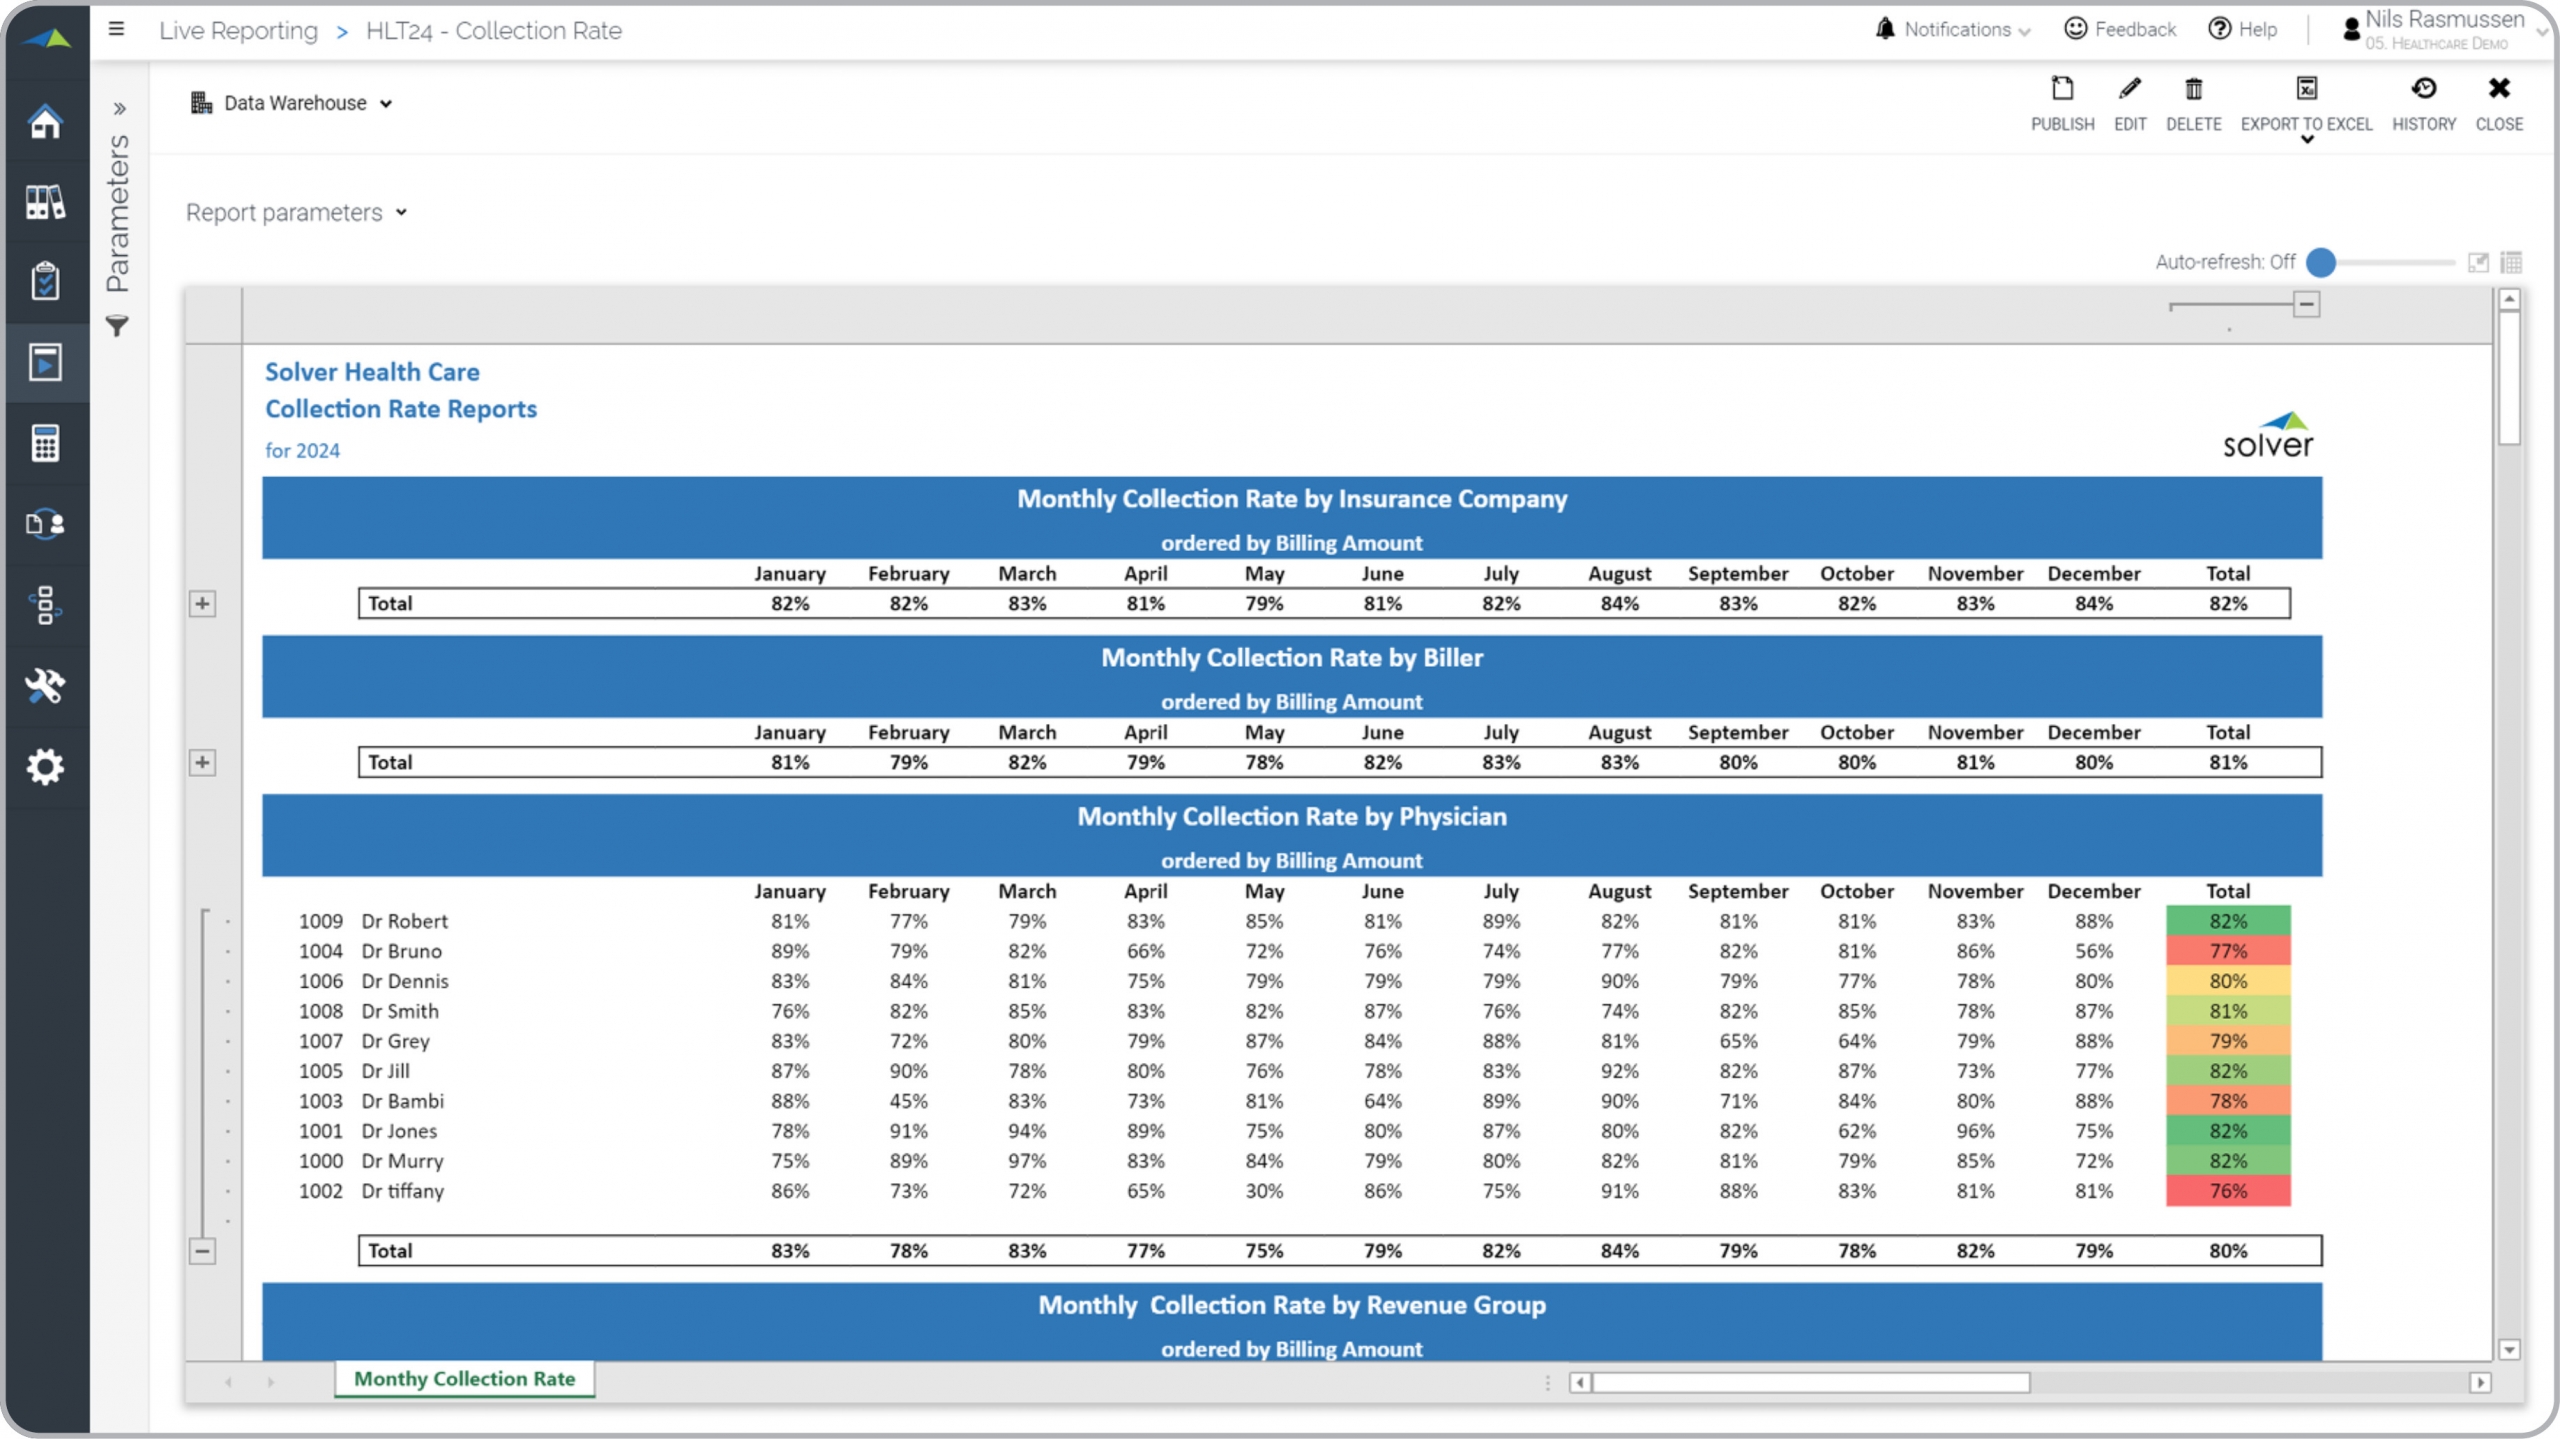
Health – Collection Rate
Analyze monthly collection rates (%) by insurance company, biller, physician and revenue group.
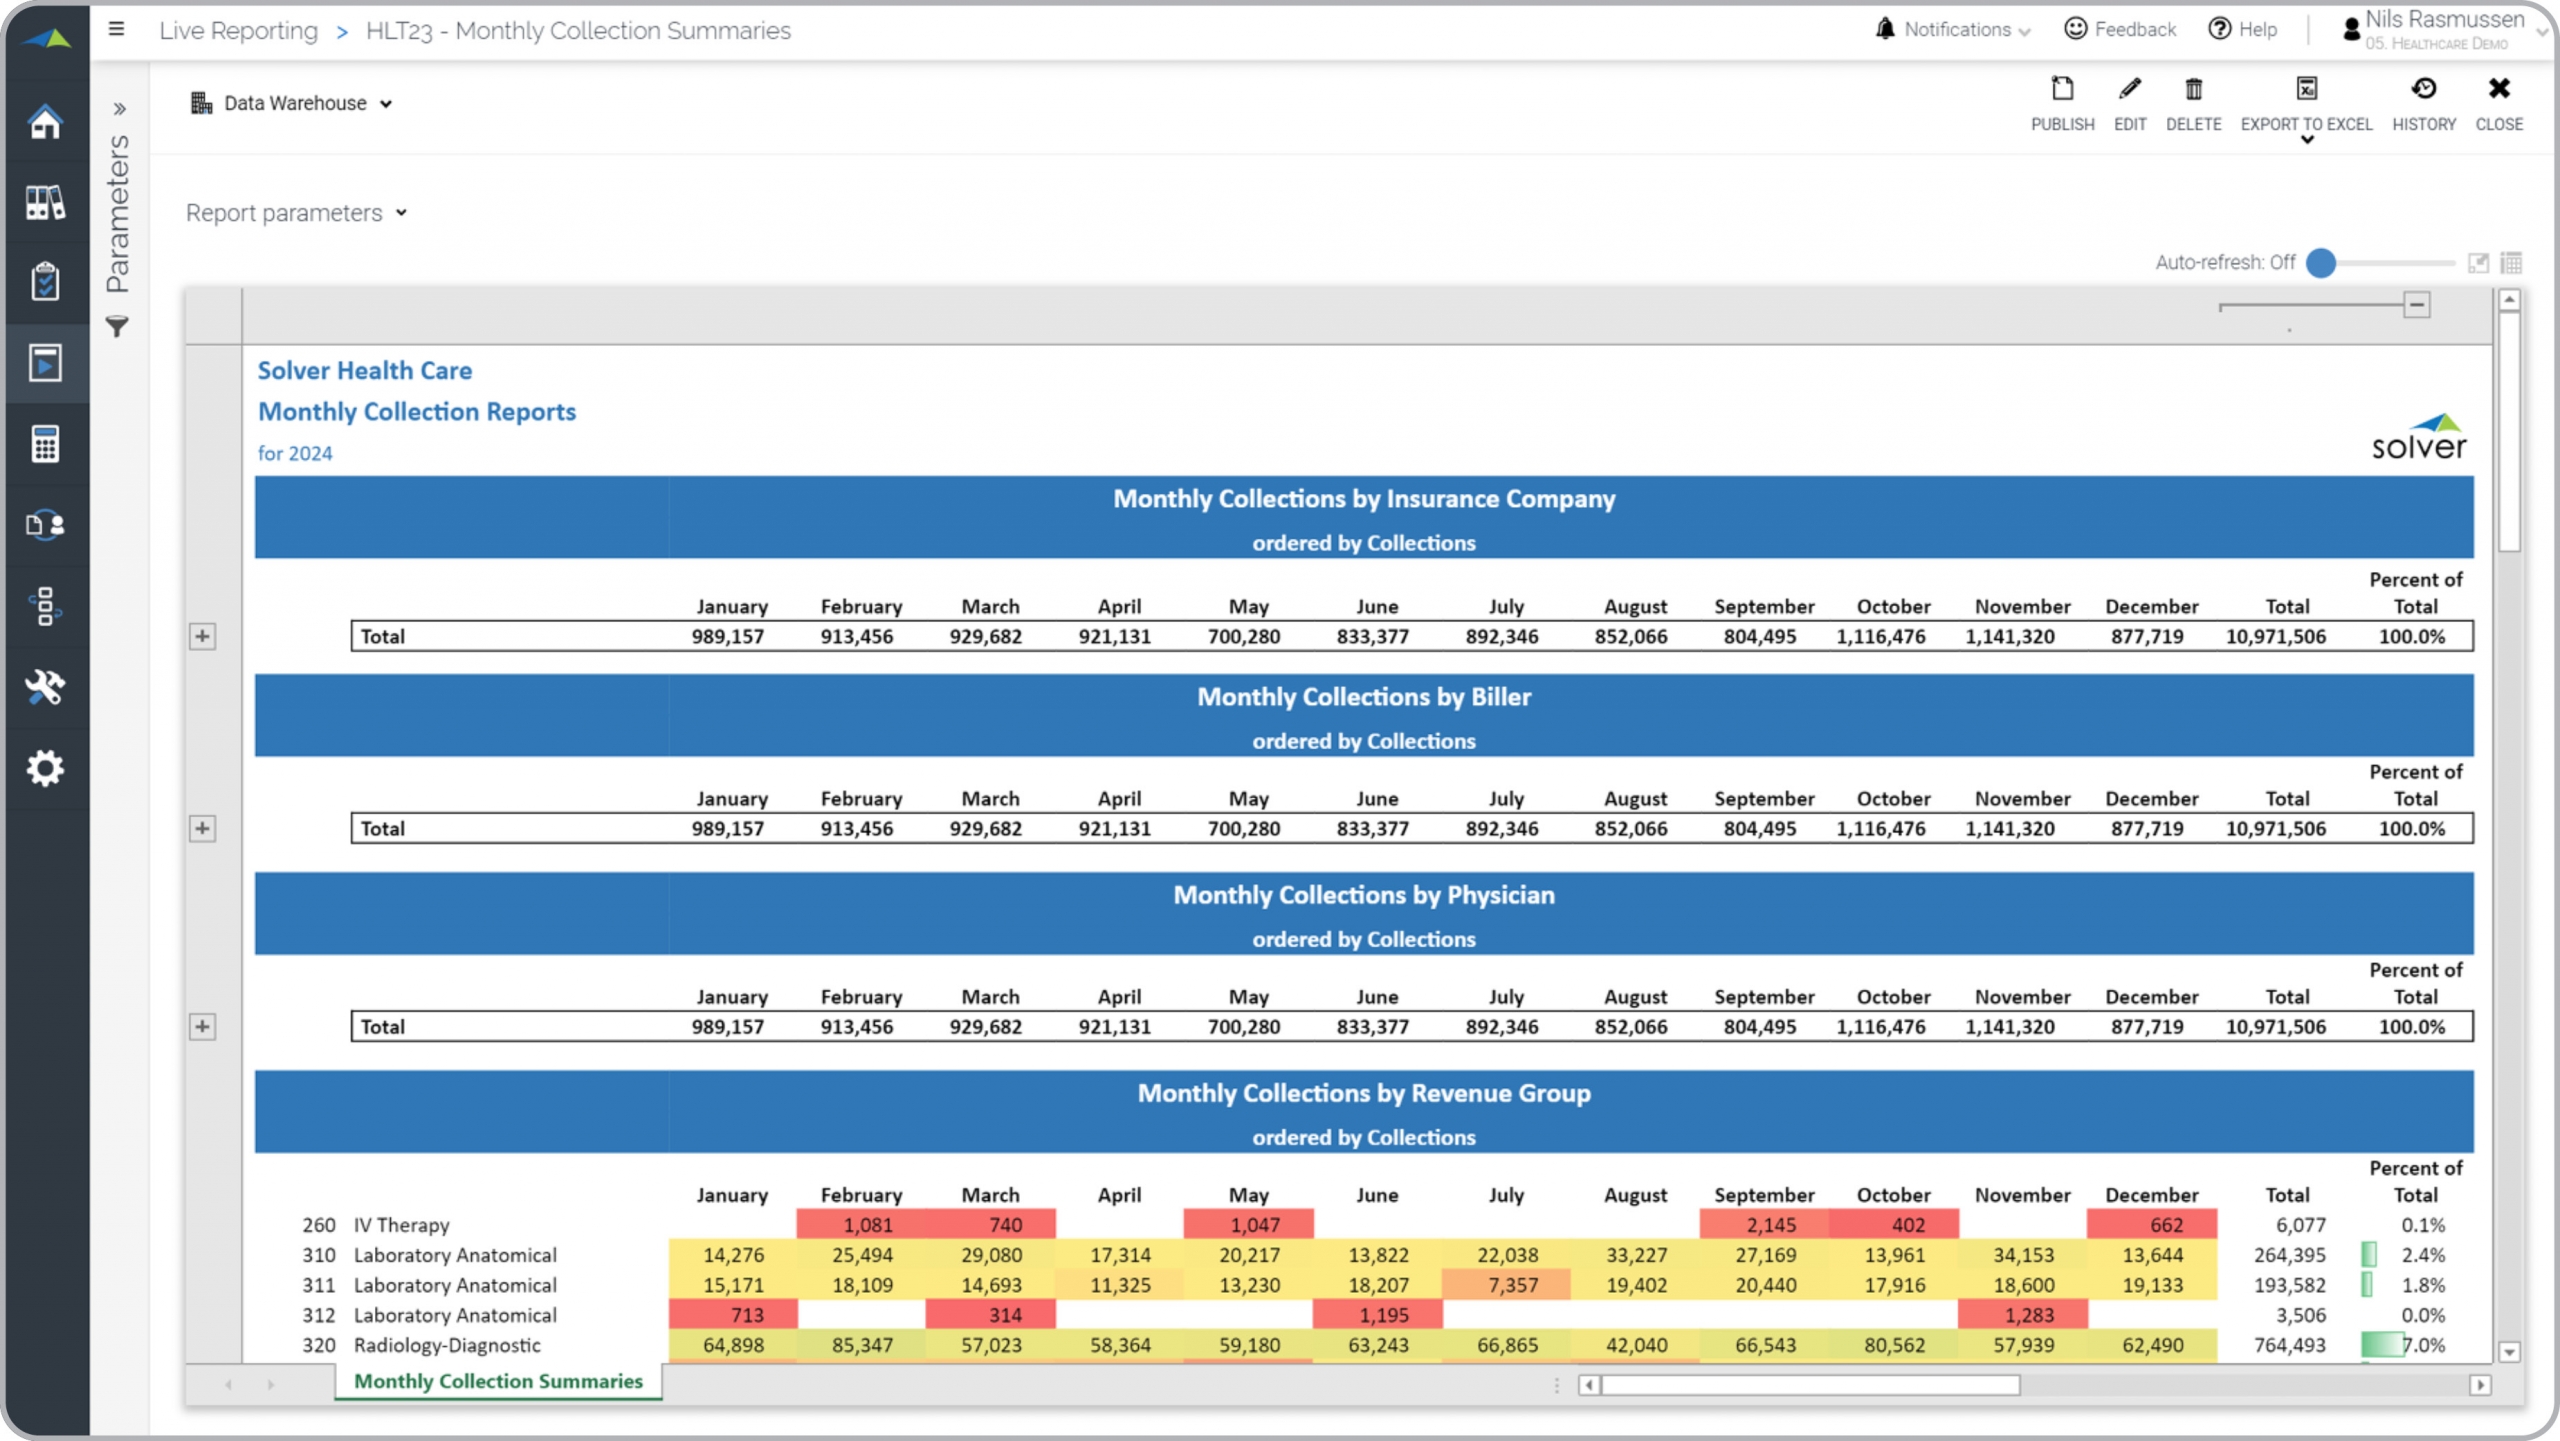
Health – Monthly Collection Summaries
Monthly trends in collections by insurance company, biller, physician and revenue group.
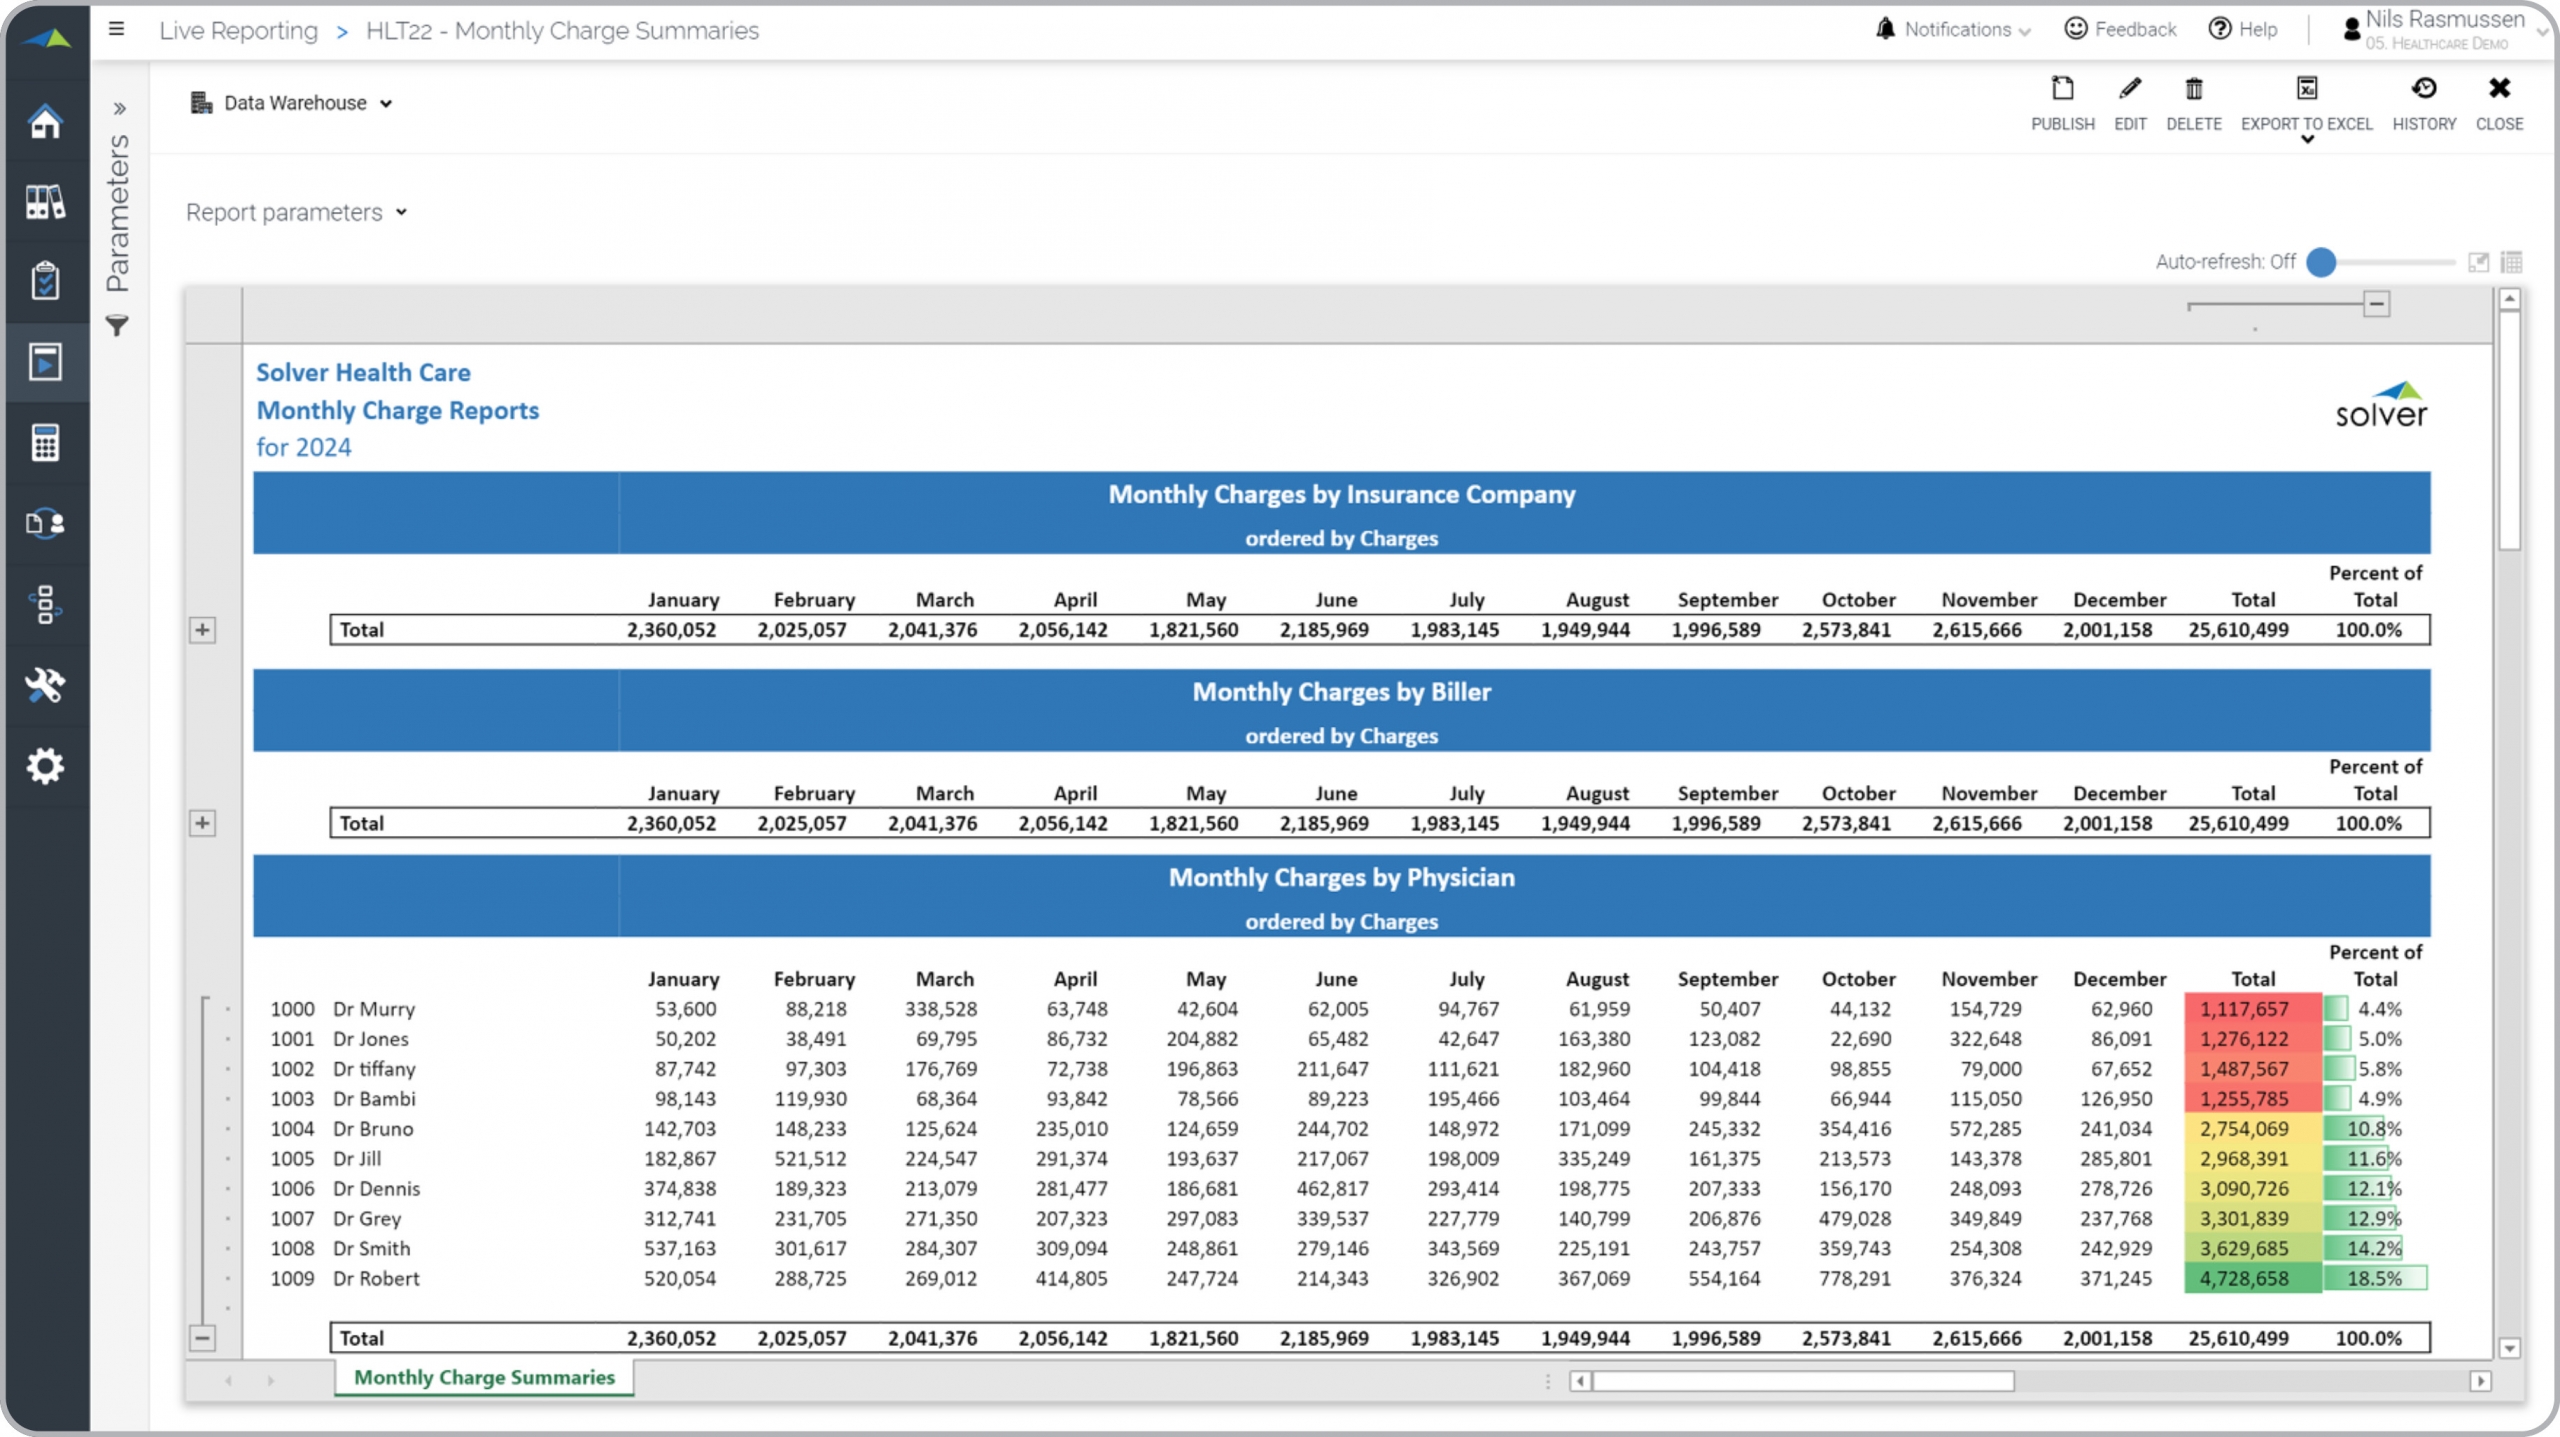
Health – Monthly Charge Summaries
Monthly trends in collections by insurance company, biller, physician and revenue group.

Health – Monthly Group Summaries
Analyze month-by-month trends in revenue billings and charges.
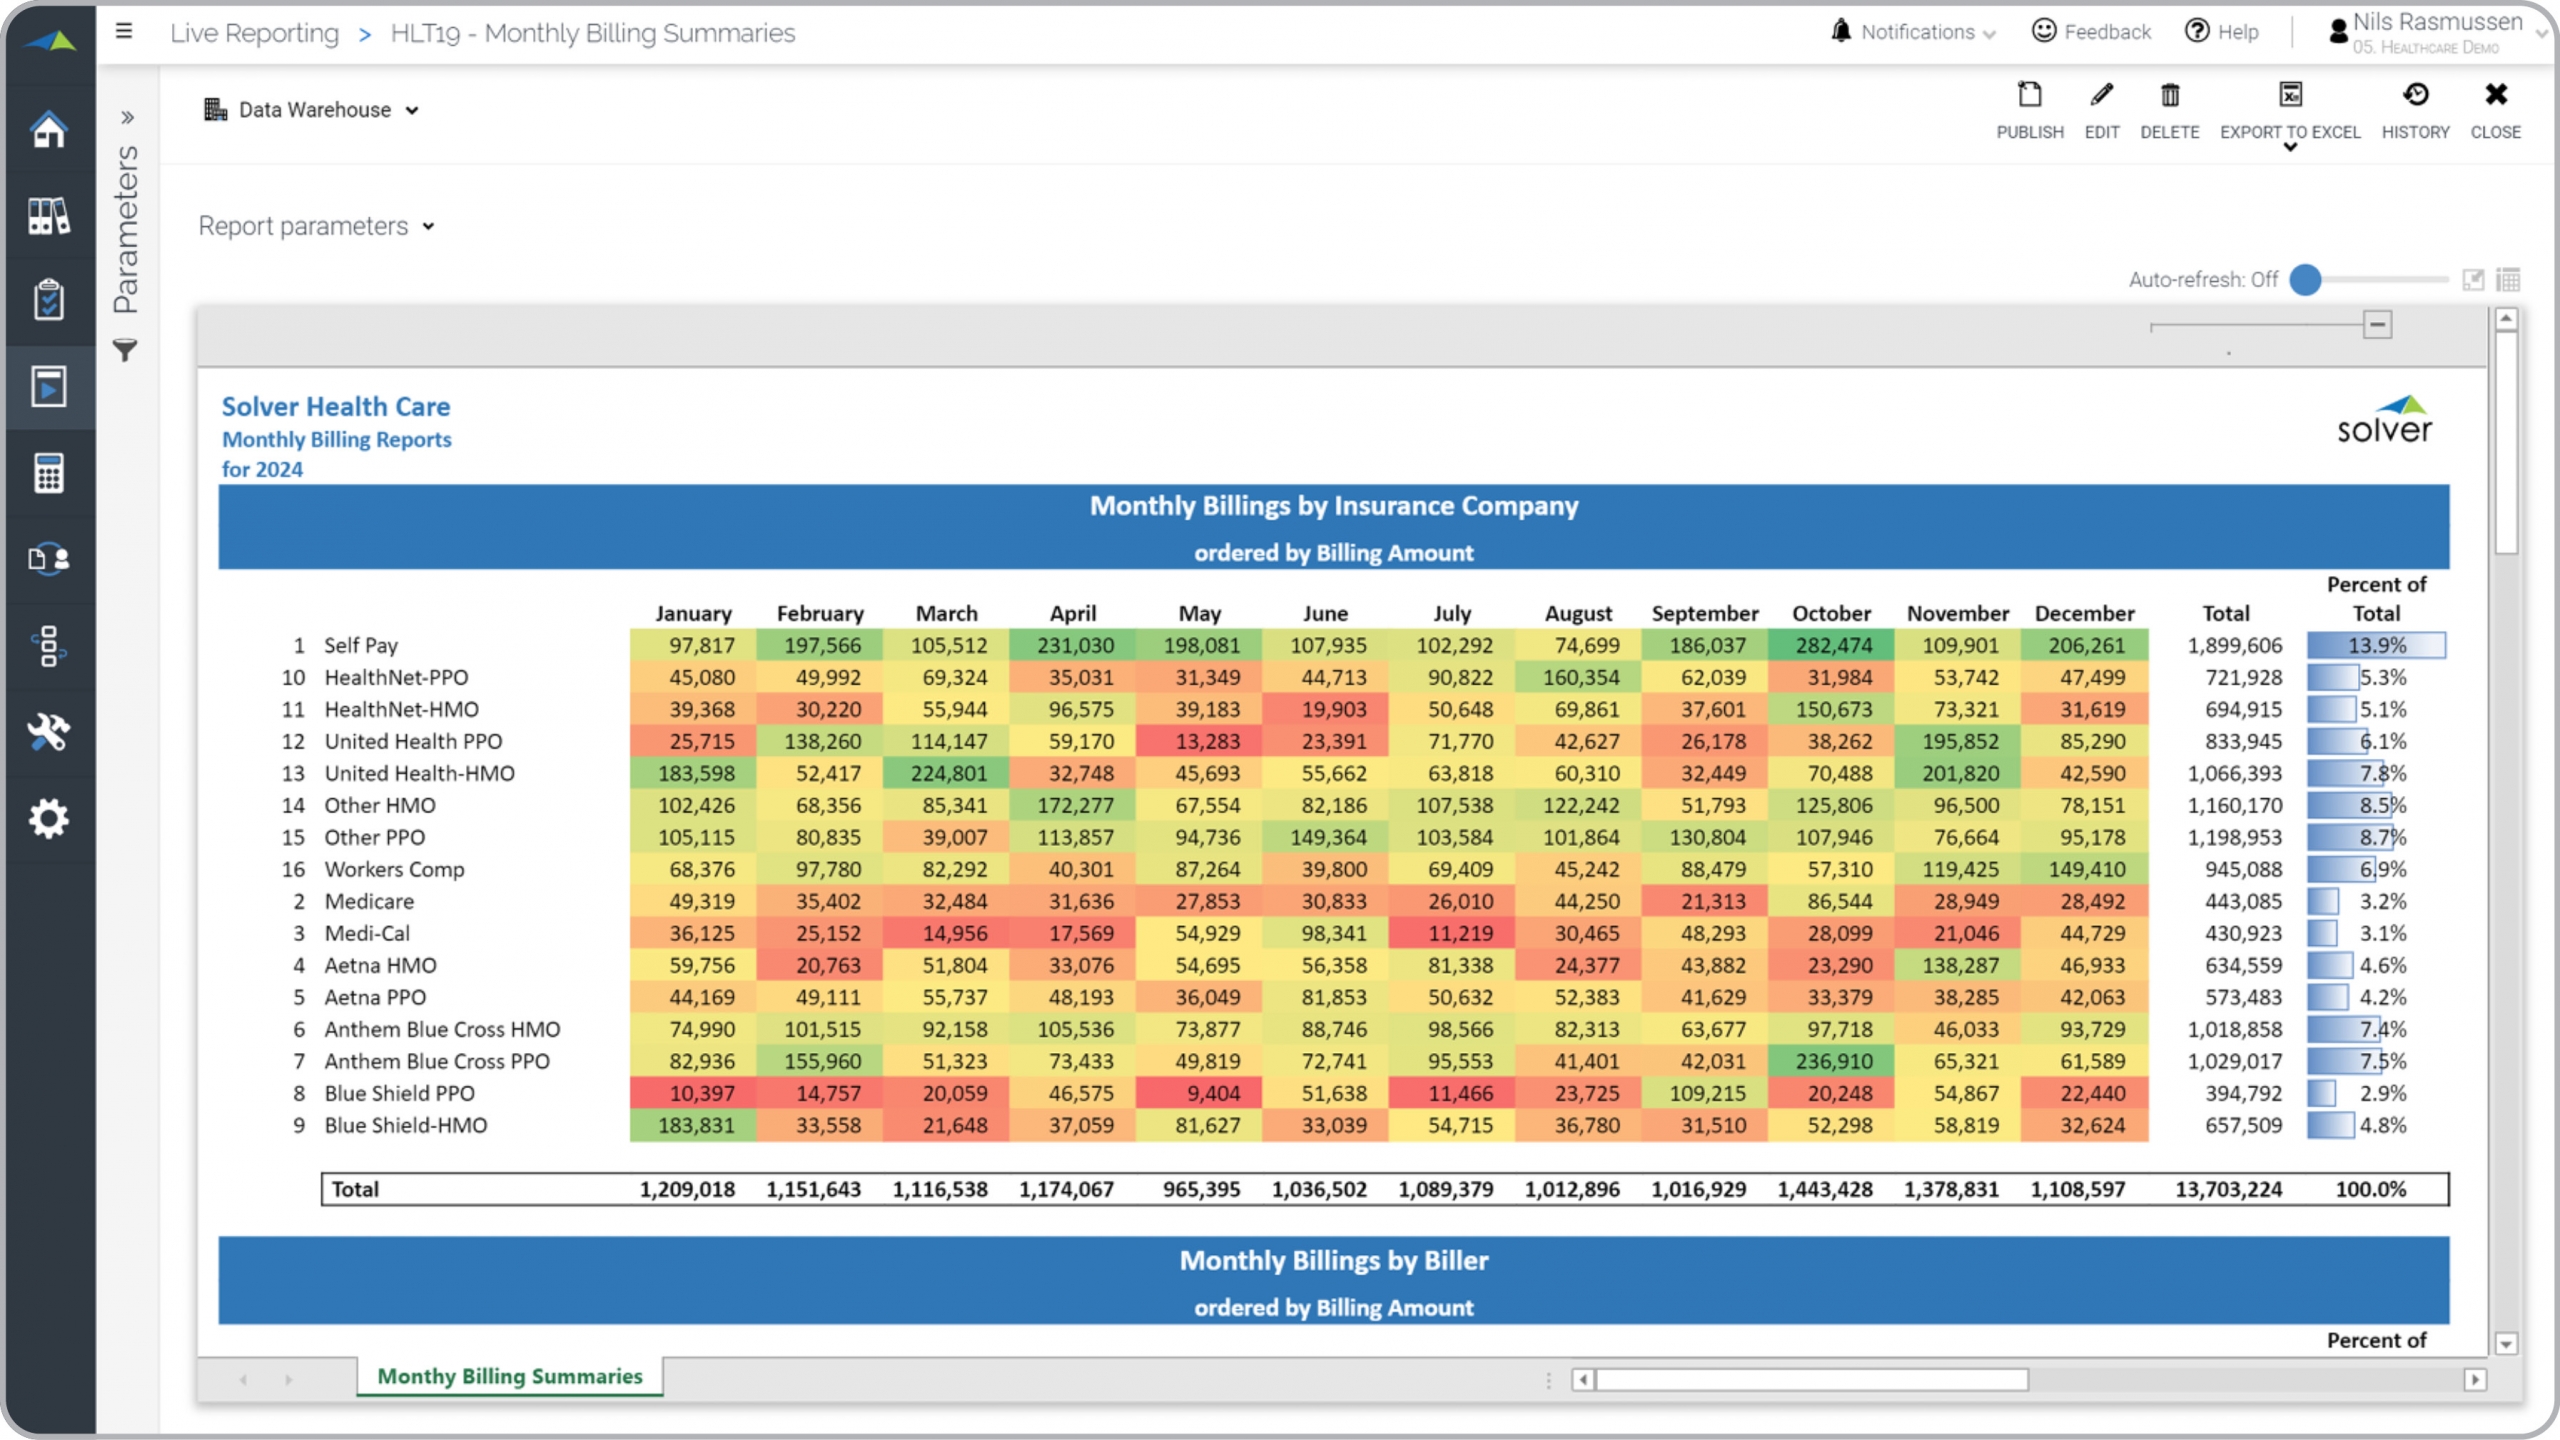
Health – Monthly Billing Summaries
View monthly billing summary by insurance company, biller, doctor and revenue group.
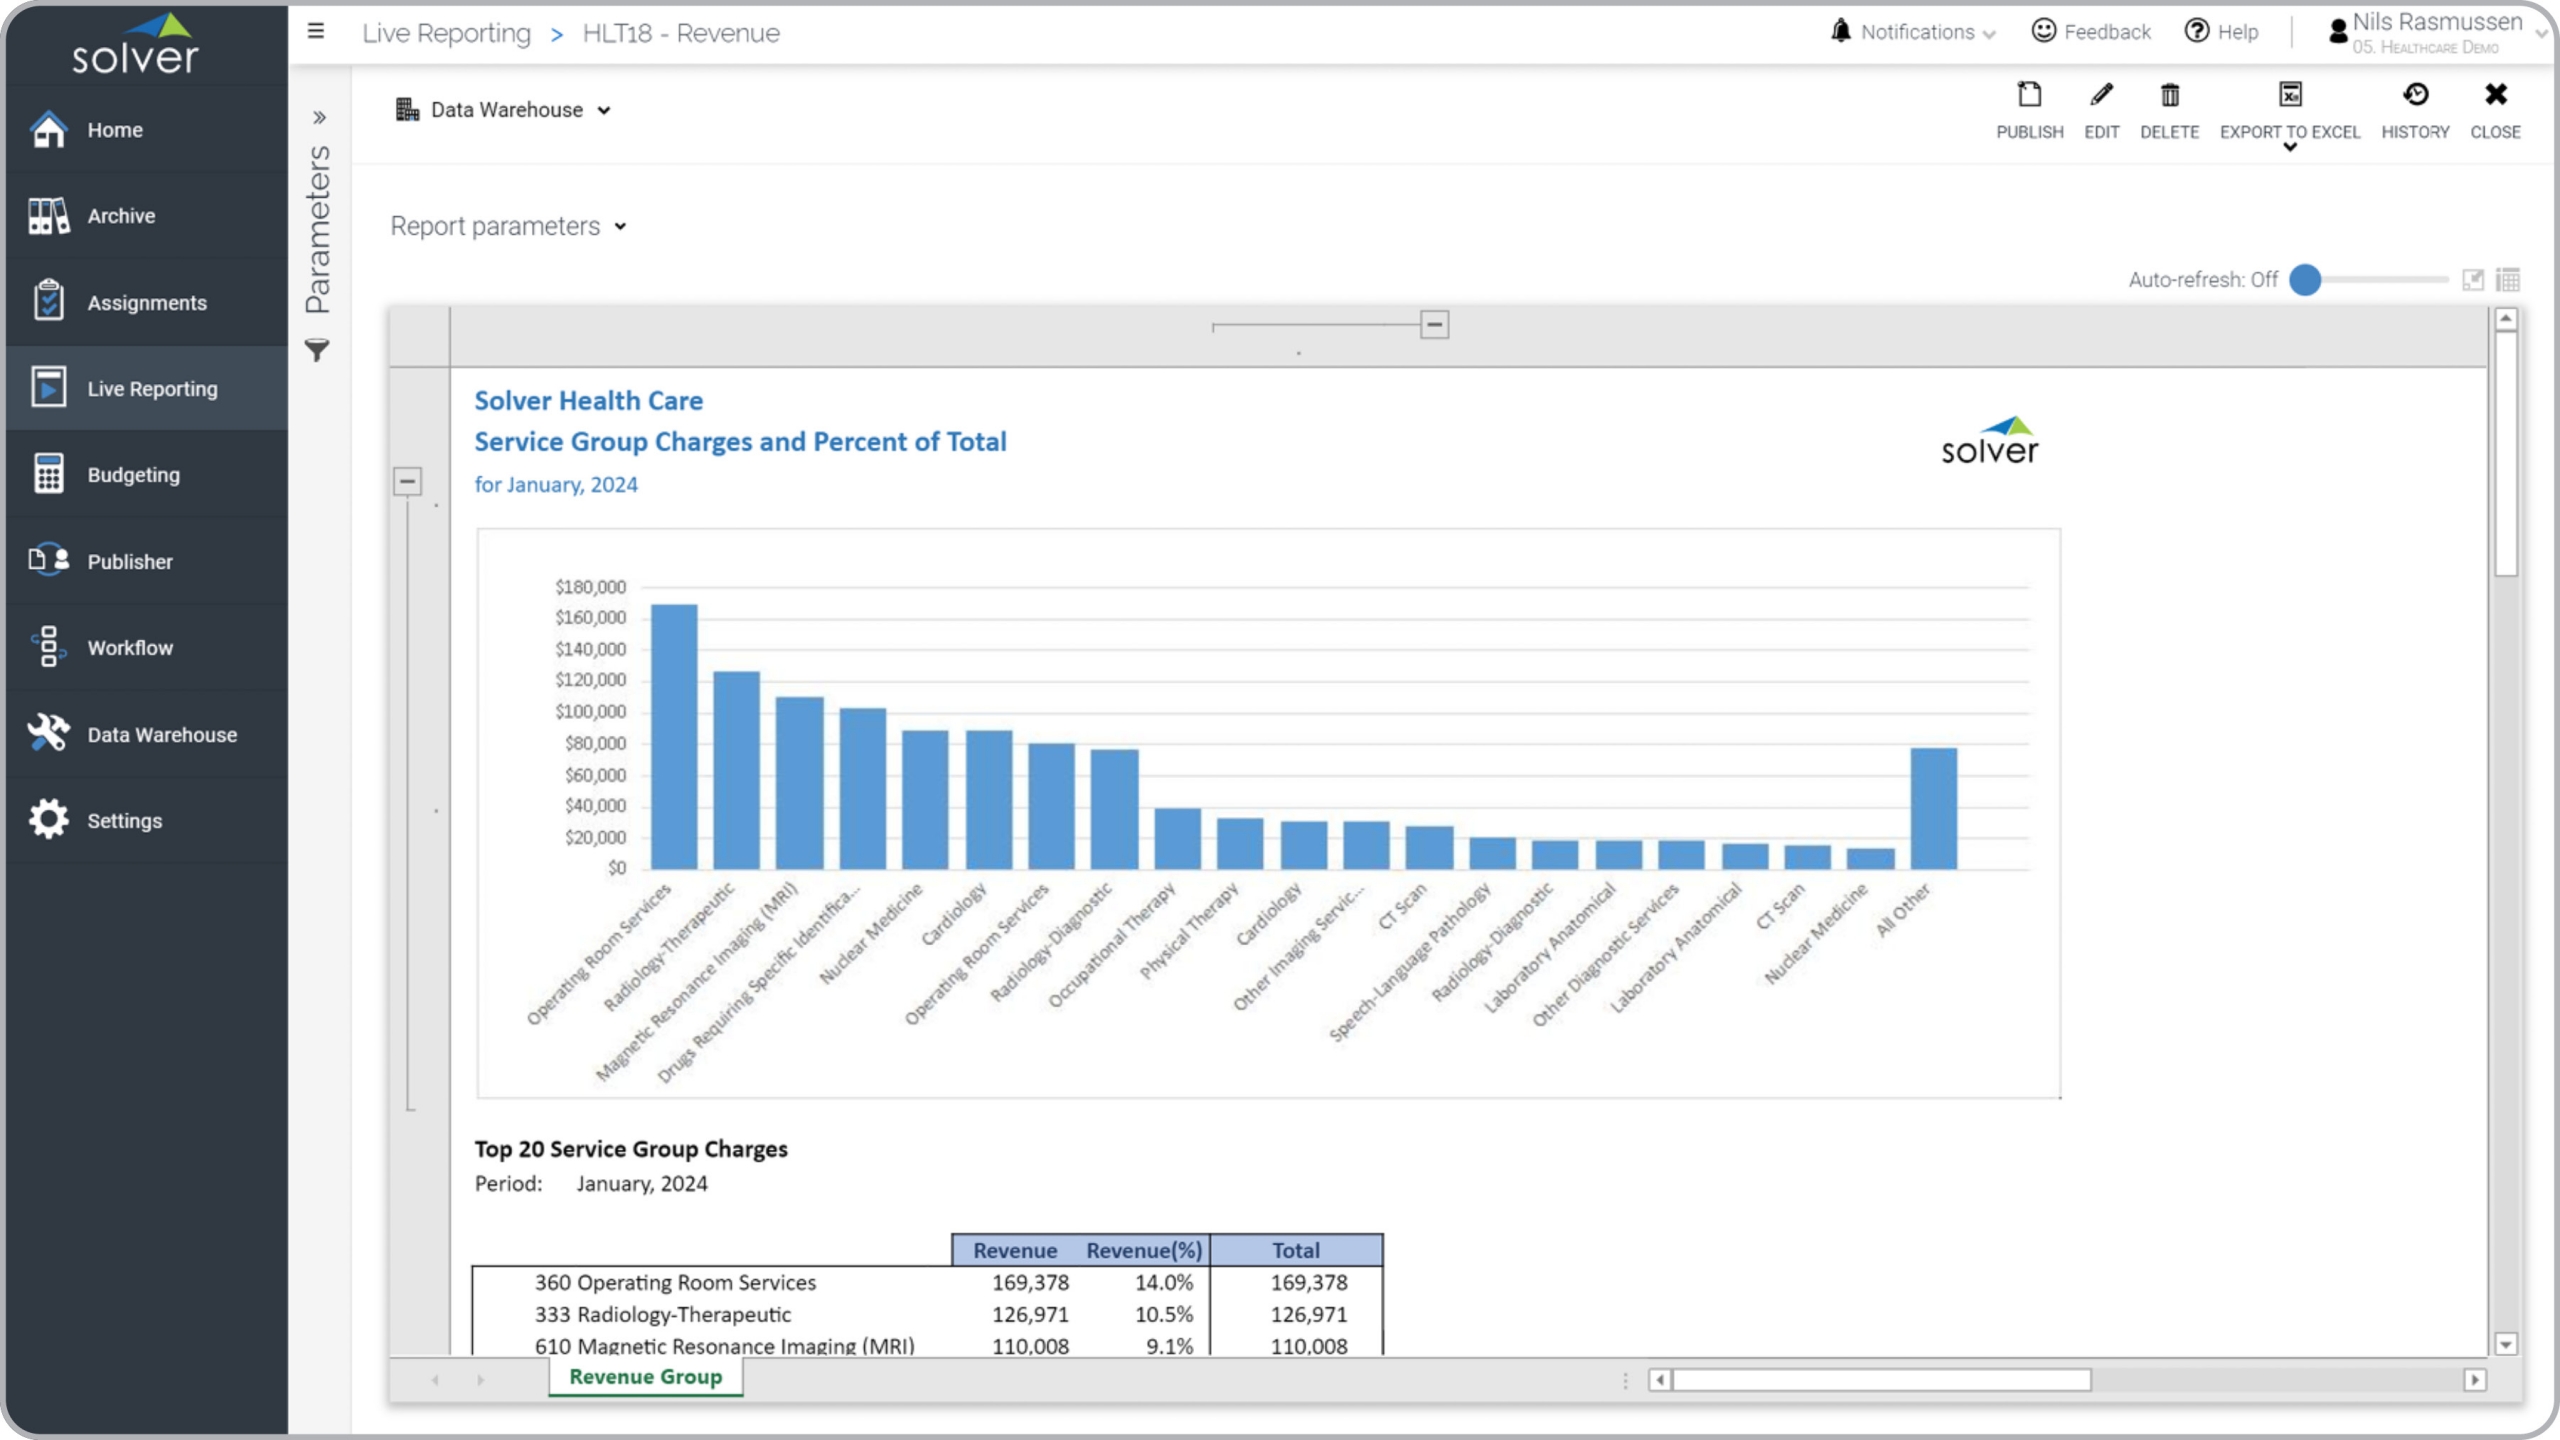
Health – Revenue by Service Group
Analyze hospital revenue for the top 20 service groups.

Health – Statistical Budget
Capture budgets for important statistical items such as patient days and admits.
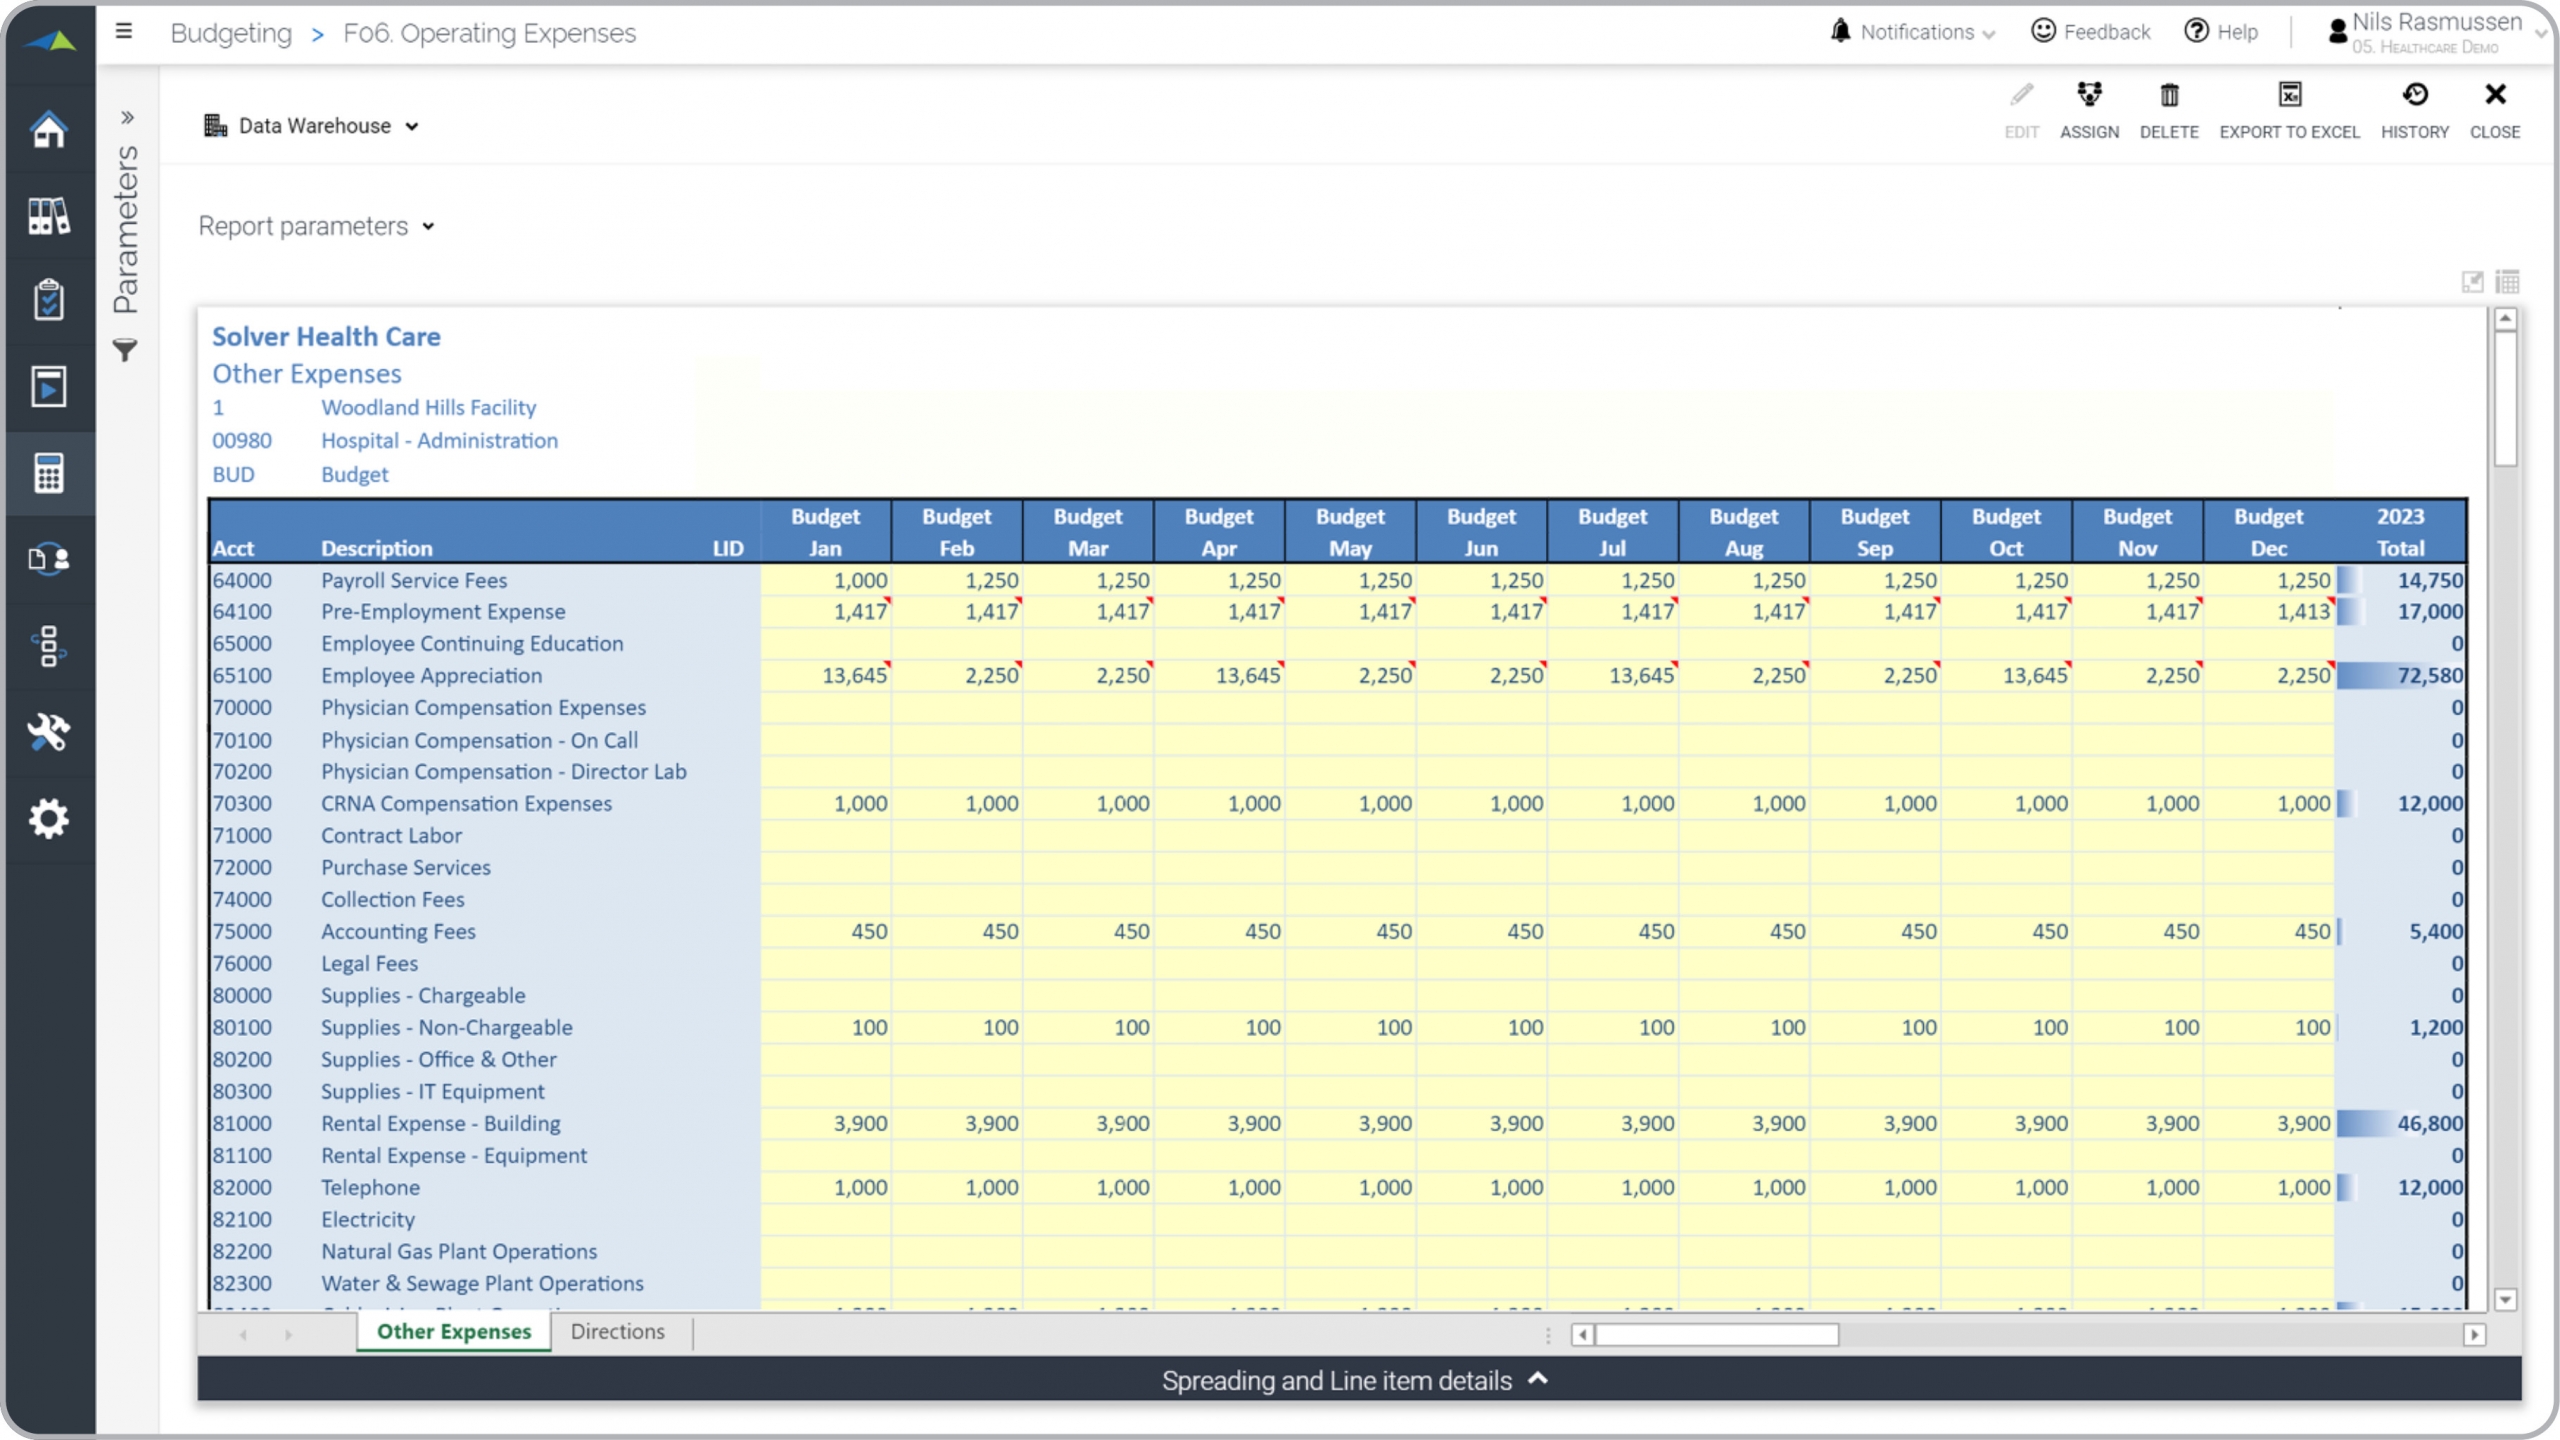
Health – Operating Expenses Budget
Enter operating expenses by clinic and department, with line items detail and comments.
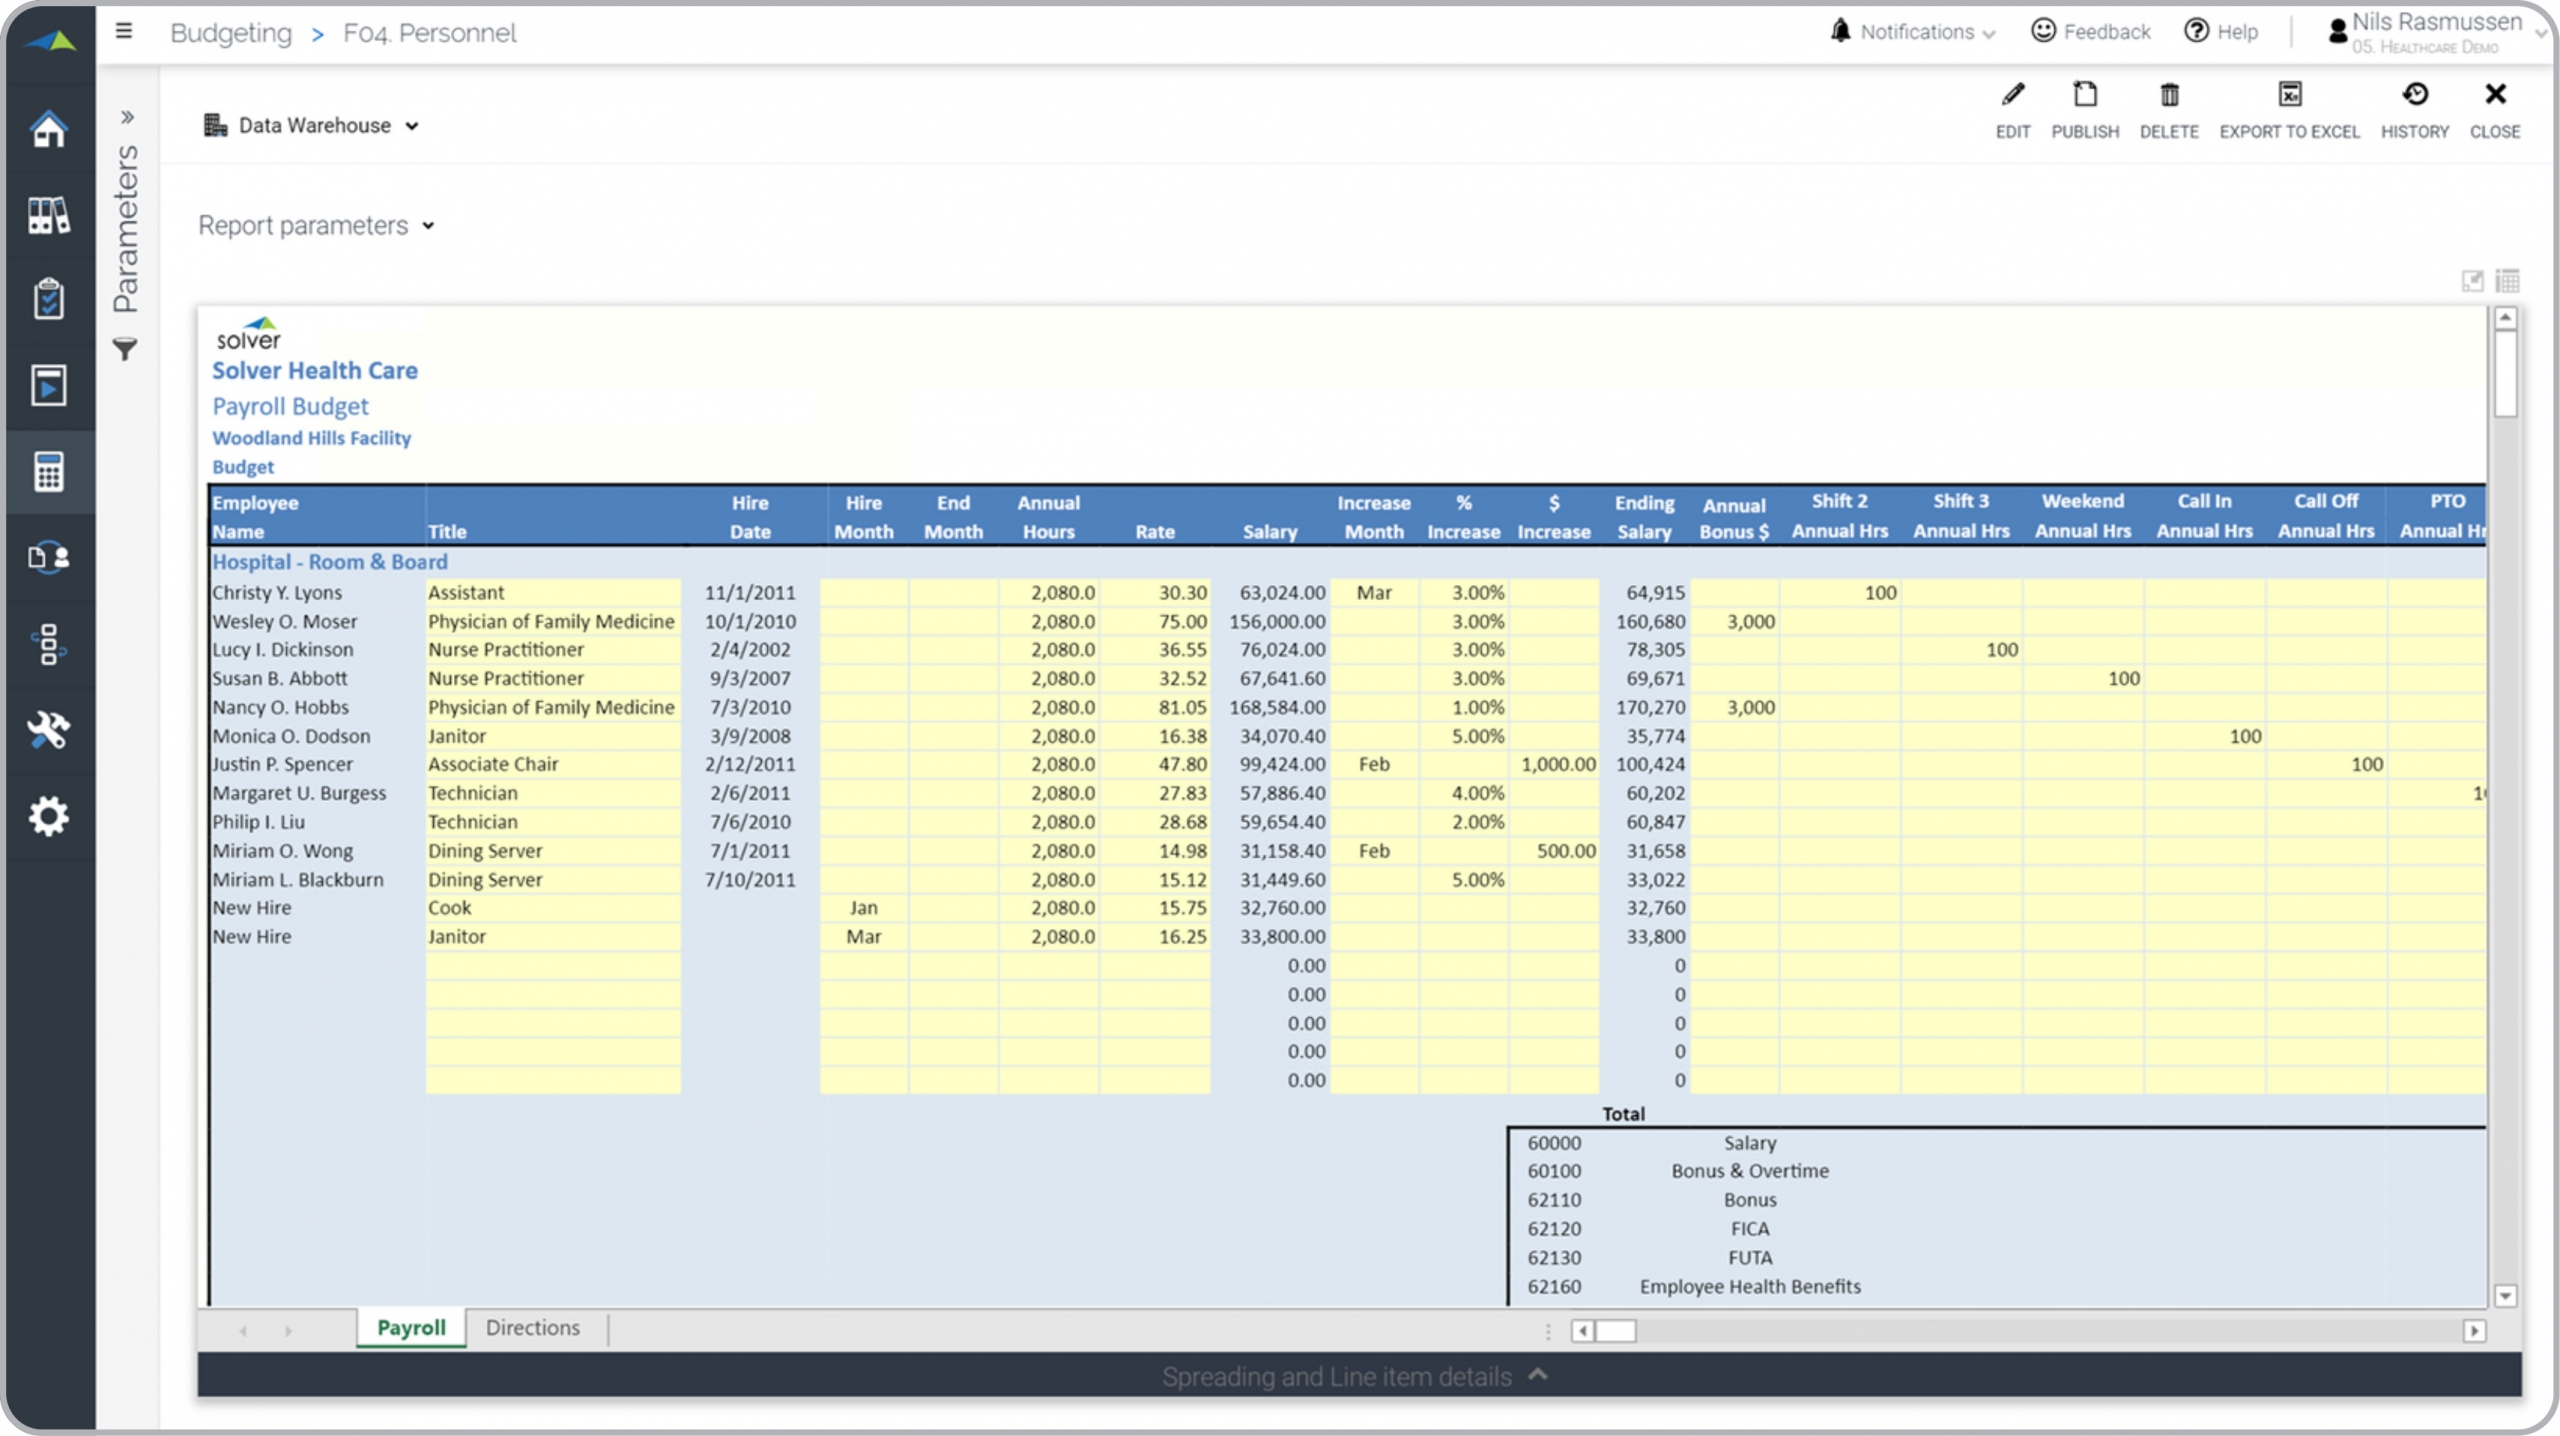
Health – Personnel Budget
Enter operating expenses by clinic and department, with line items detail and comments.
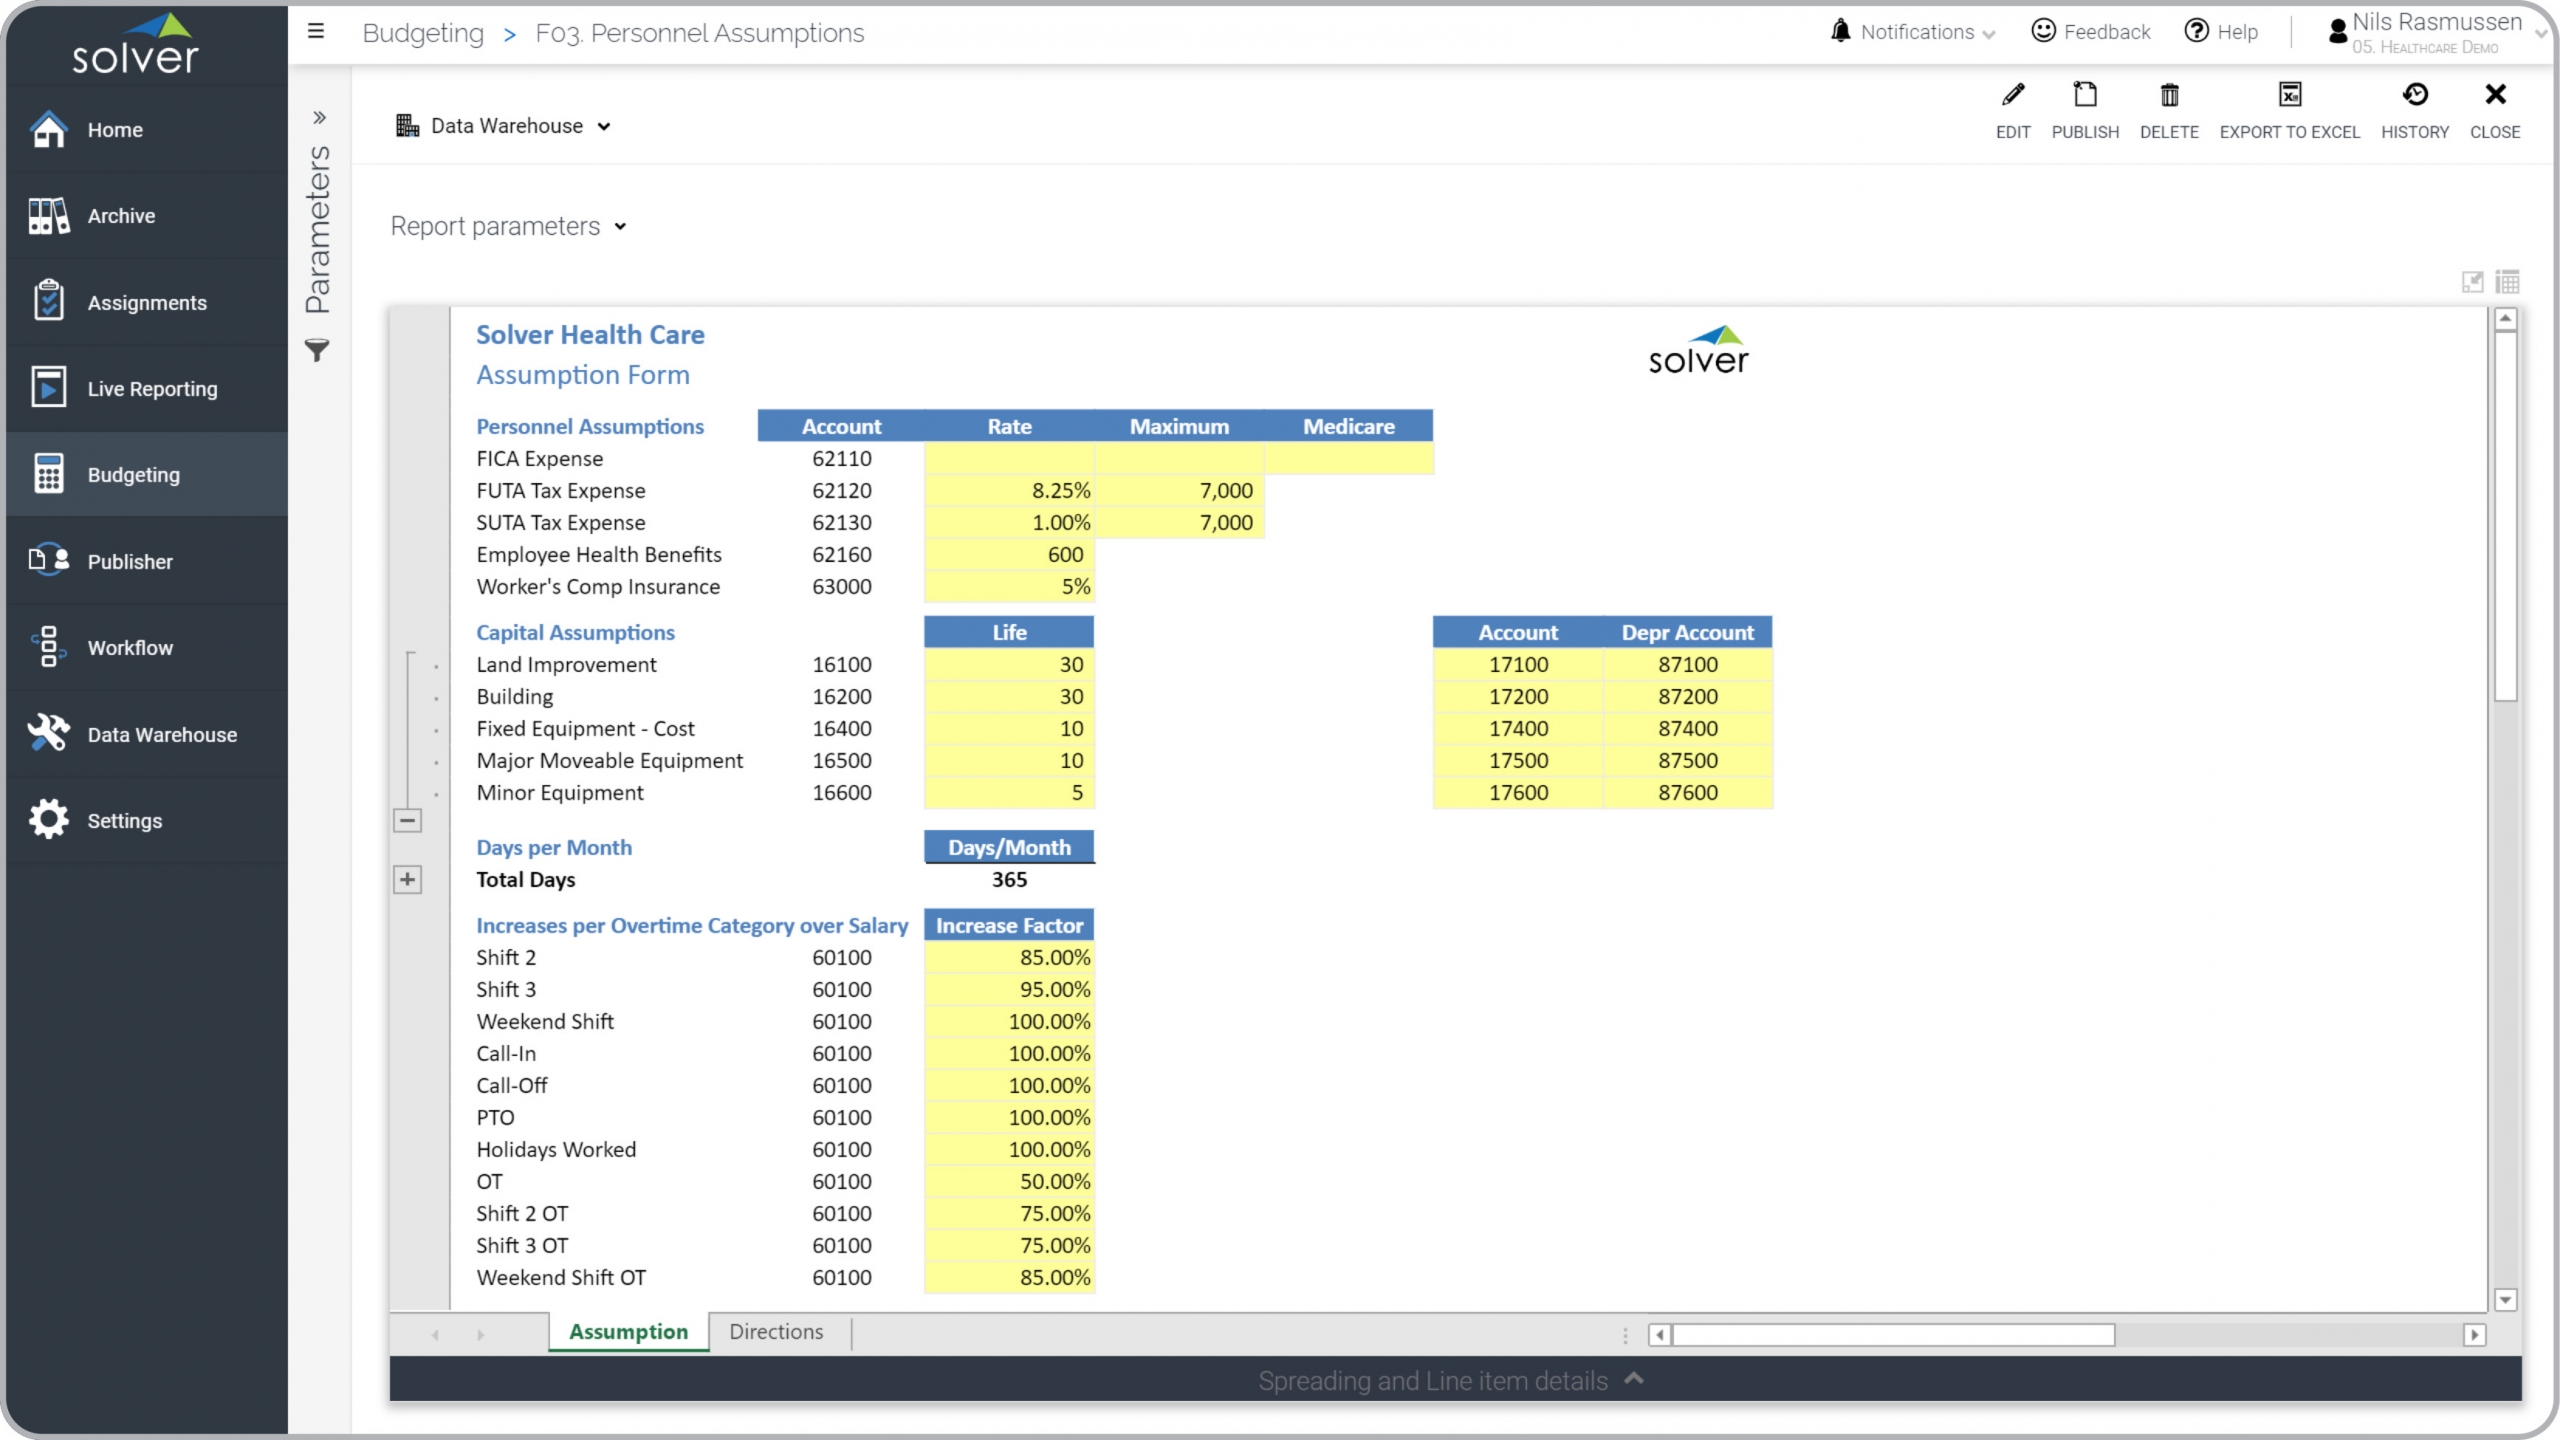
Health – Expense Budget Assumptions
Enter budget drivers for personnel compensation and capital expenses.
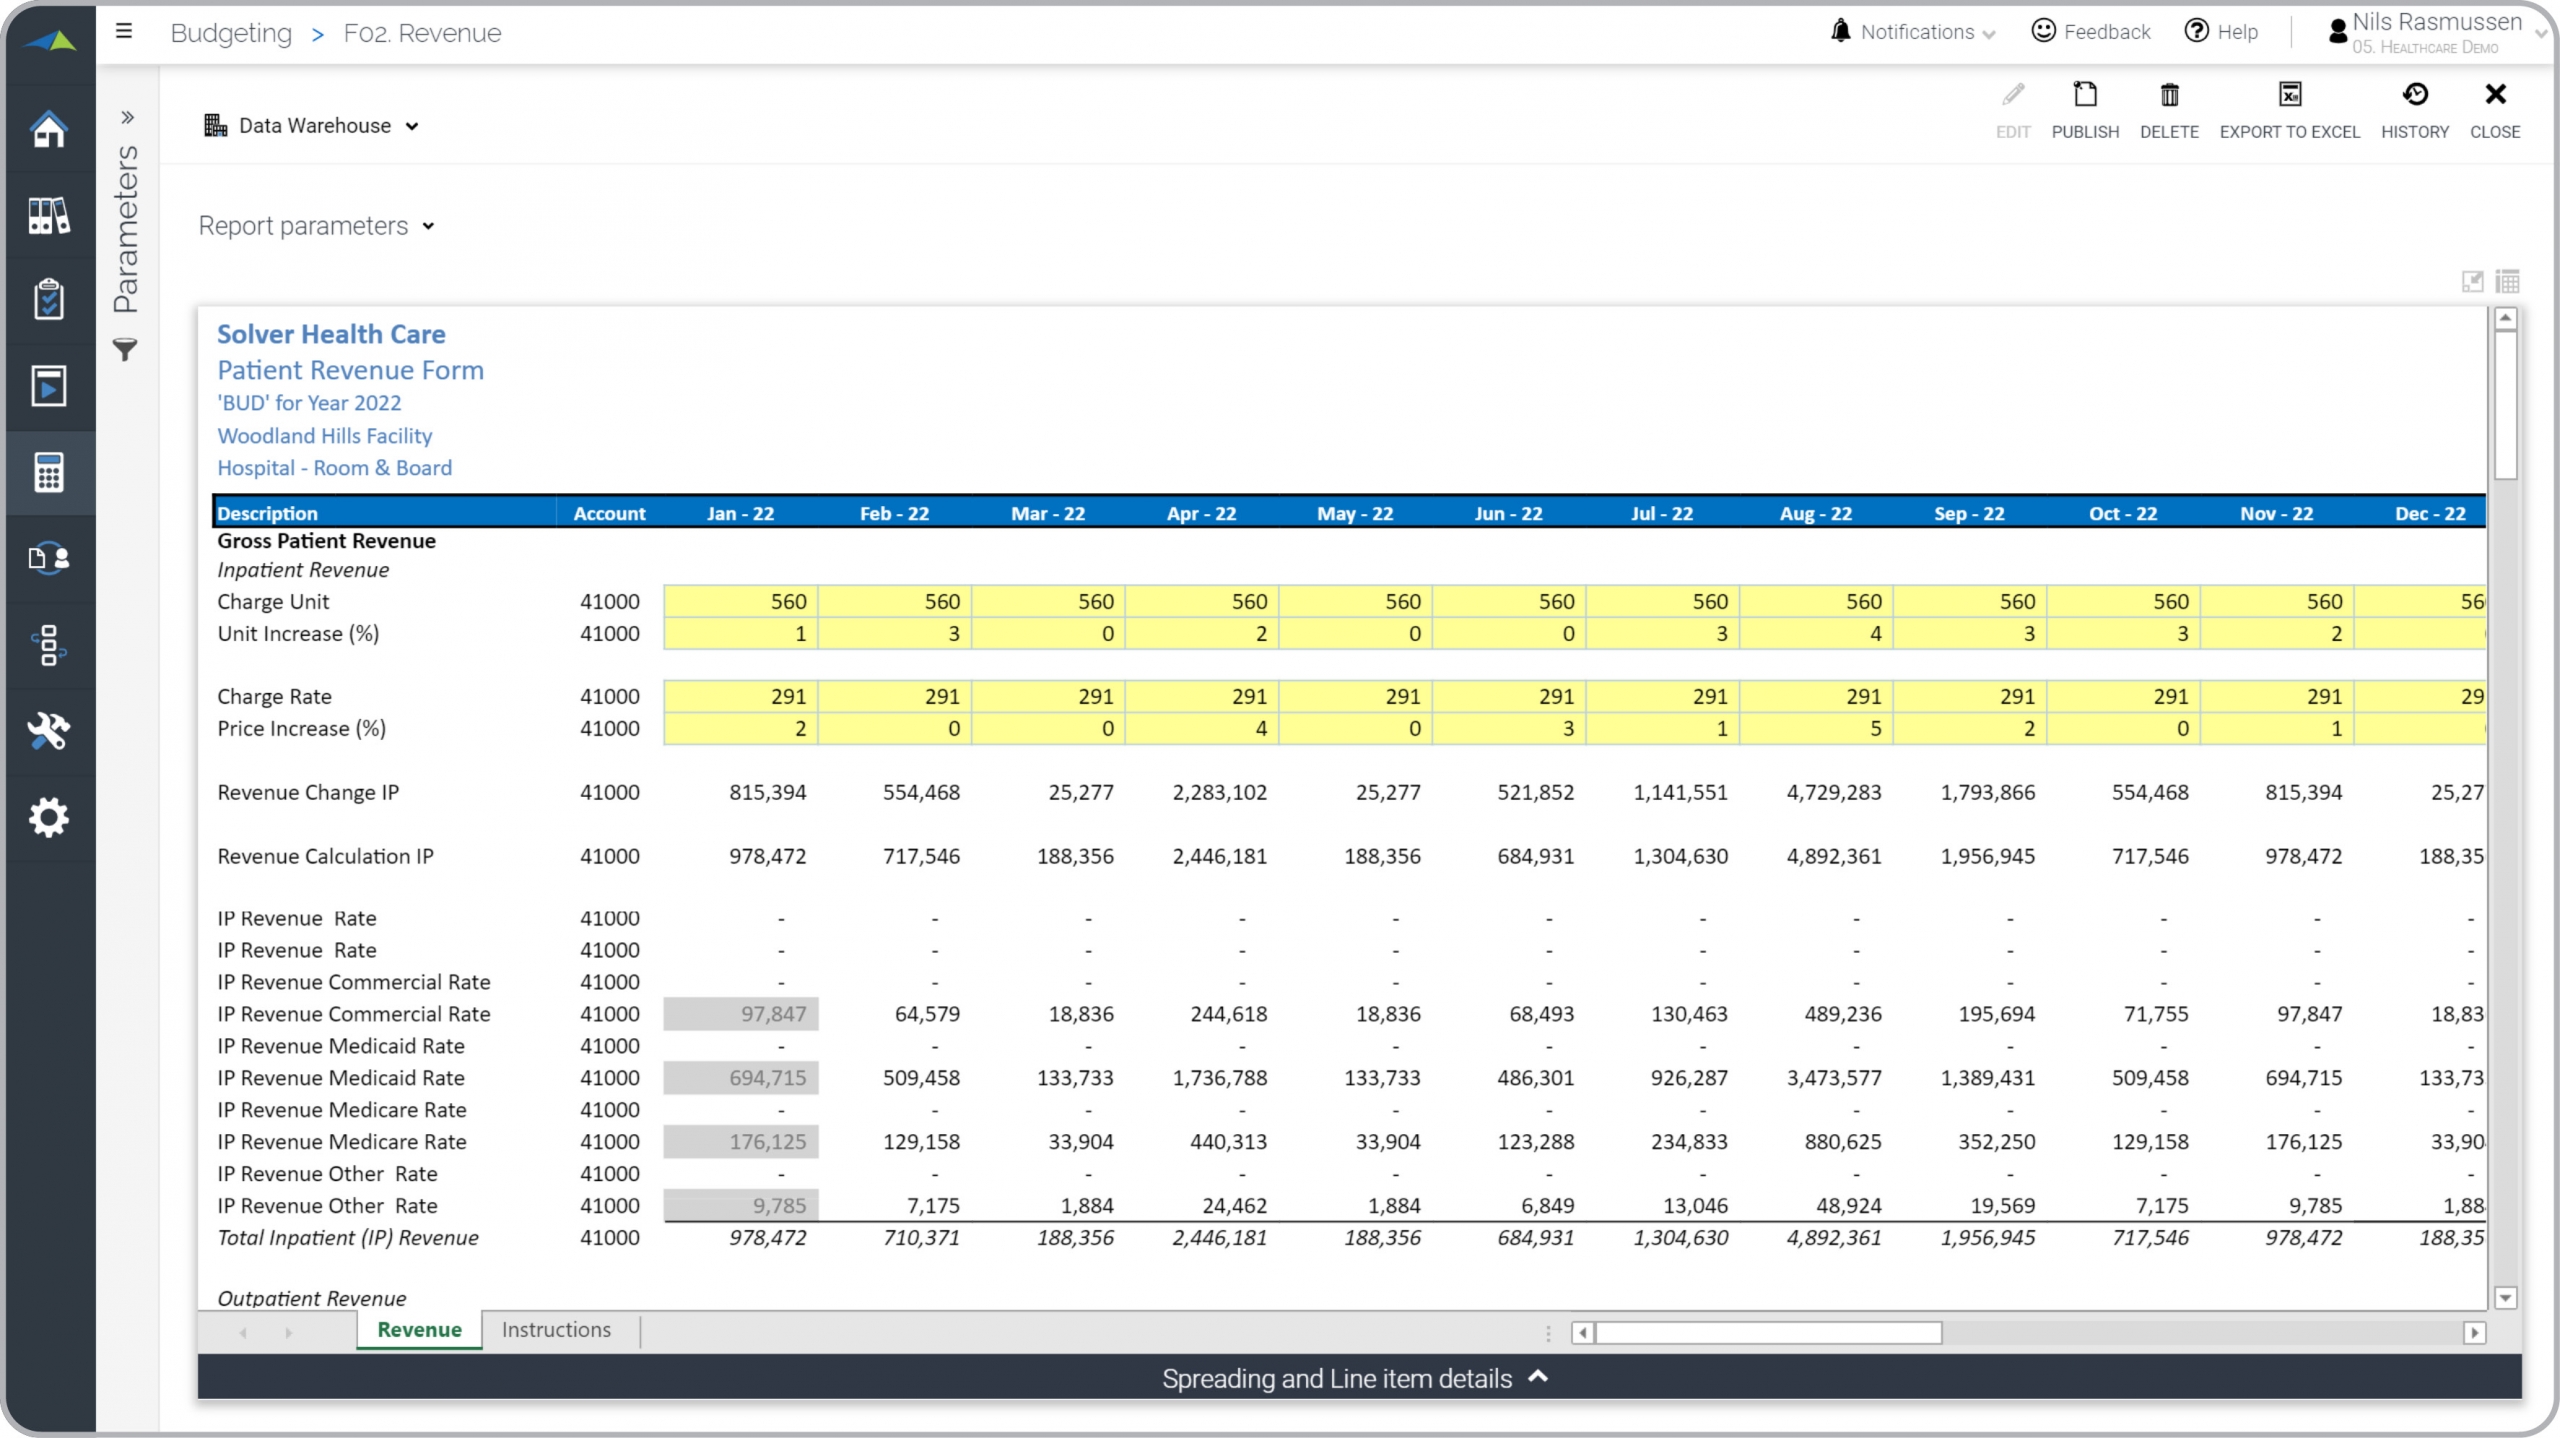
Health – Patient Revenue Budget
Both manual and driver-based input of patient revenue budgets .
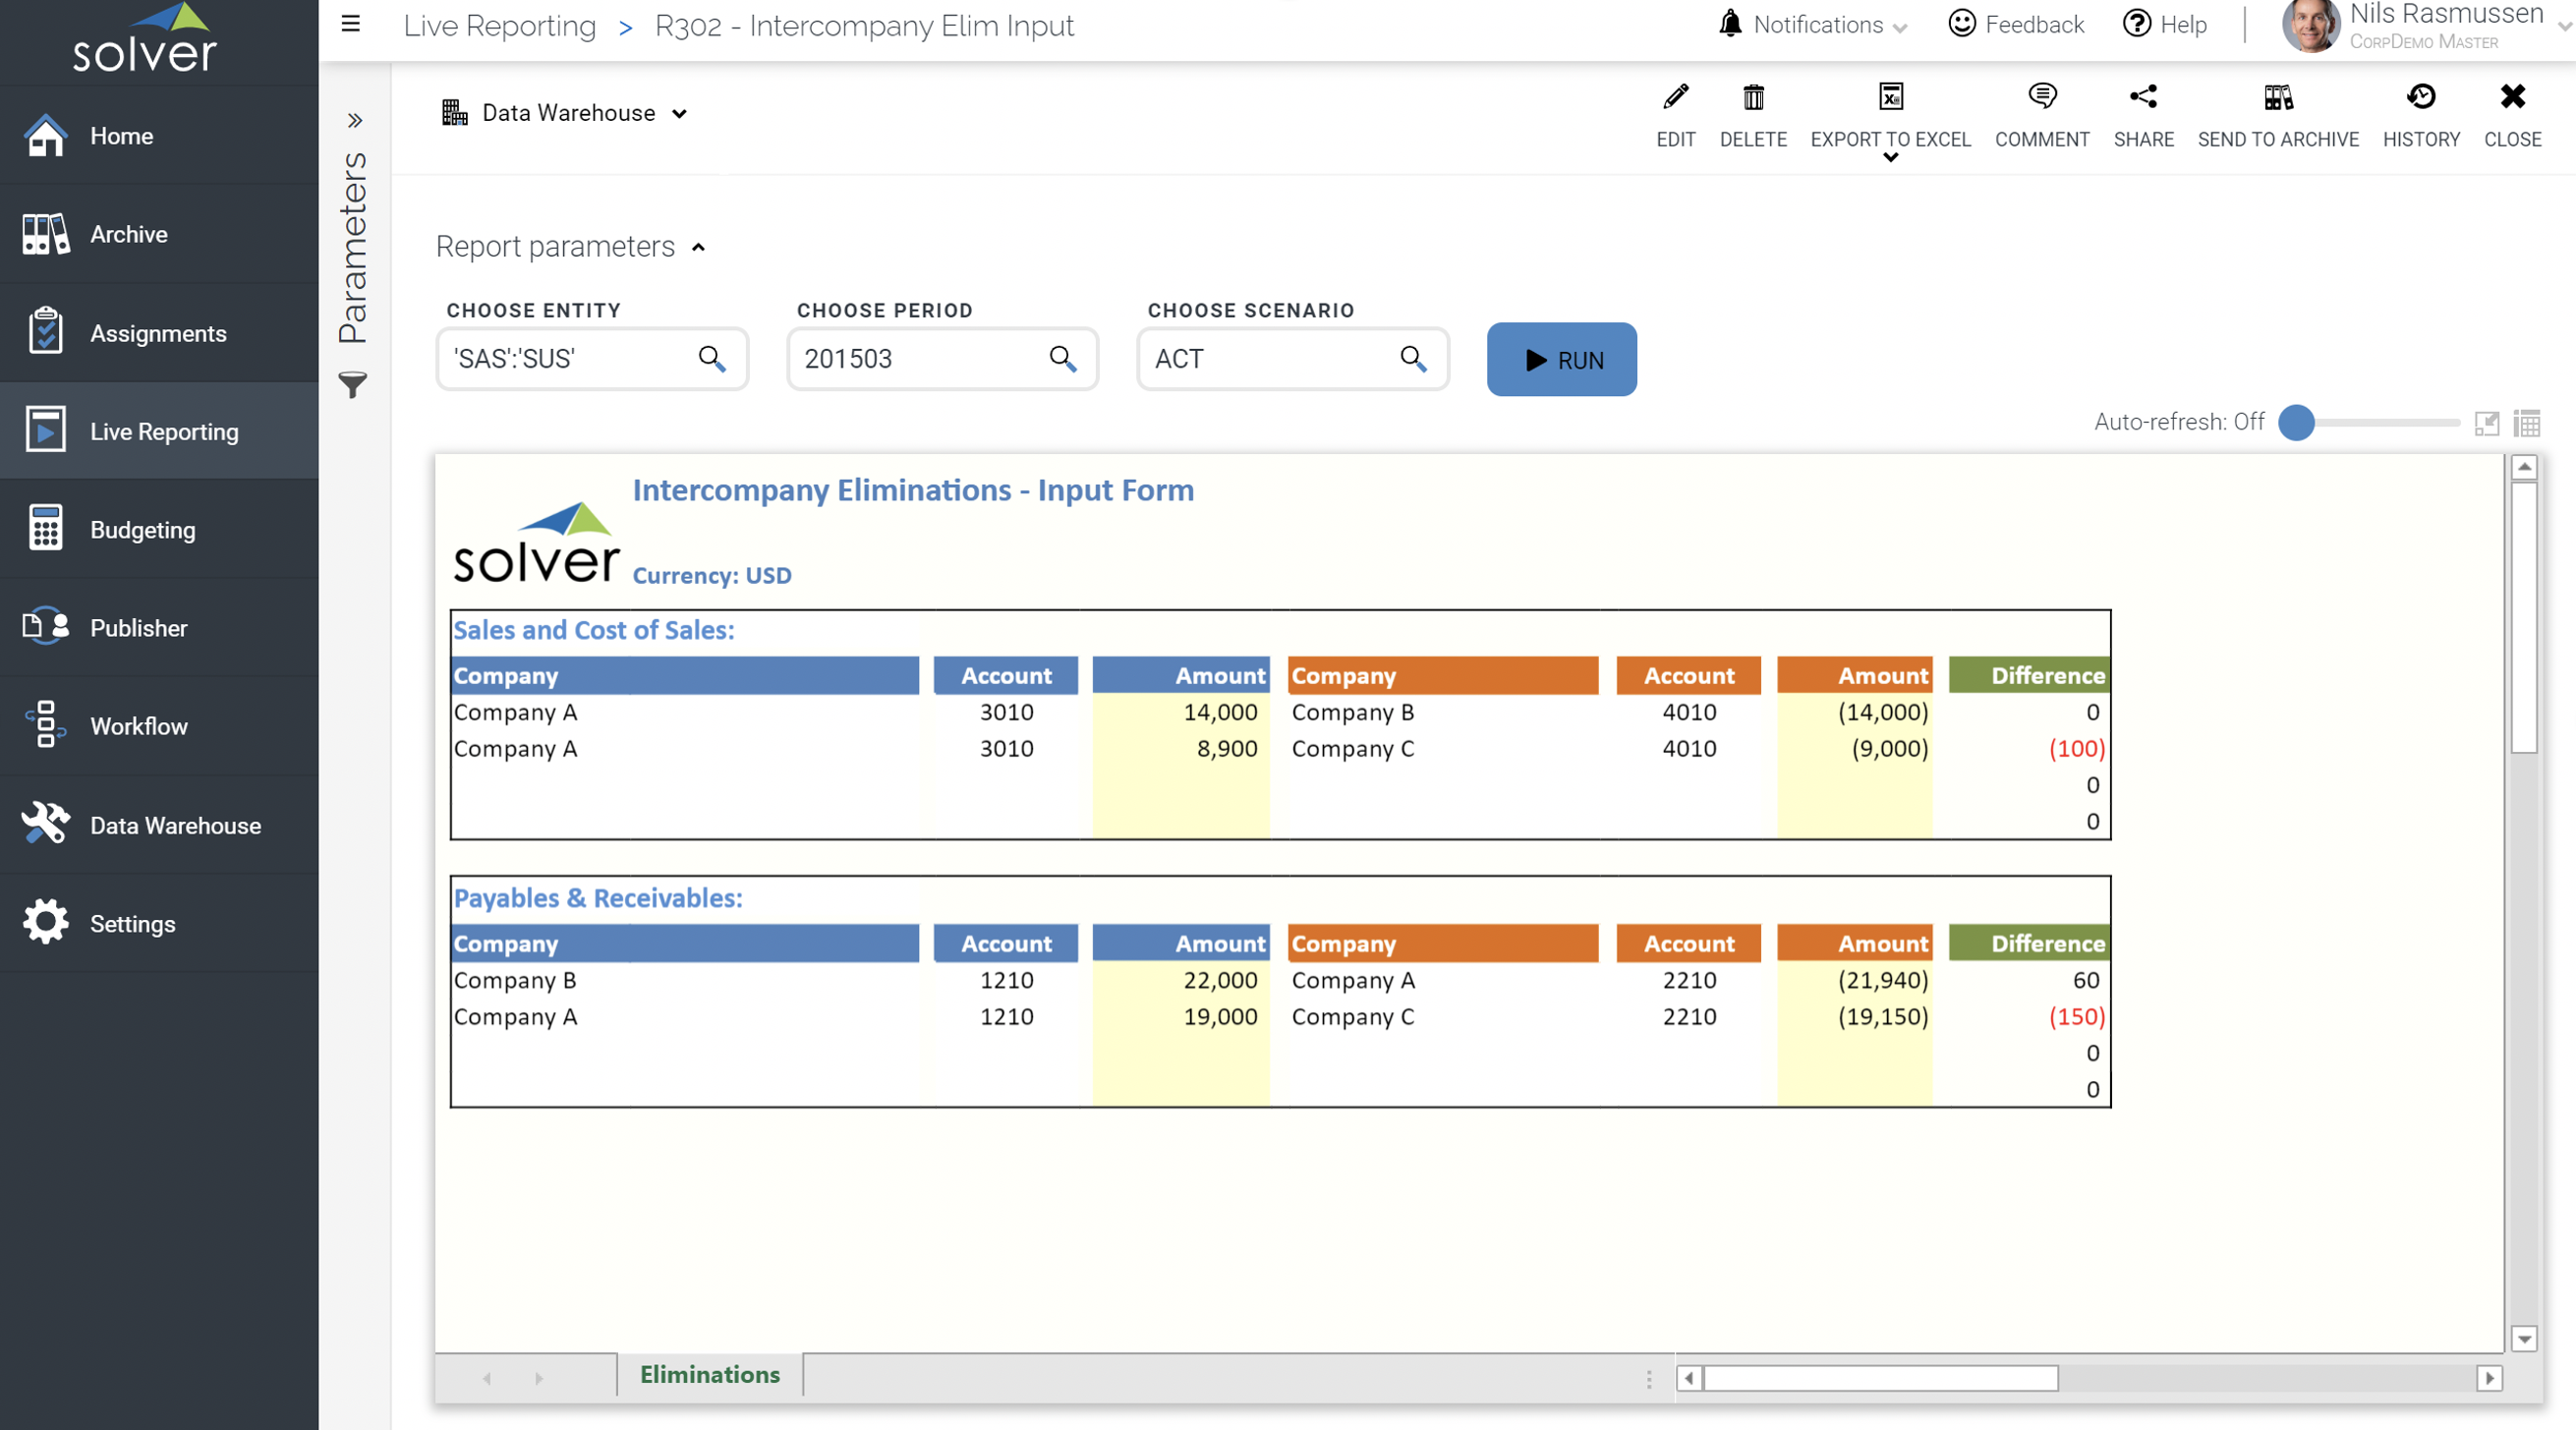
Intercompany Elimination Input
Input form where user can enter manual elimination entries.
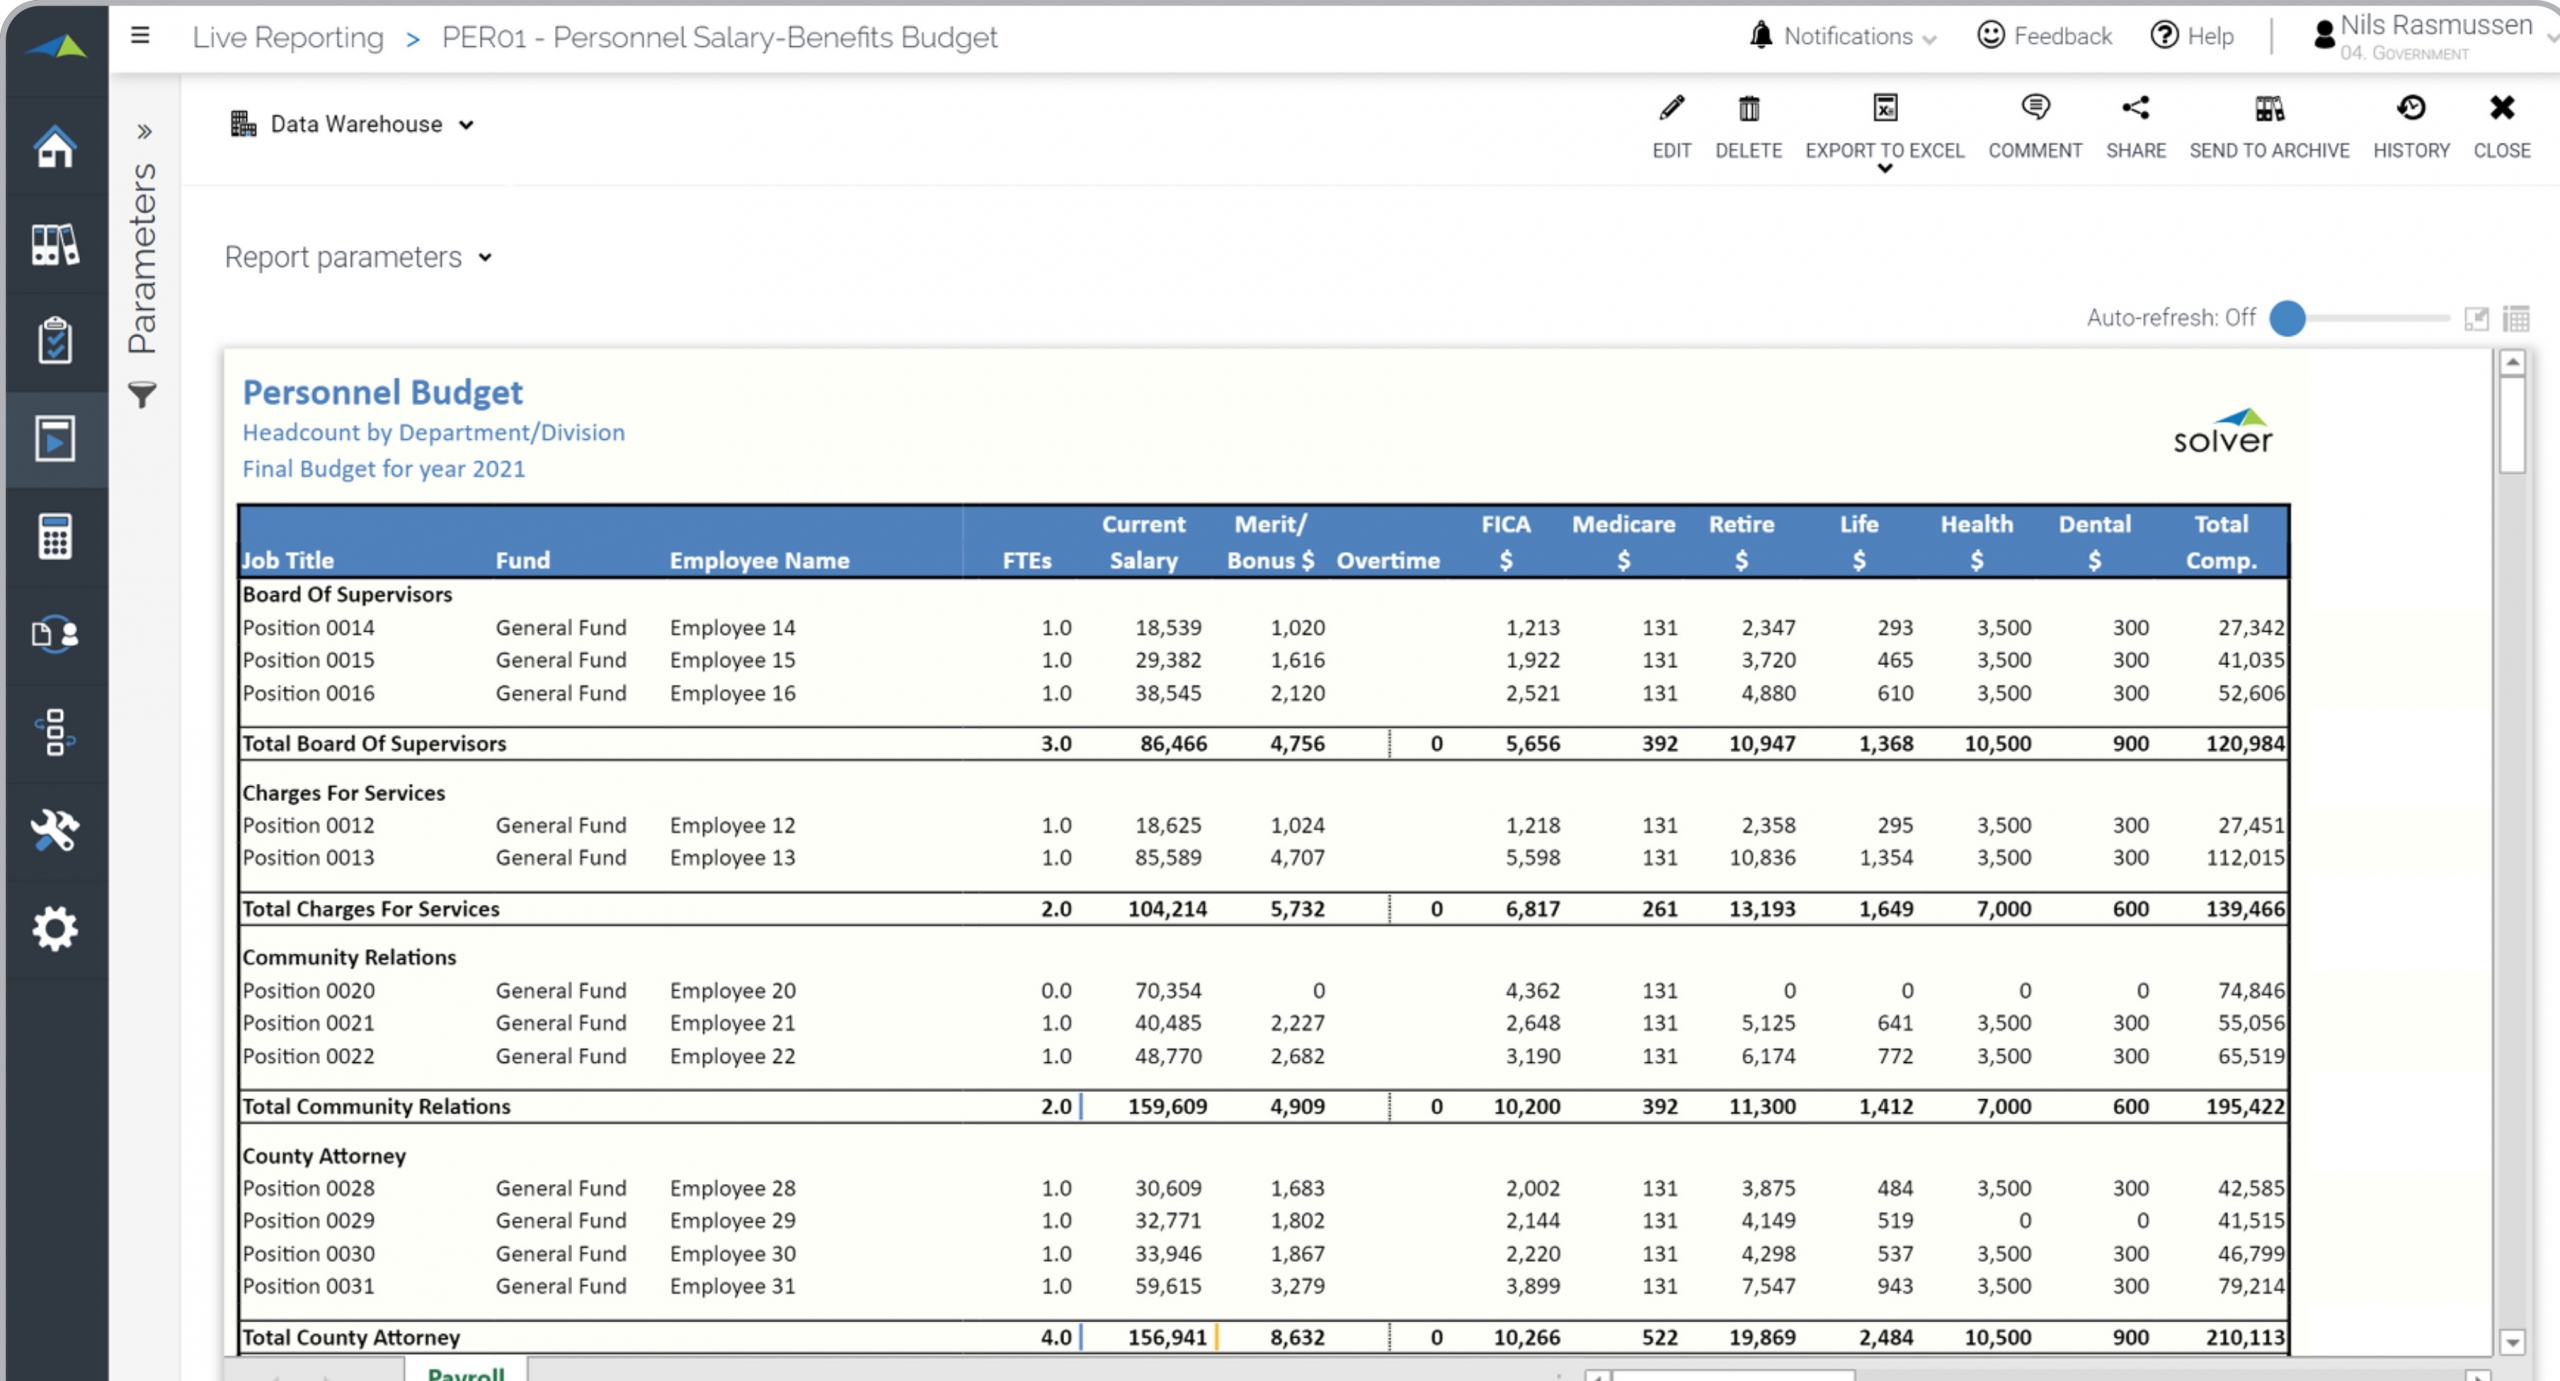
Government – Personnel Budget Report
Analyze the budgeted salaries, taxes and benefits per position and department.
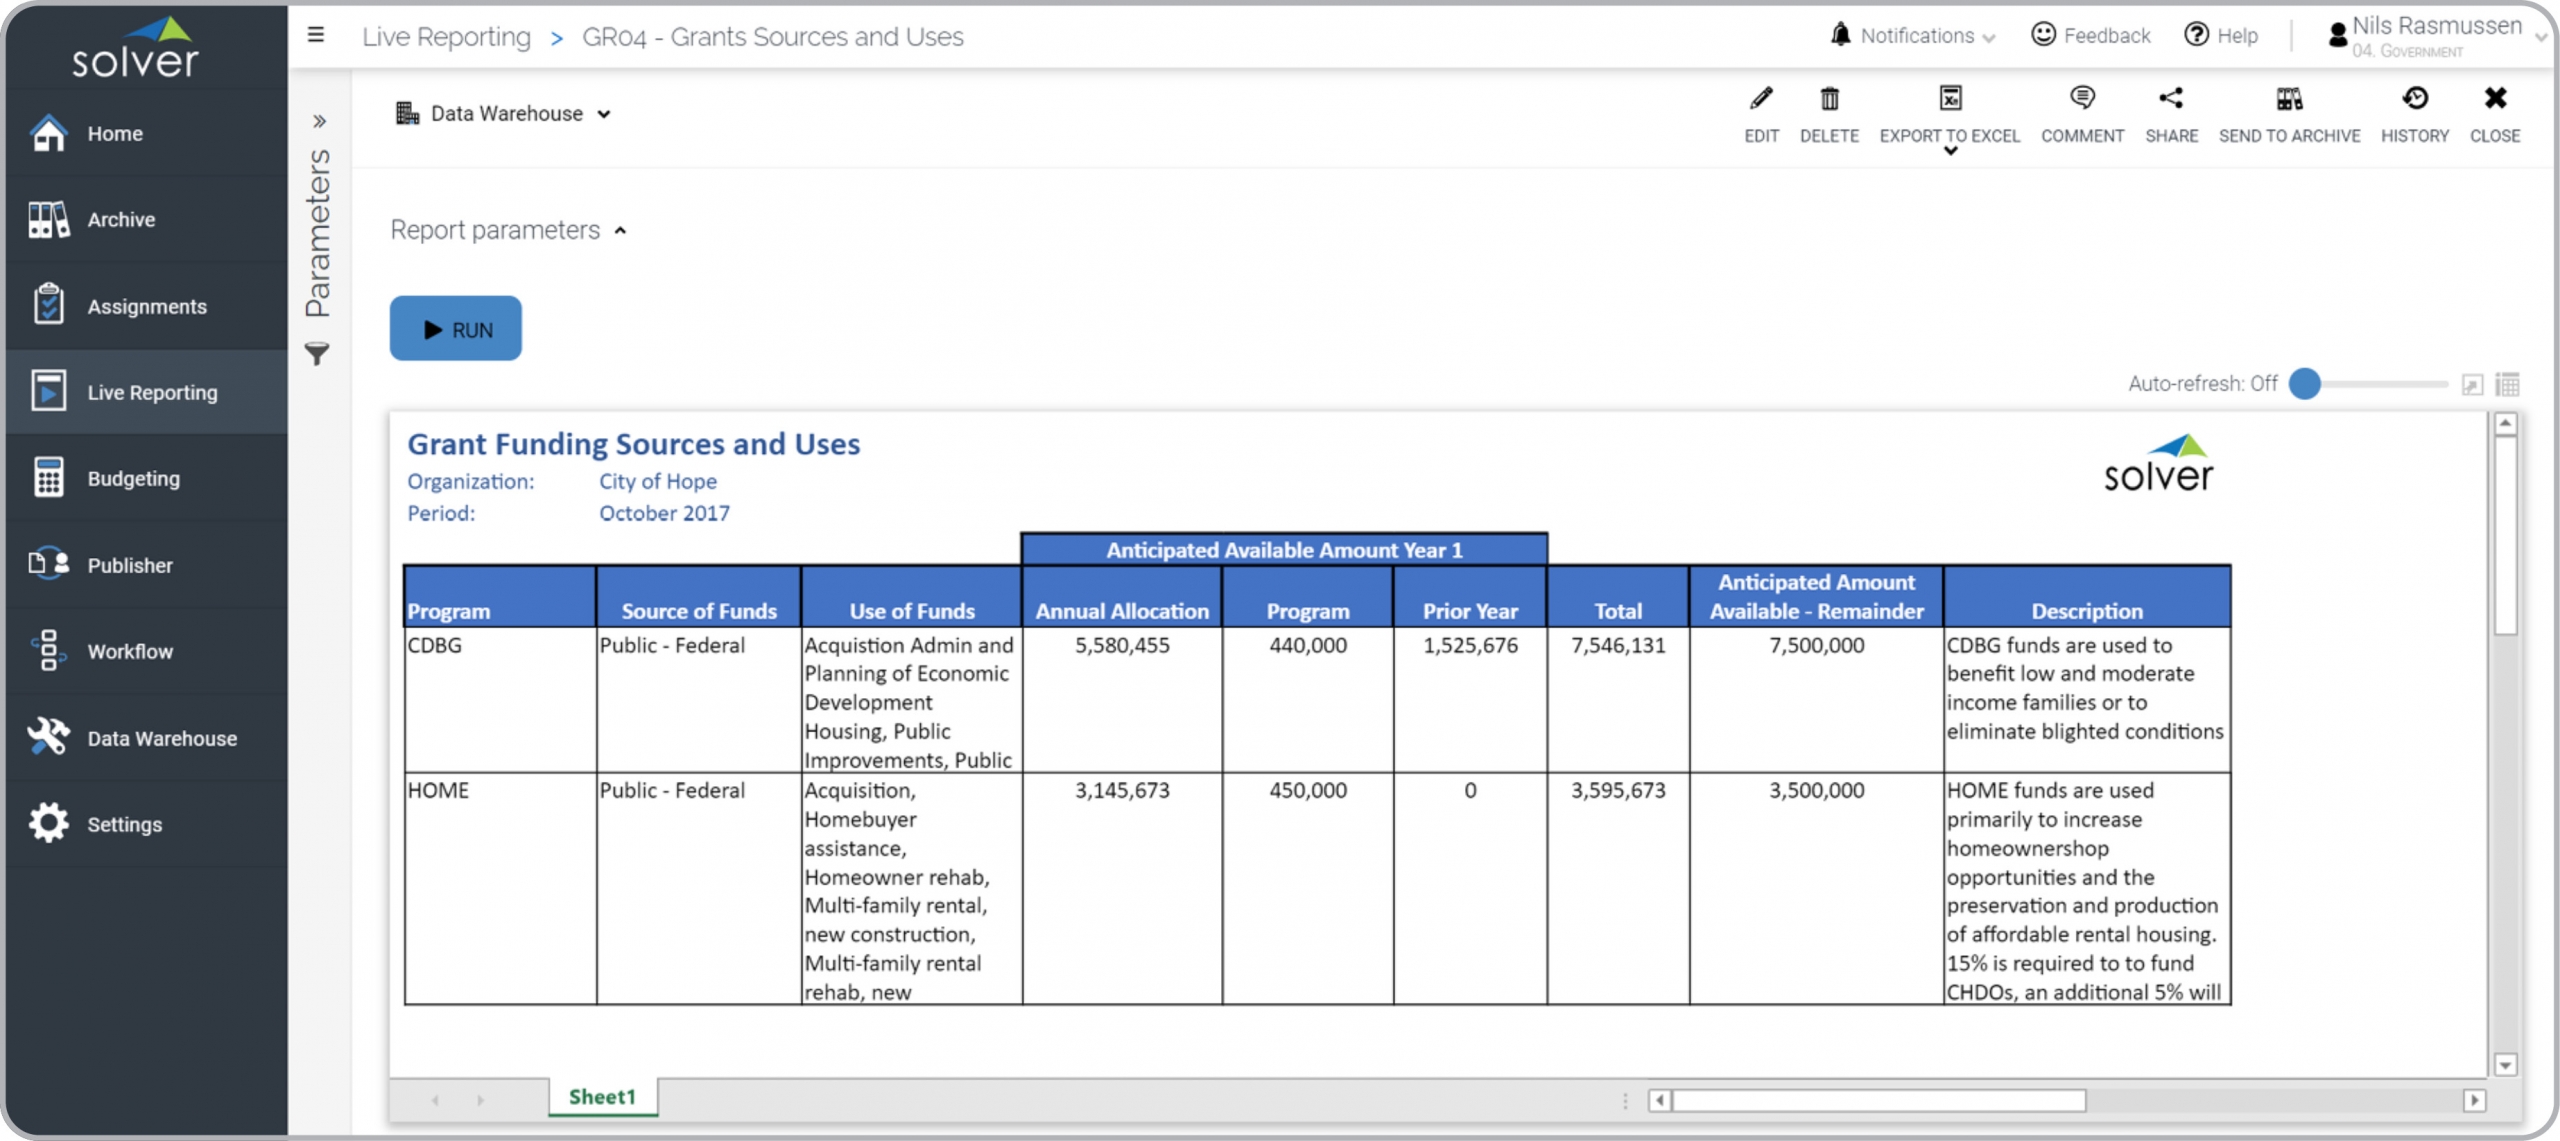
Government – Grants Sources and Uses
Shows funding per program, annual allocation and anticipated remaining amount.
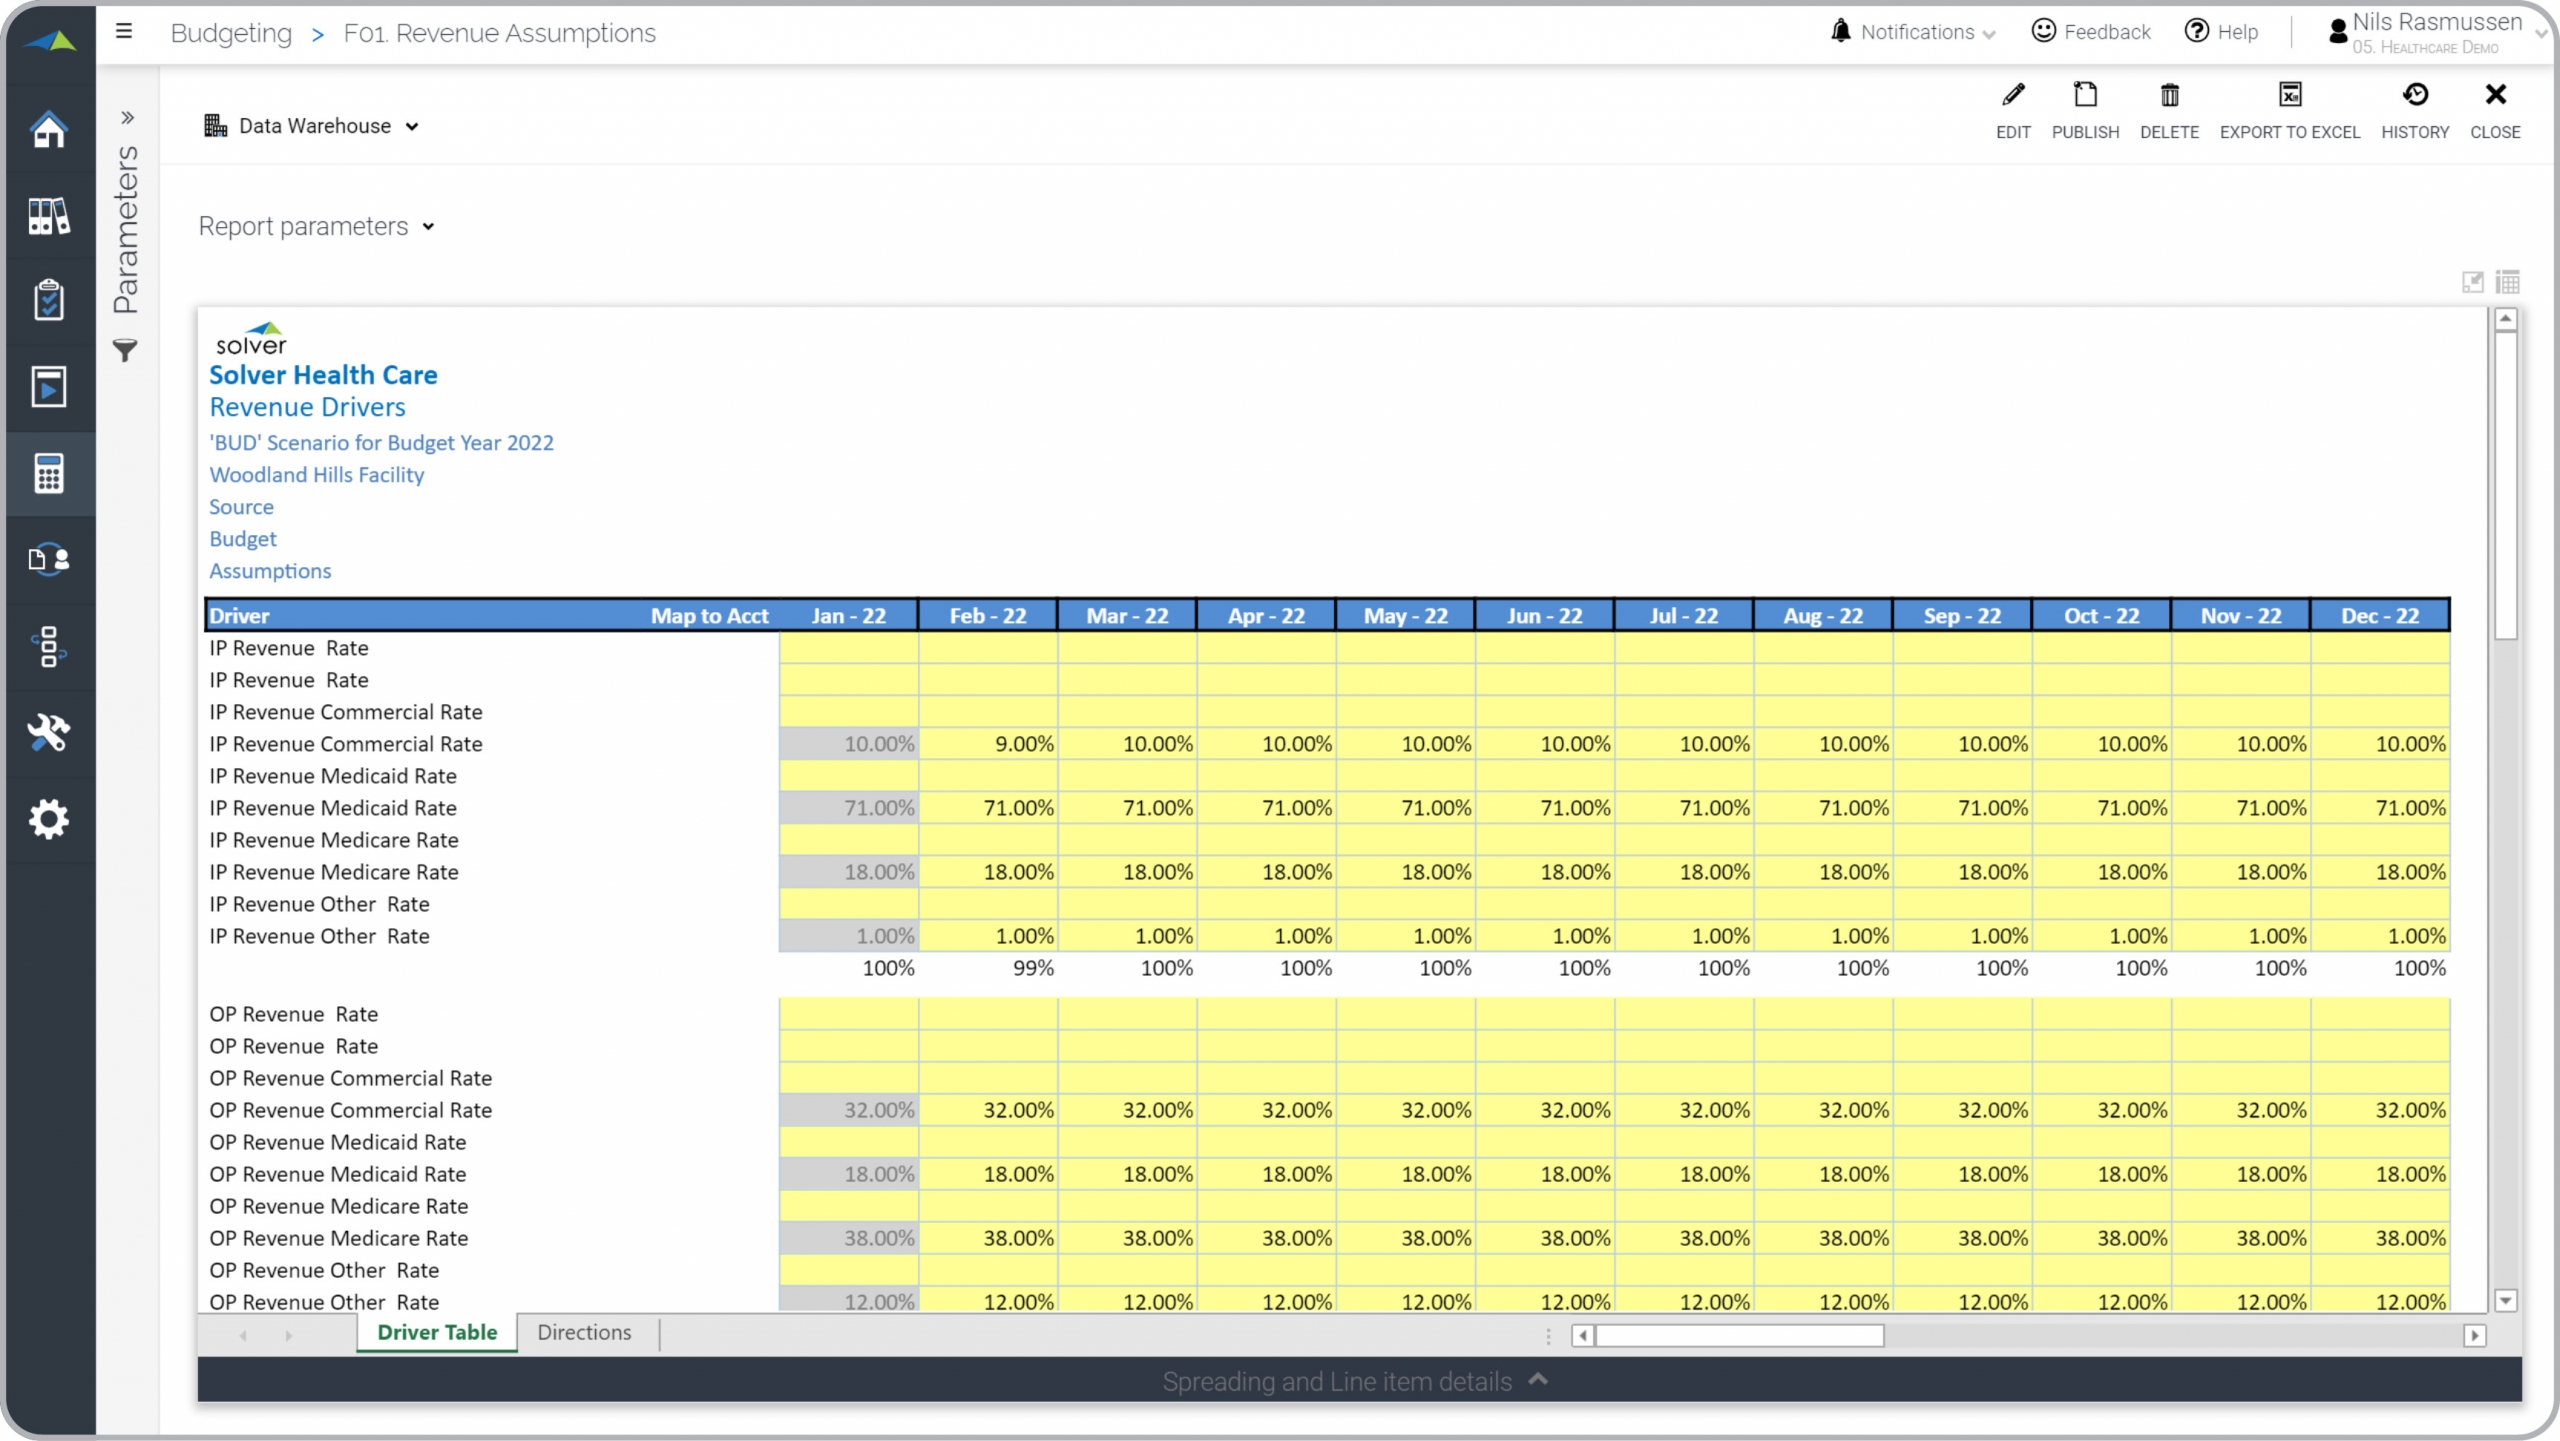
Health – Revenue Budget Assumptions
Capture healthcare revenue drivers such as different rates per patient type.
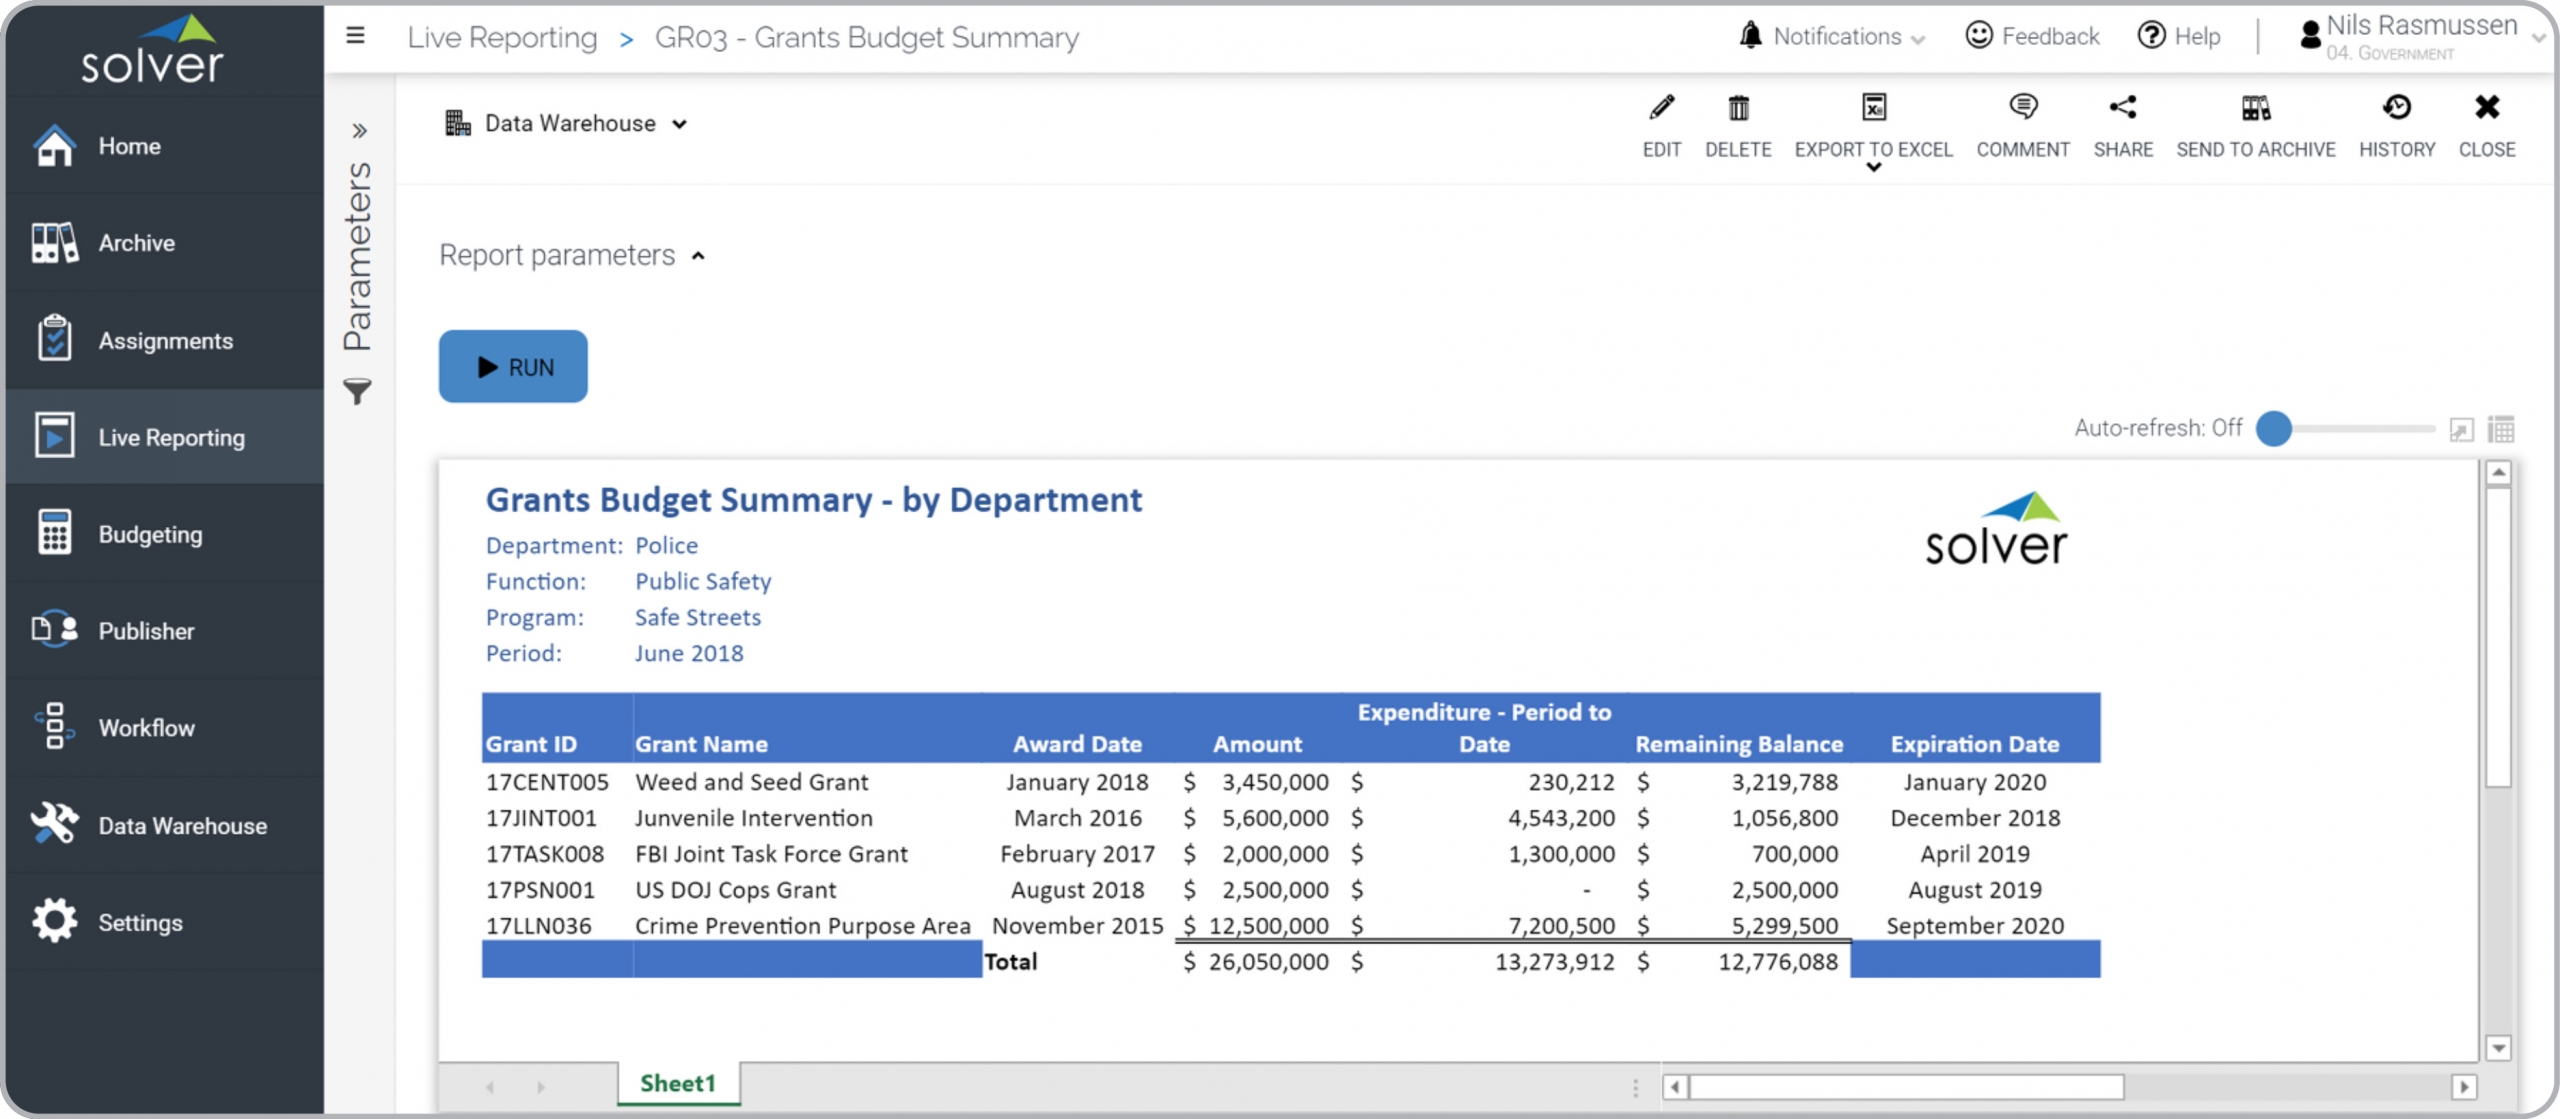
Government – Grants Budget Summary
Grants budget with remaining balance per department, function and program.
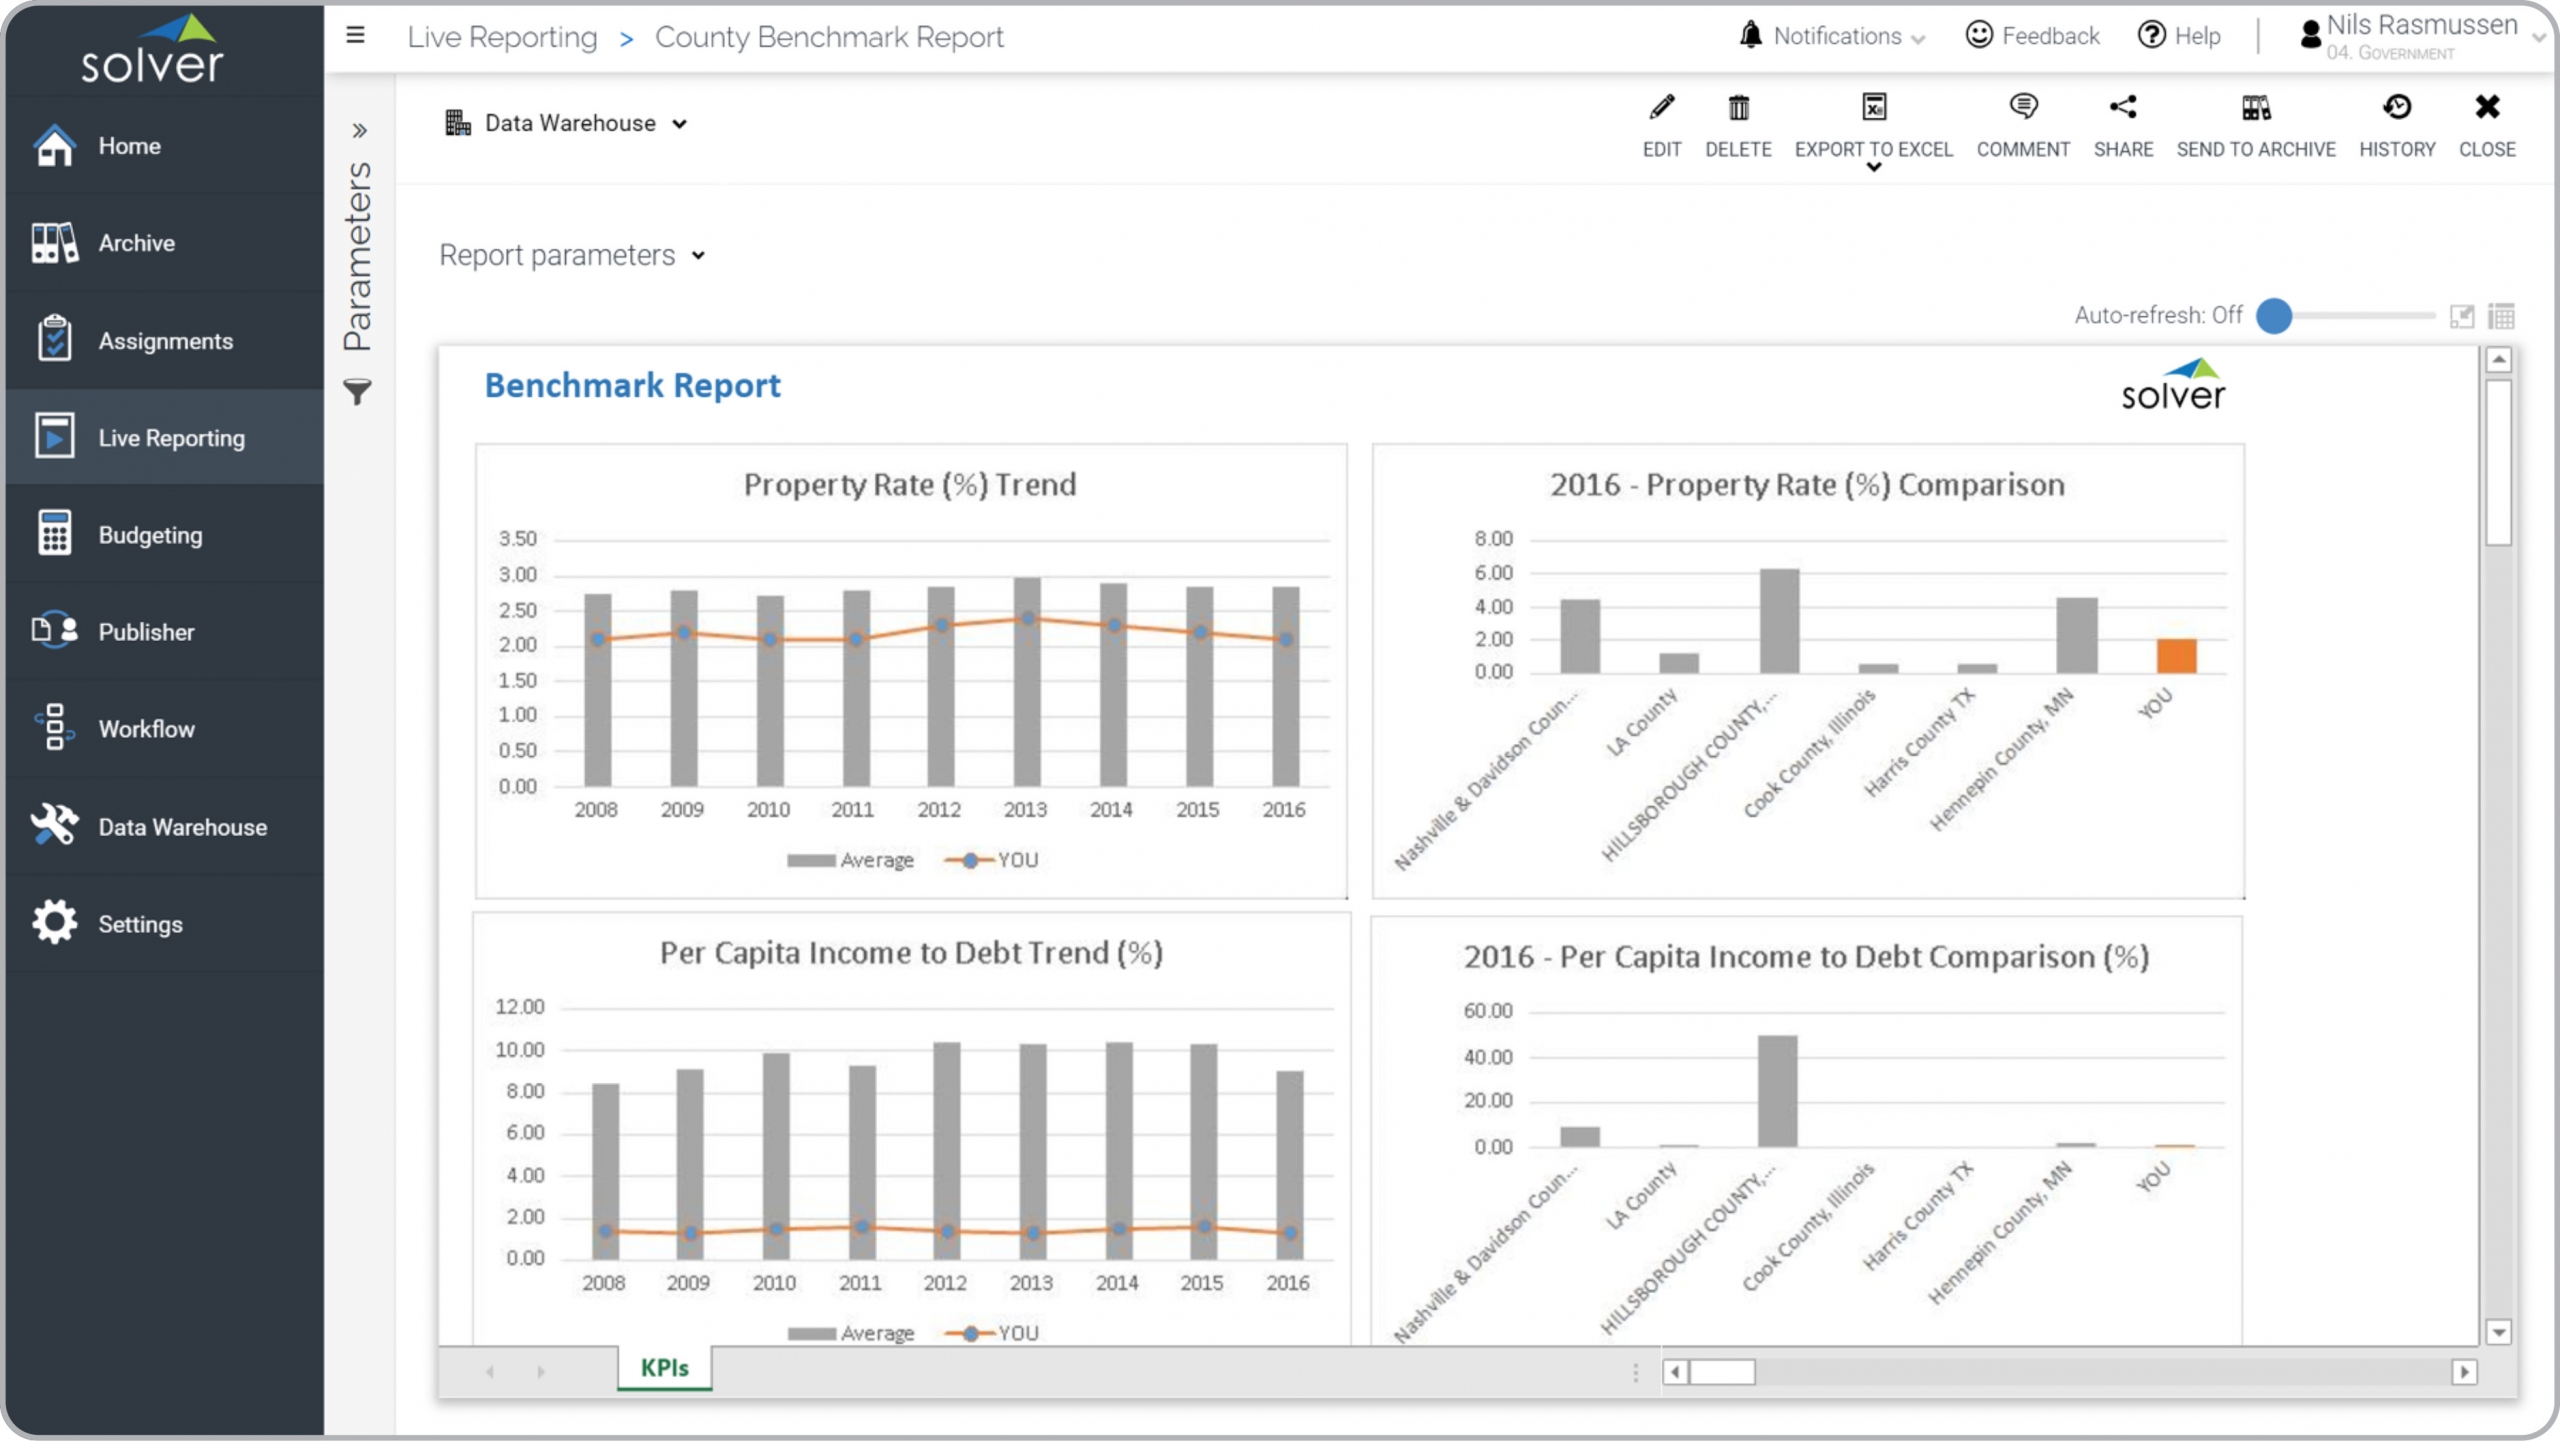
Government – KPI Benchmark Report
Compare historical actual KPIs with other selected state or local governments.
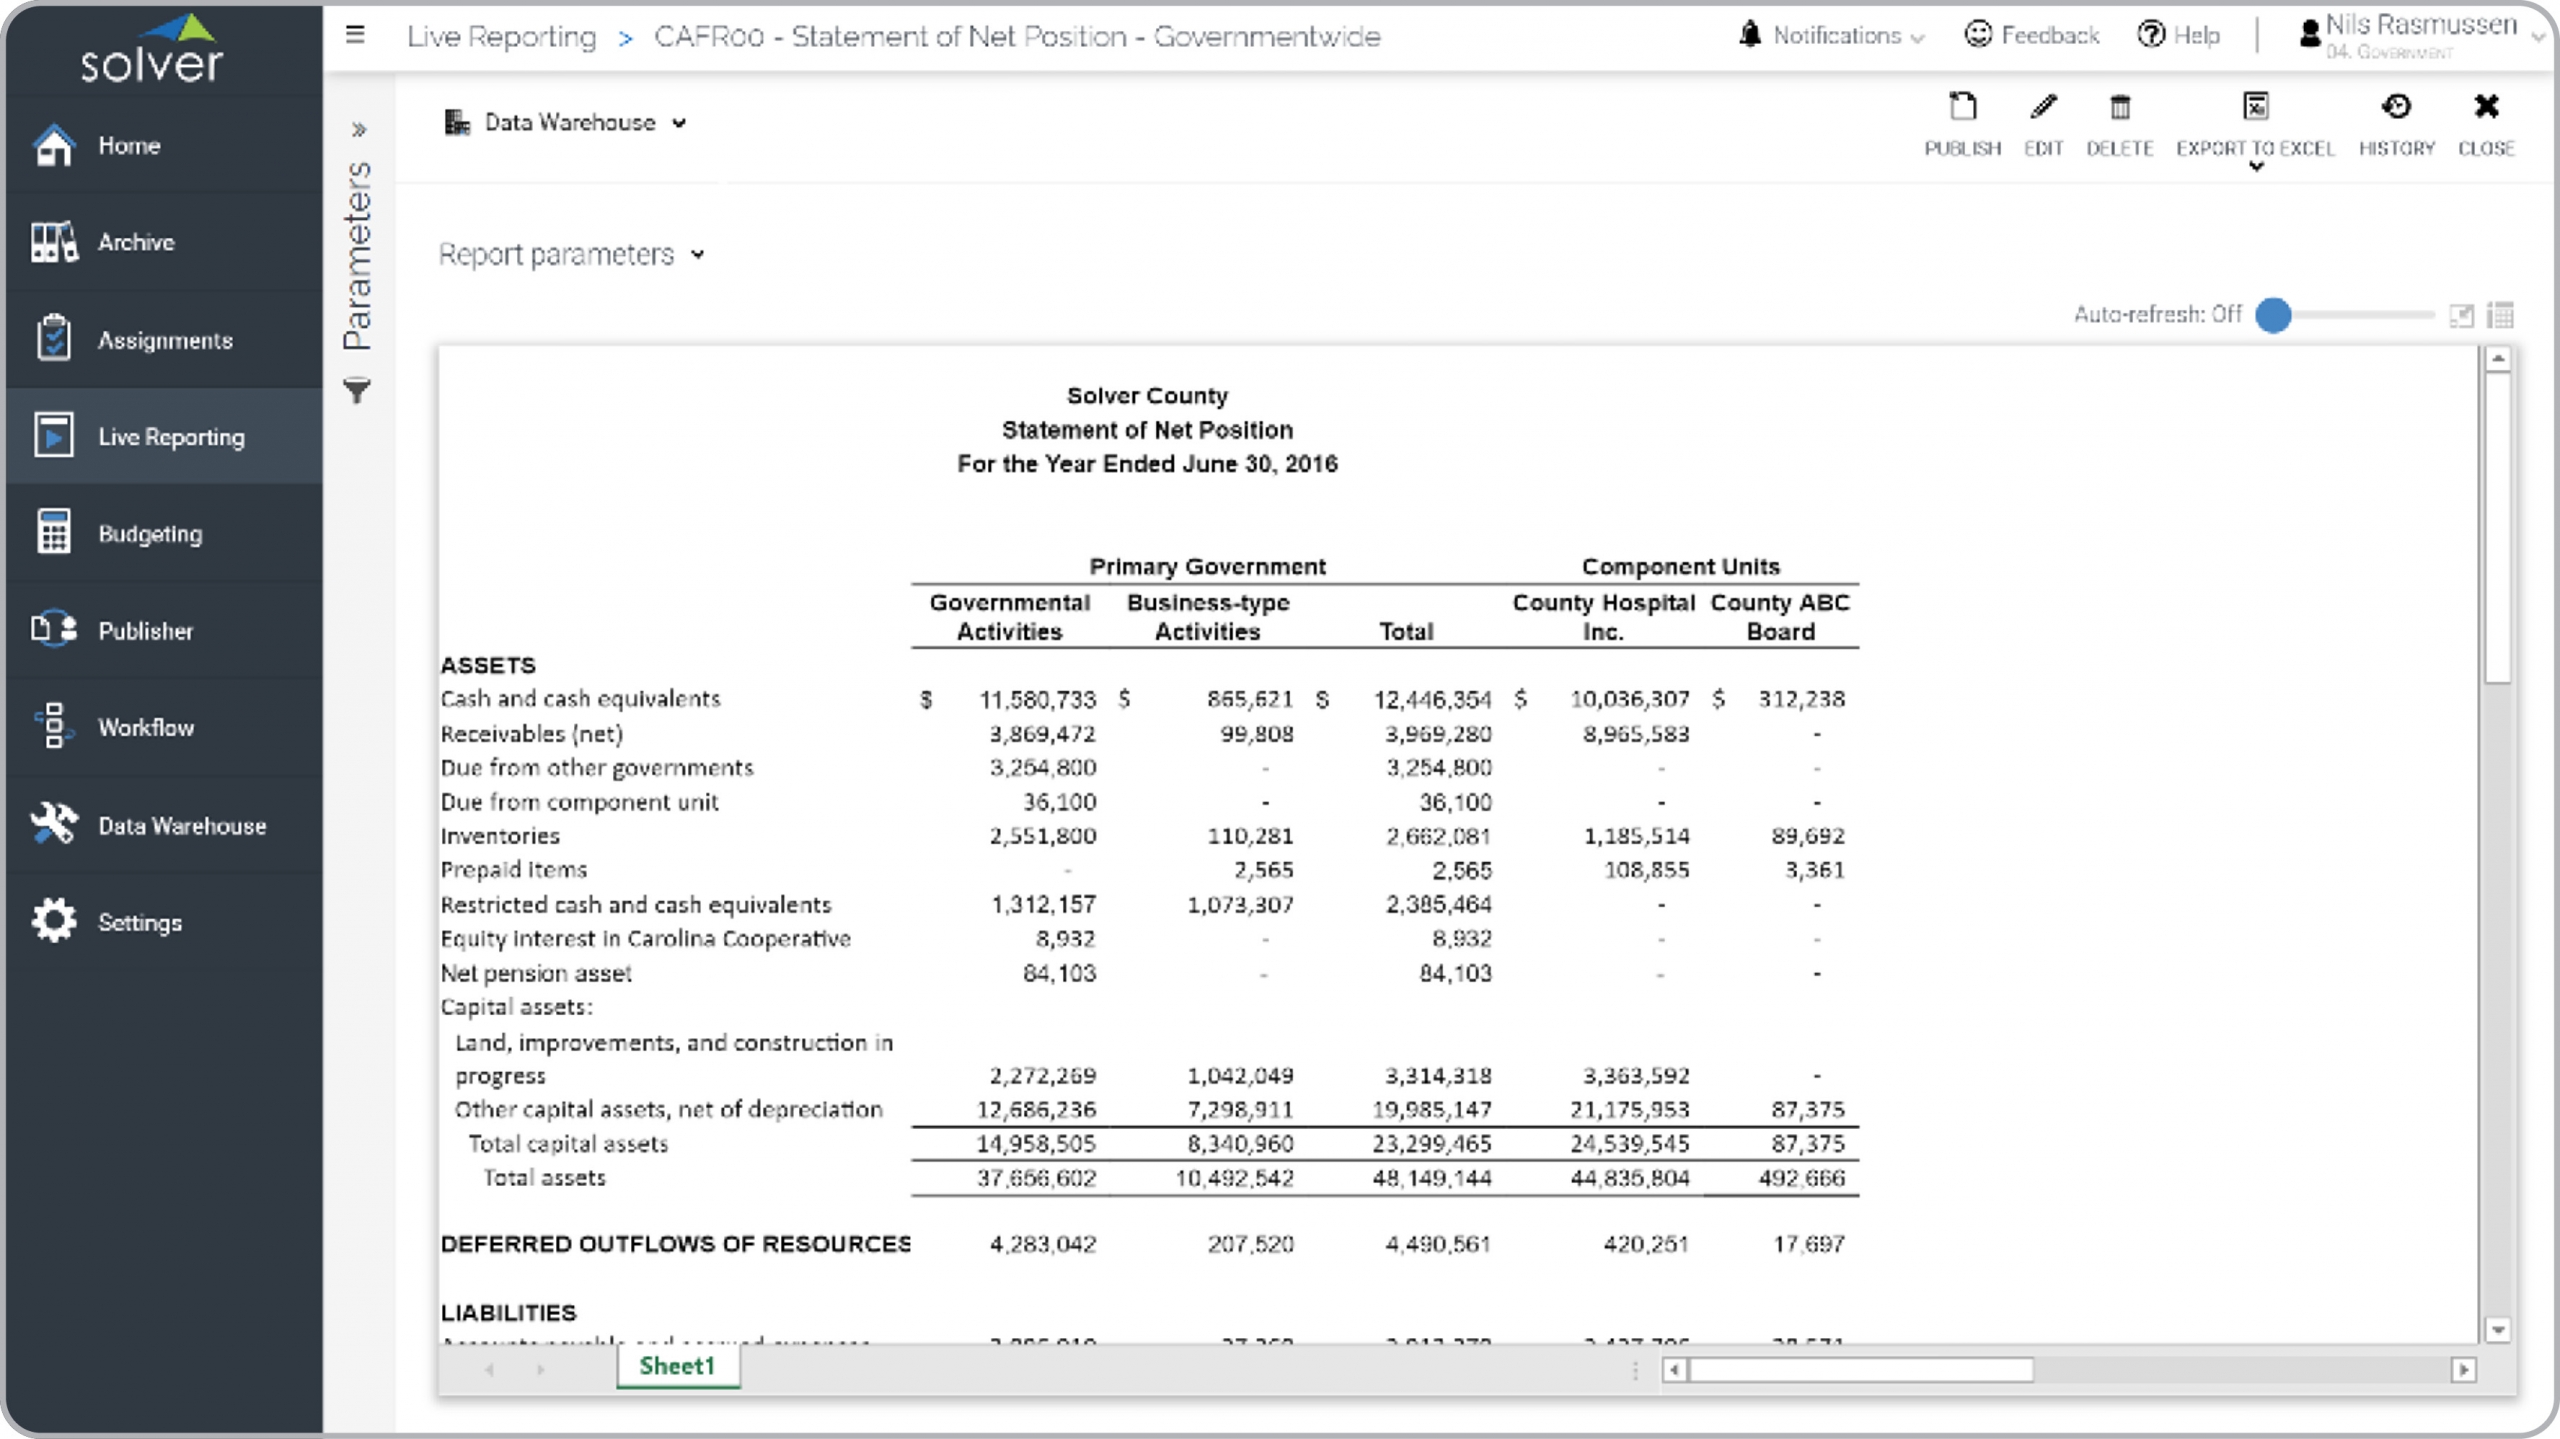
Government – CAFR – Statement of Net Position
Example of Comprehensive Annual Financial Report (CAFR).
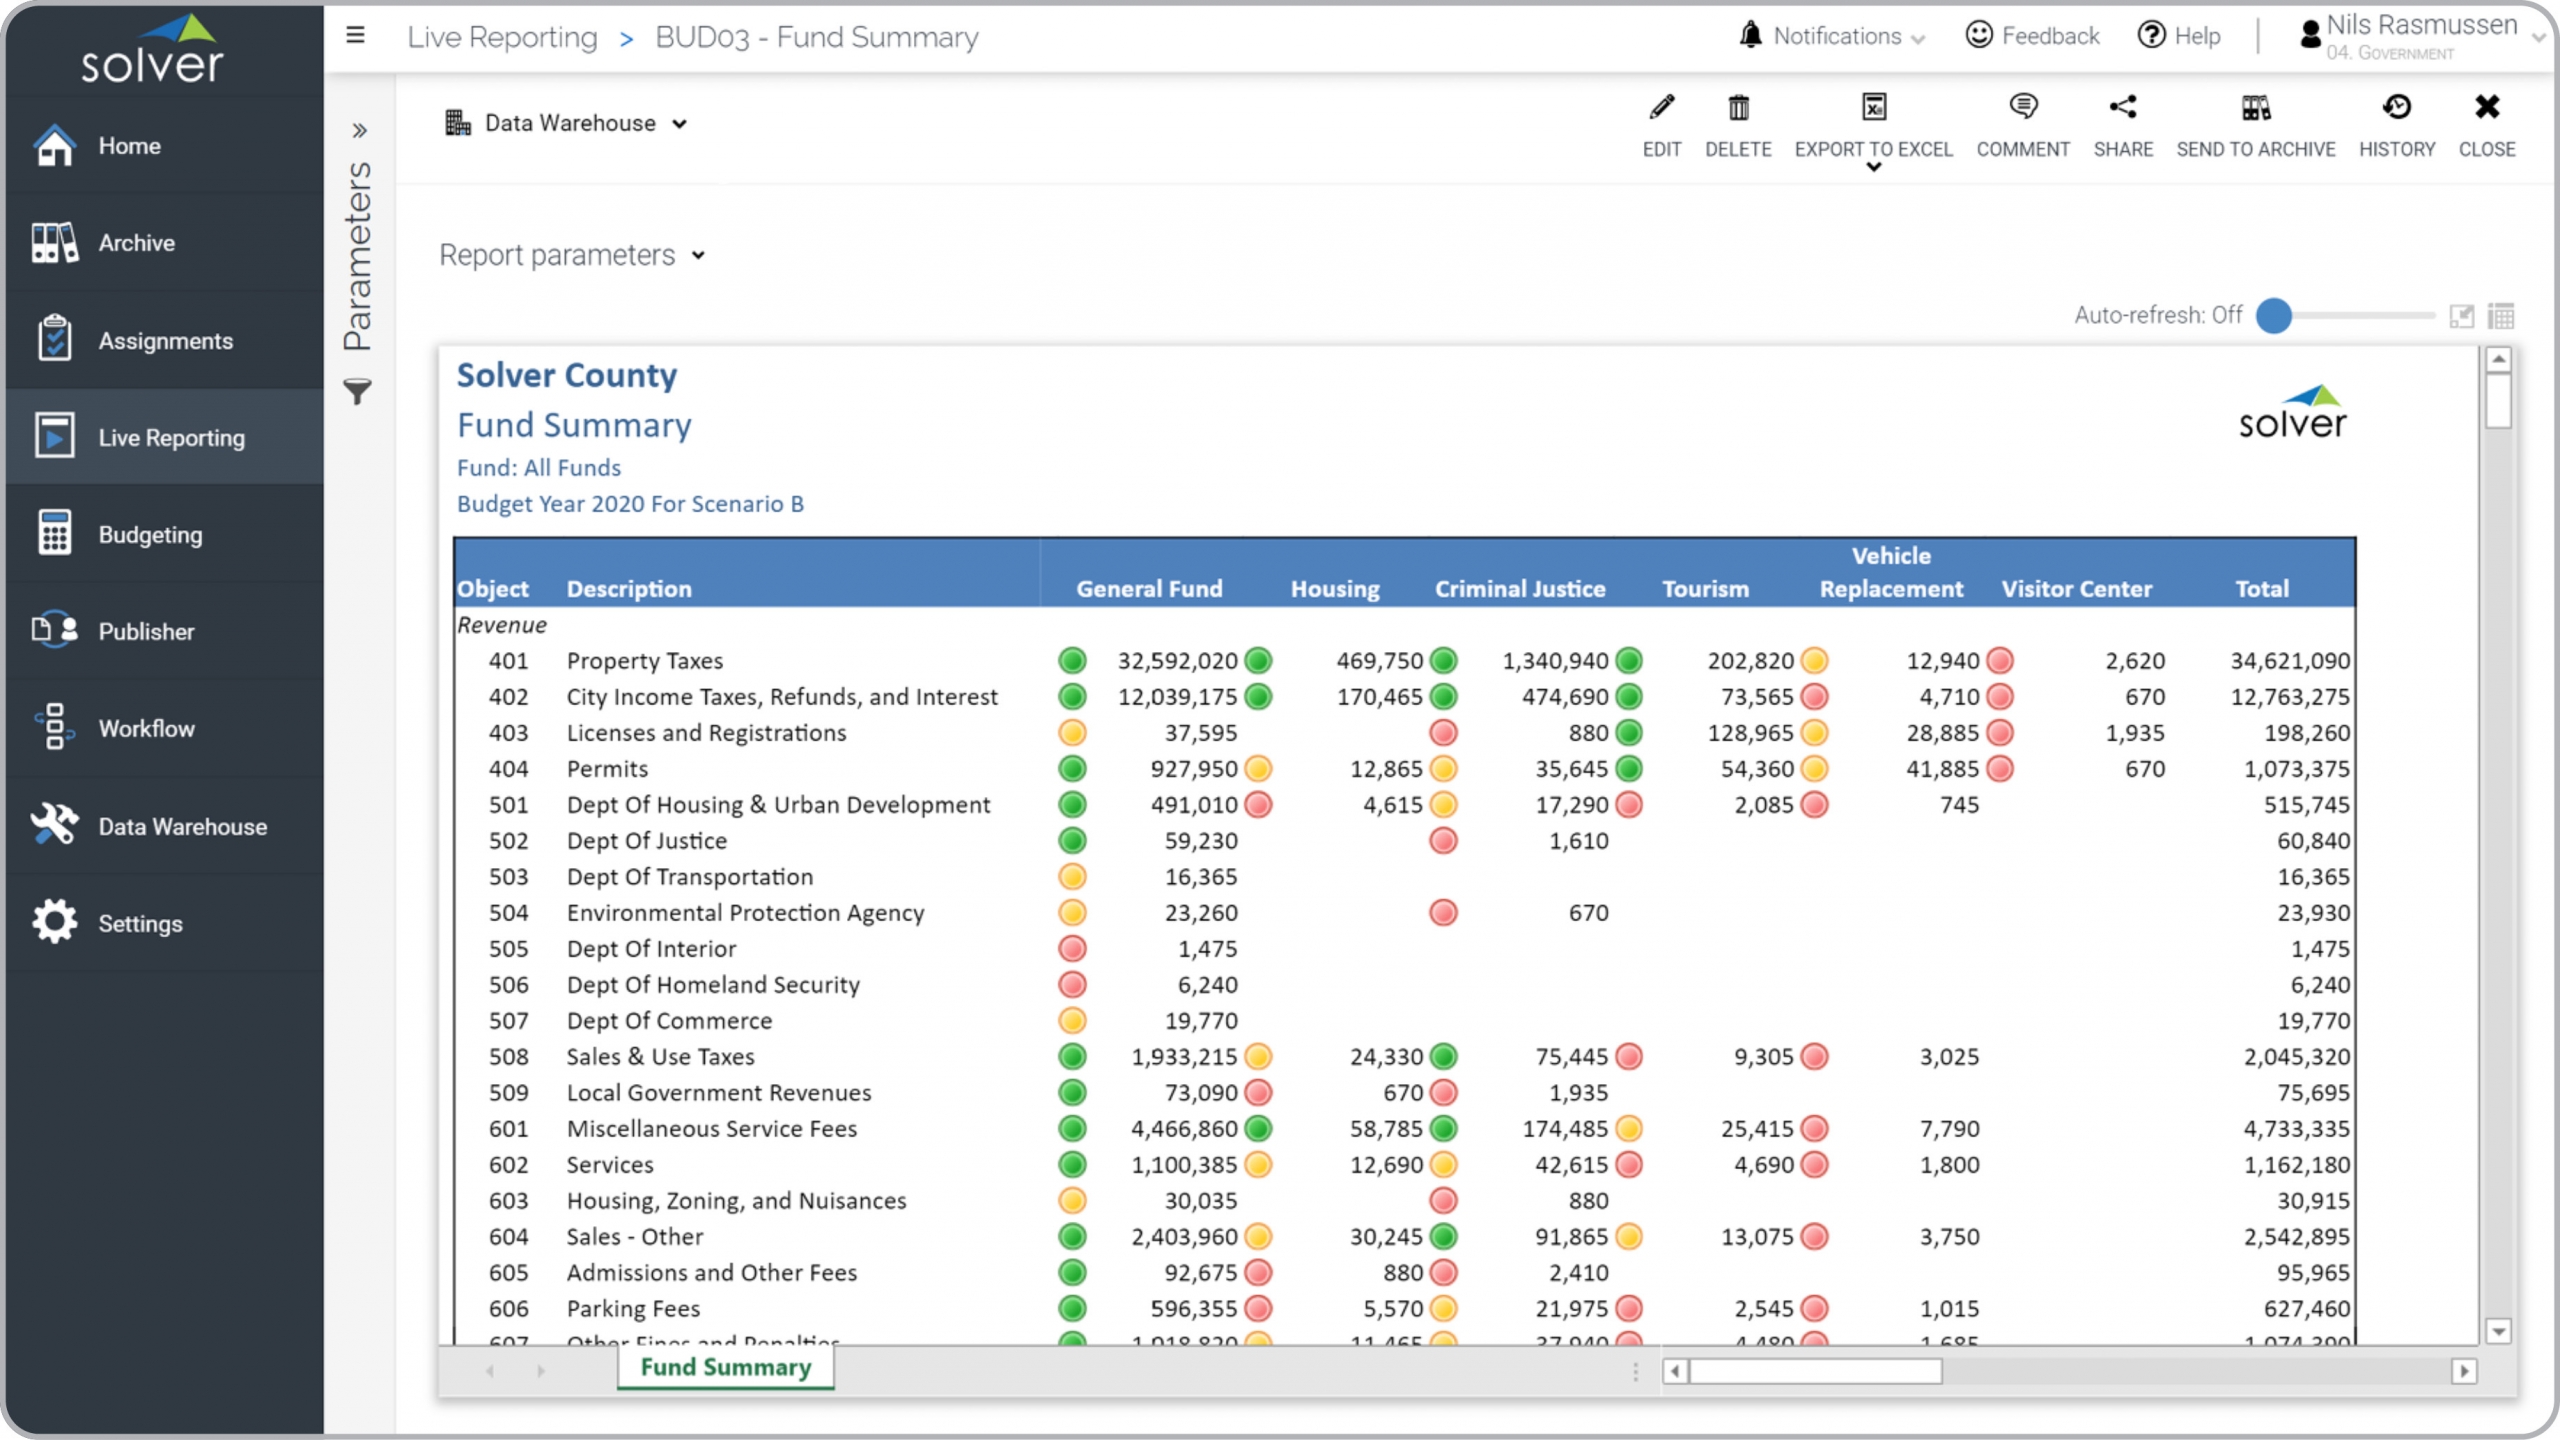
Government – Fund Summary
Compare revenues and expenses with Funds listed side-by-side in the columns.
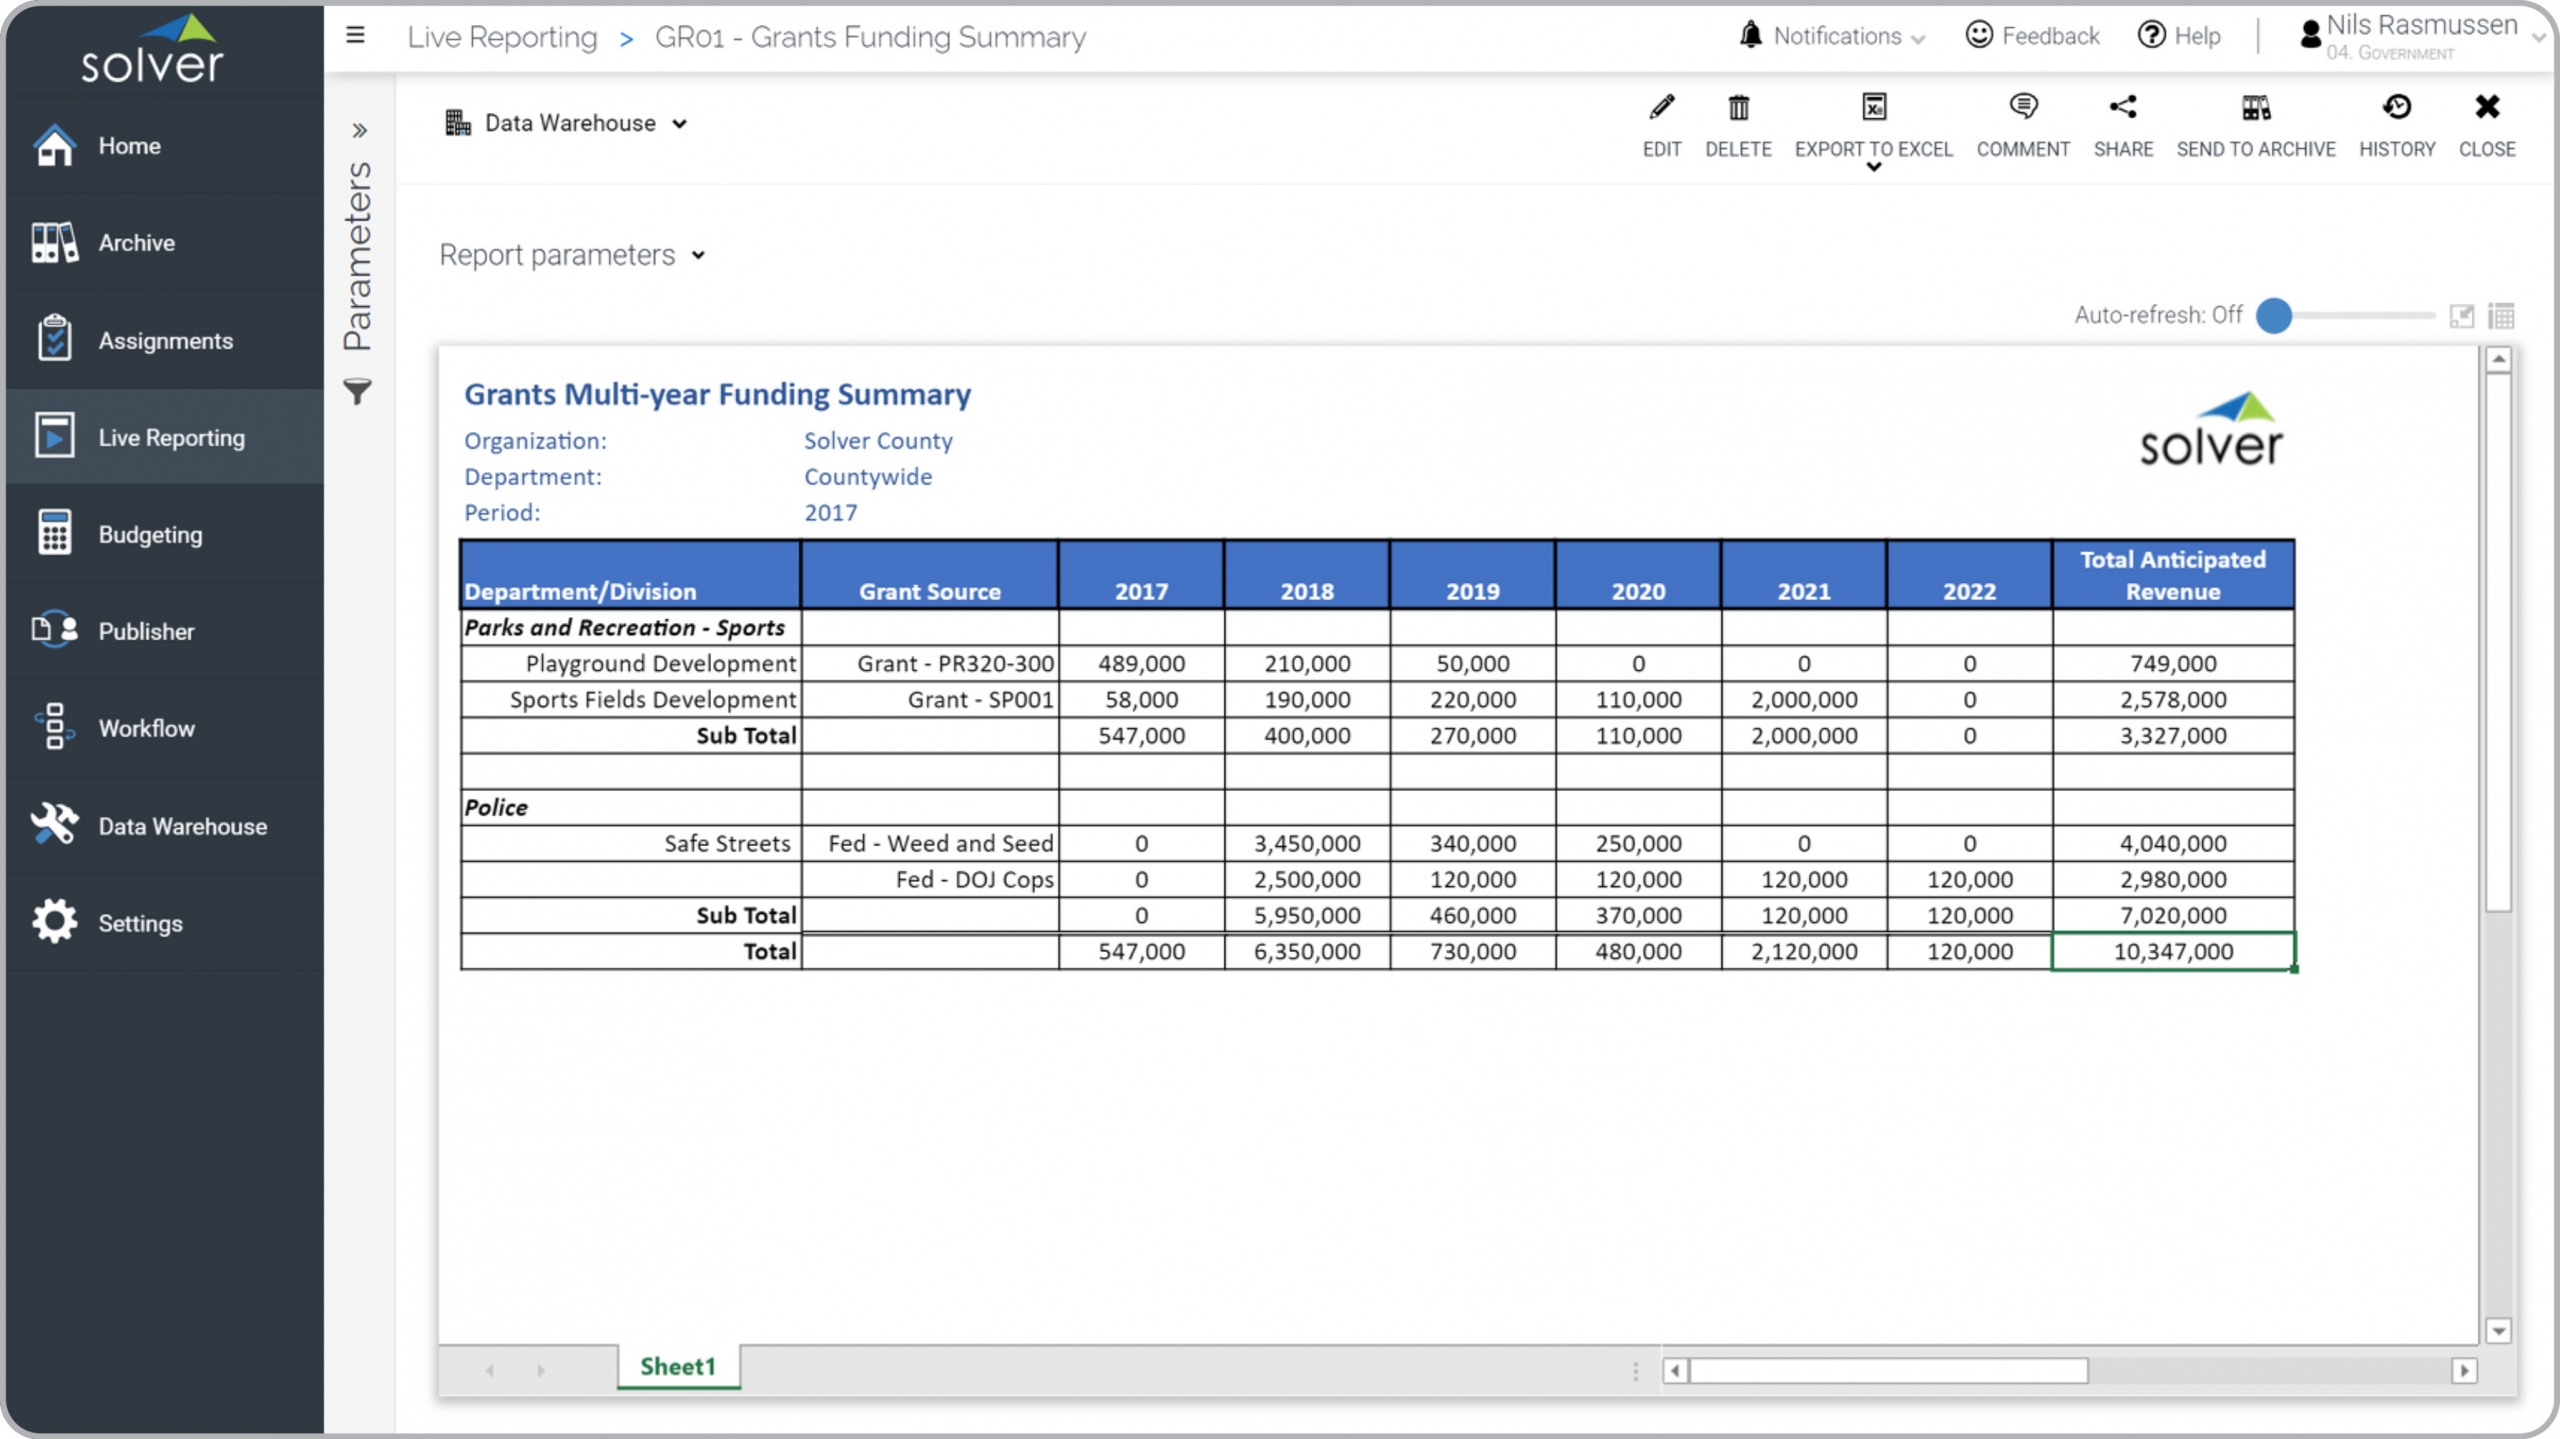
Government – Grants Funding Summary
Shows anticipated funding per Grant over many years.
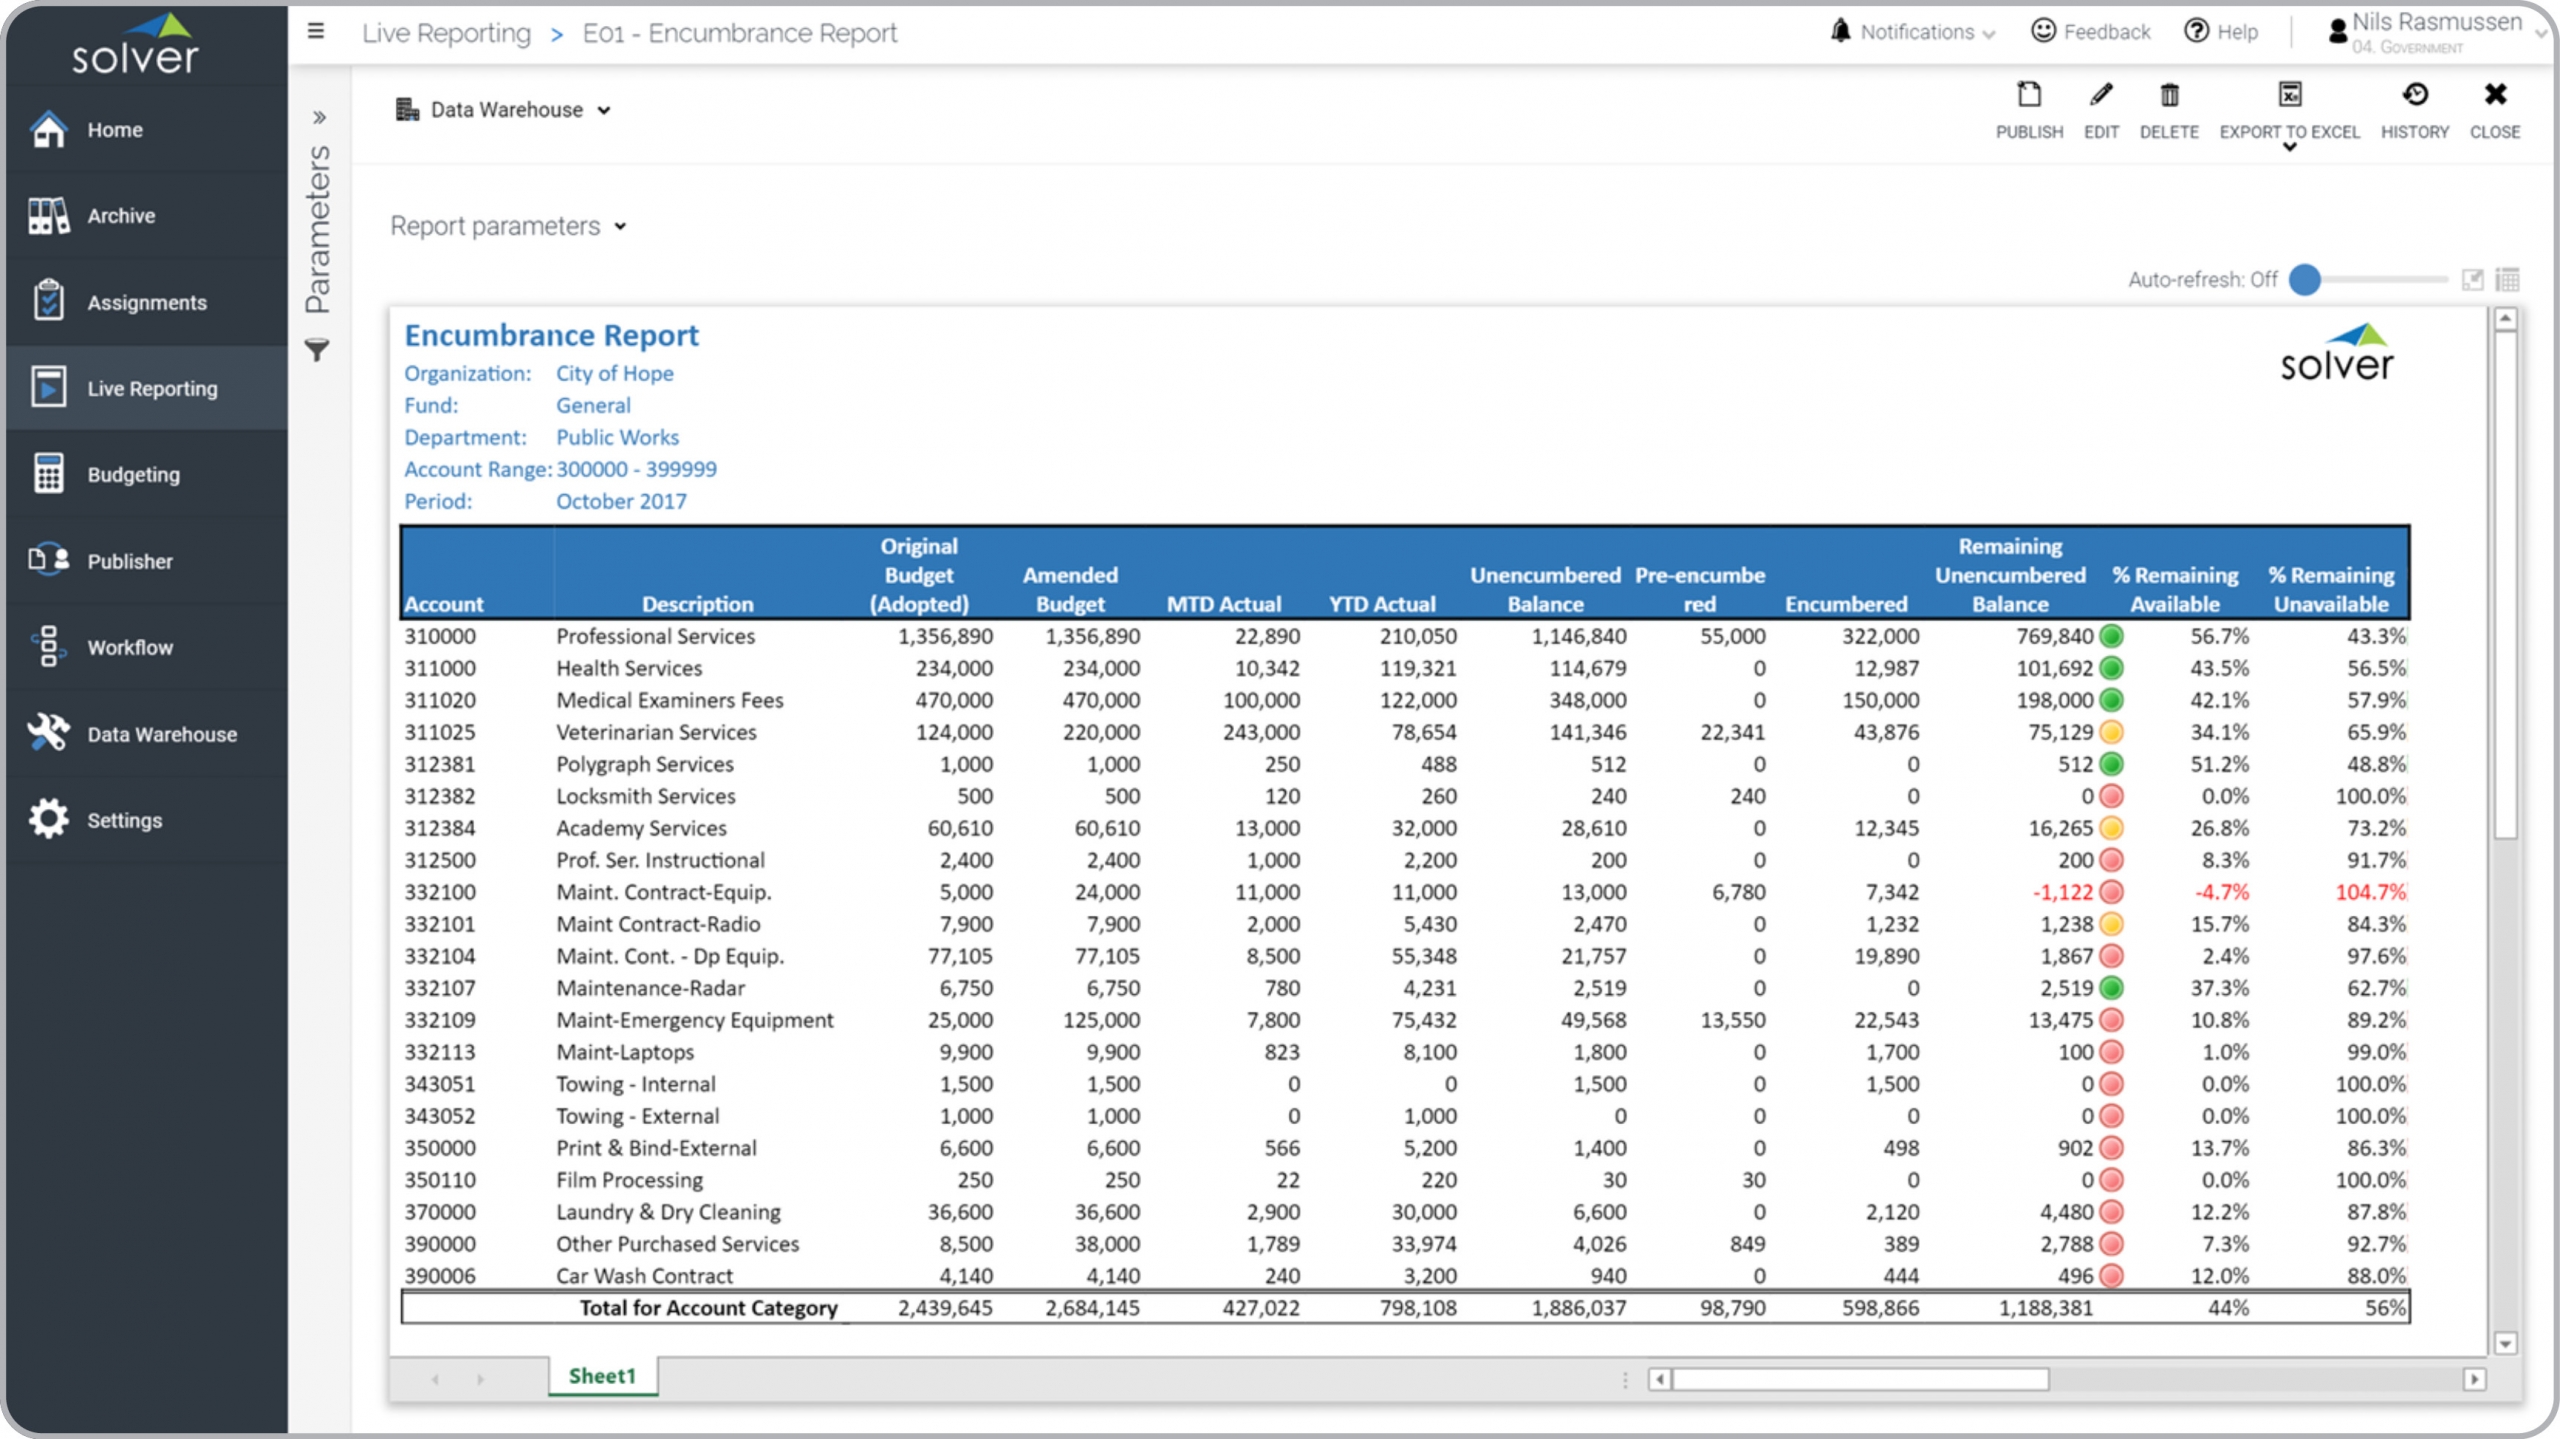
Government – Encumbrance Report
Encumbrance report by Account Category, including view of available funds.
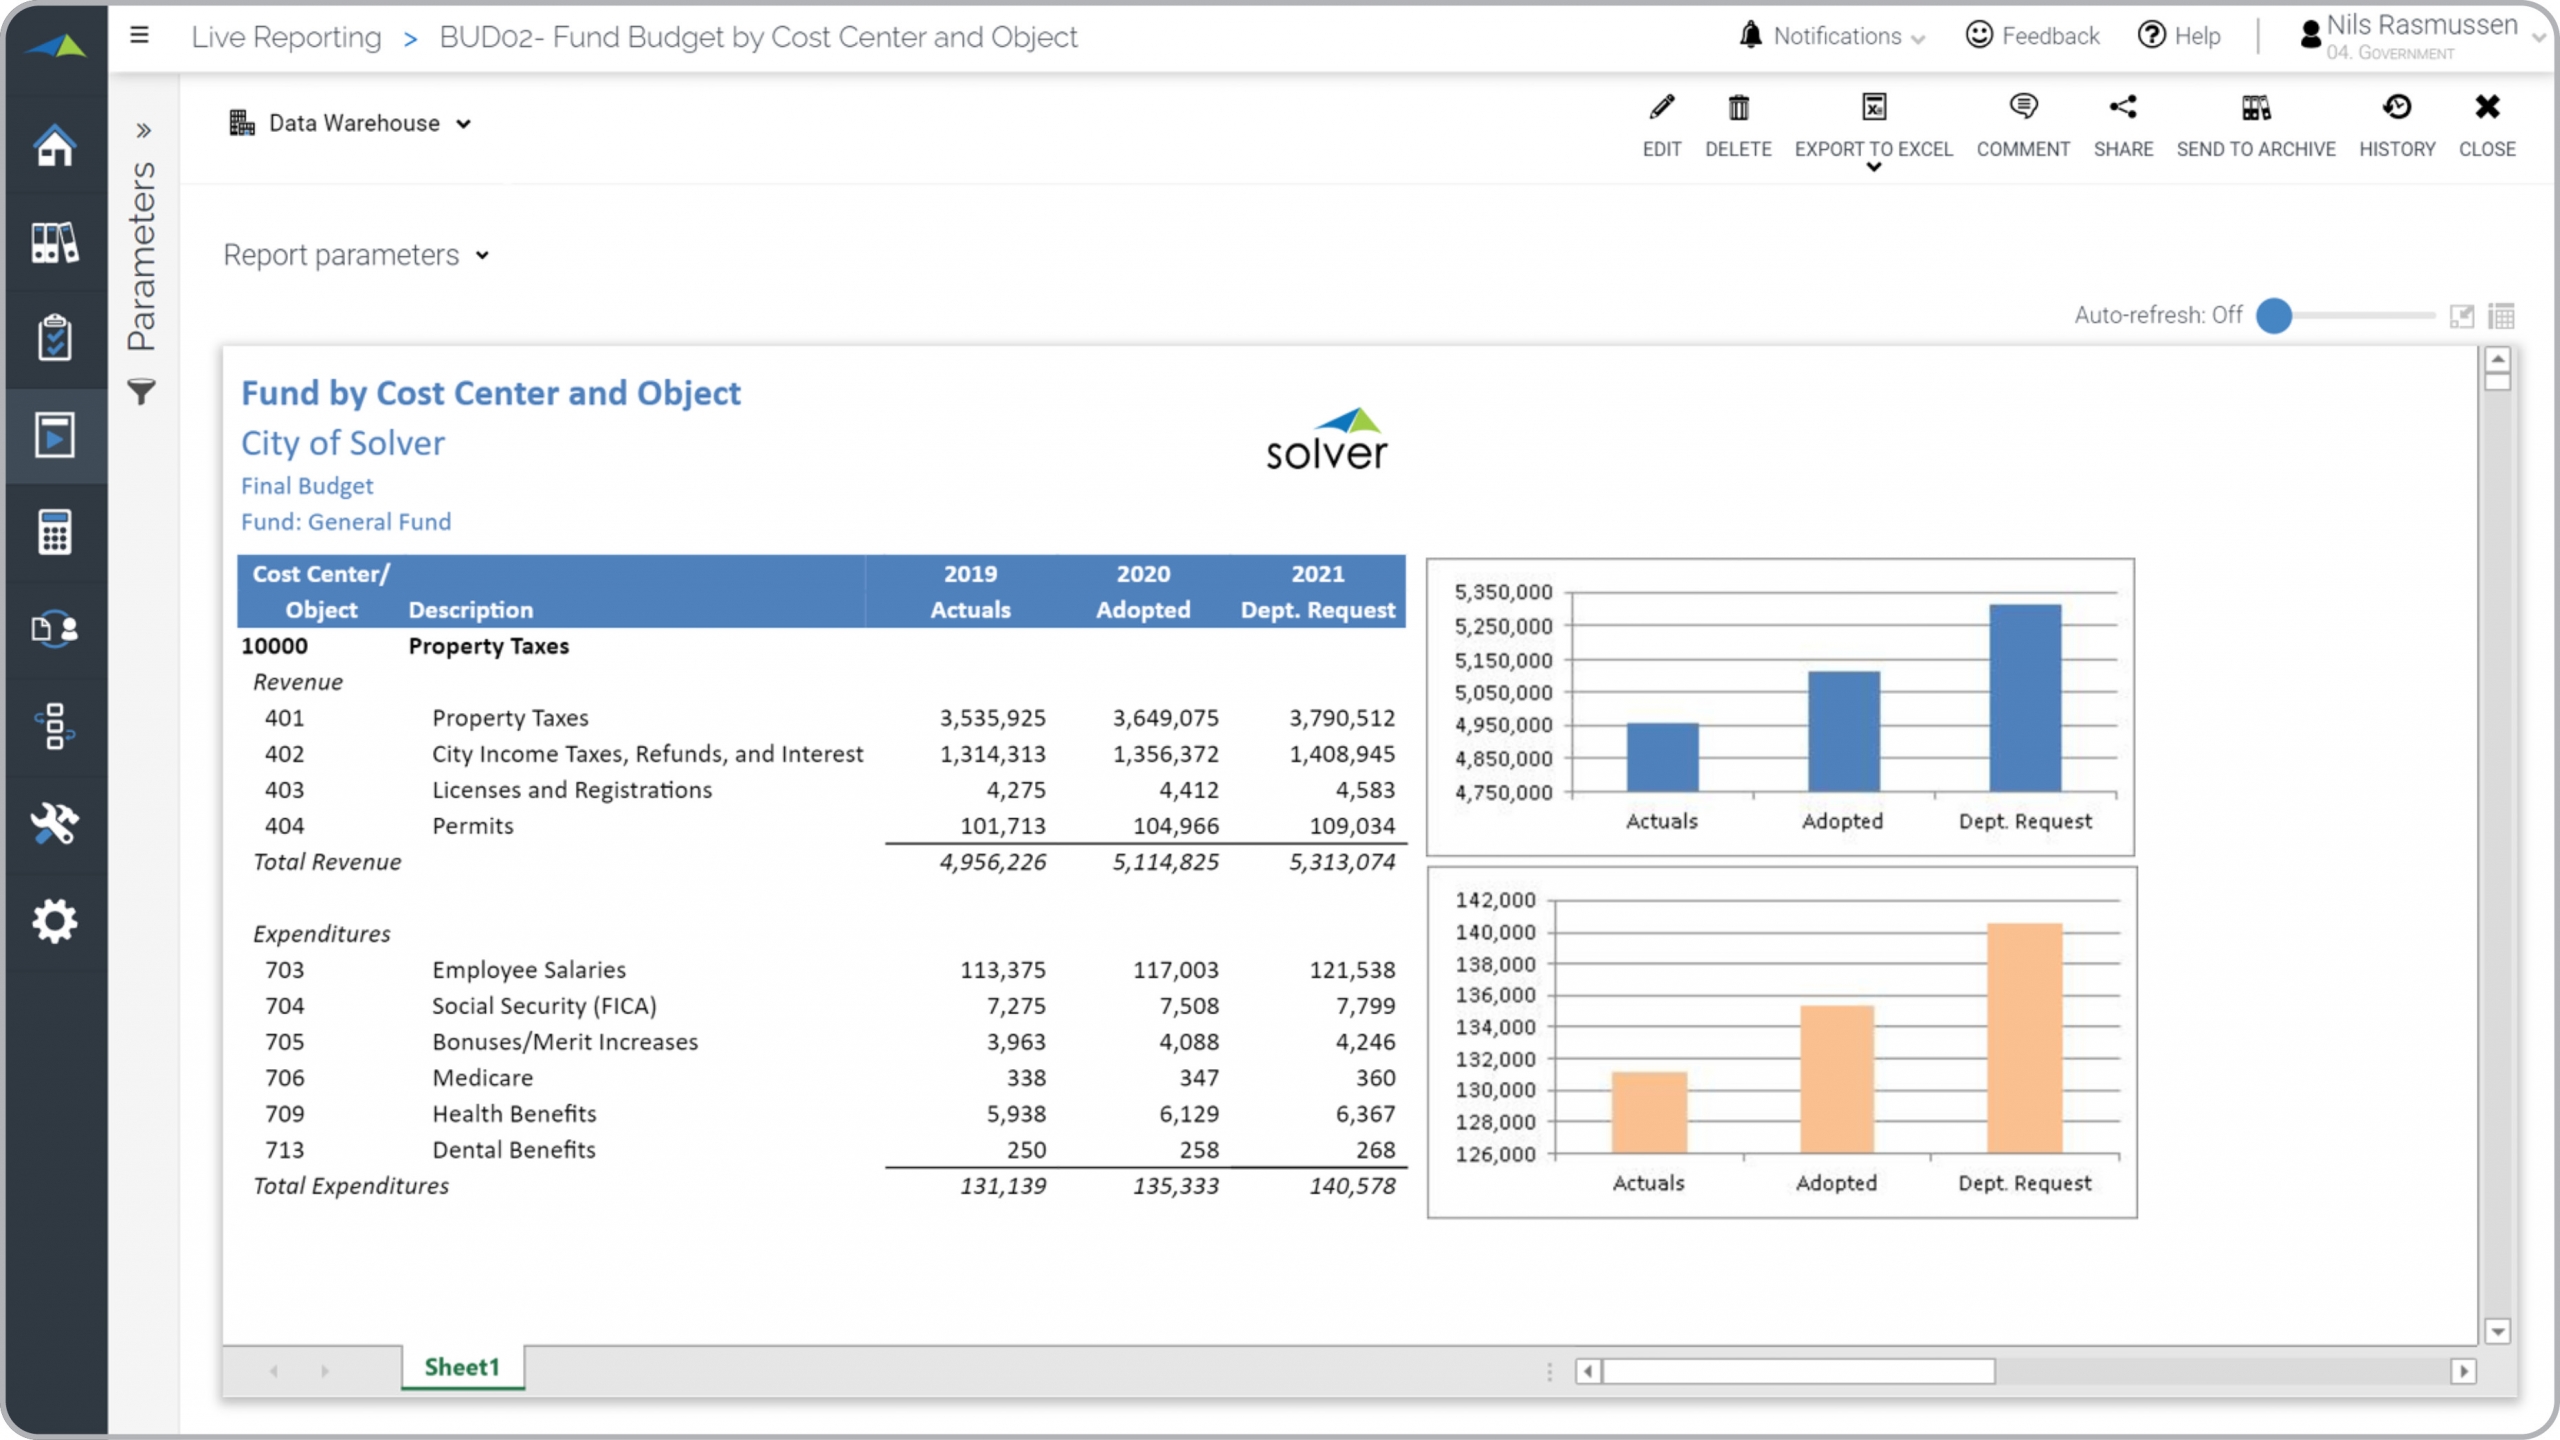
Government – Fund by Cost Center
Analyze actual and budgeted revenues and expenses by Fund and Object (account).
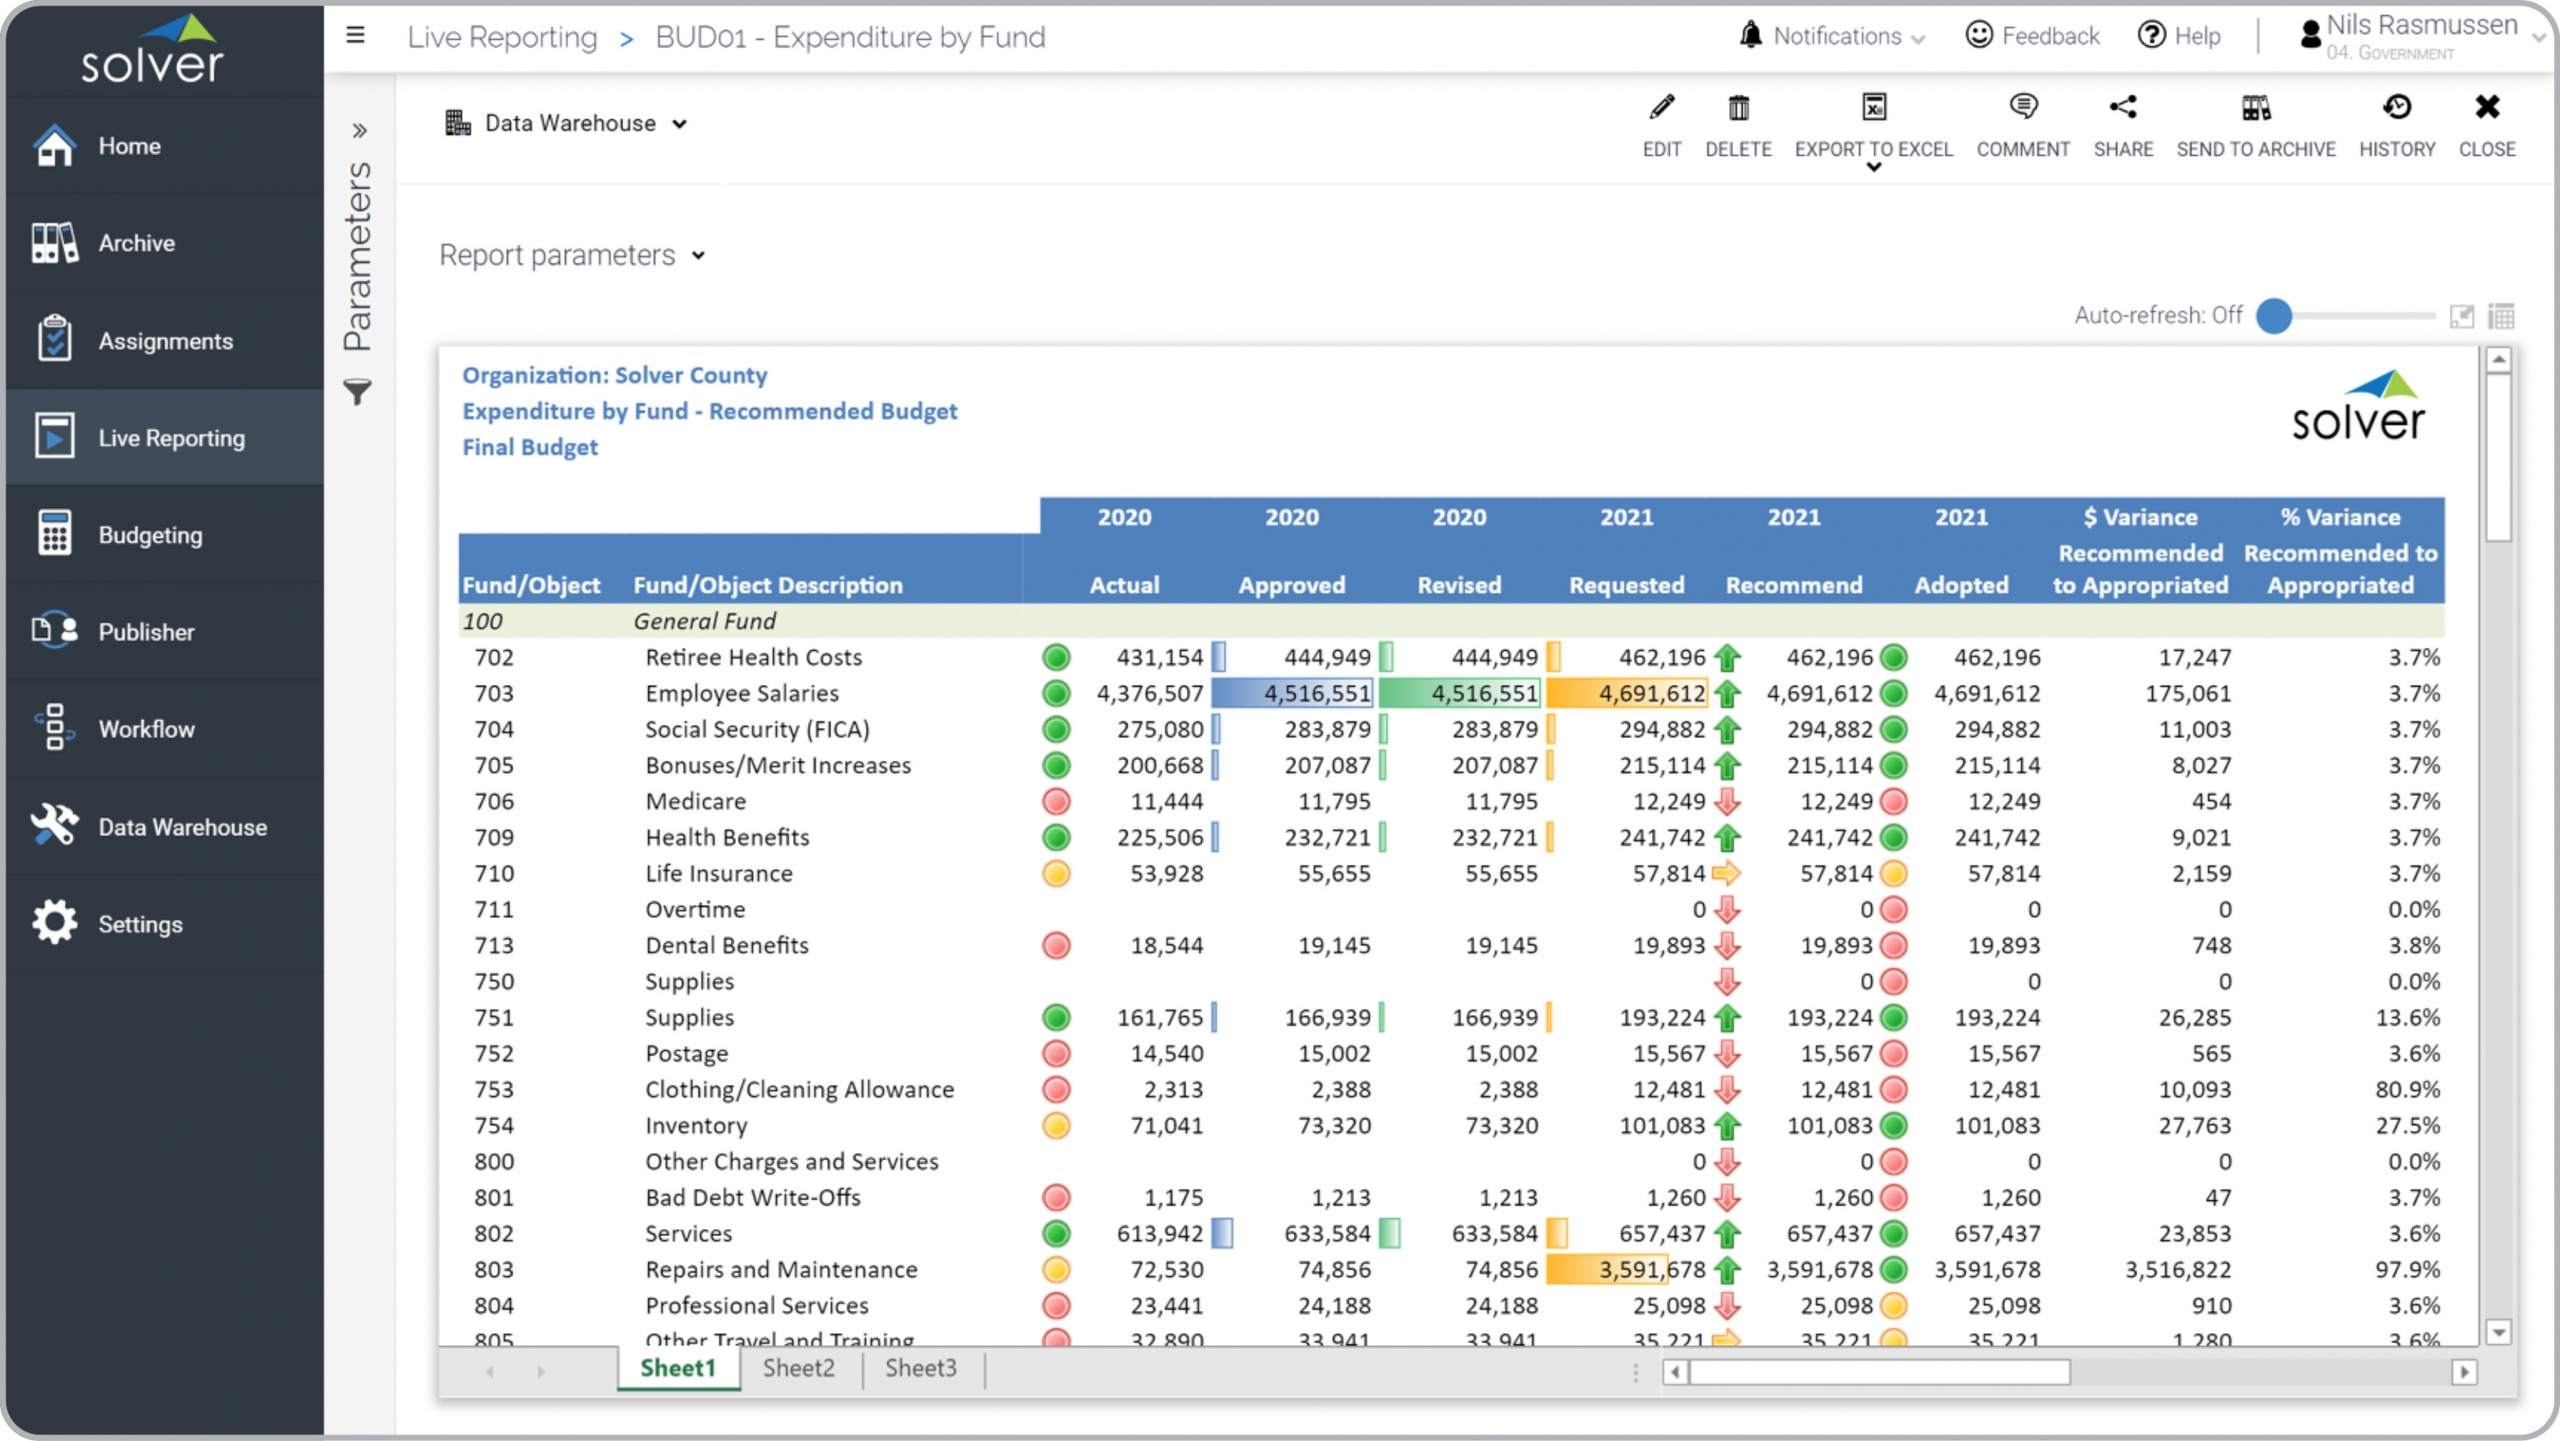
Government – Expenditure by Fund
Analyze history and compare requested, recommended and adopted budget.
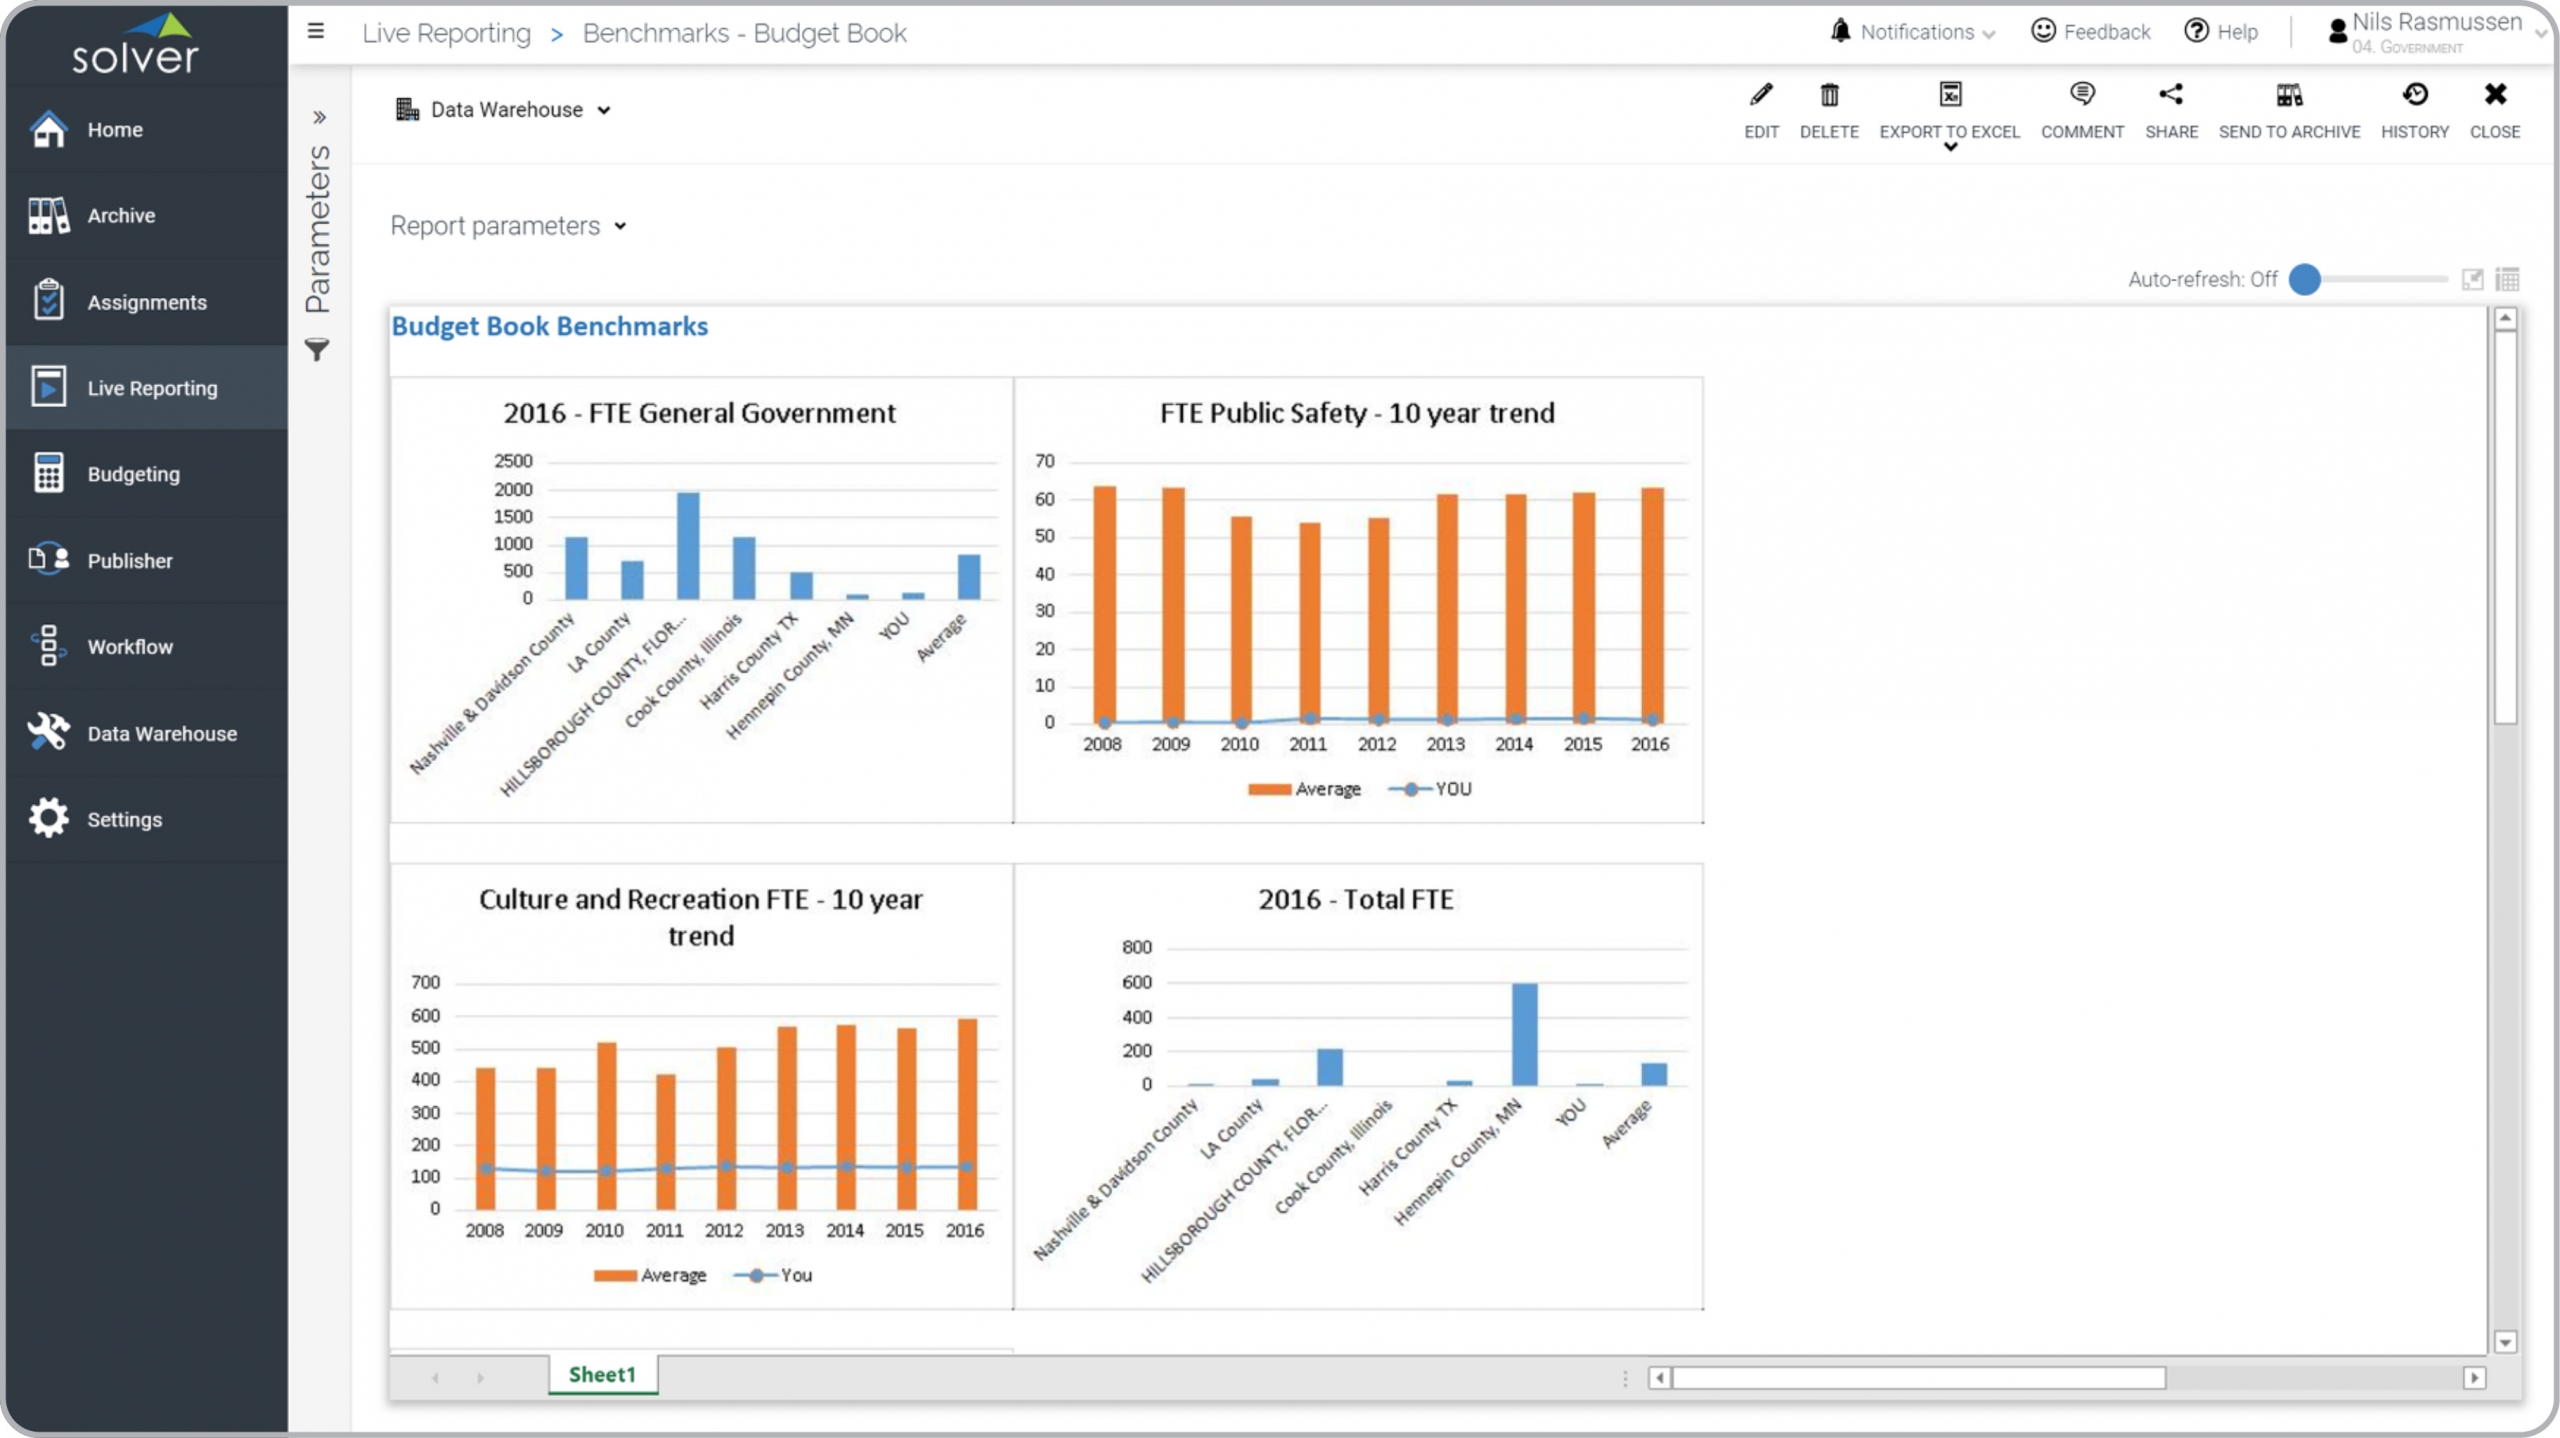
Government – Budget Benchmarks
Compare the budget KPIs to the average of other public sector organizations.
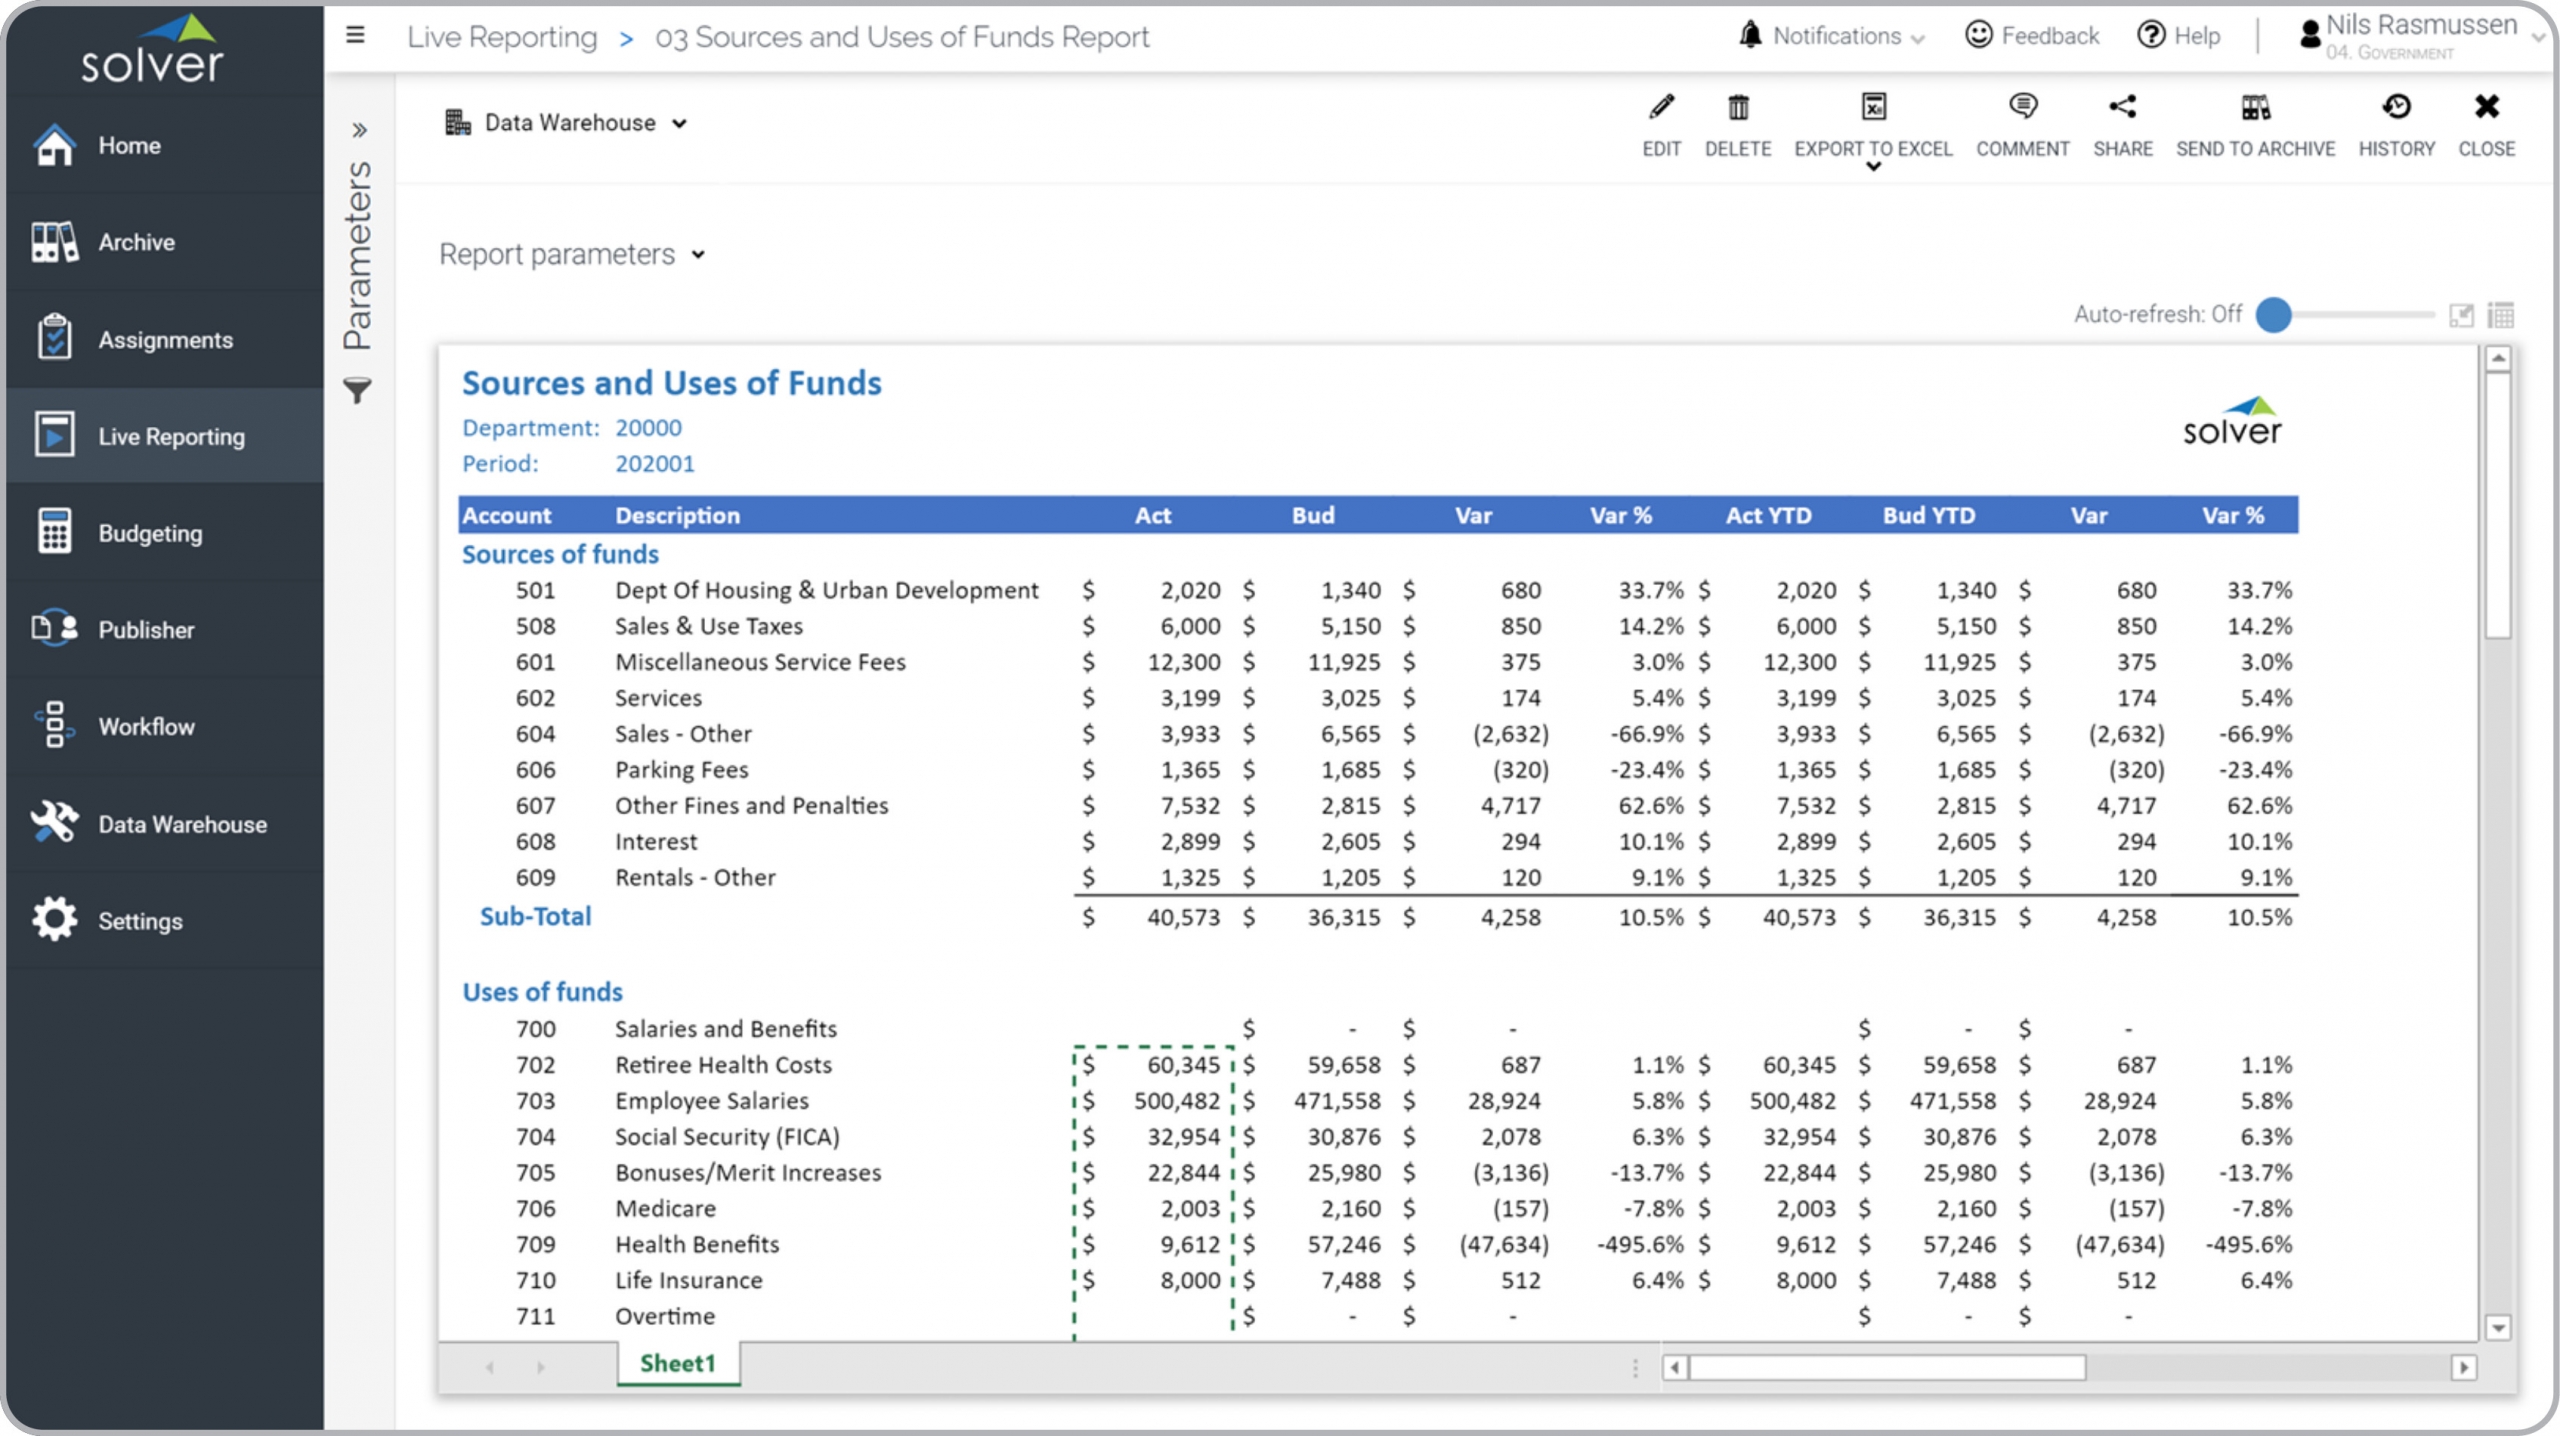
Government – Sources and Uses of Funds
View sources and uses of funds by account category and compare actual to budget.
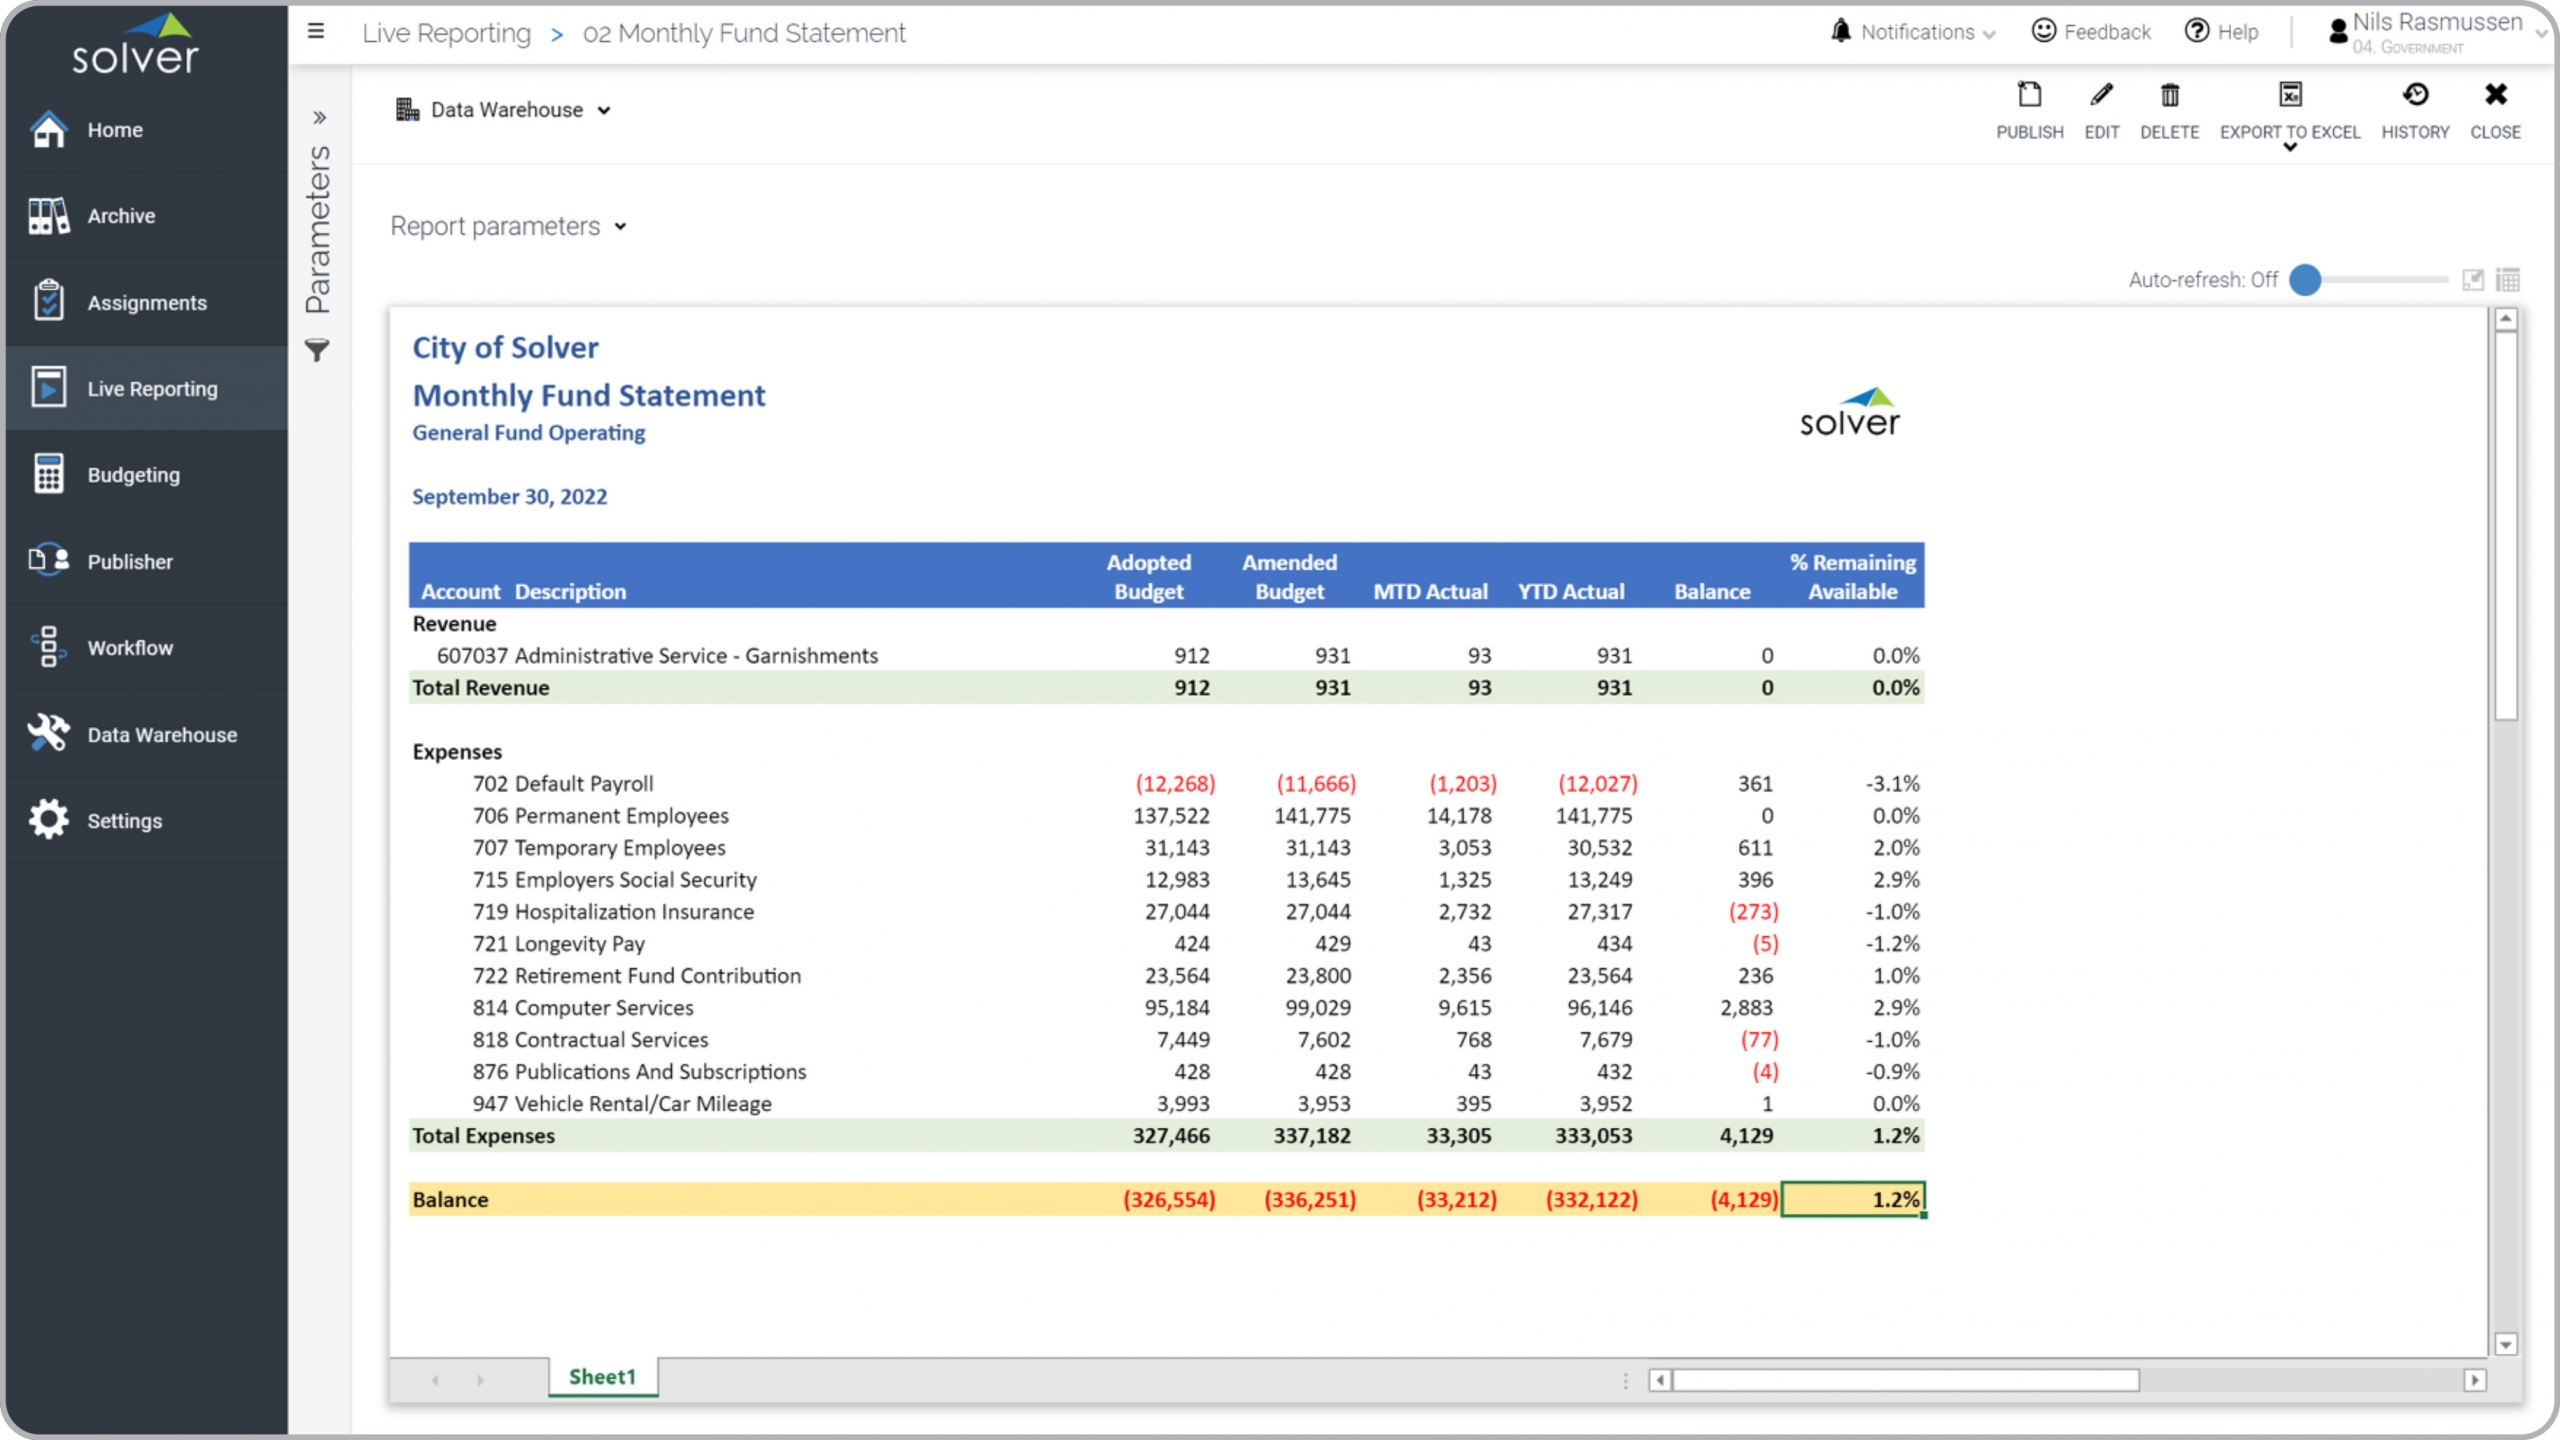
Government – Monthly Fund Statement
View revenues and expenses for a selected fund and compare actual to budget.
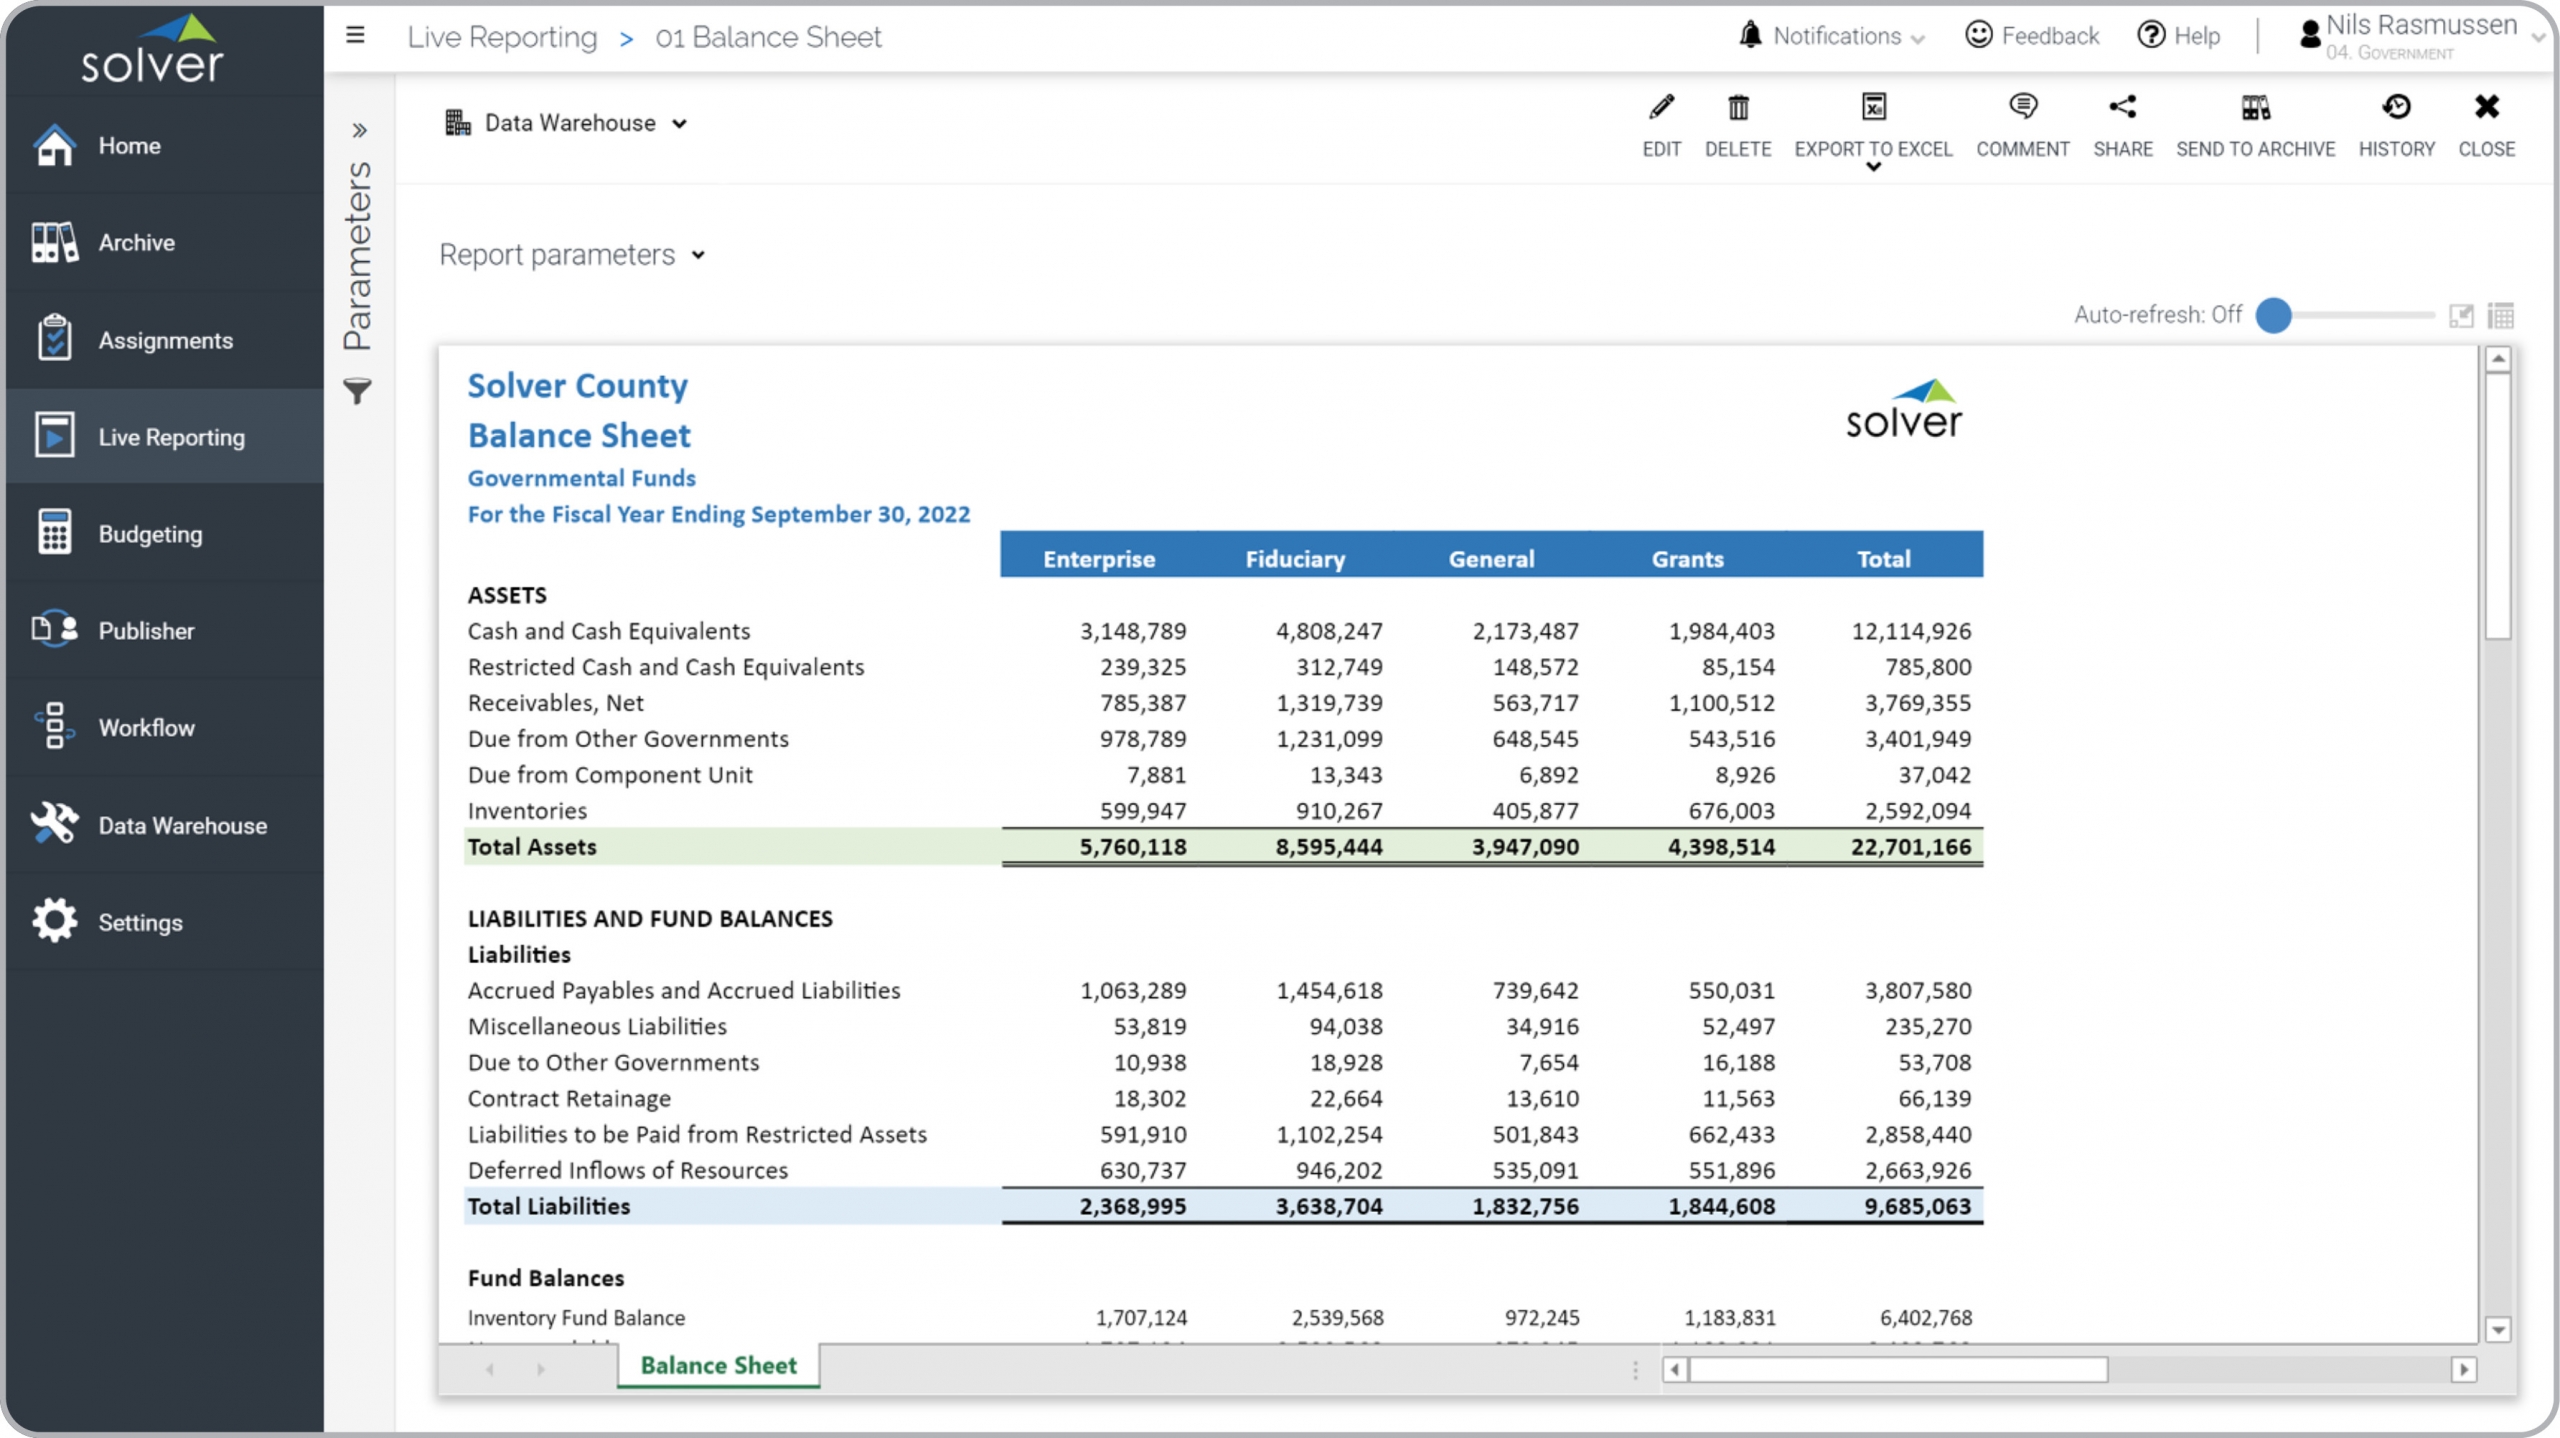
Government – Balance Sheet by Fund
View Balance Sheet and compare assets and liabilities by Fund.
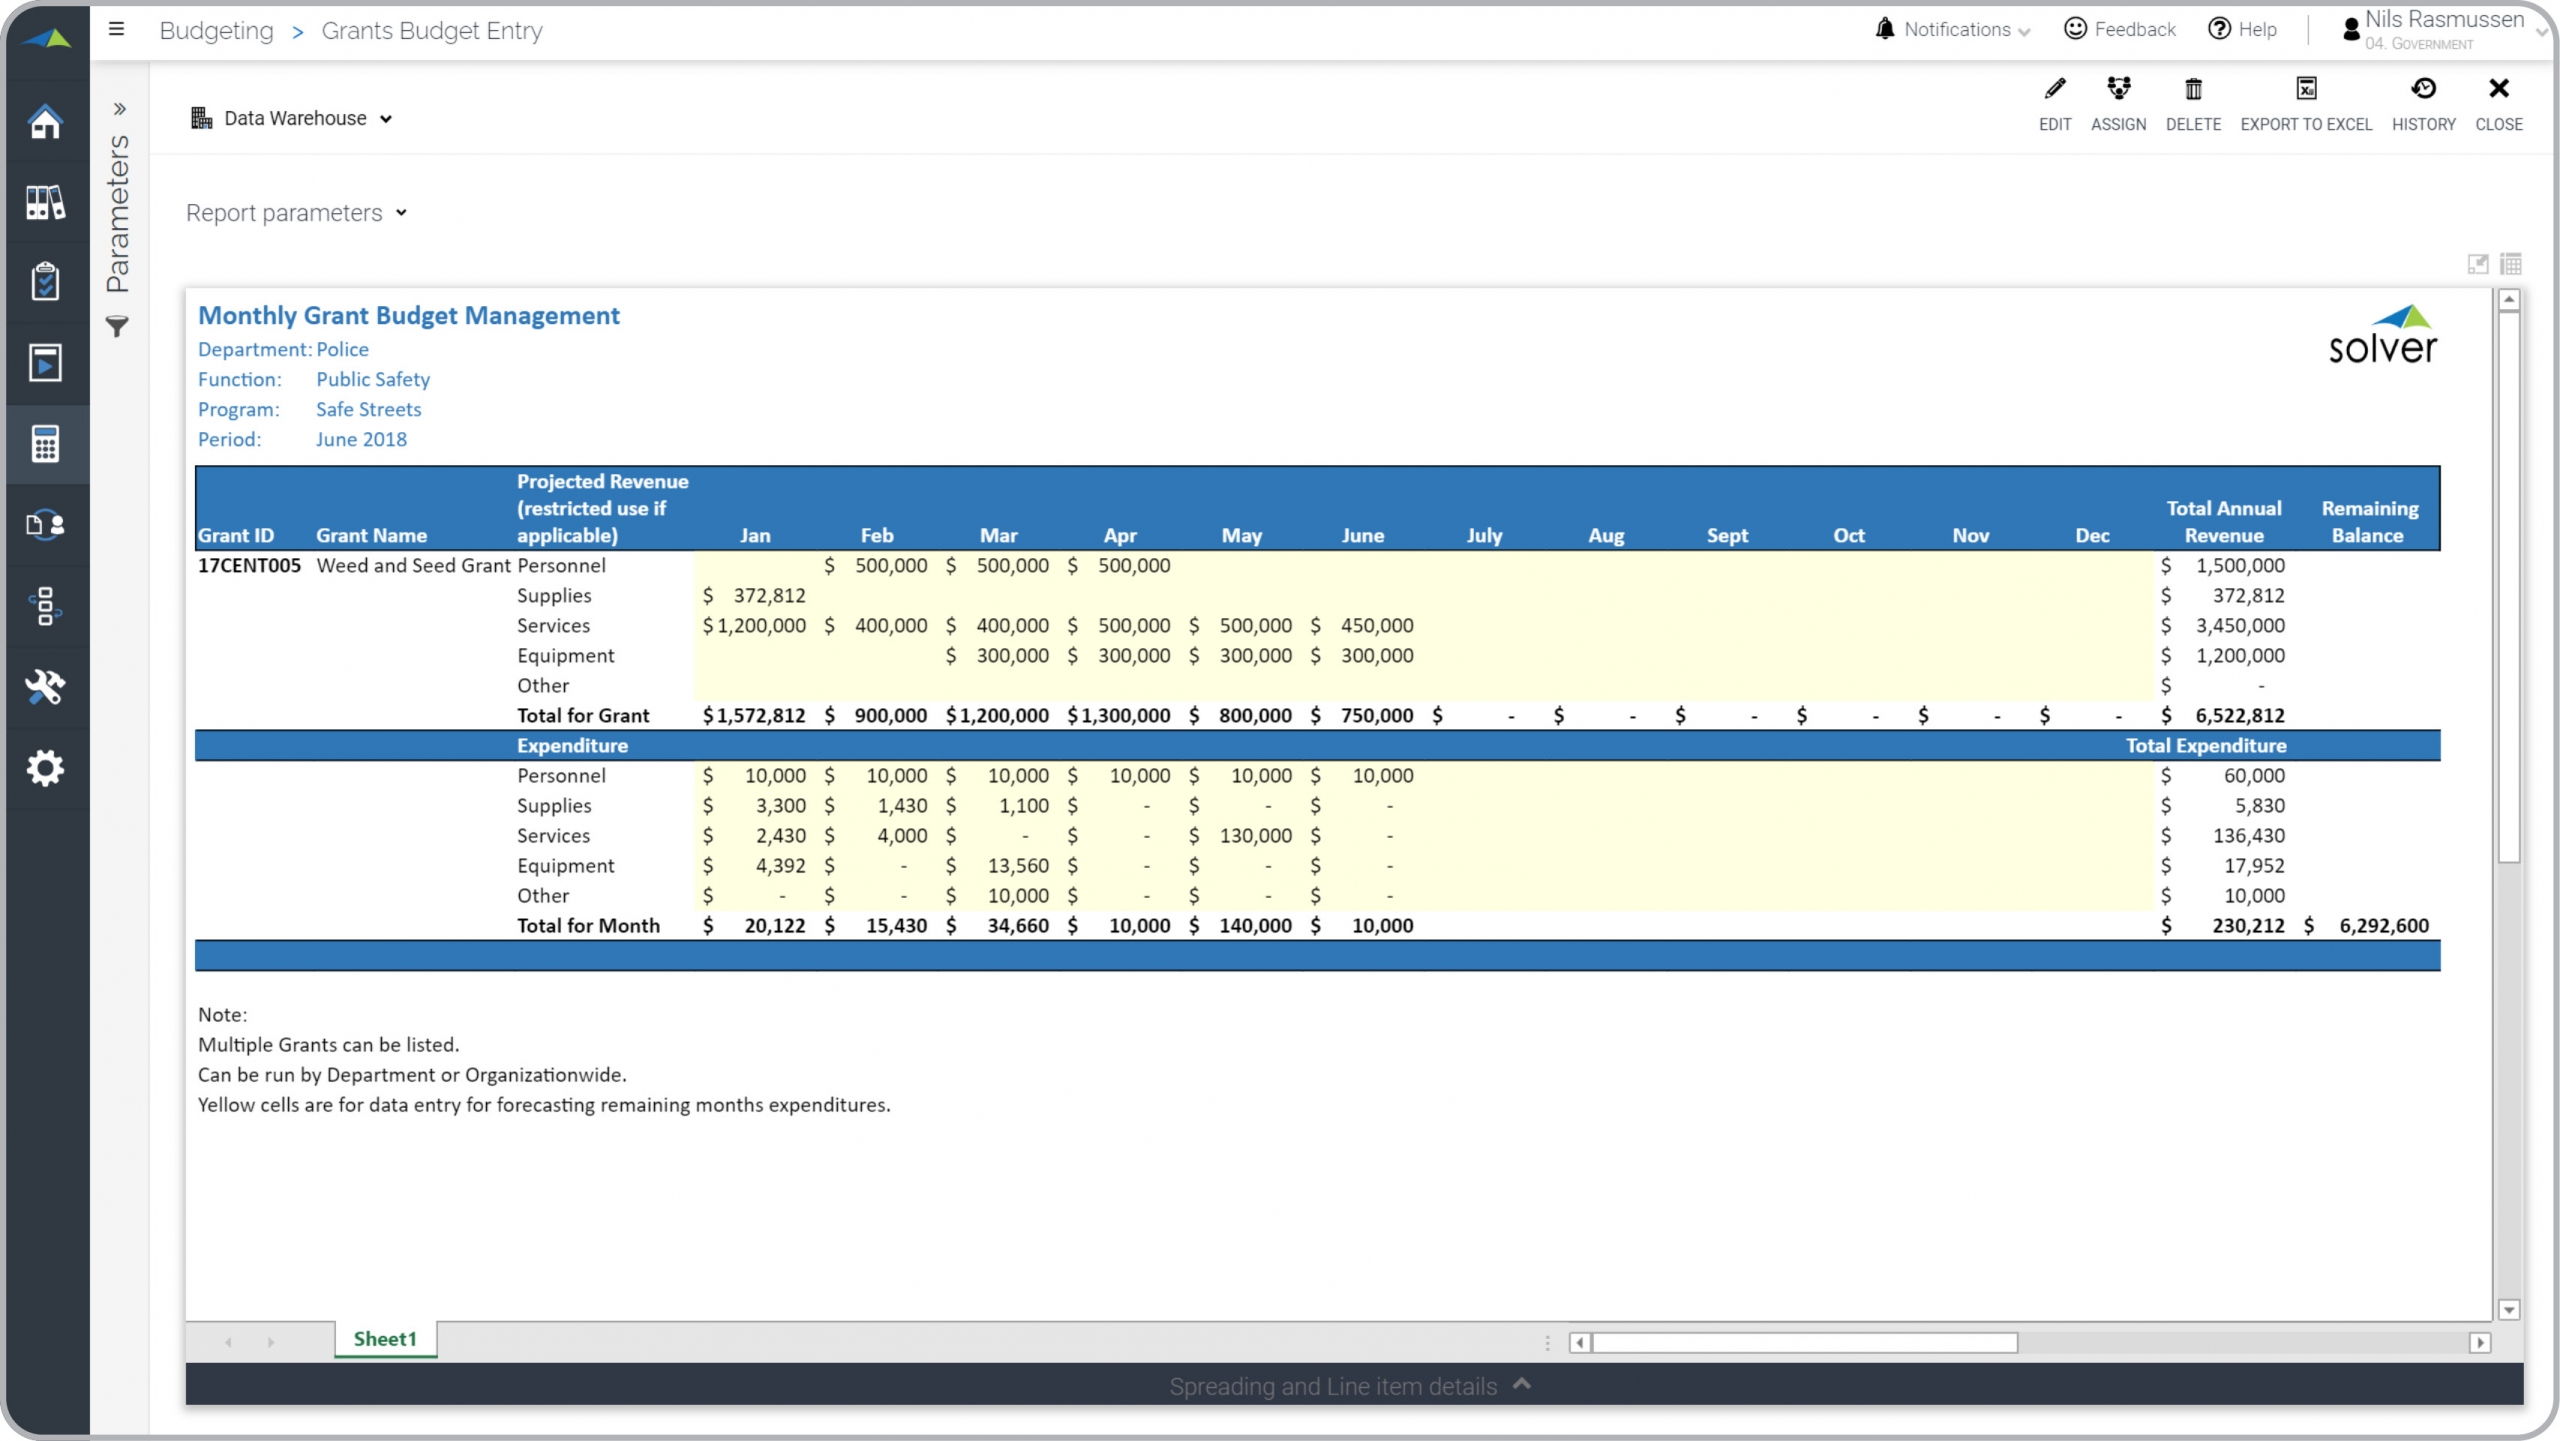
Government – Grants Budget
Enter monthly amounts per Grant and revenue/expense category. View remaining balance.
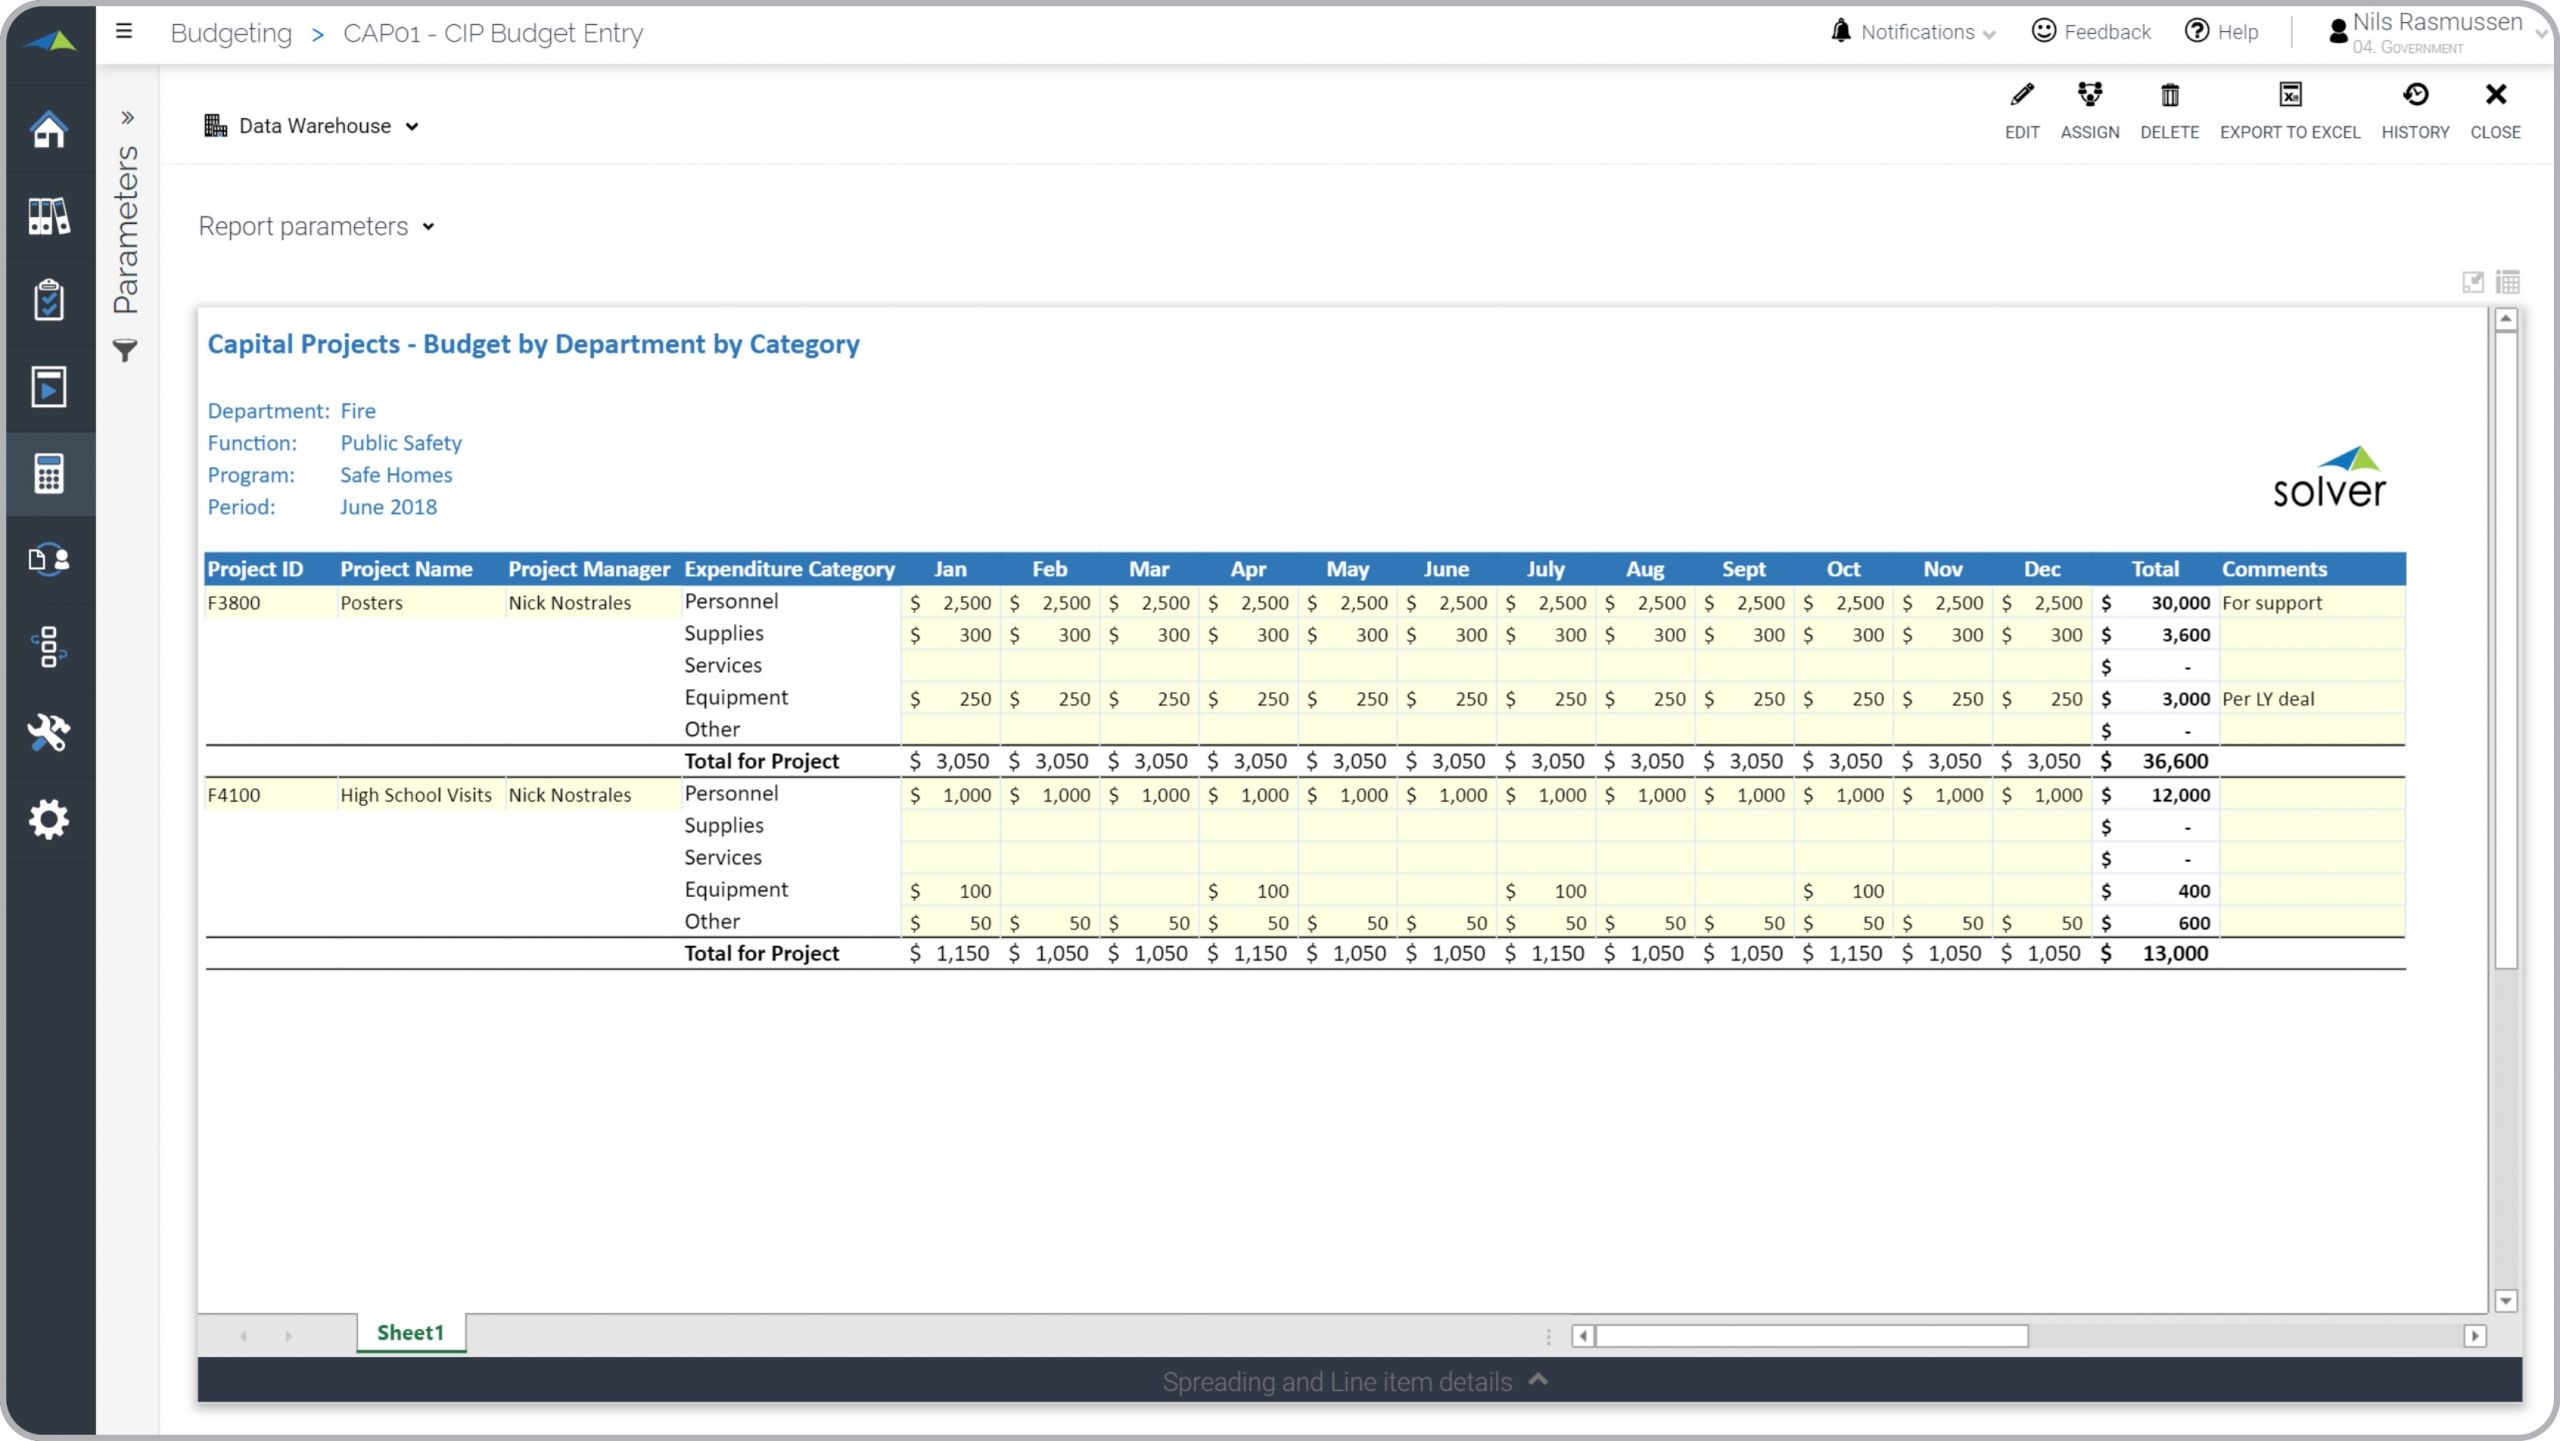
Government – Capital Project Budget
Enter monthly budget amount per project, manager and expense category.
Government – Expense Budget Review
Budget approvers review the department request and comment or adjust by line item
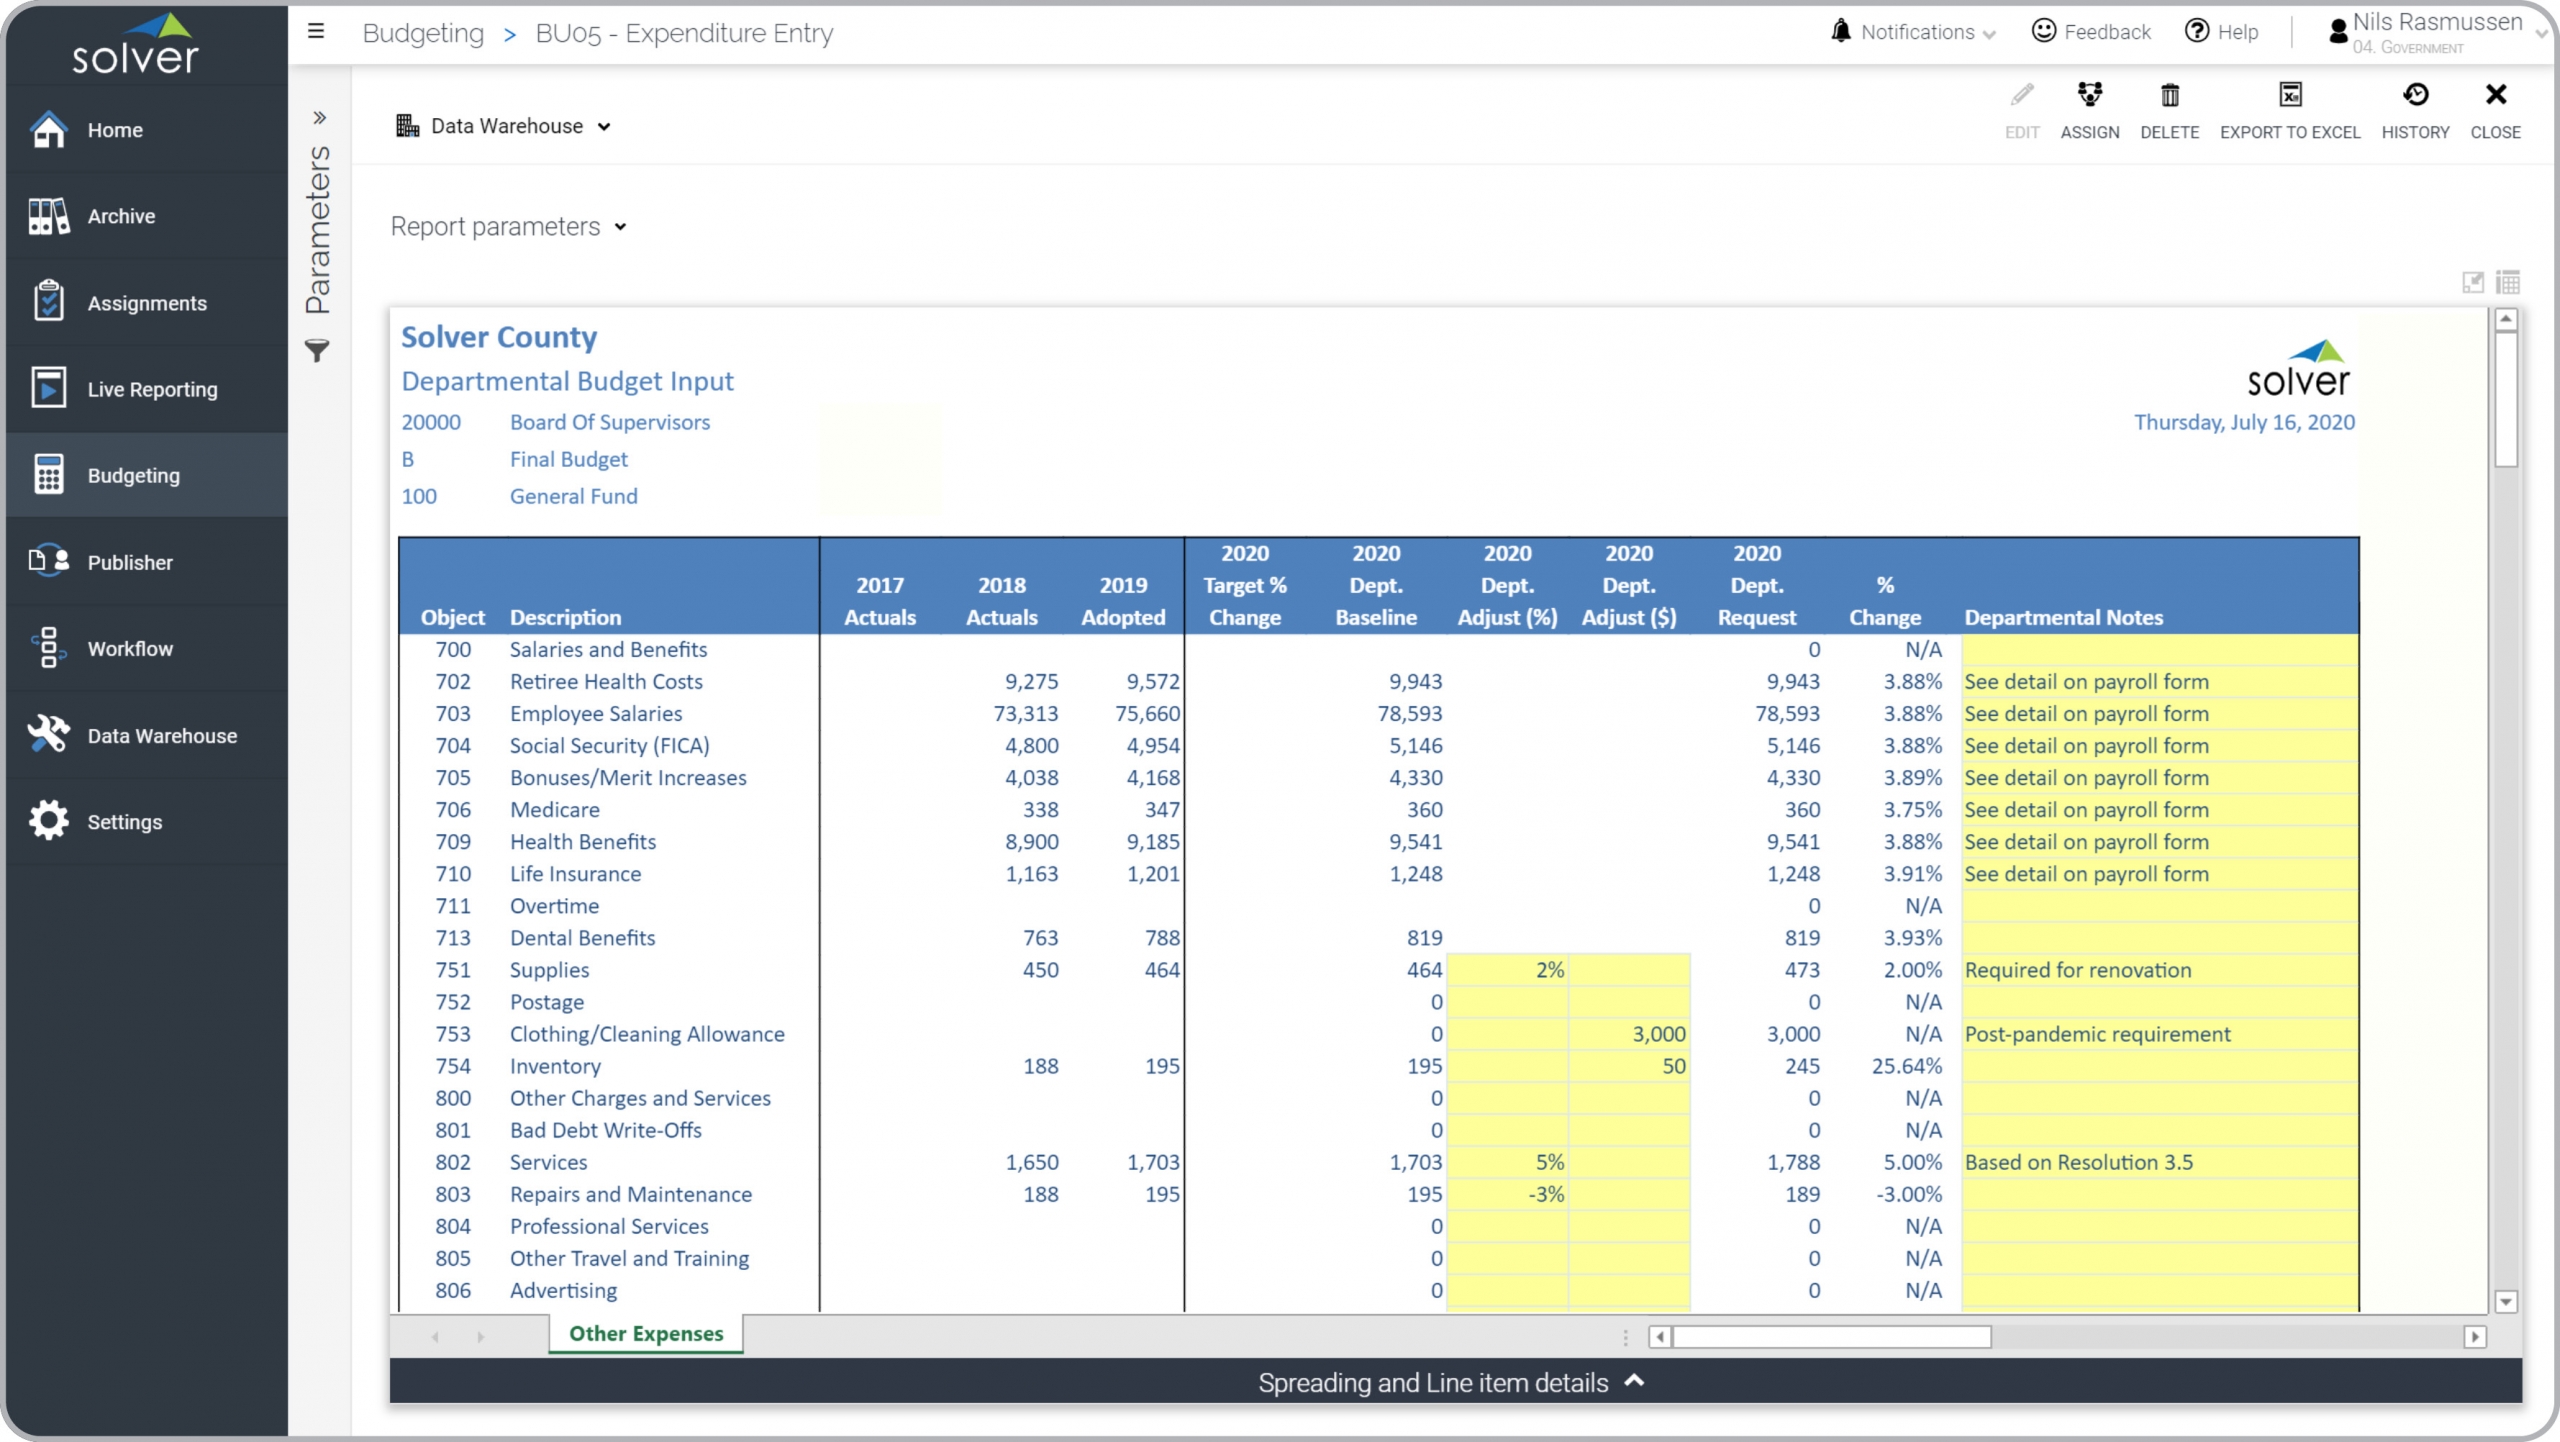
Government – Expense Budget
The baseline budget is automatically generated and then the user can adjust amount or %.
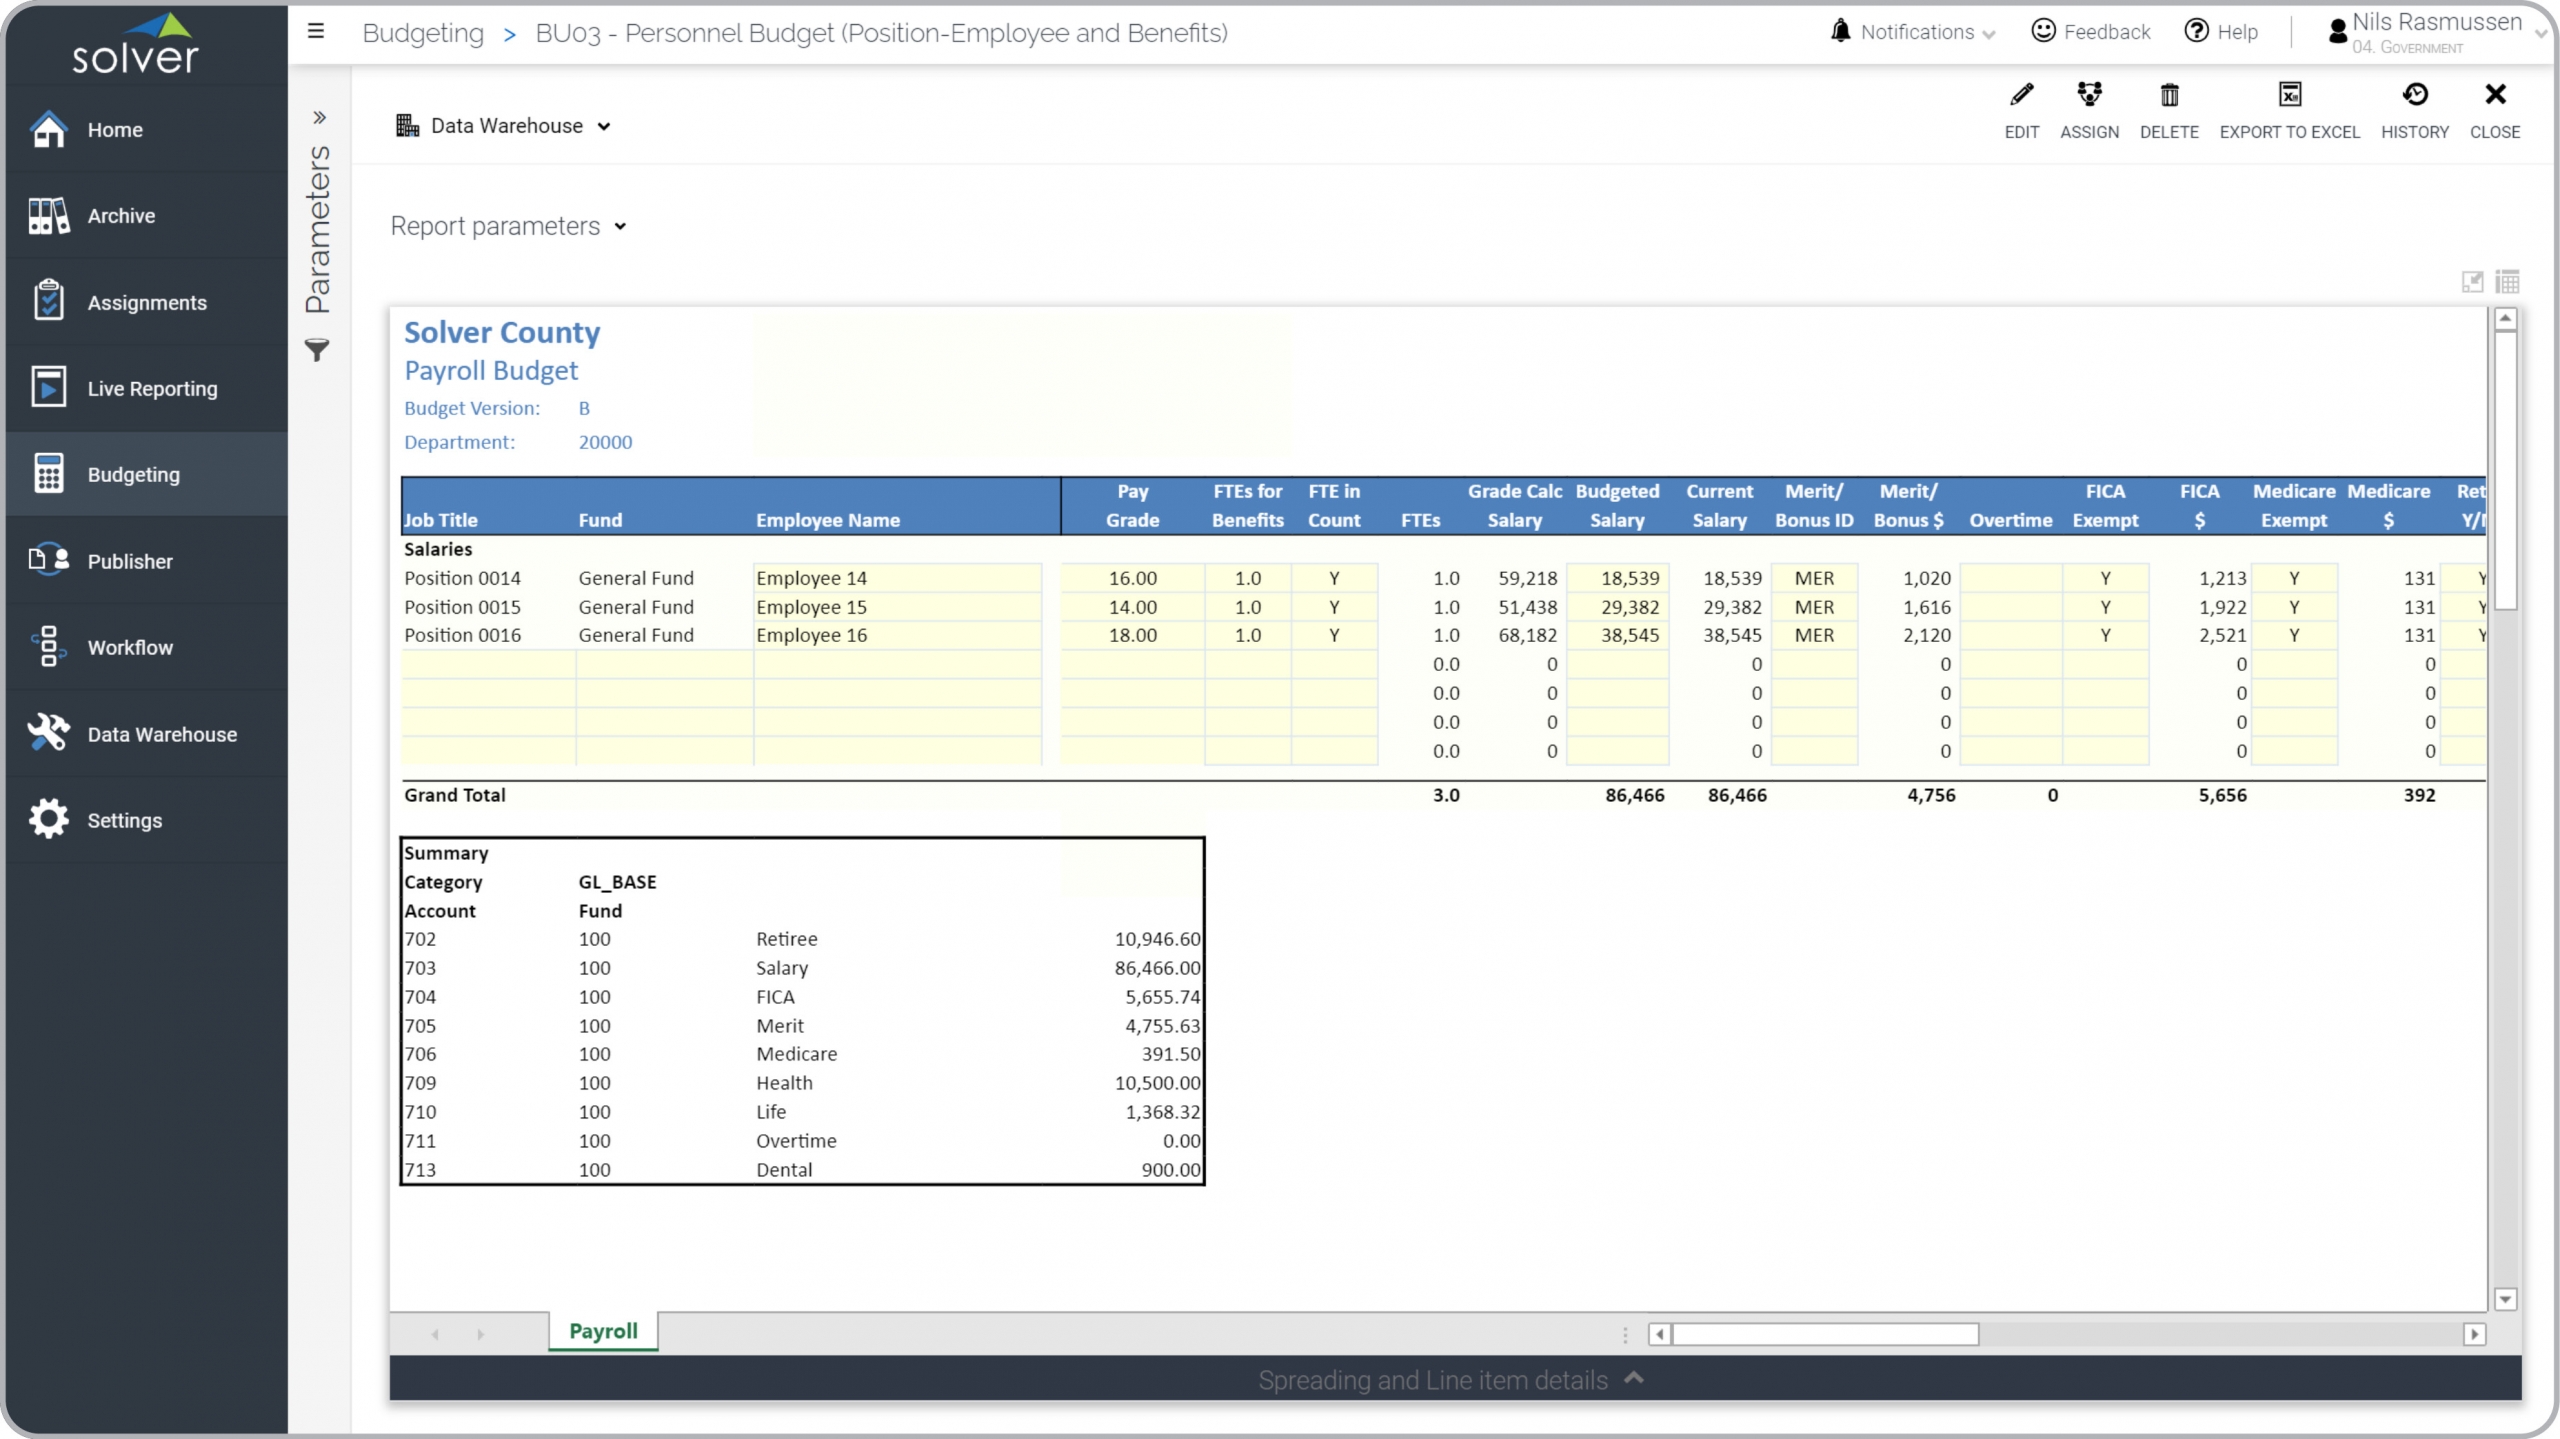
Government – Payroll Budget
Budget for positions by Fund and with drivers for salary, taxes and benefits.
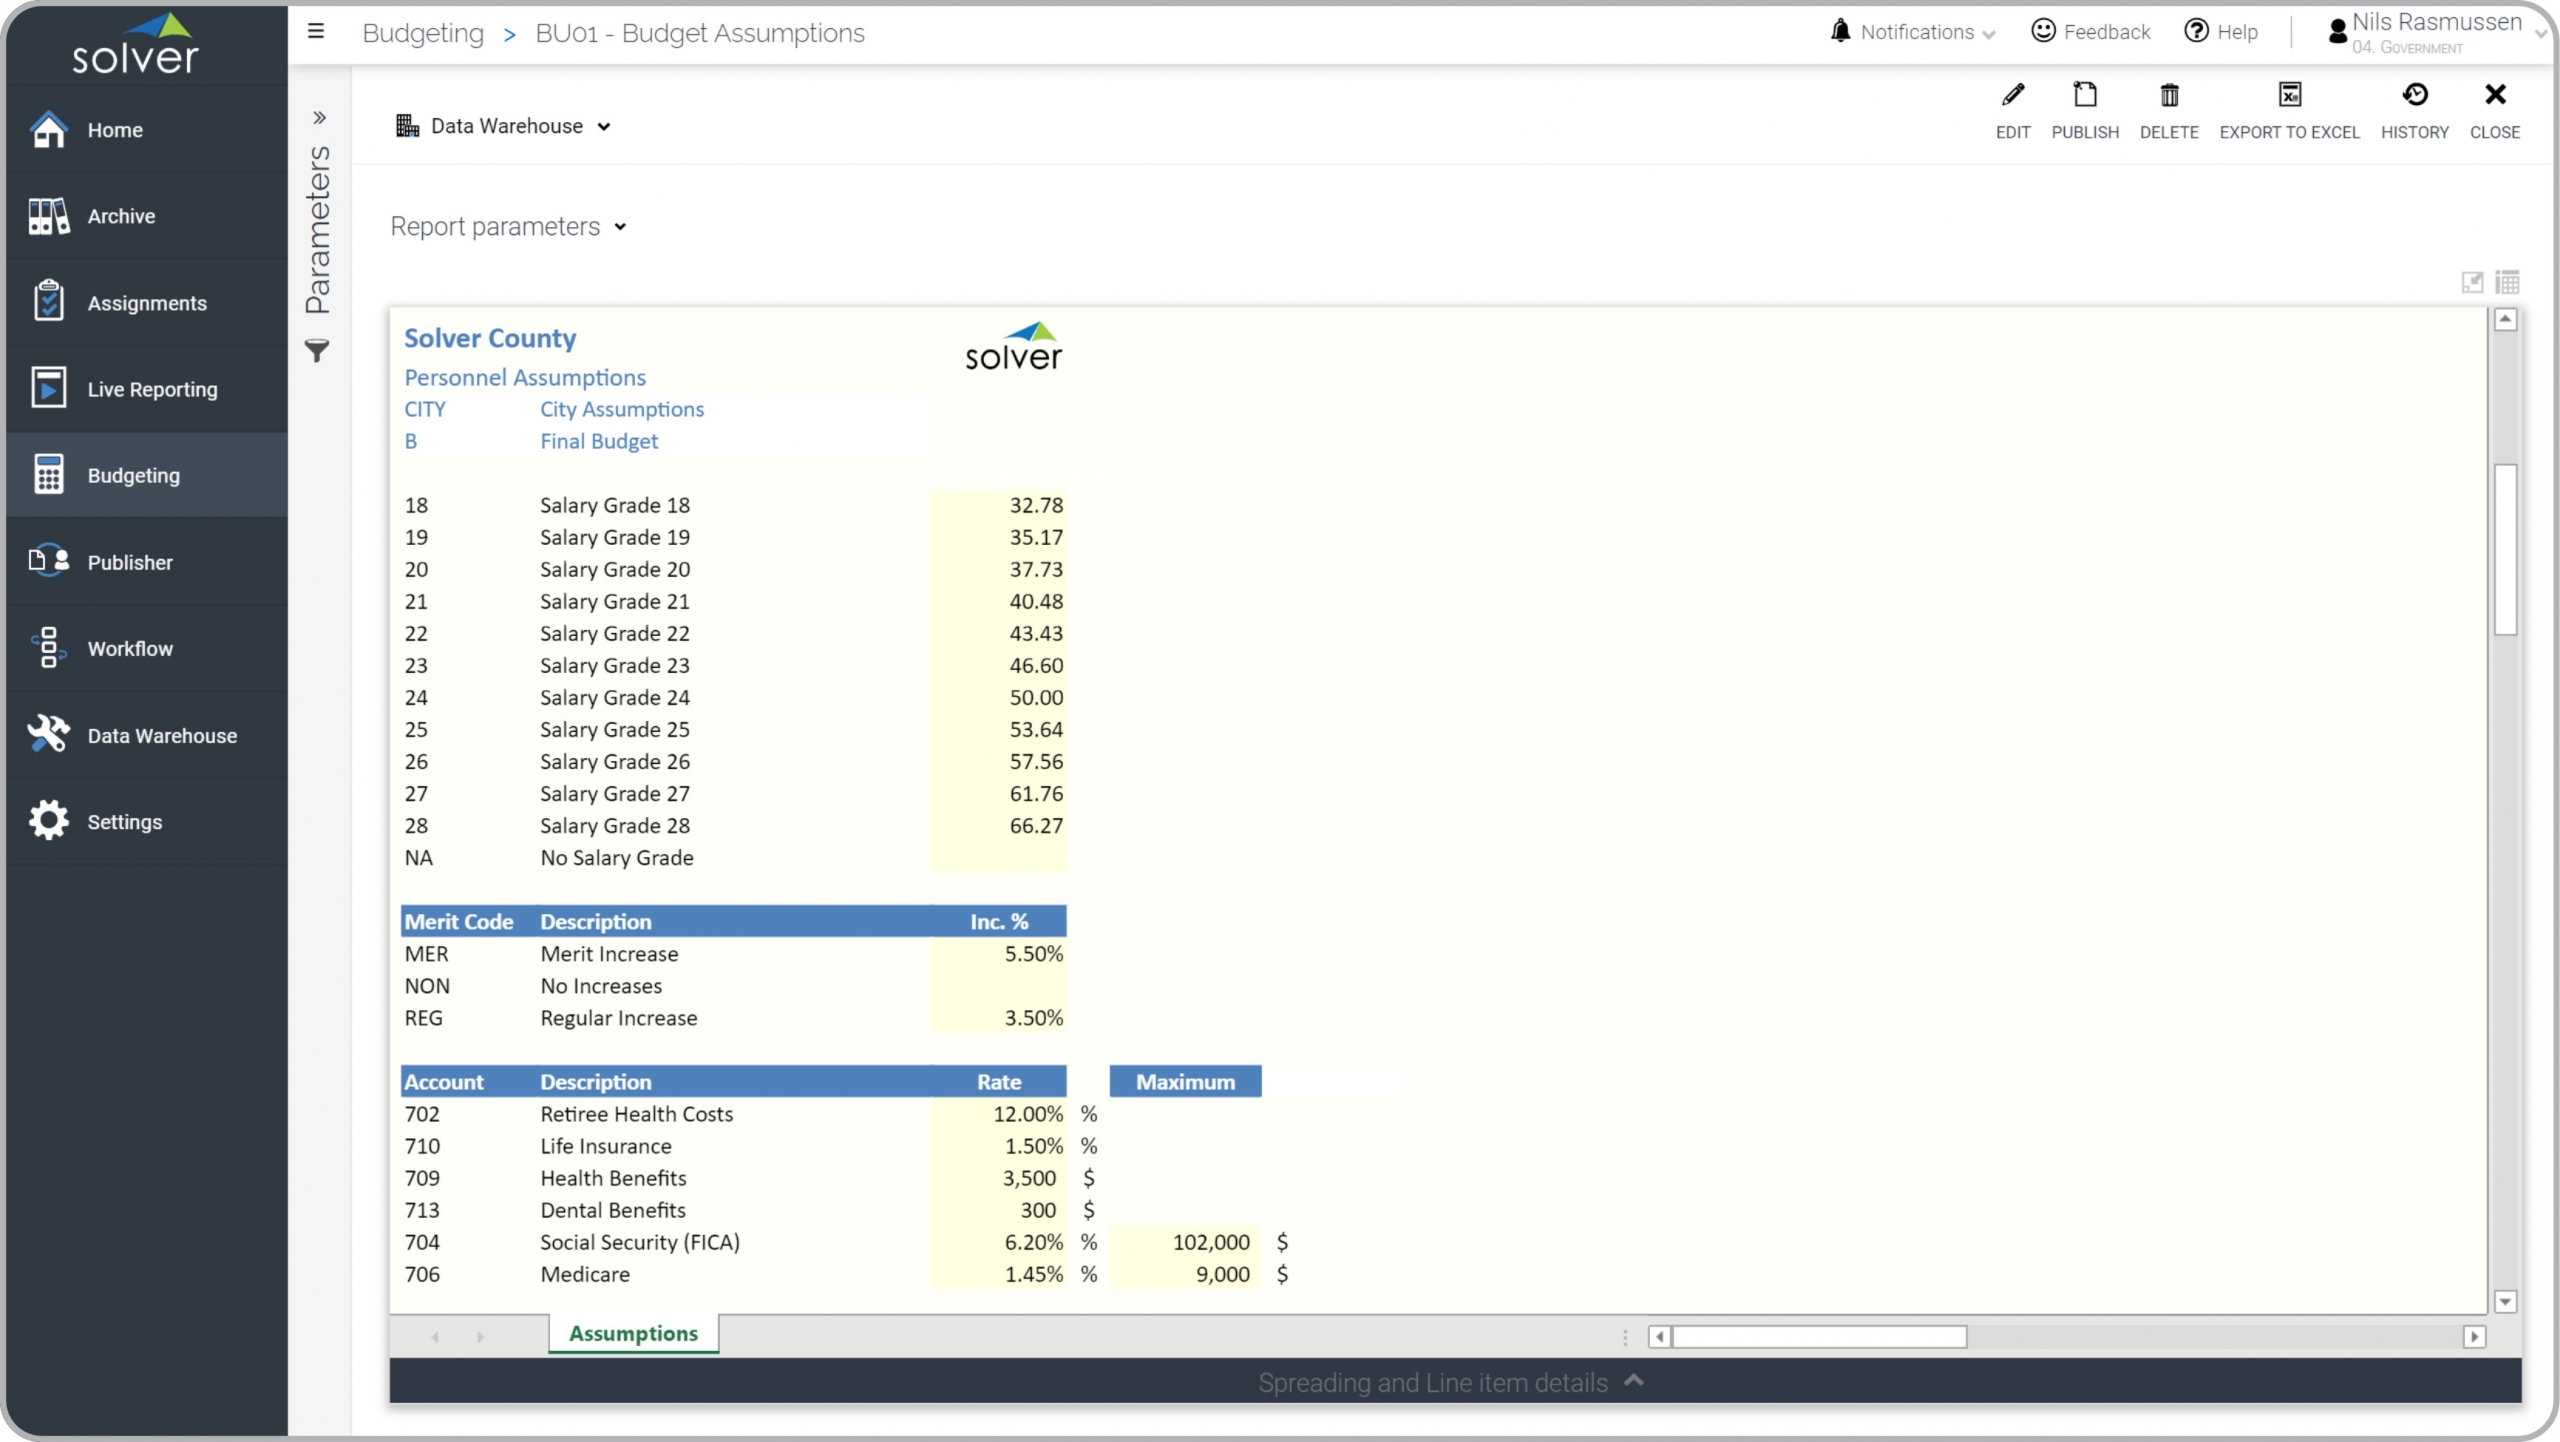
Government – Personnel Assumptions
Enter payroll budget drivers such as salary grade, merit increase and benefits.
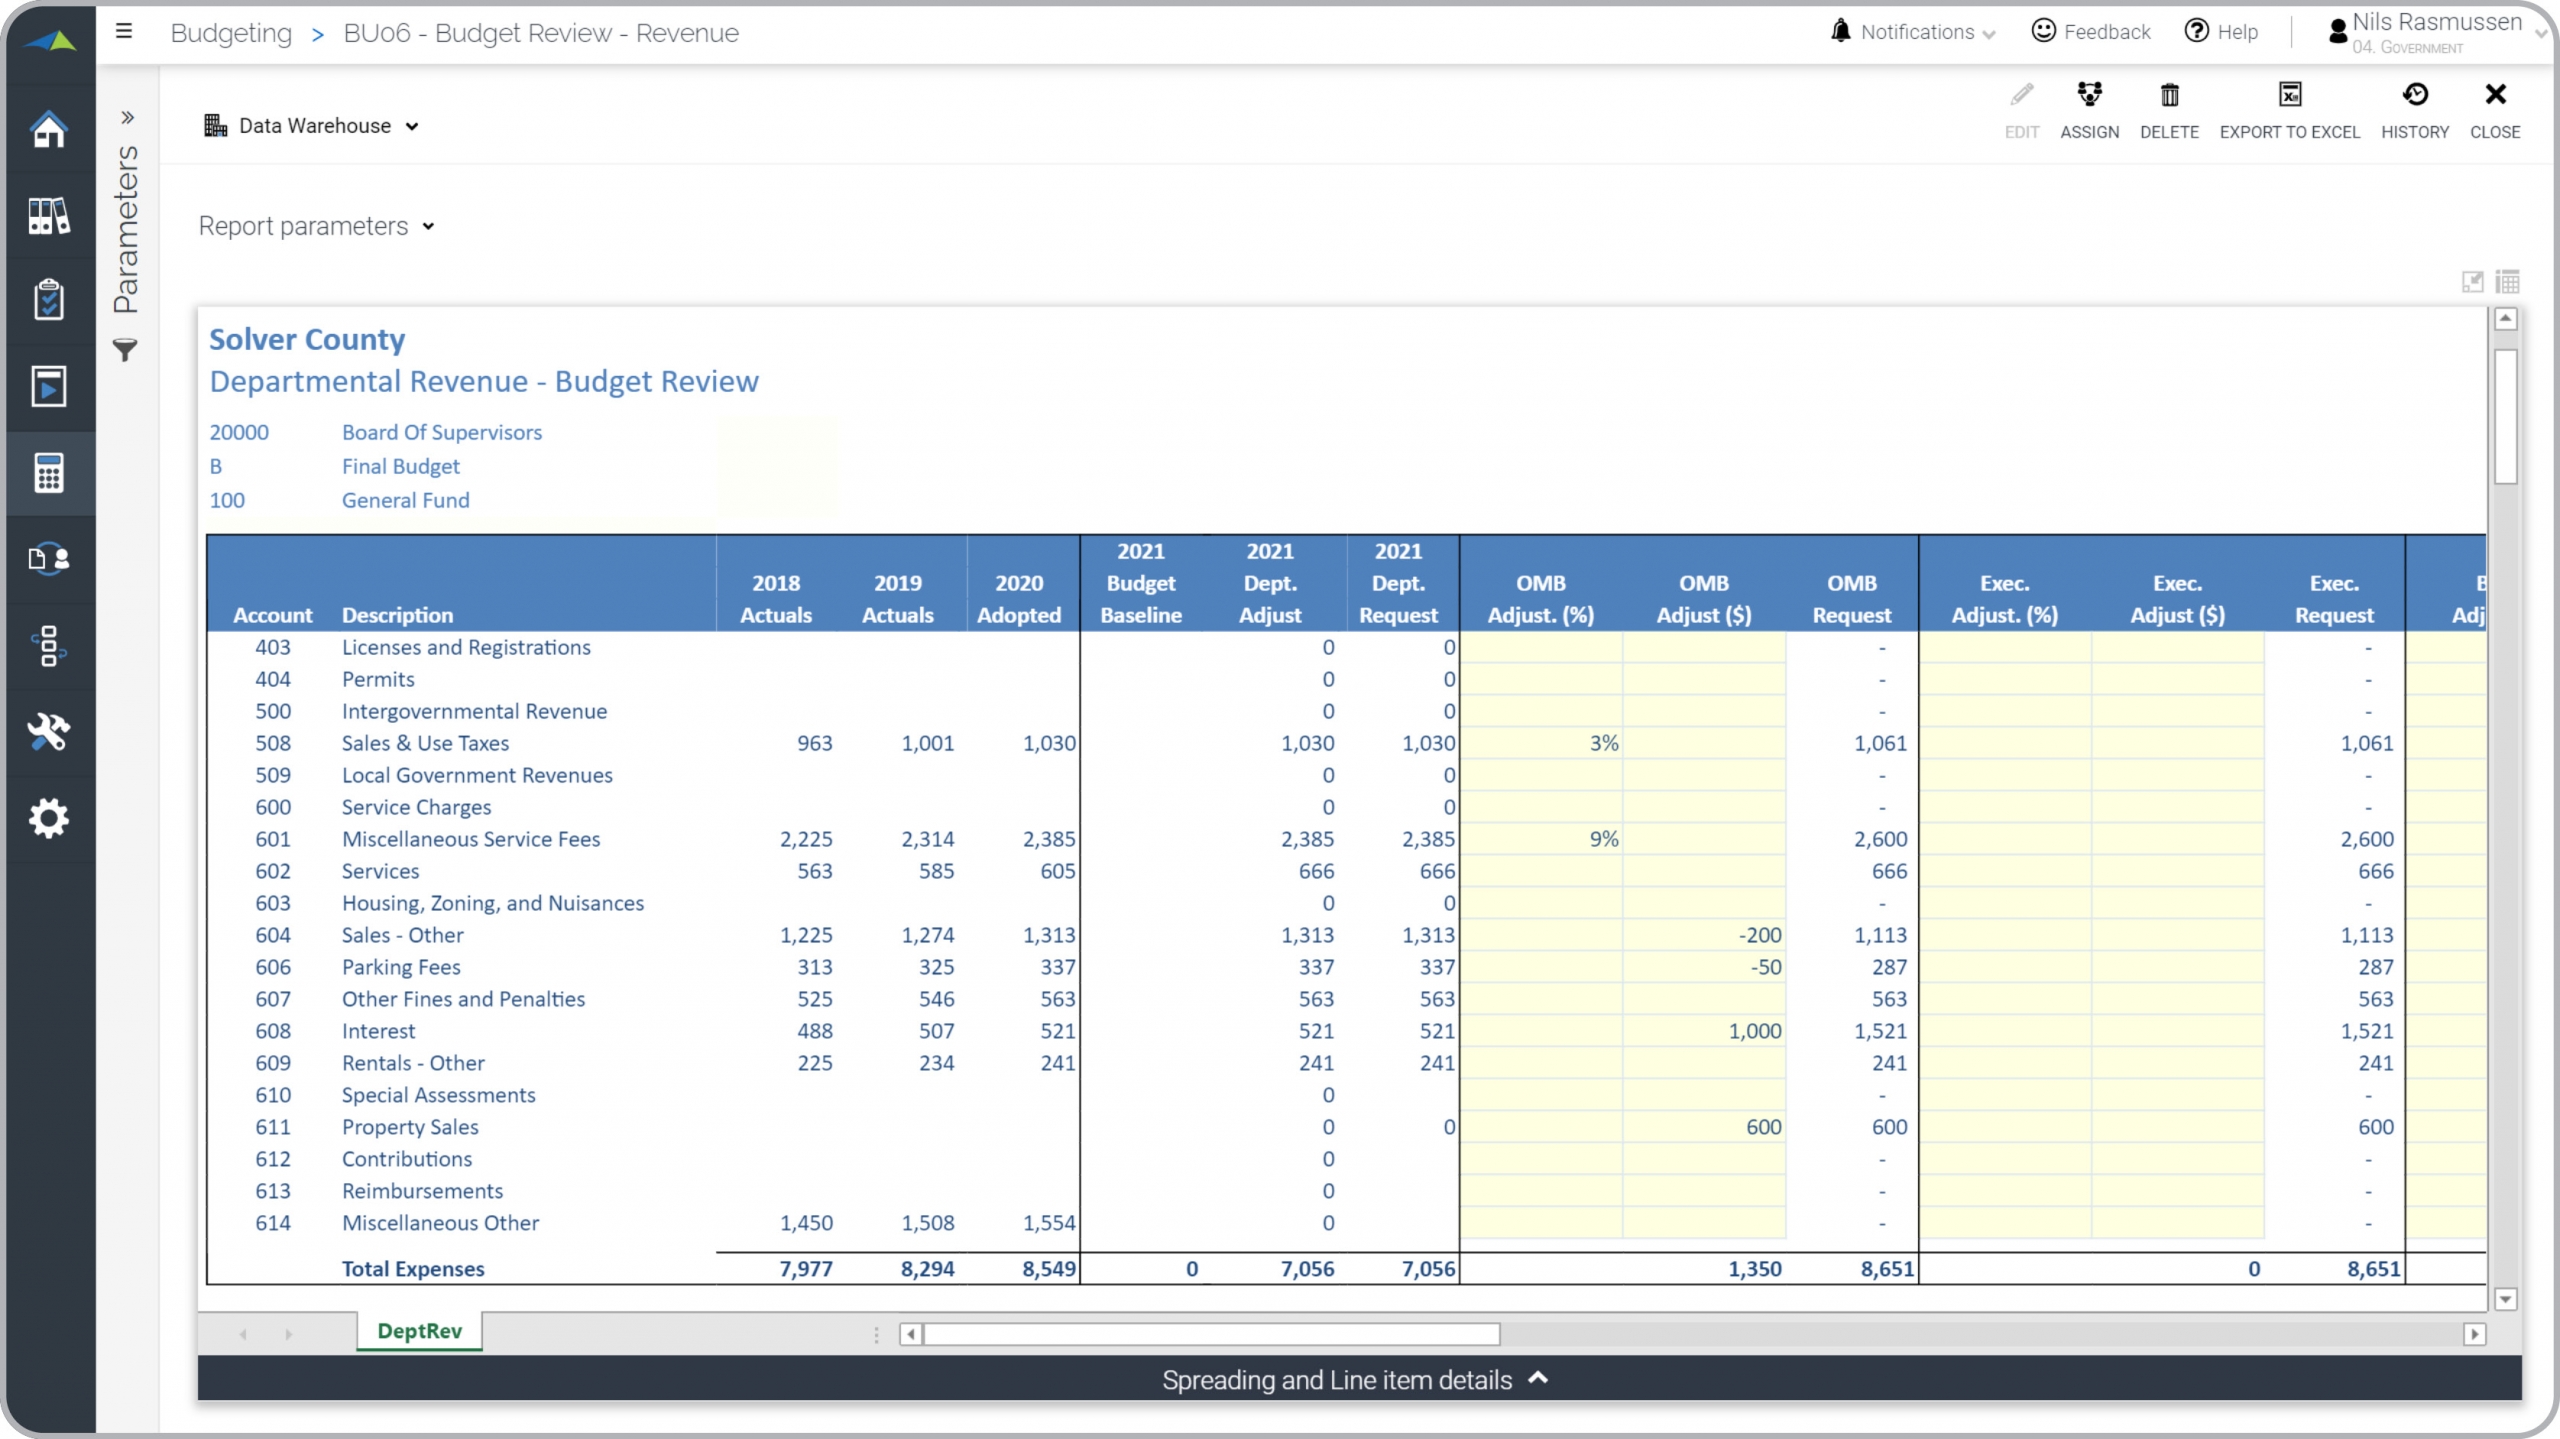
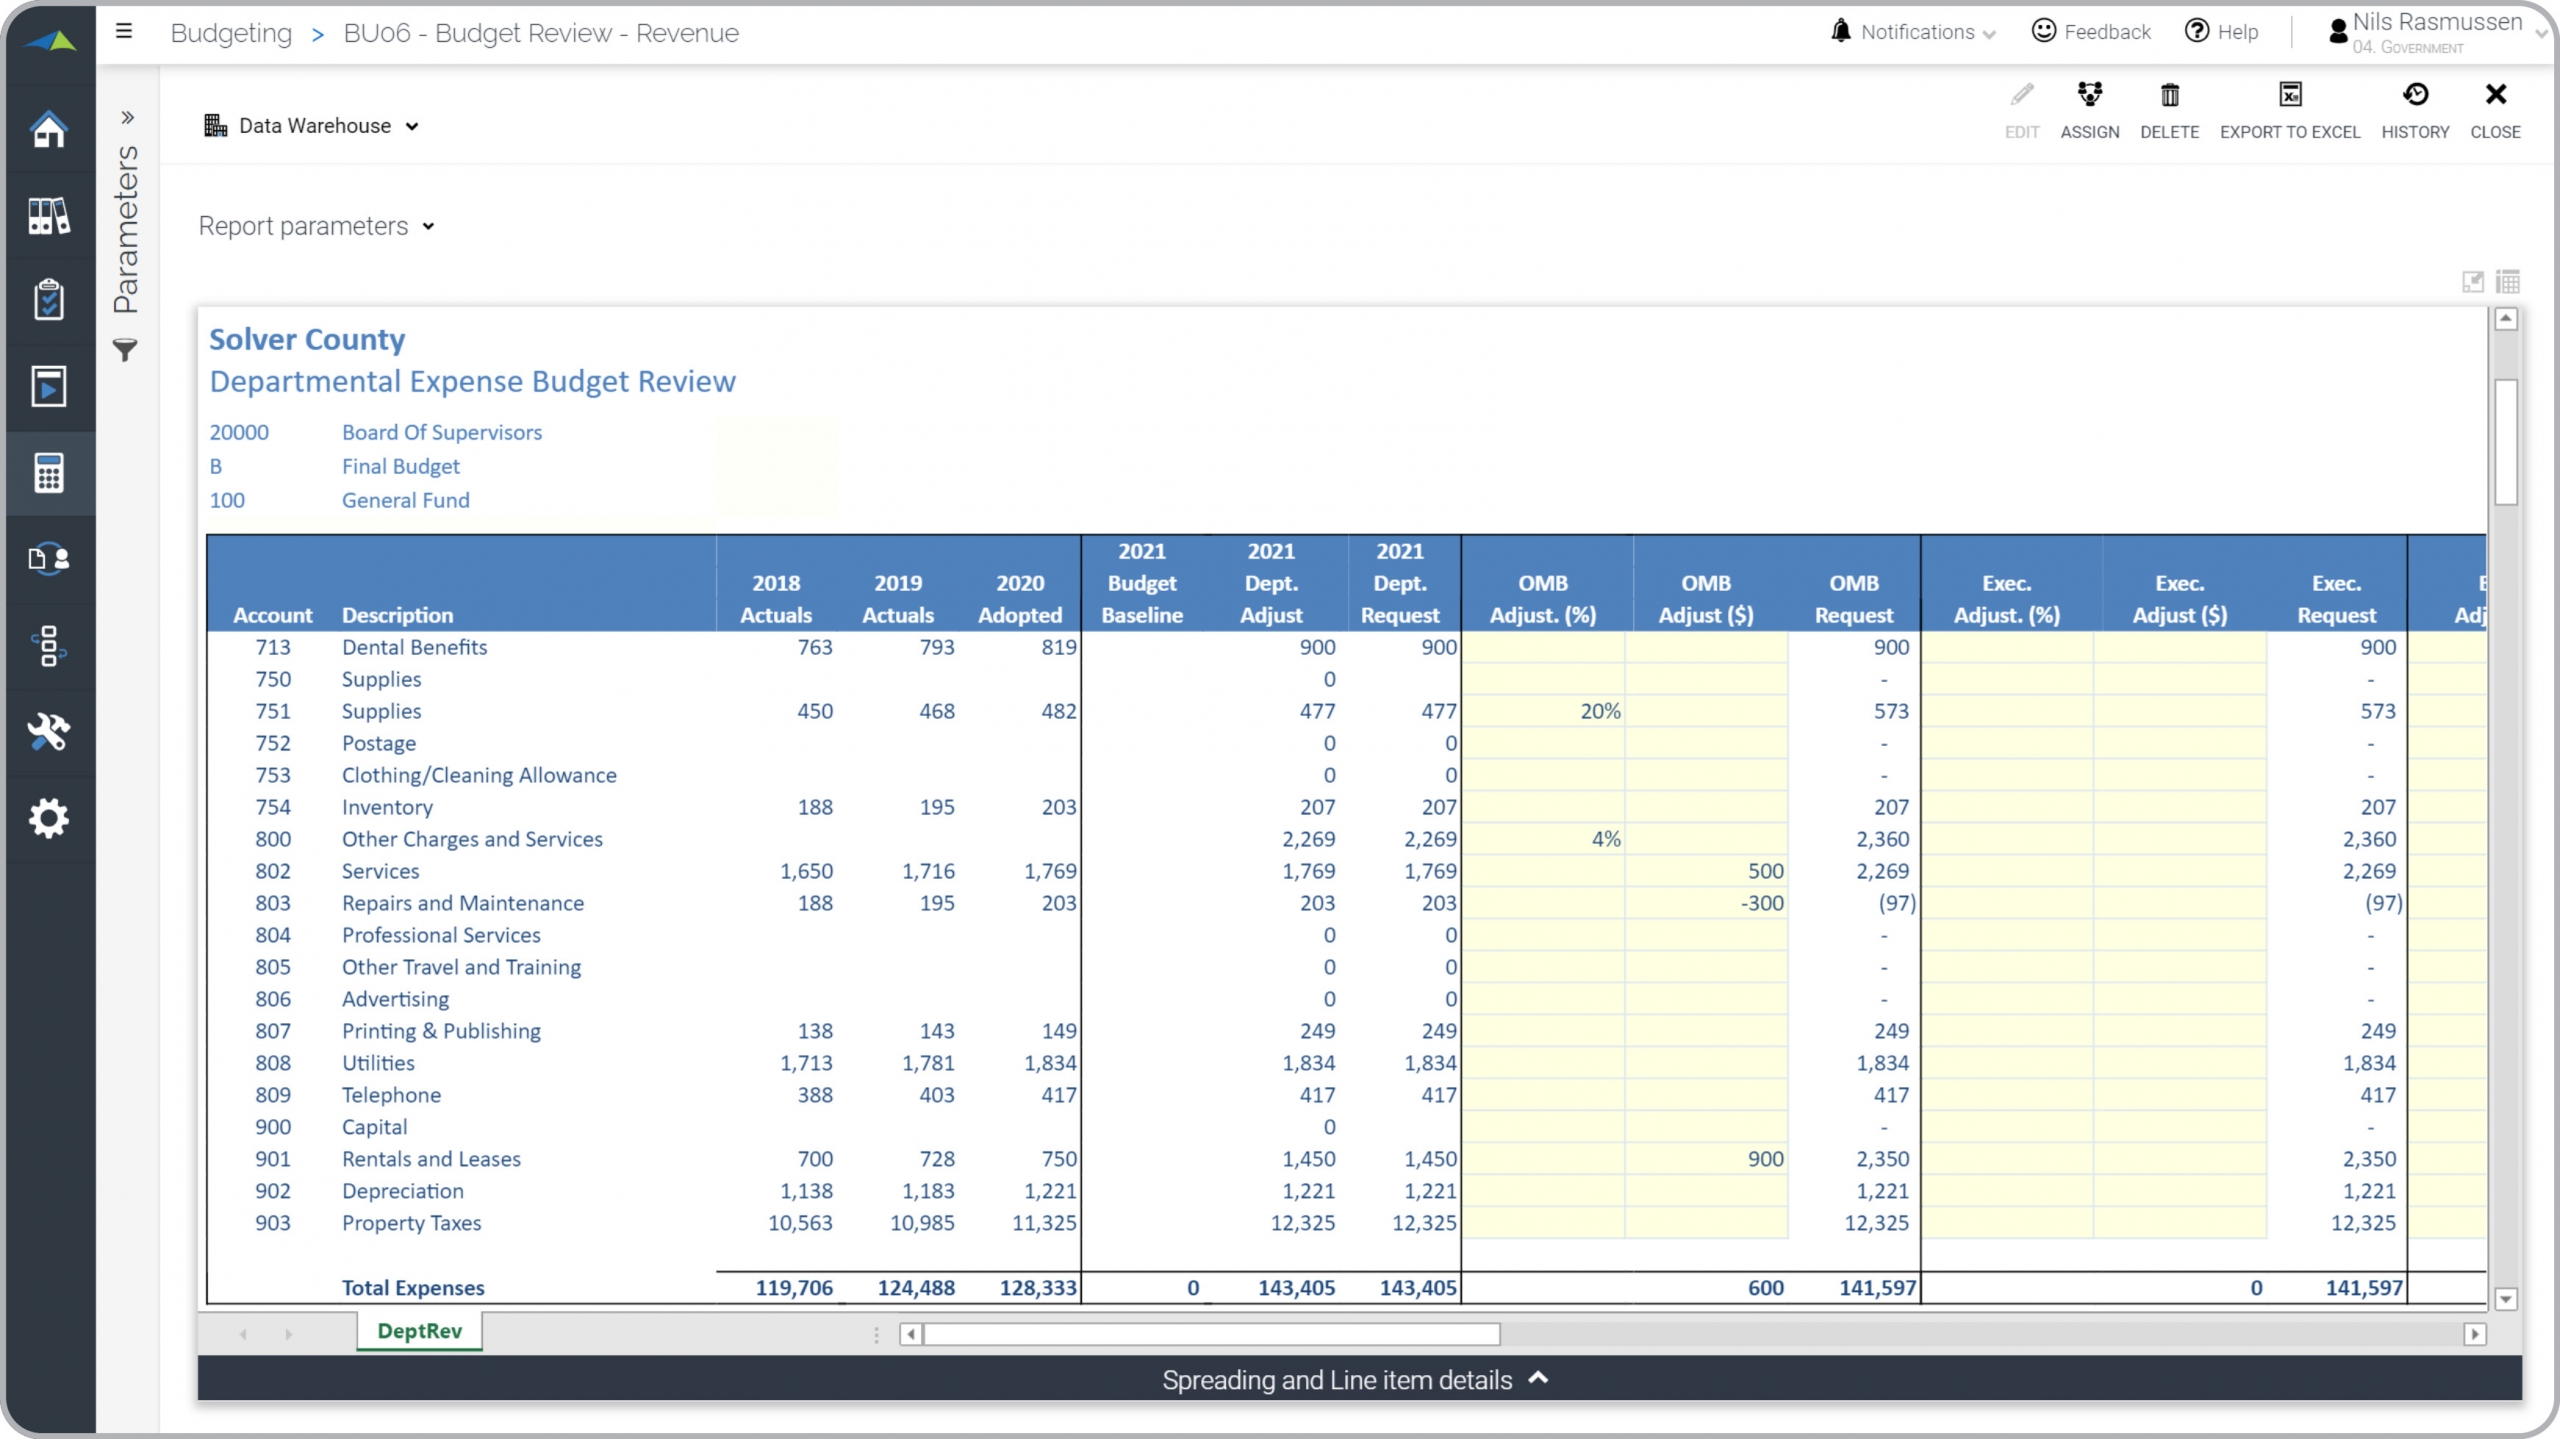
Government – Revenue Budget Review
The baseline budget is automatically generated and then the user can adjust amount or %.
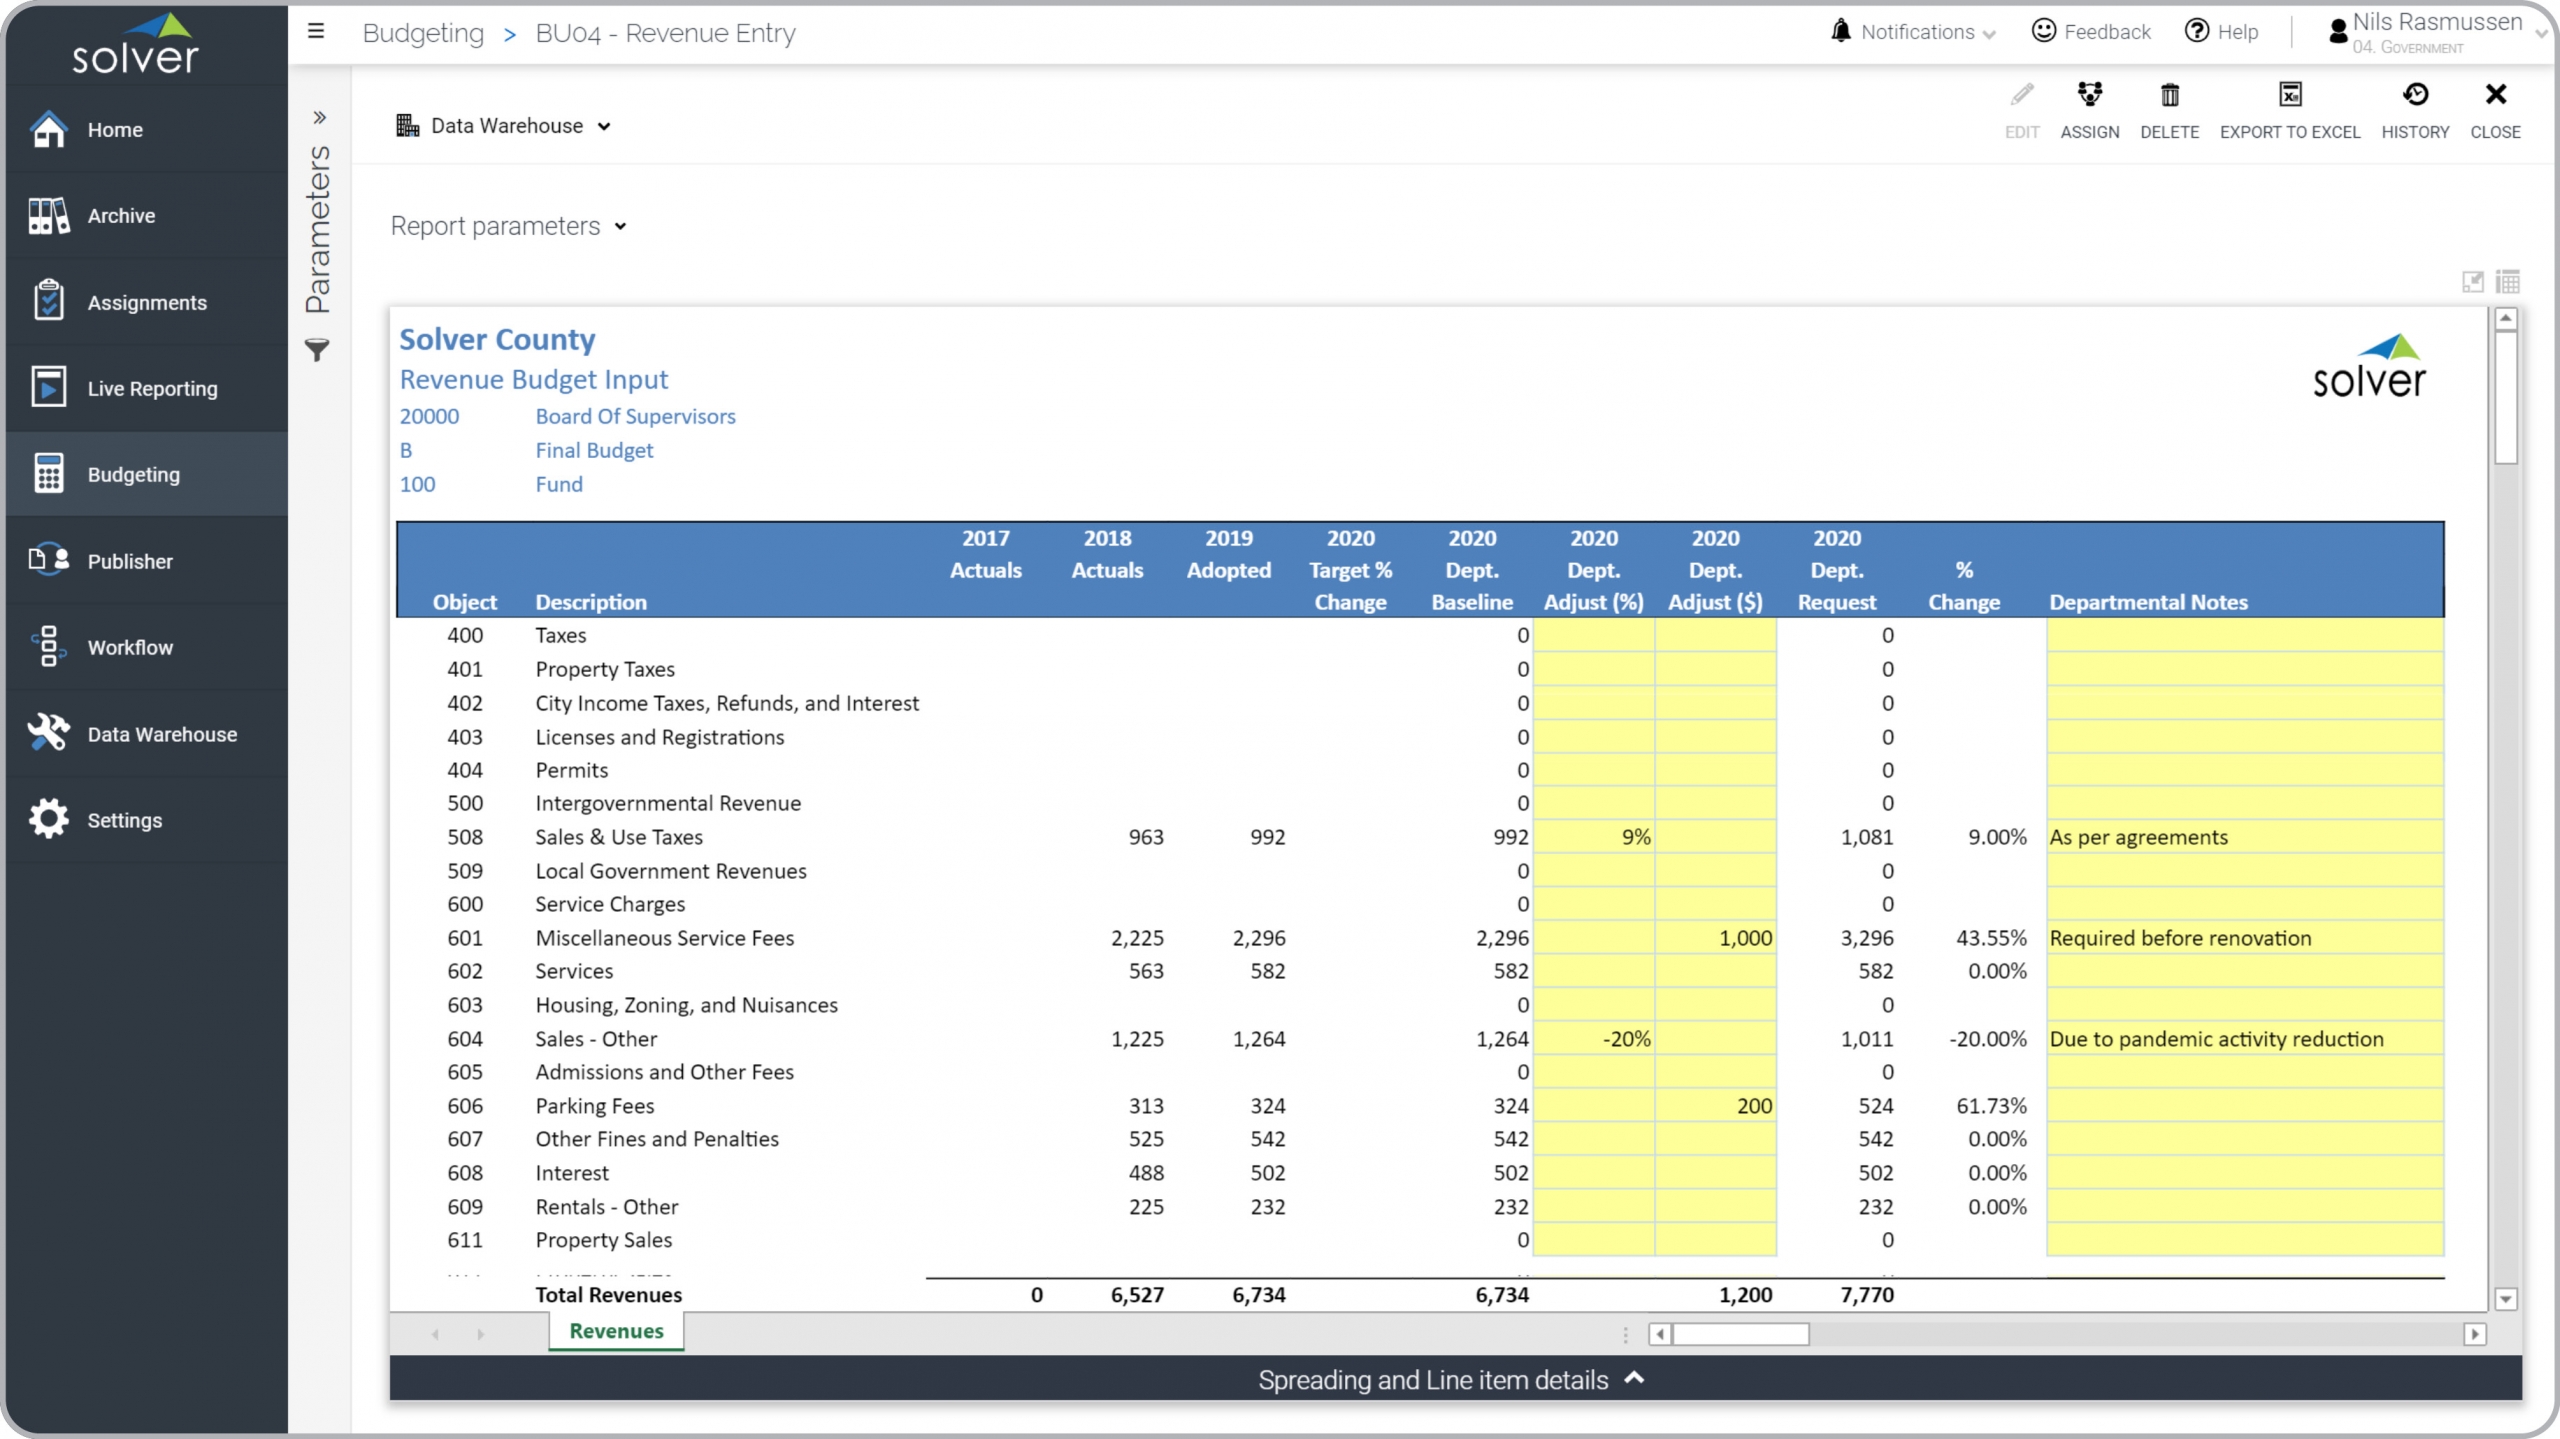
Government – Revenue Budget
Budget approvers review the department request and comment or adjust by line item.
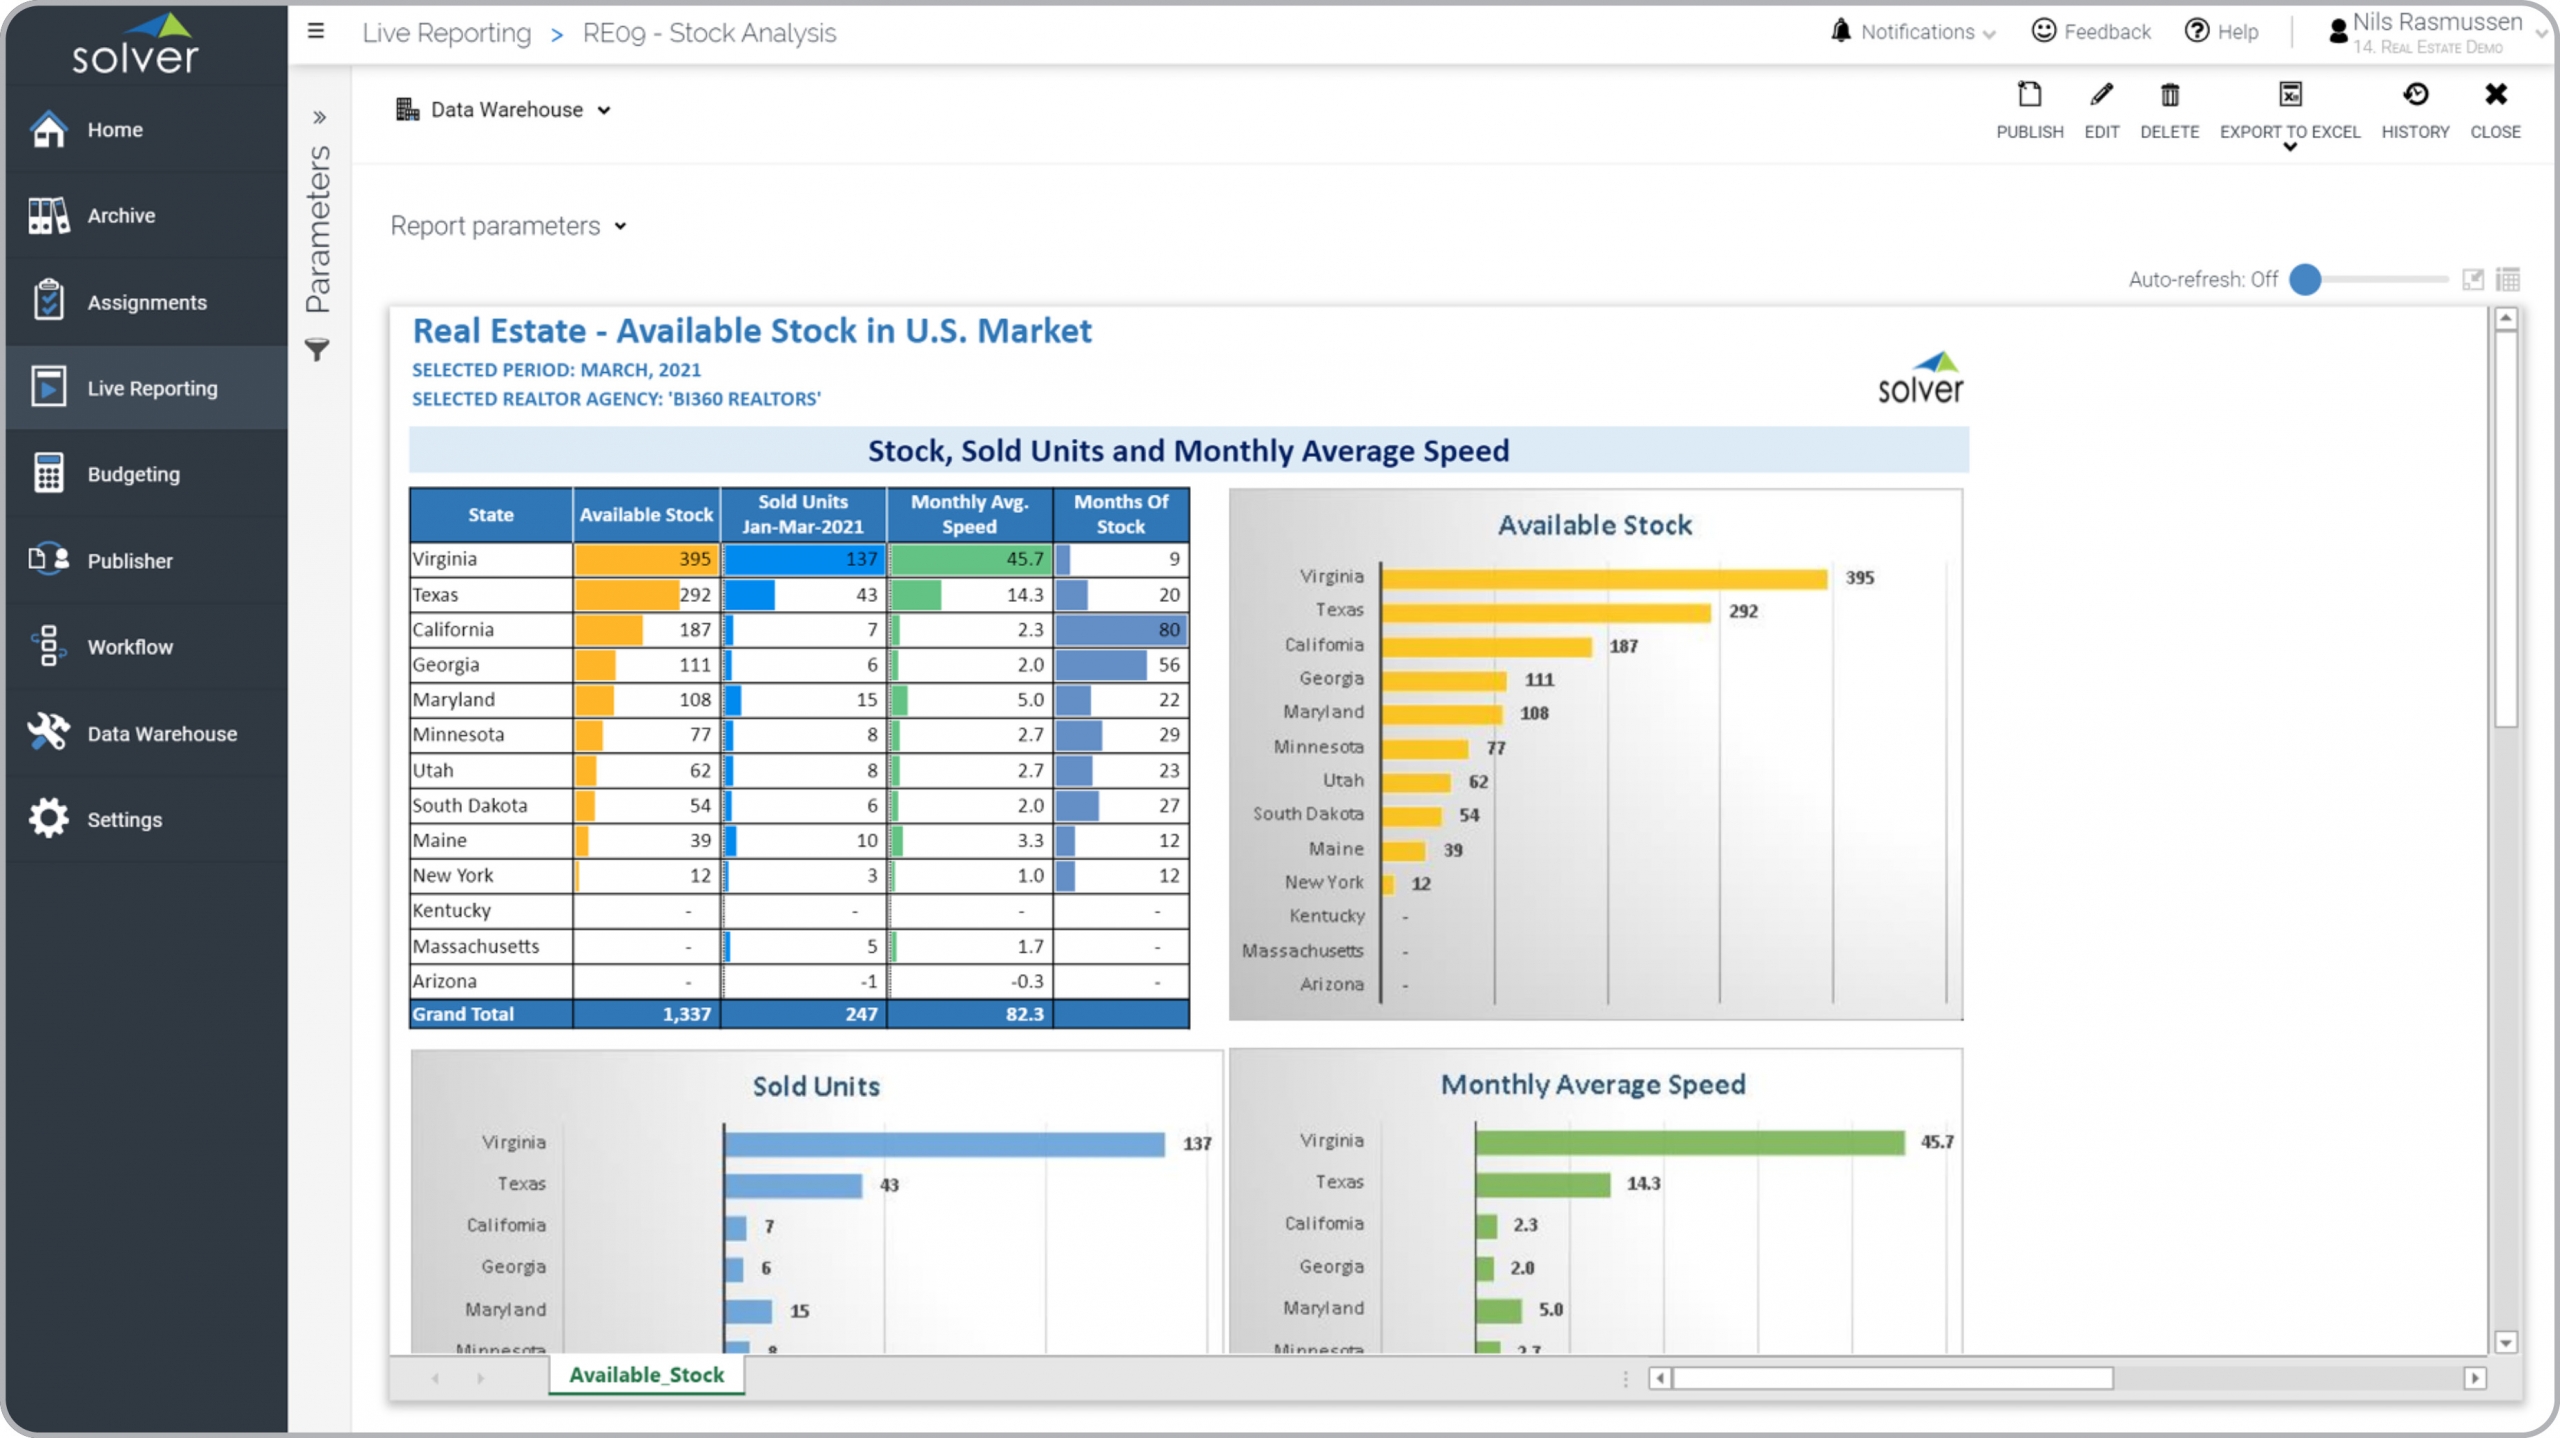
Real Estate – Available Stock Analysis
This report provides detail on the available real estate inventory by state and with average speed.
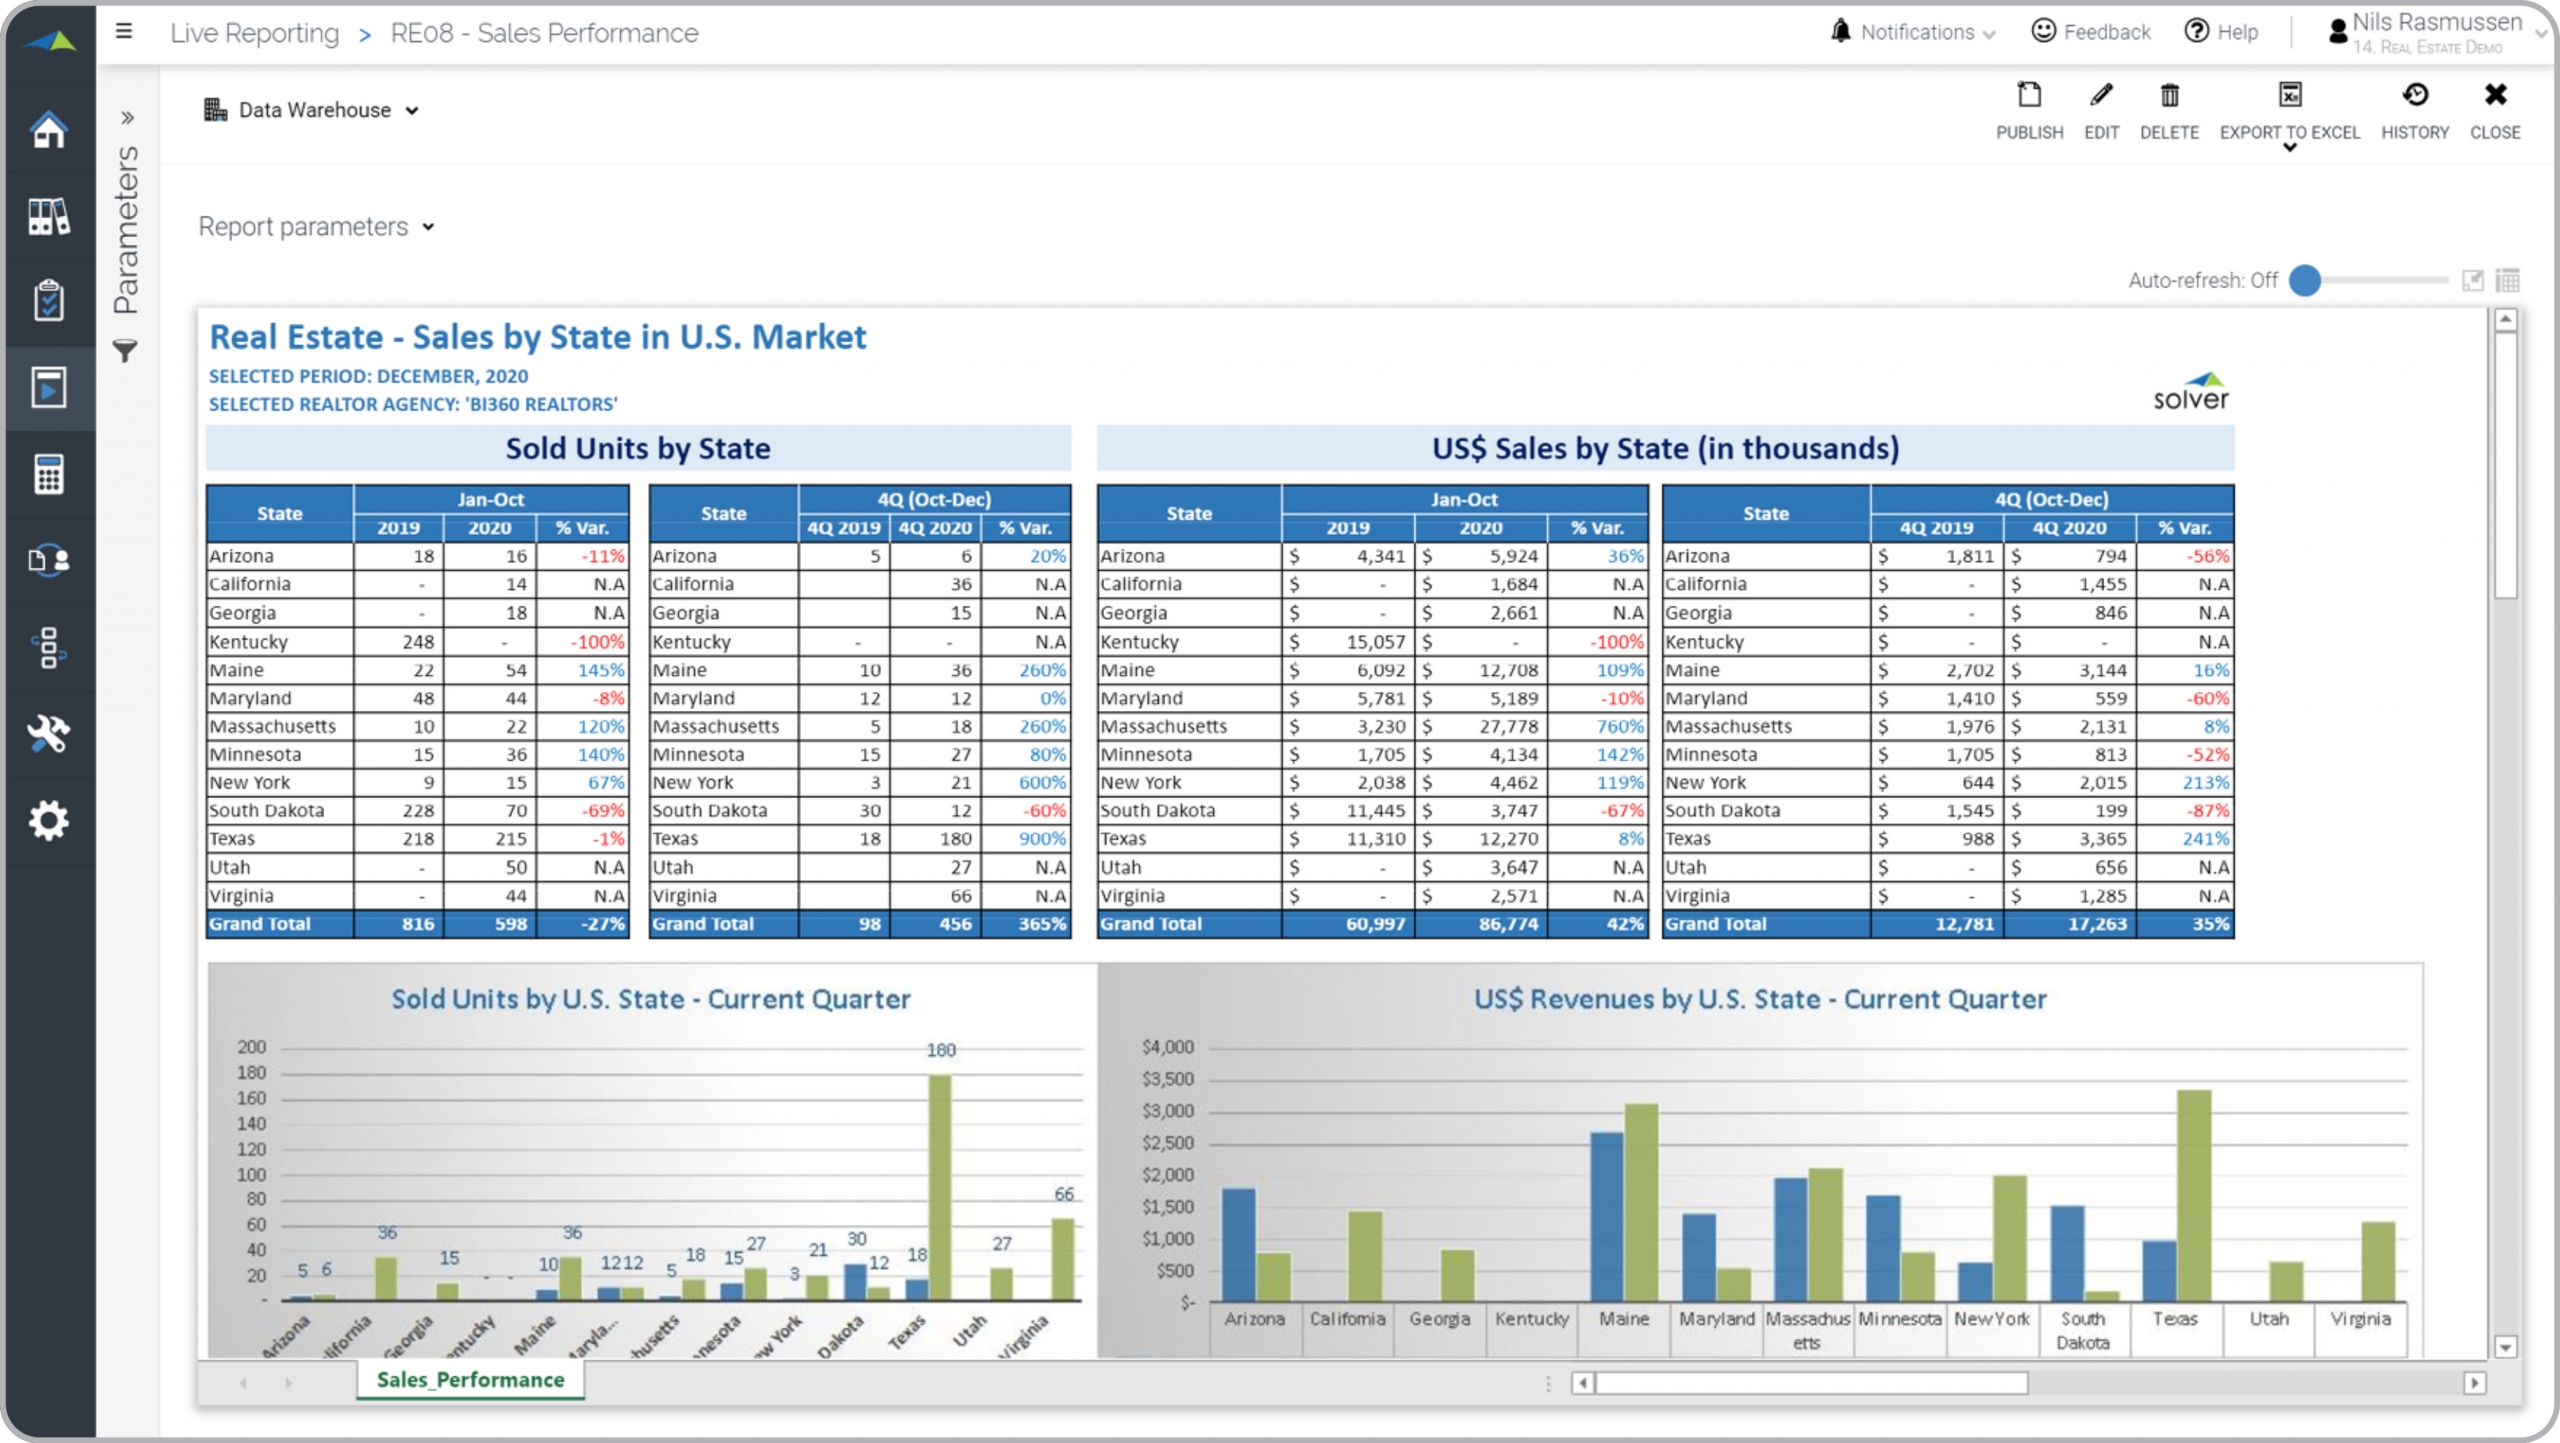
Real Estate – Sales Report
Report shows sales in amounts and units per state with year over year variance analysis.
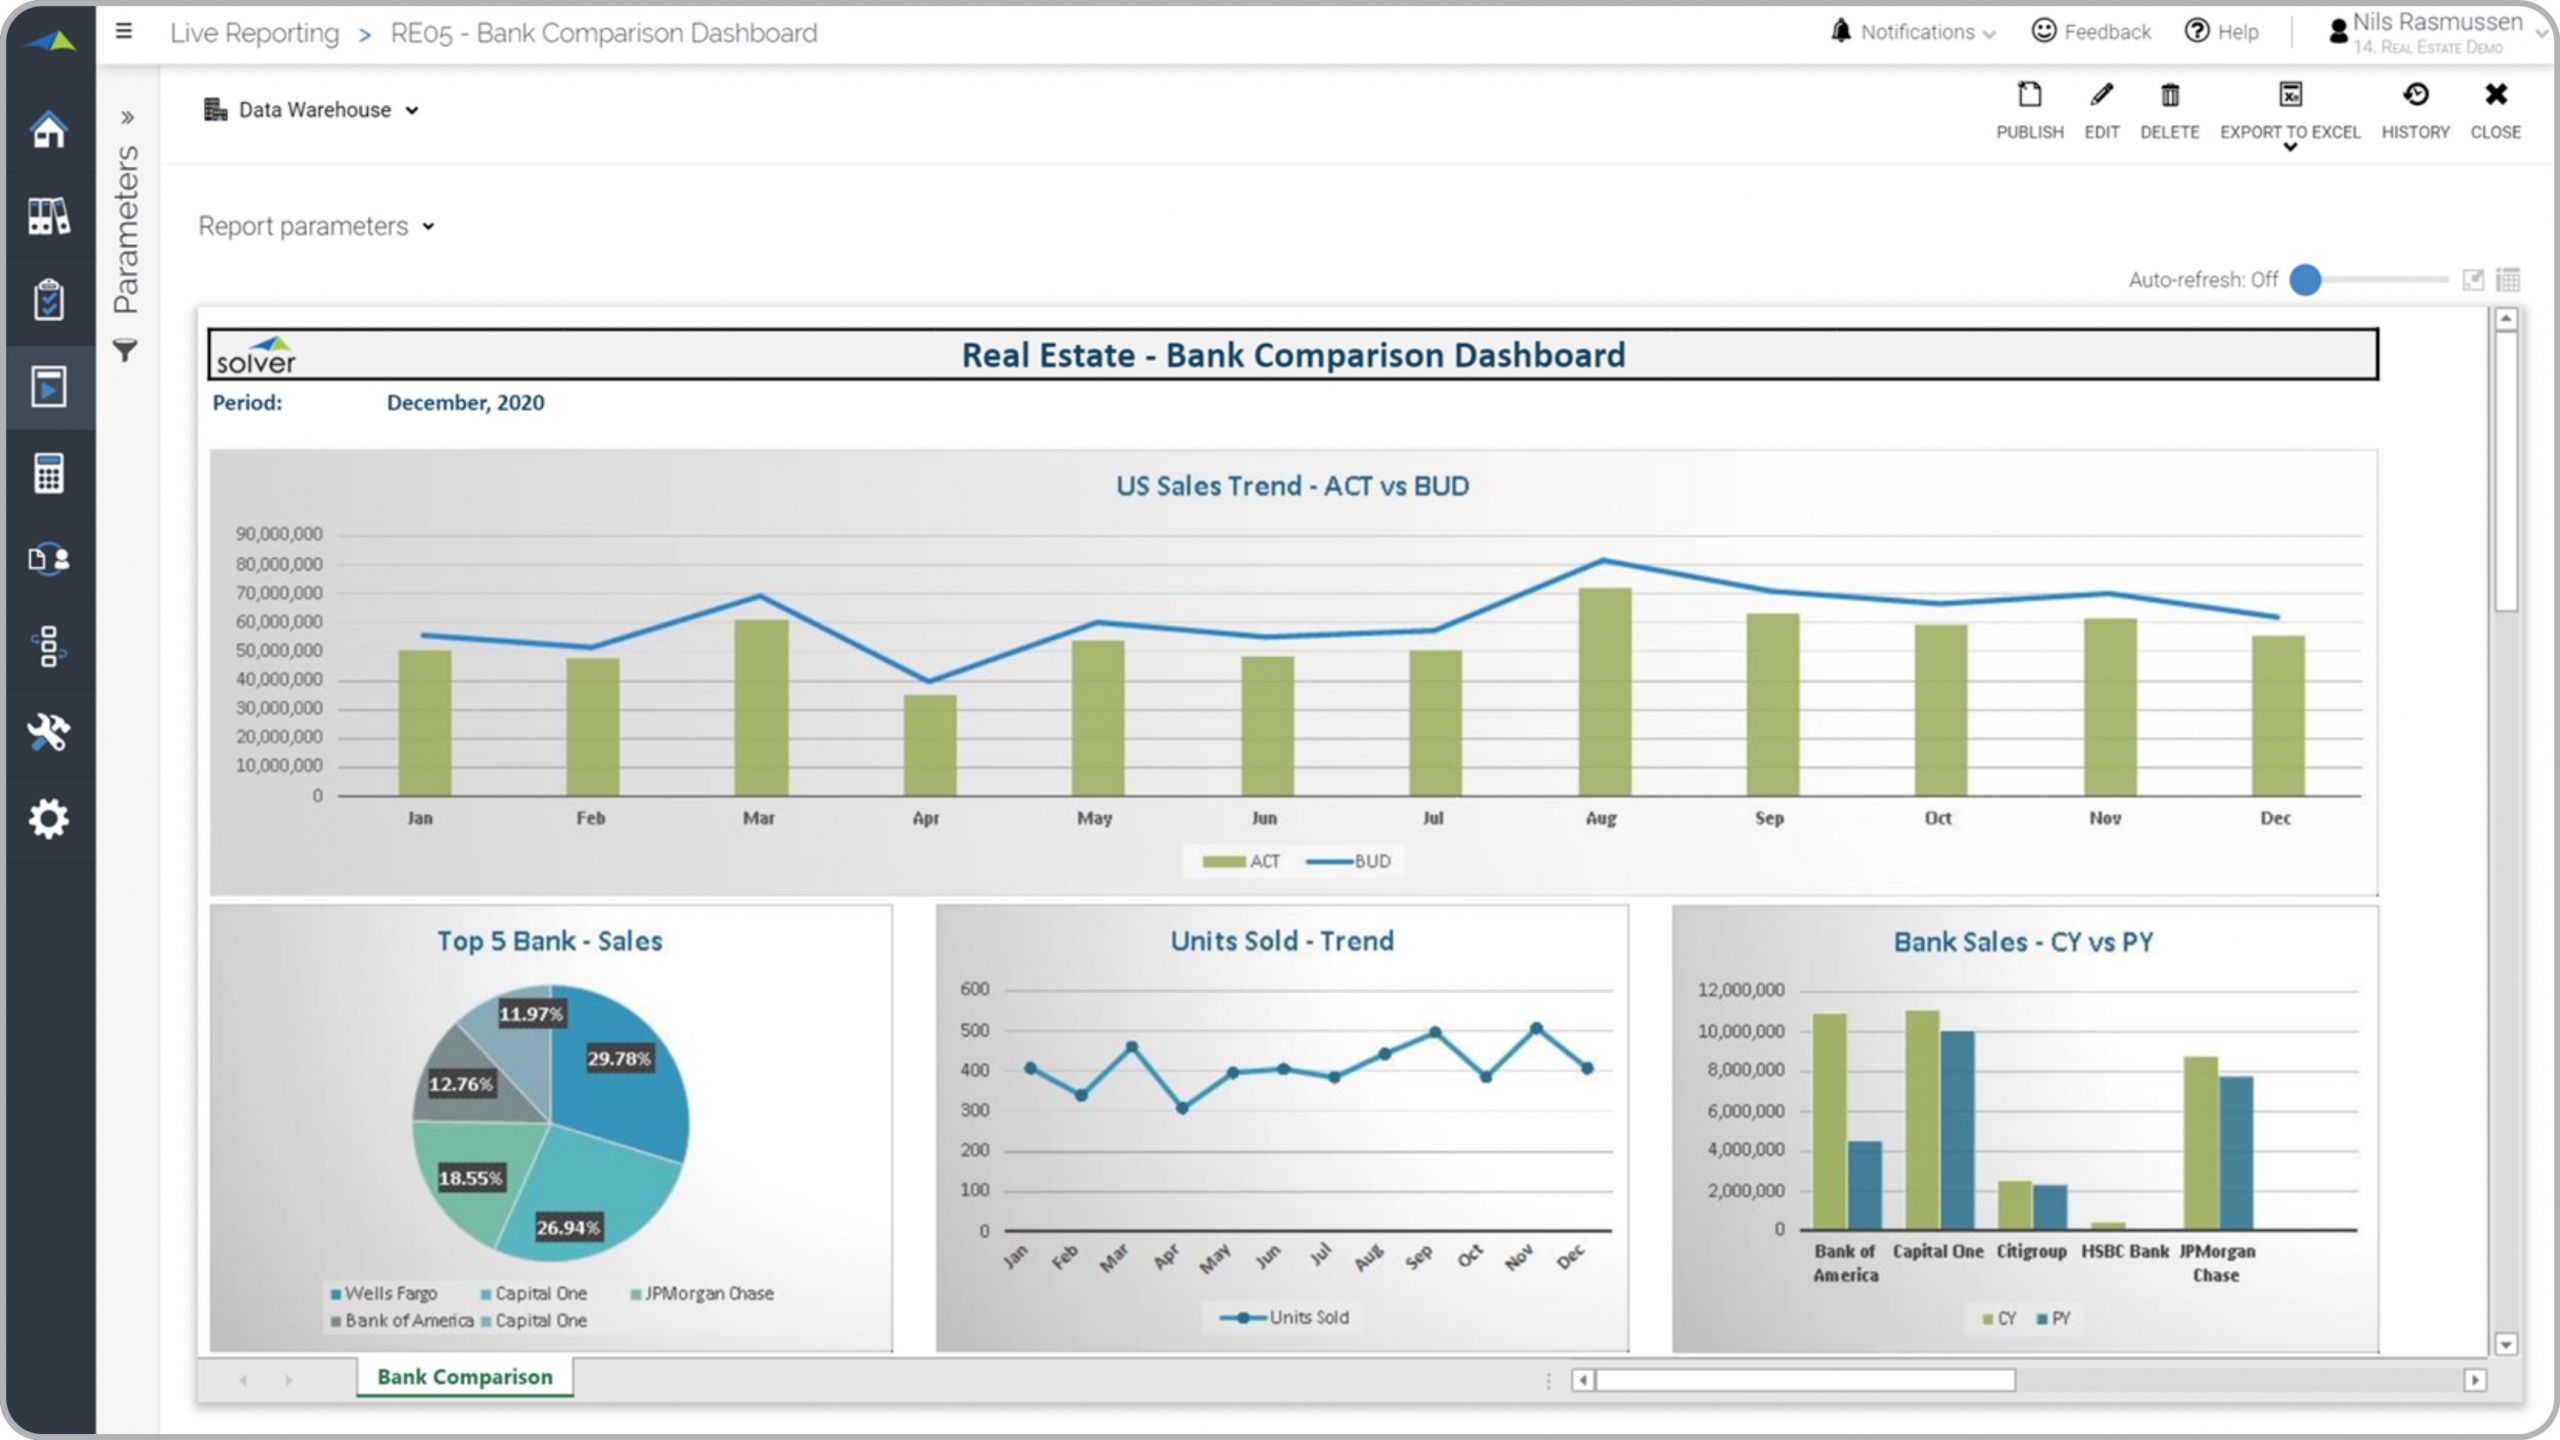
Real Estate – Bank Dashboard
This dashboard provides real estate sales trend with comparison of banks used in deals.
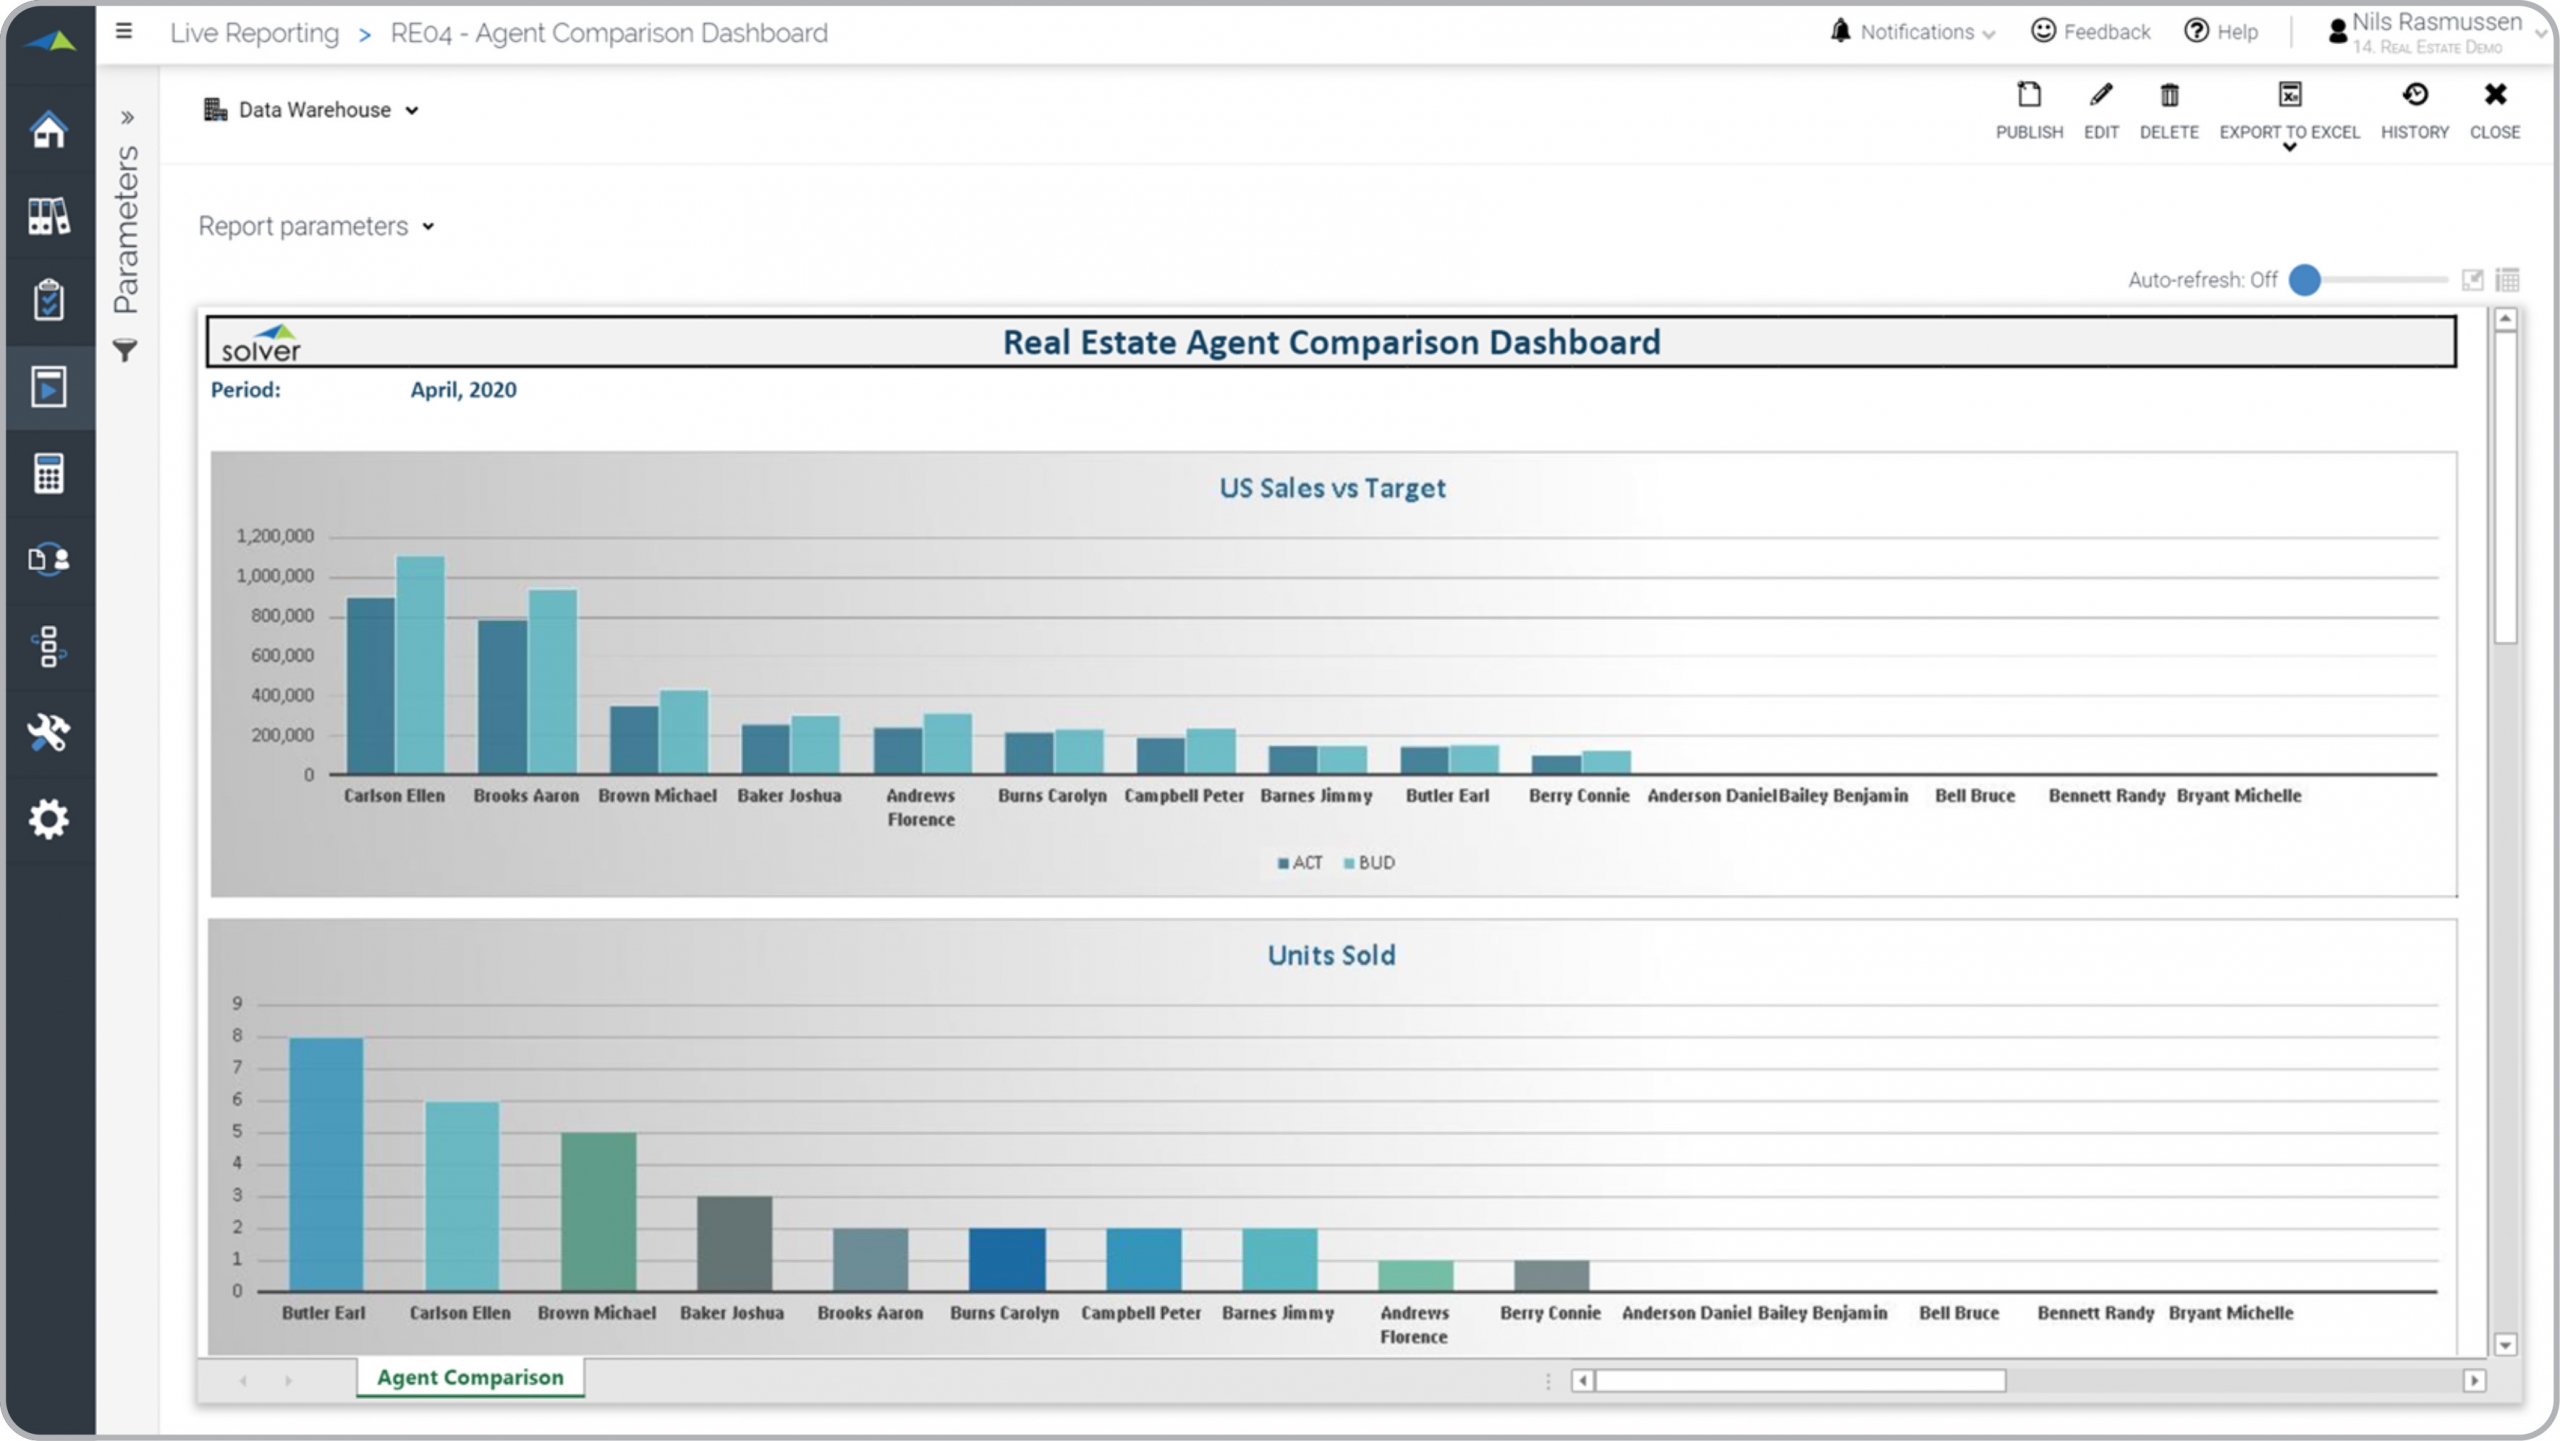
Real Estate – Agent Dashboard
Ranked analysis of real estate agents based on total sales and units sold versus target.
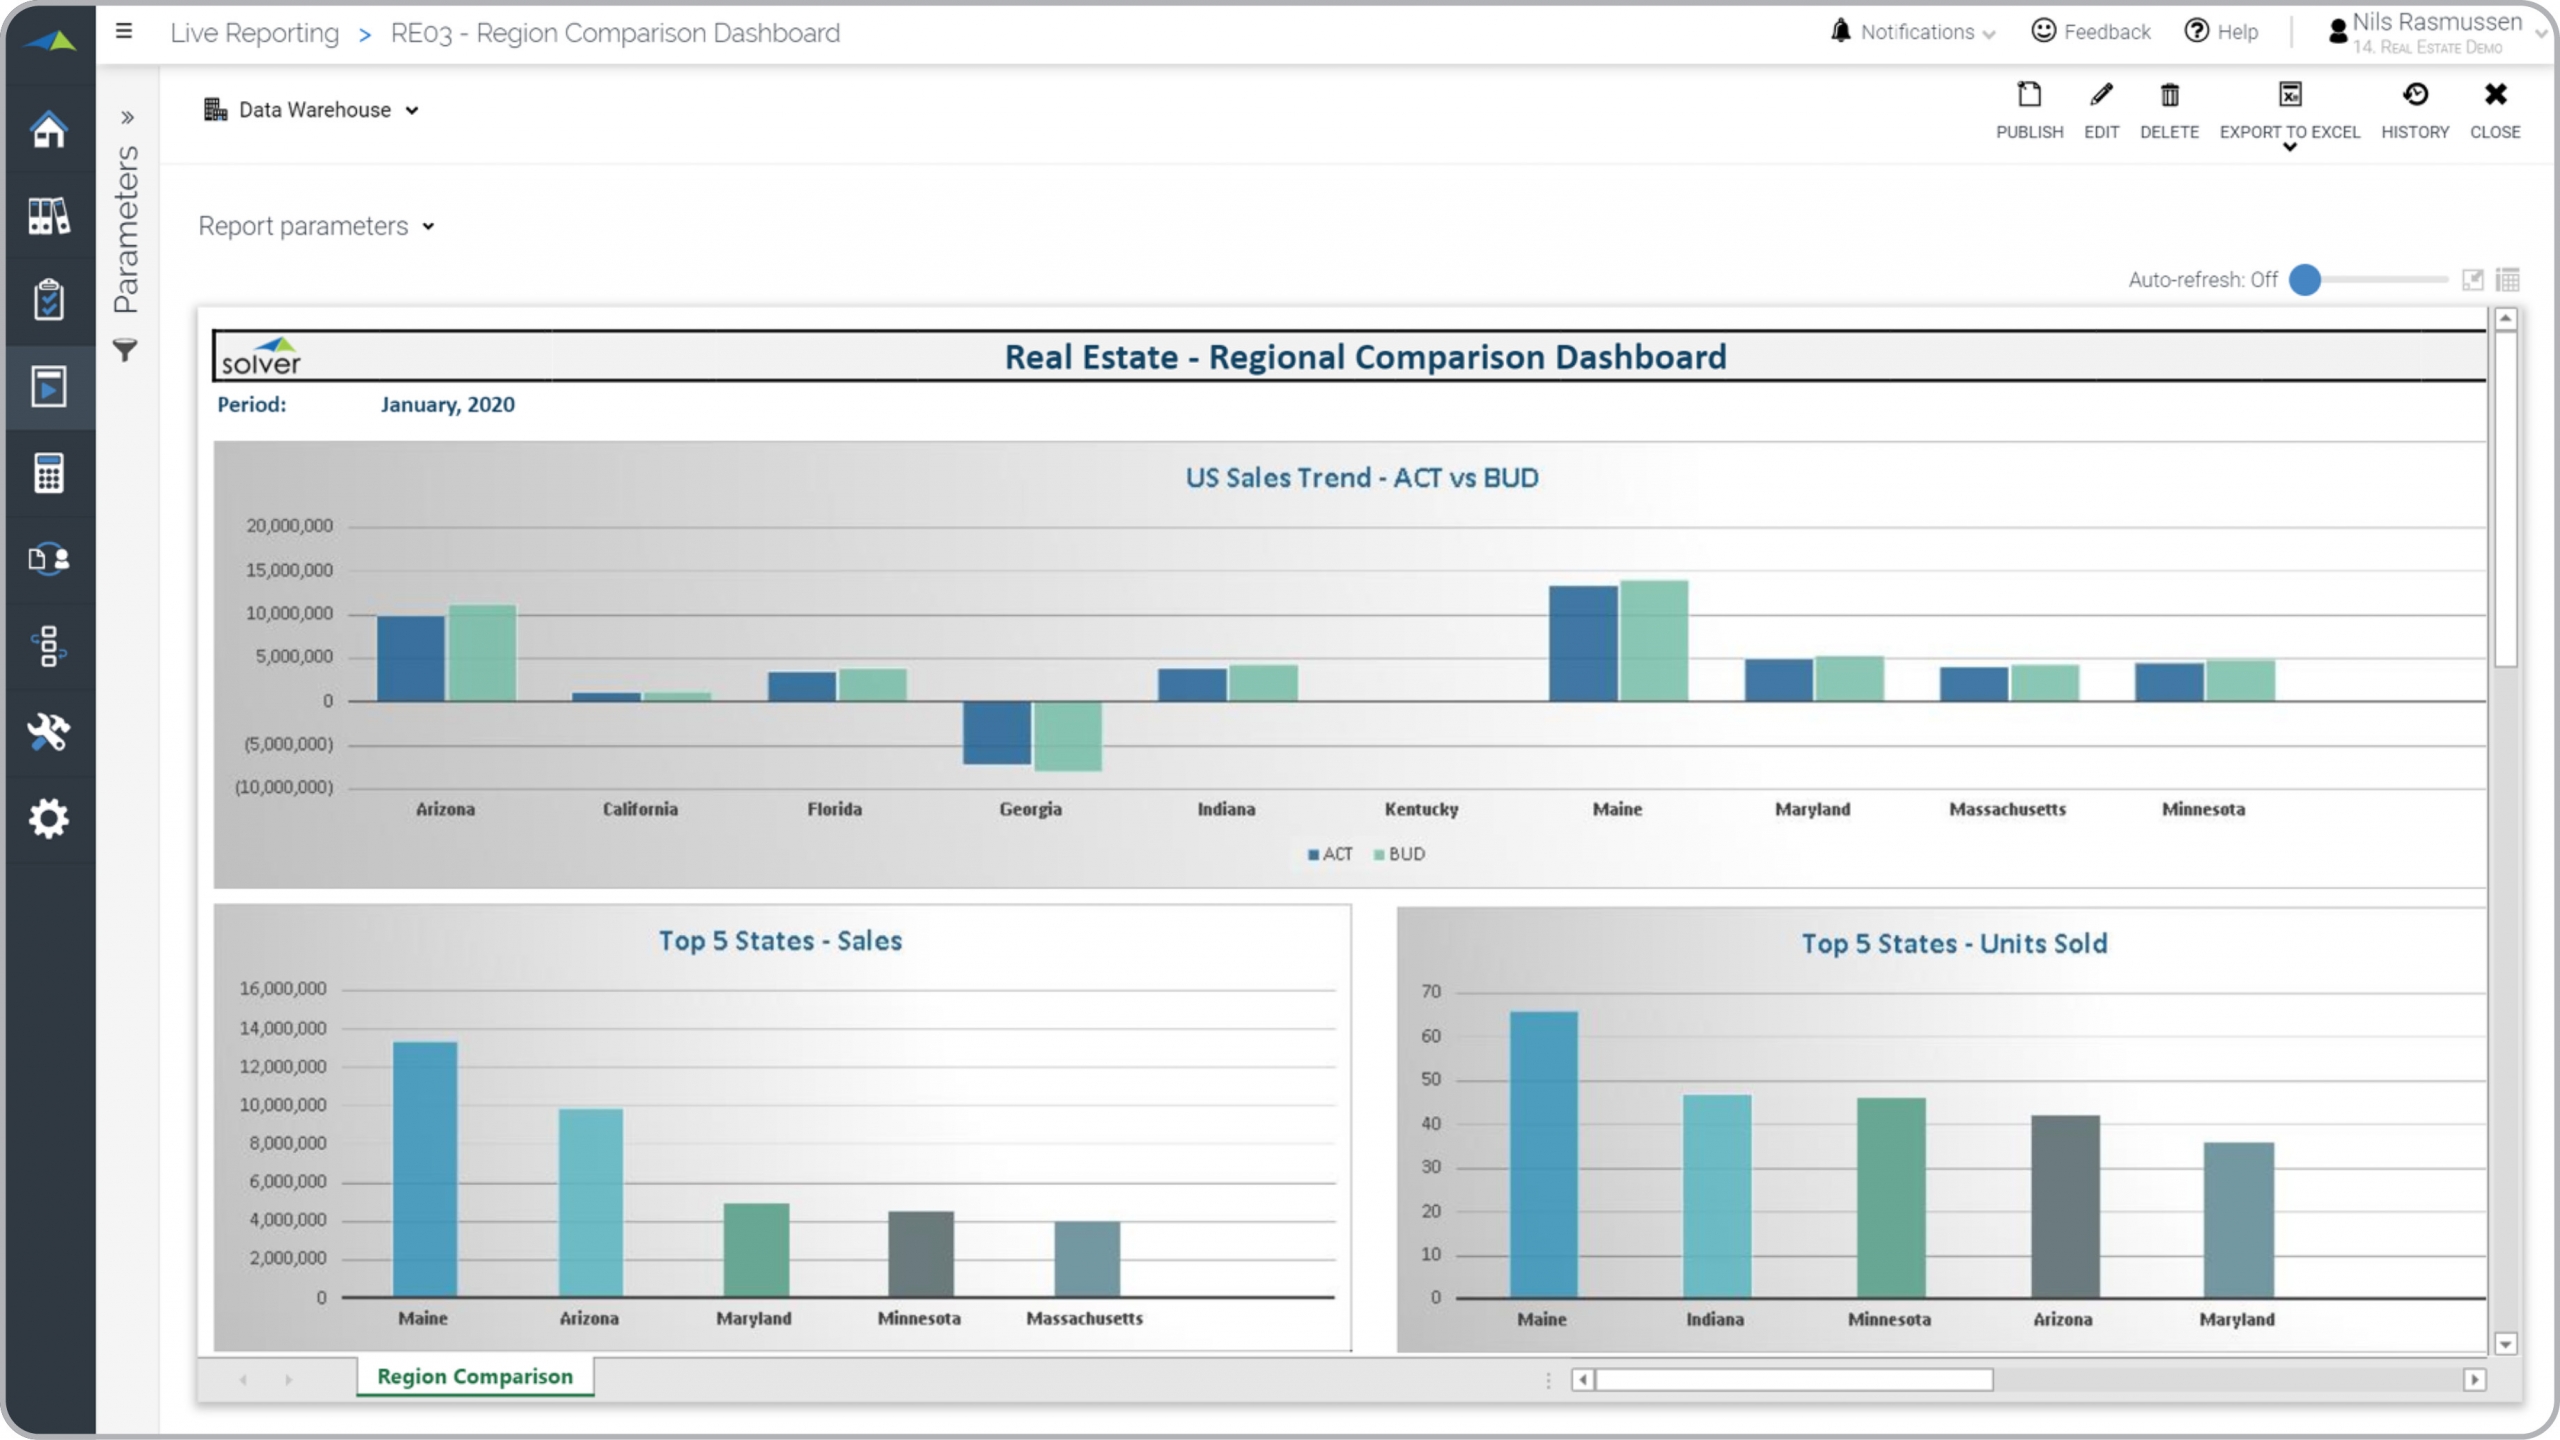
Real Estate – Regional Dashboard
Shows dashboard view of real estate sales & units sold per region and actual vs budget trend
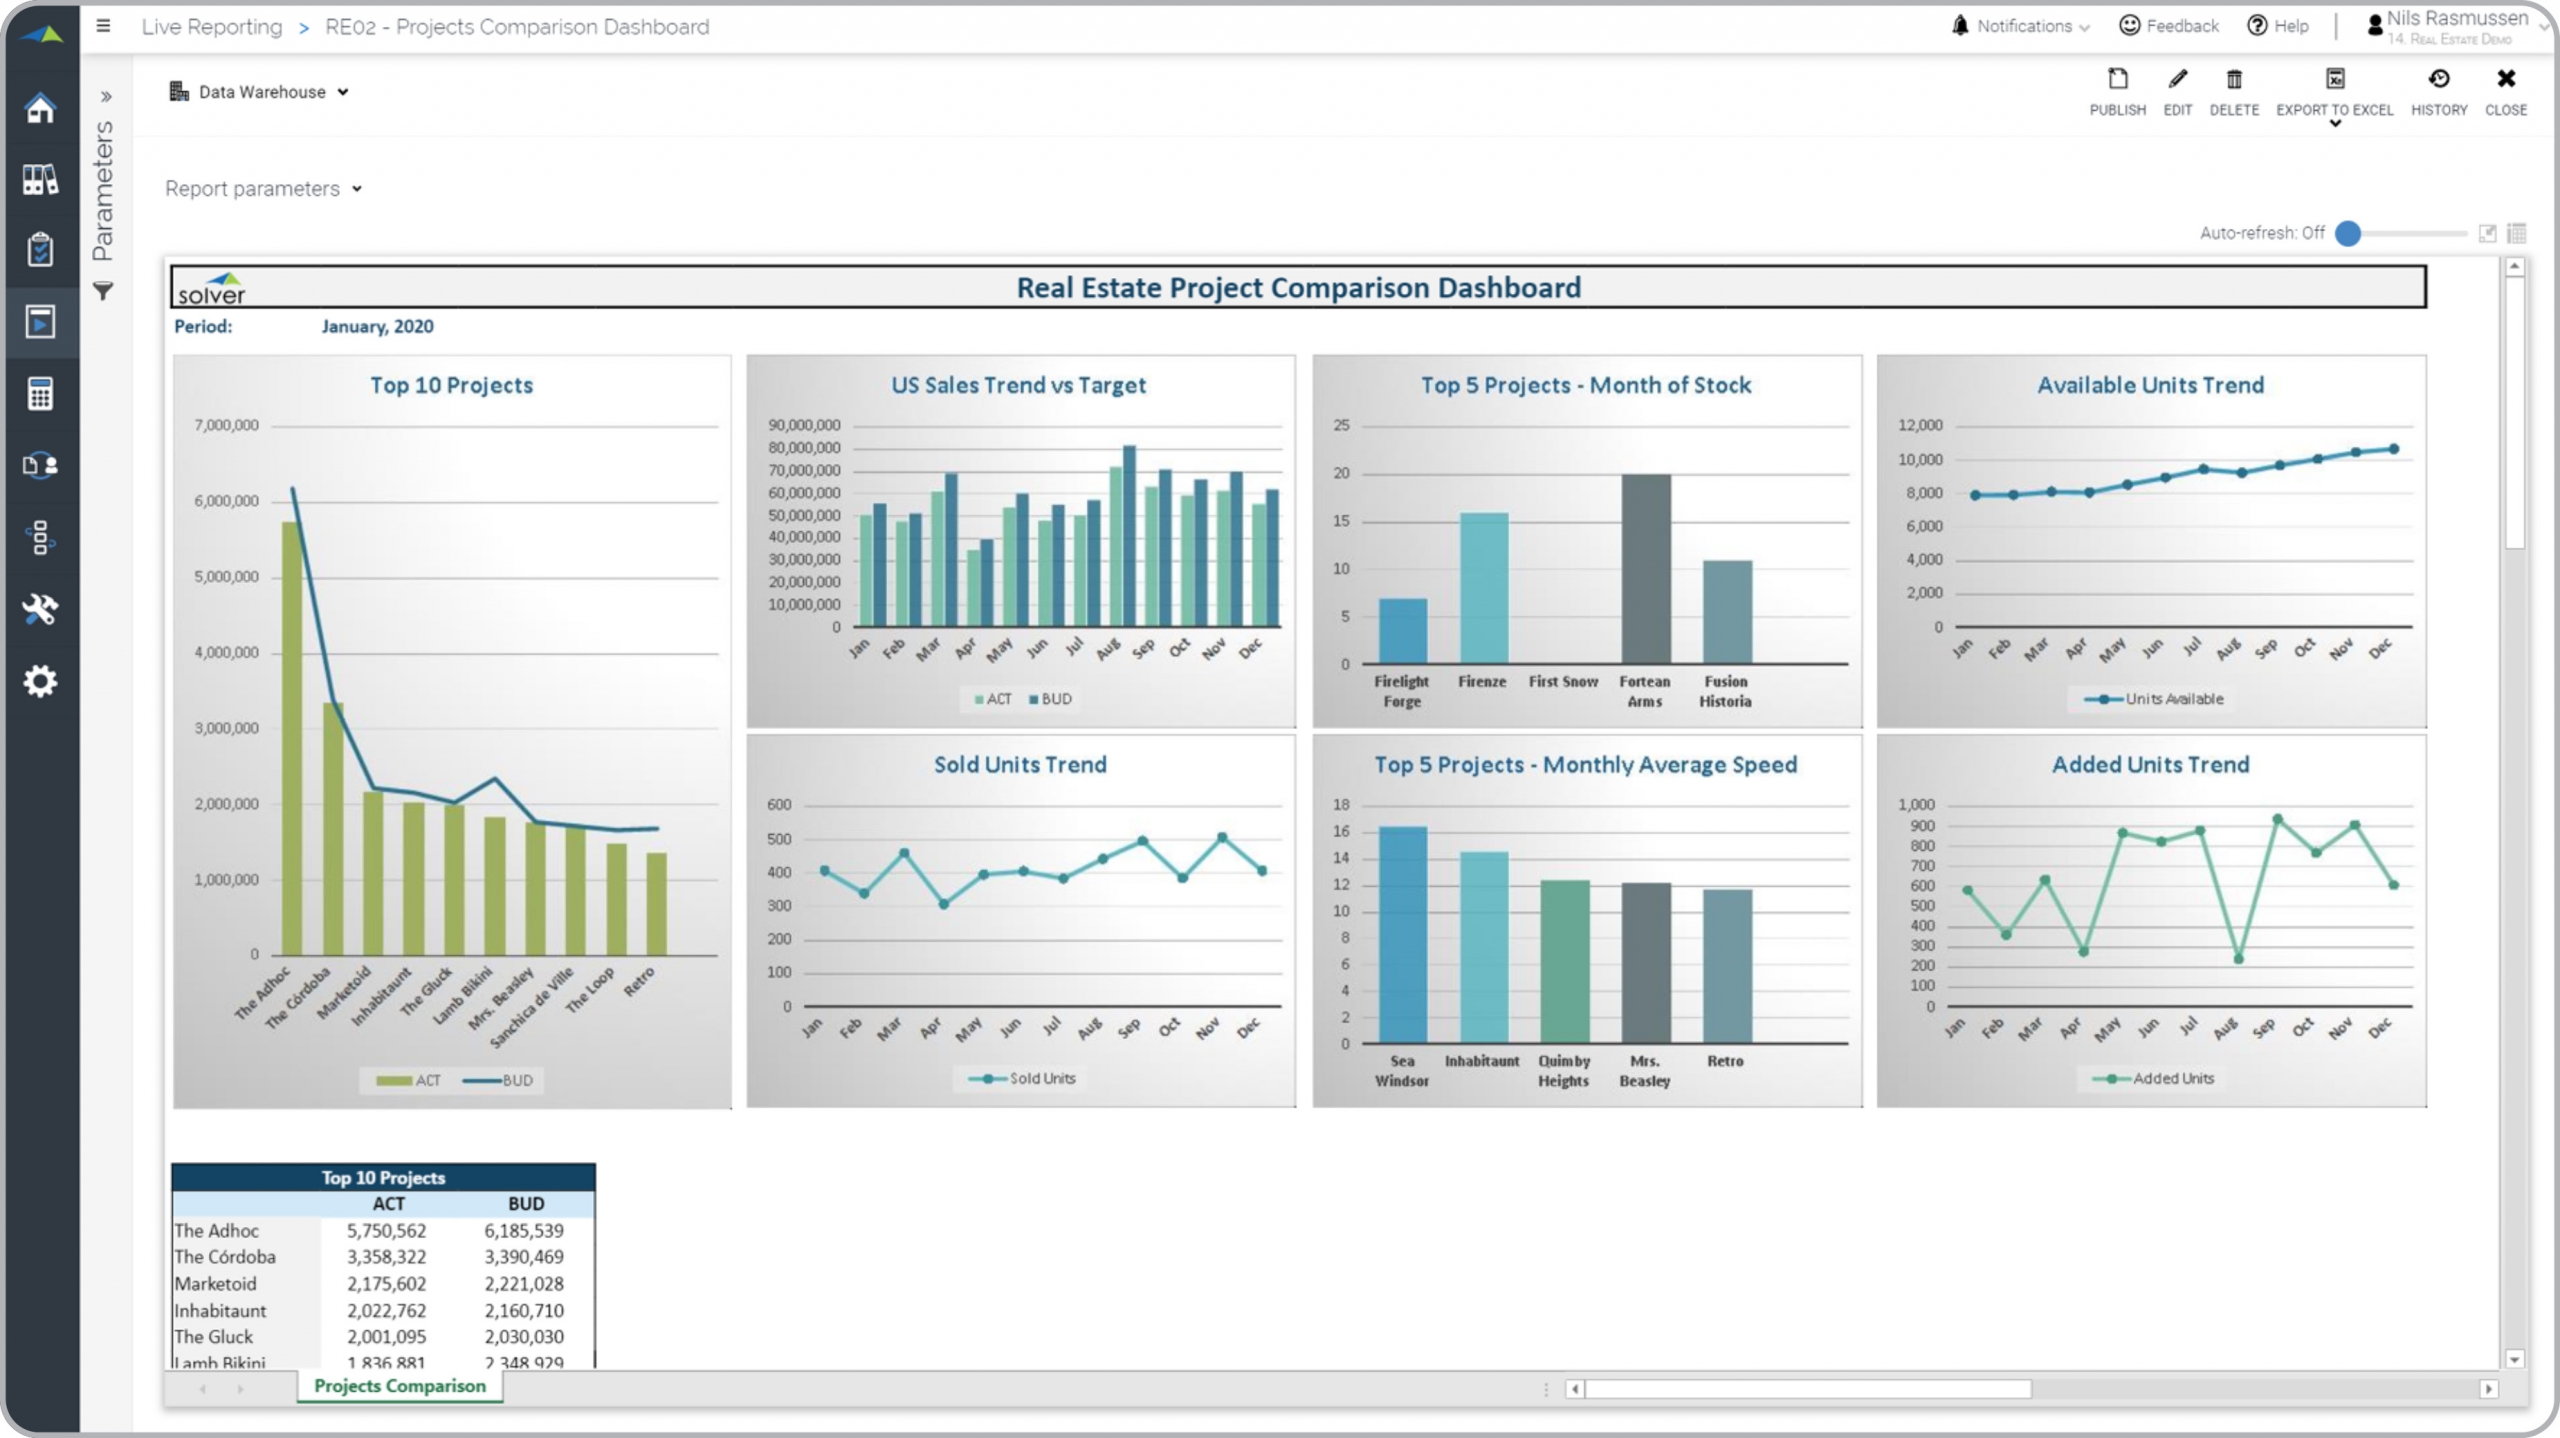
Real Estate – Project Dashboard
Dashboard with focus on real estate project with sales trend, average speed, available units, etc.
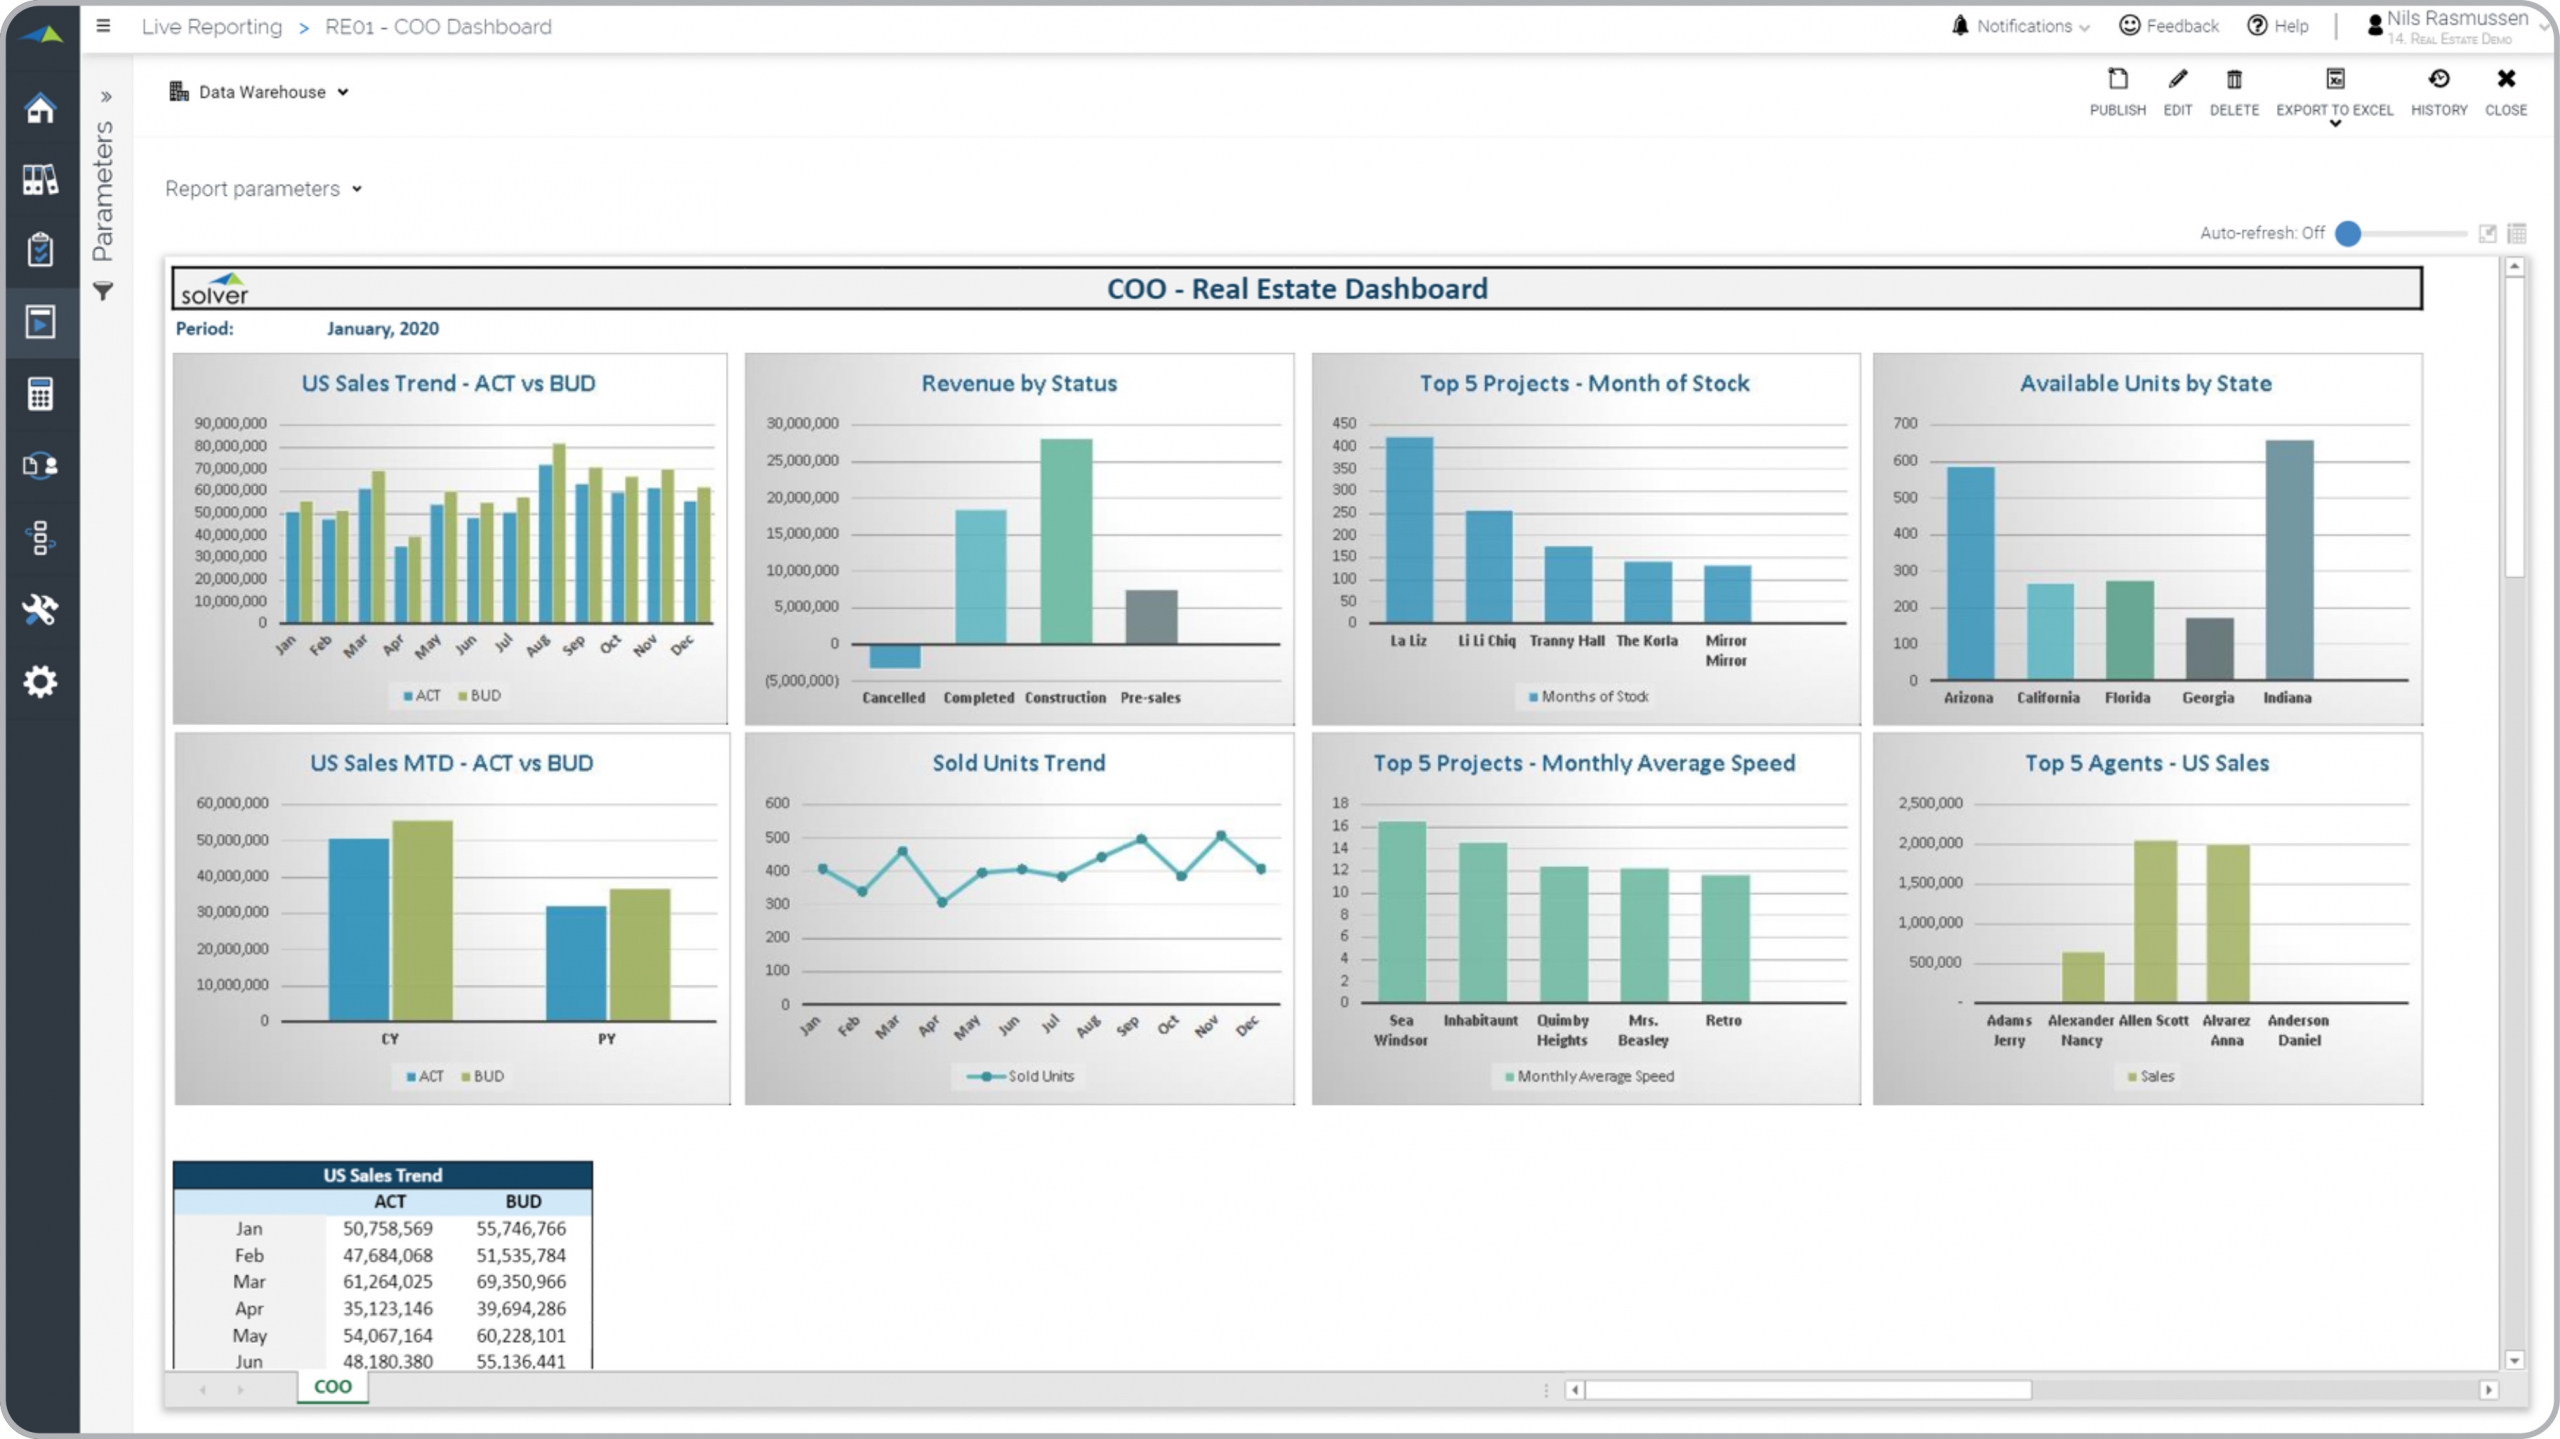
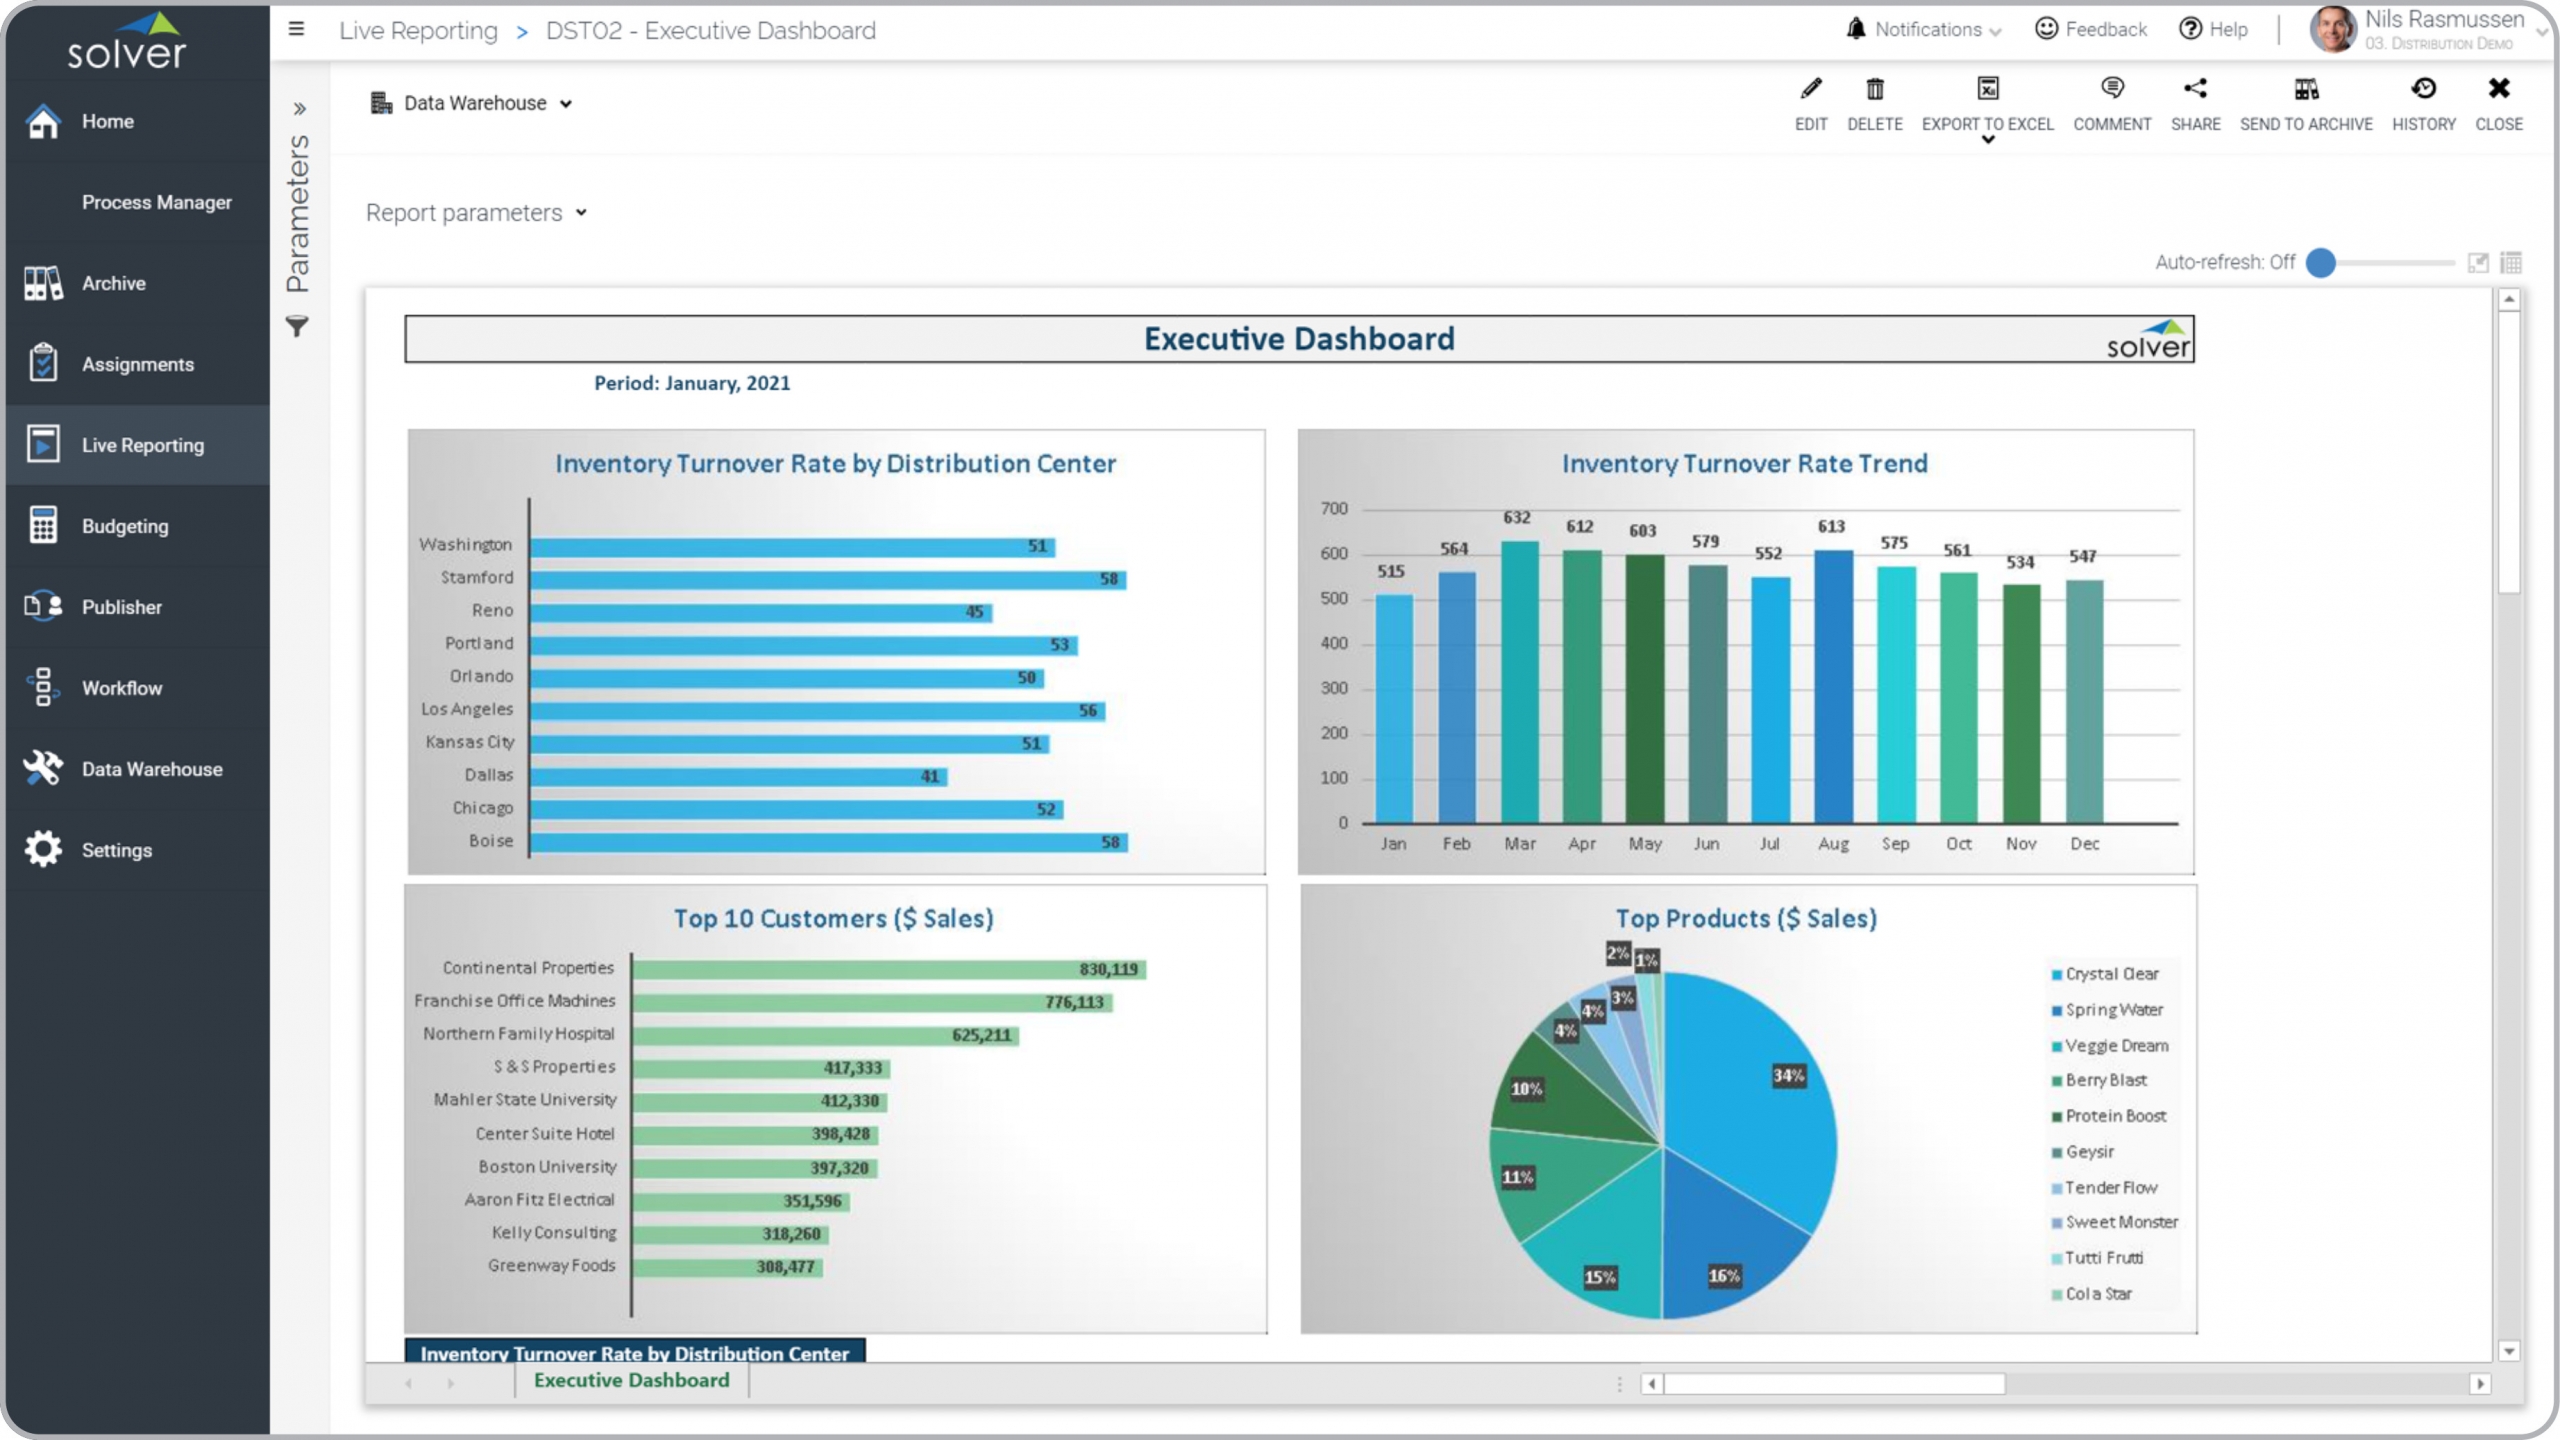
Real Estate – Executive Dashboard
Executive view of sales trend, available units, top projects and top real estate agents.
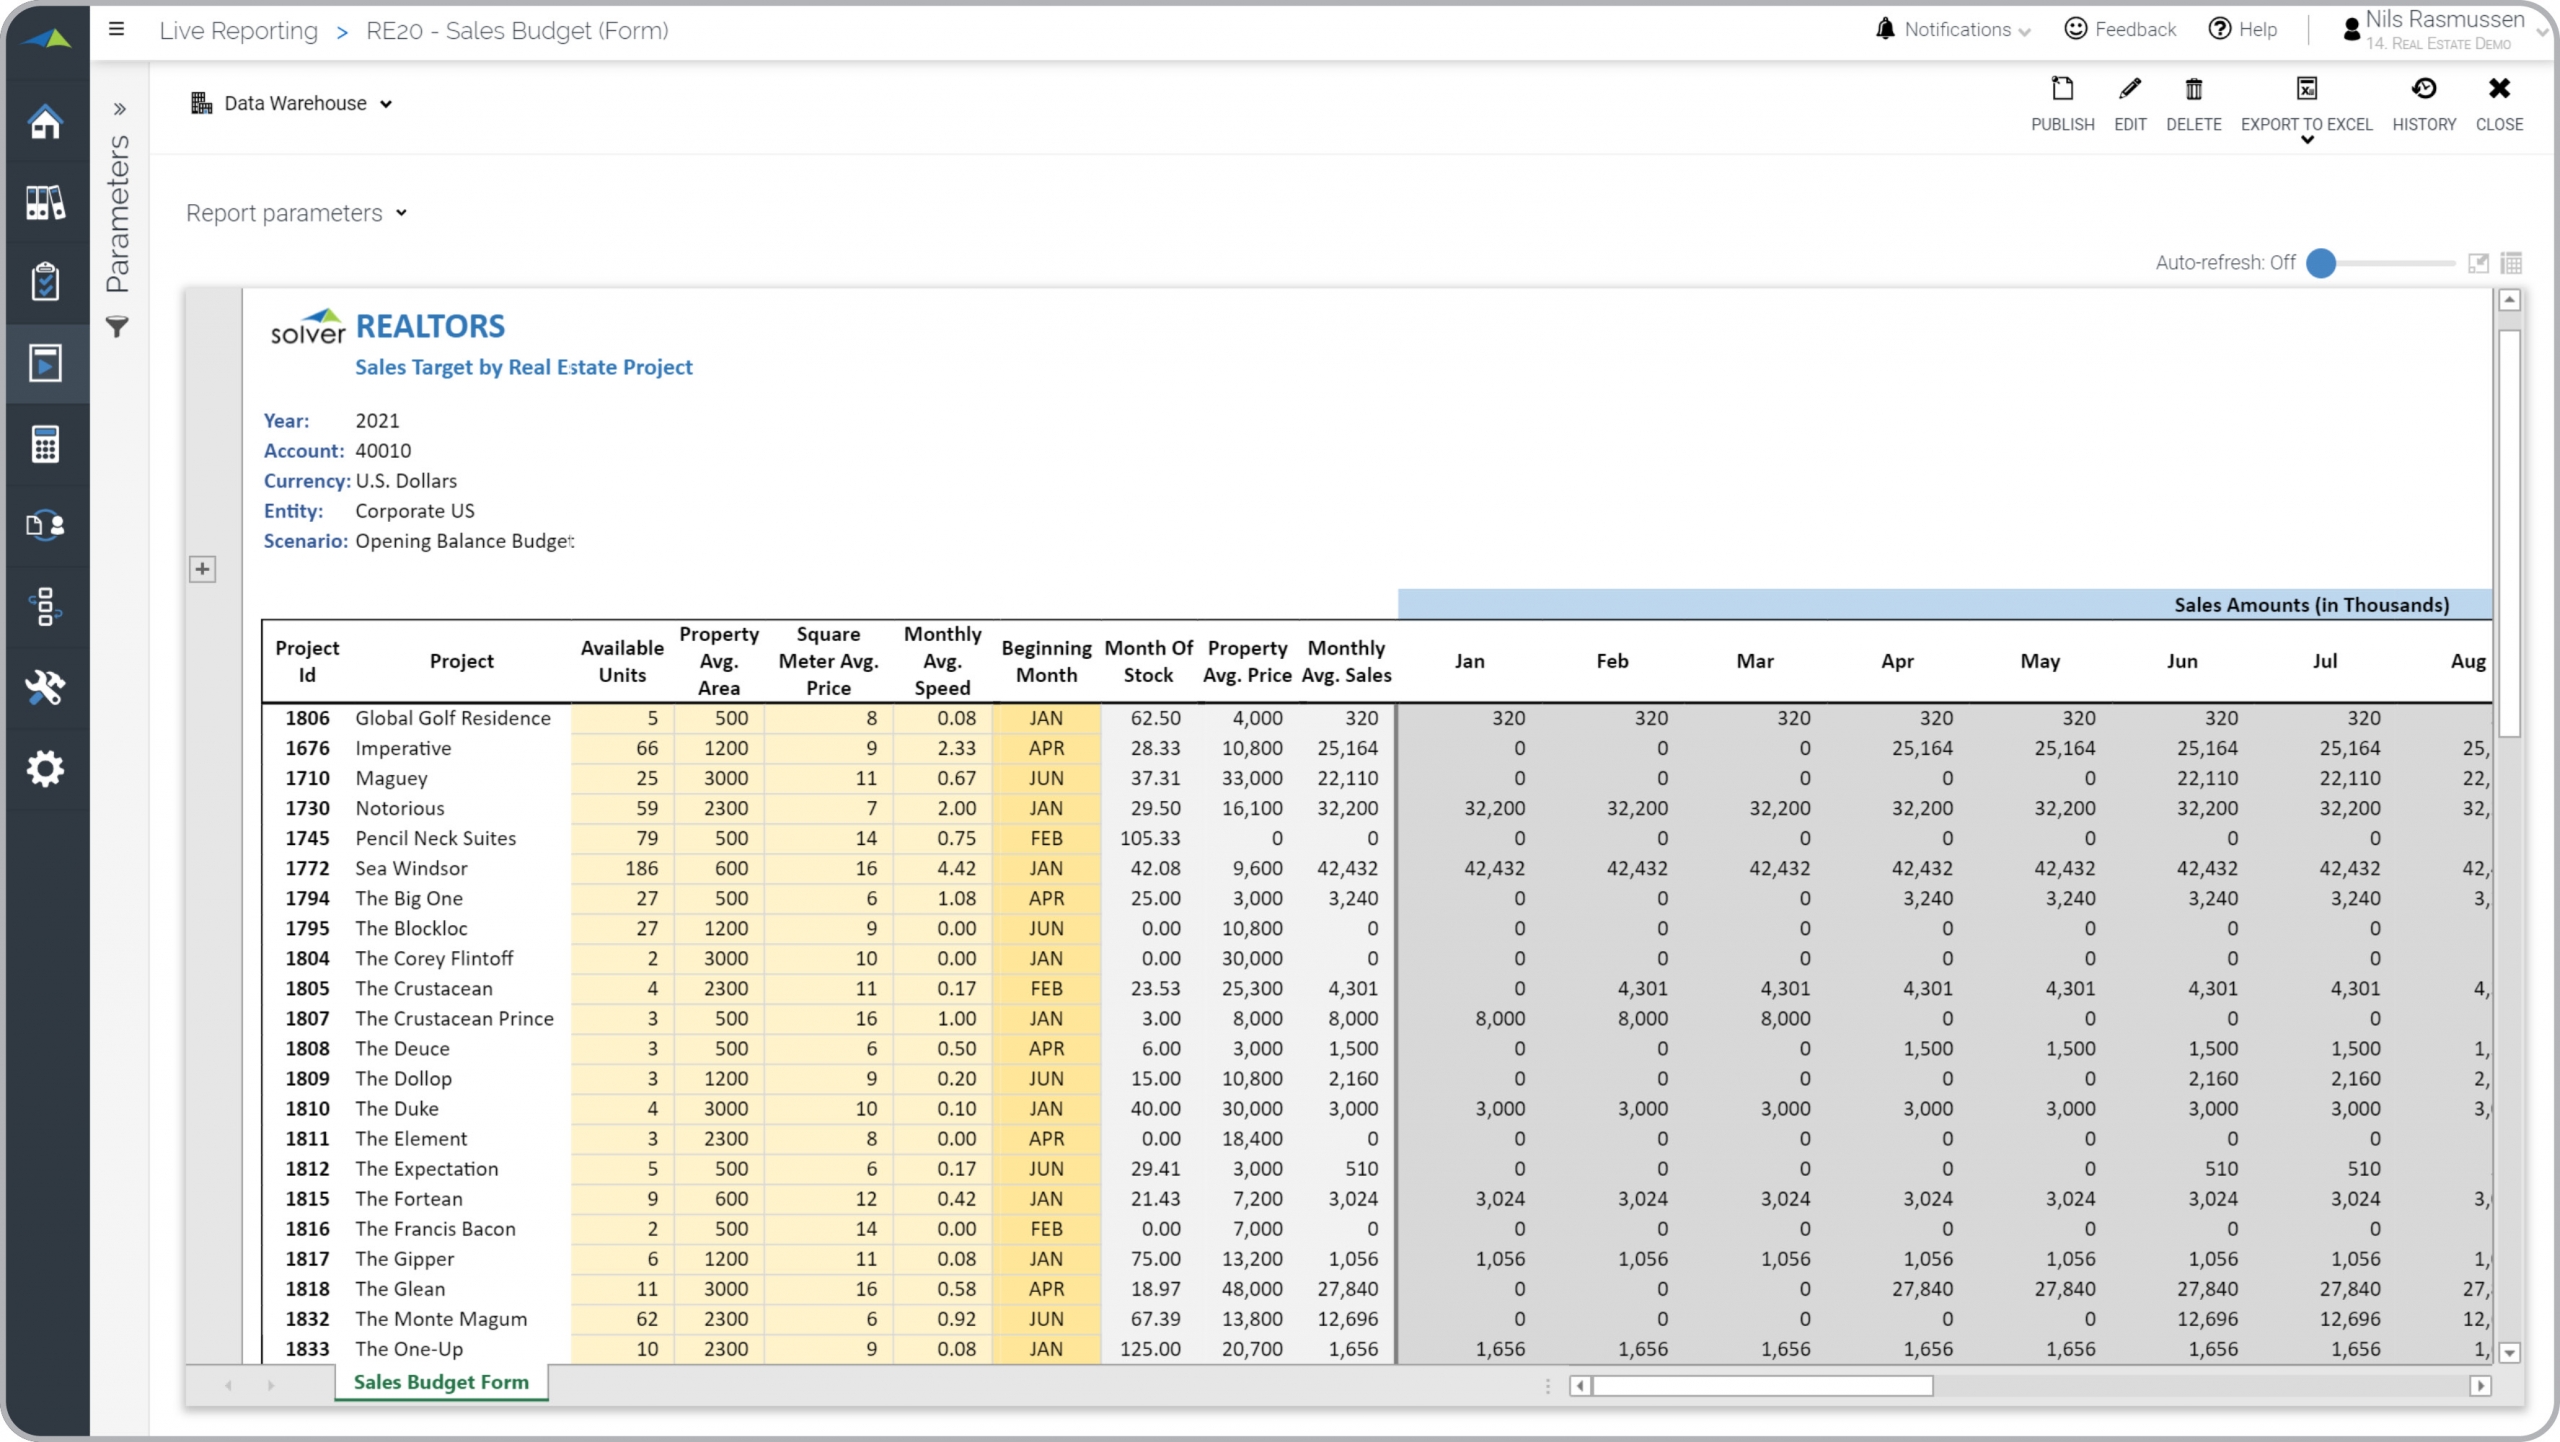
Real Estate – Sales Forecast
Create budgets and forecasts by real estate project based on price, size, units and more.
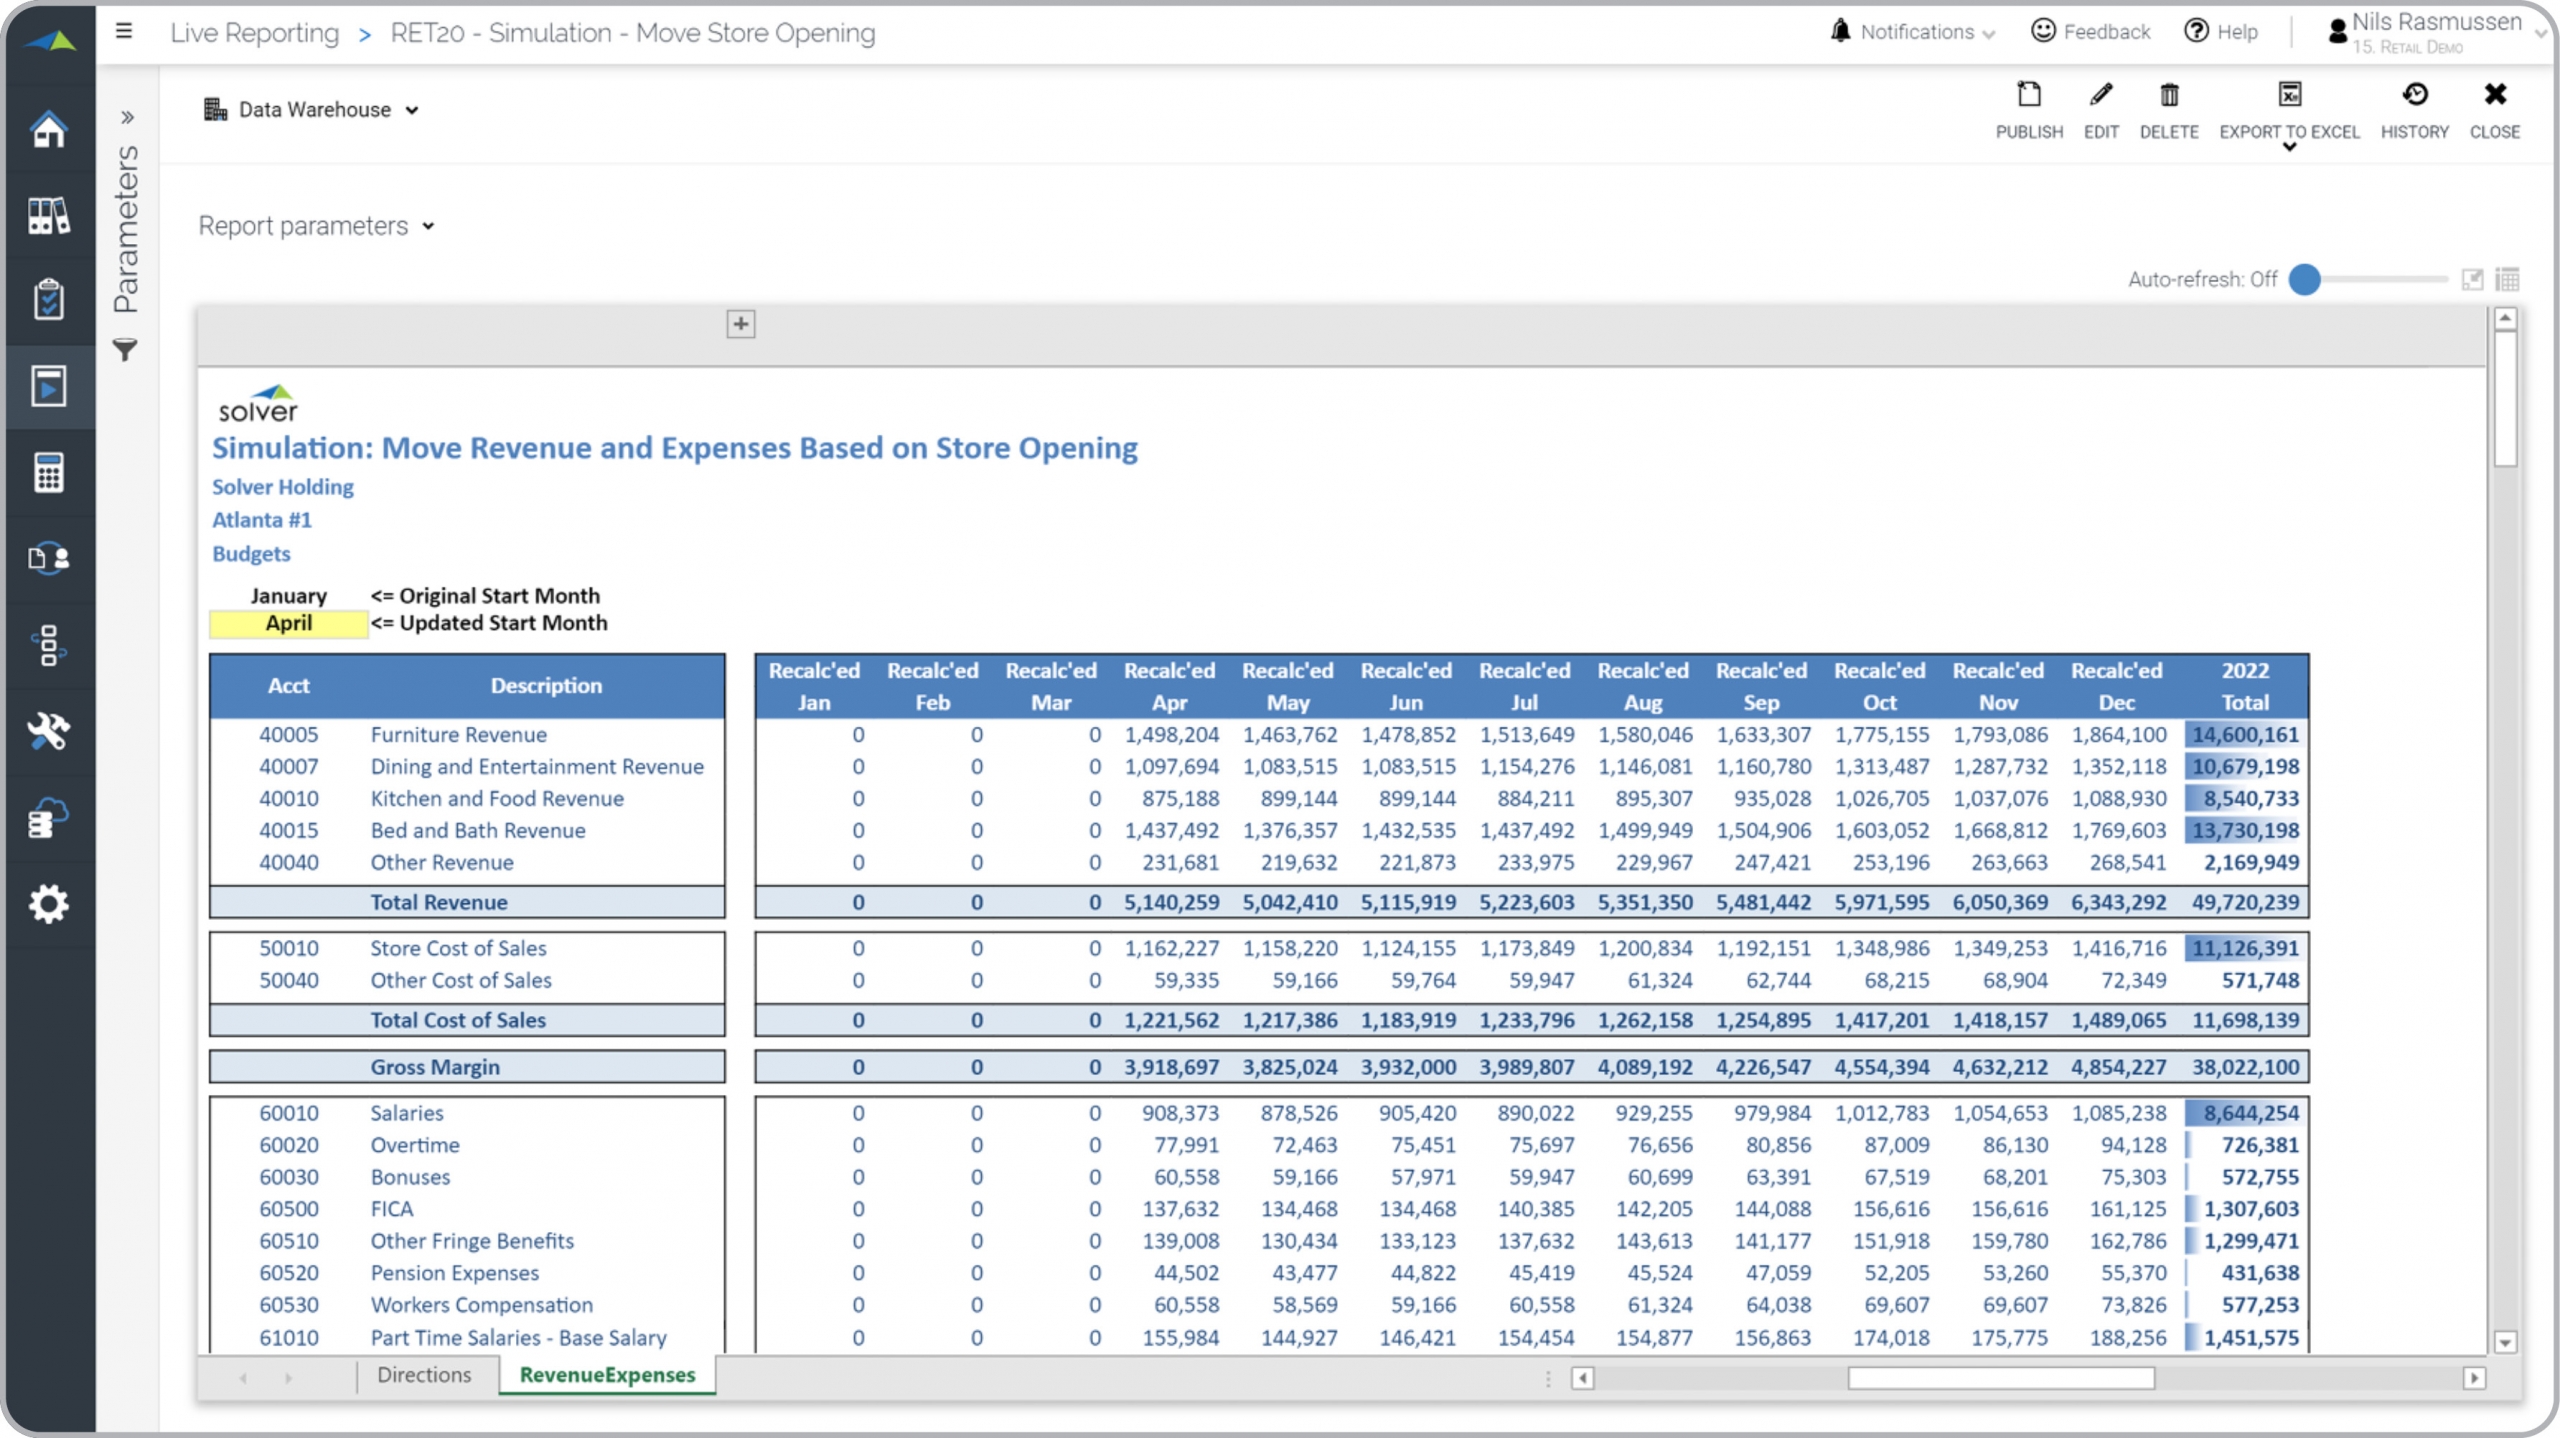
Retail – Simulation of Store Opening
This report automatically projects a P&L for a new store opening based on similar stores.
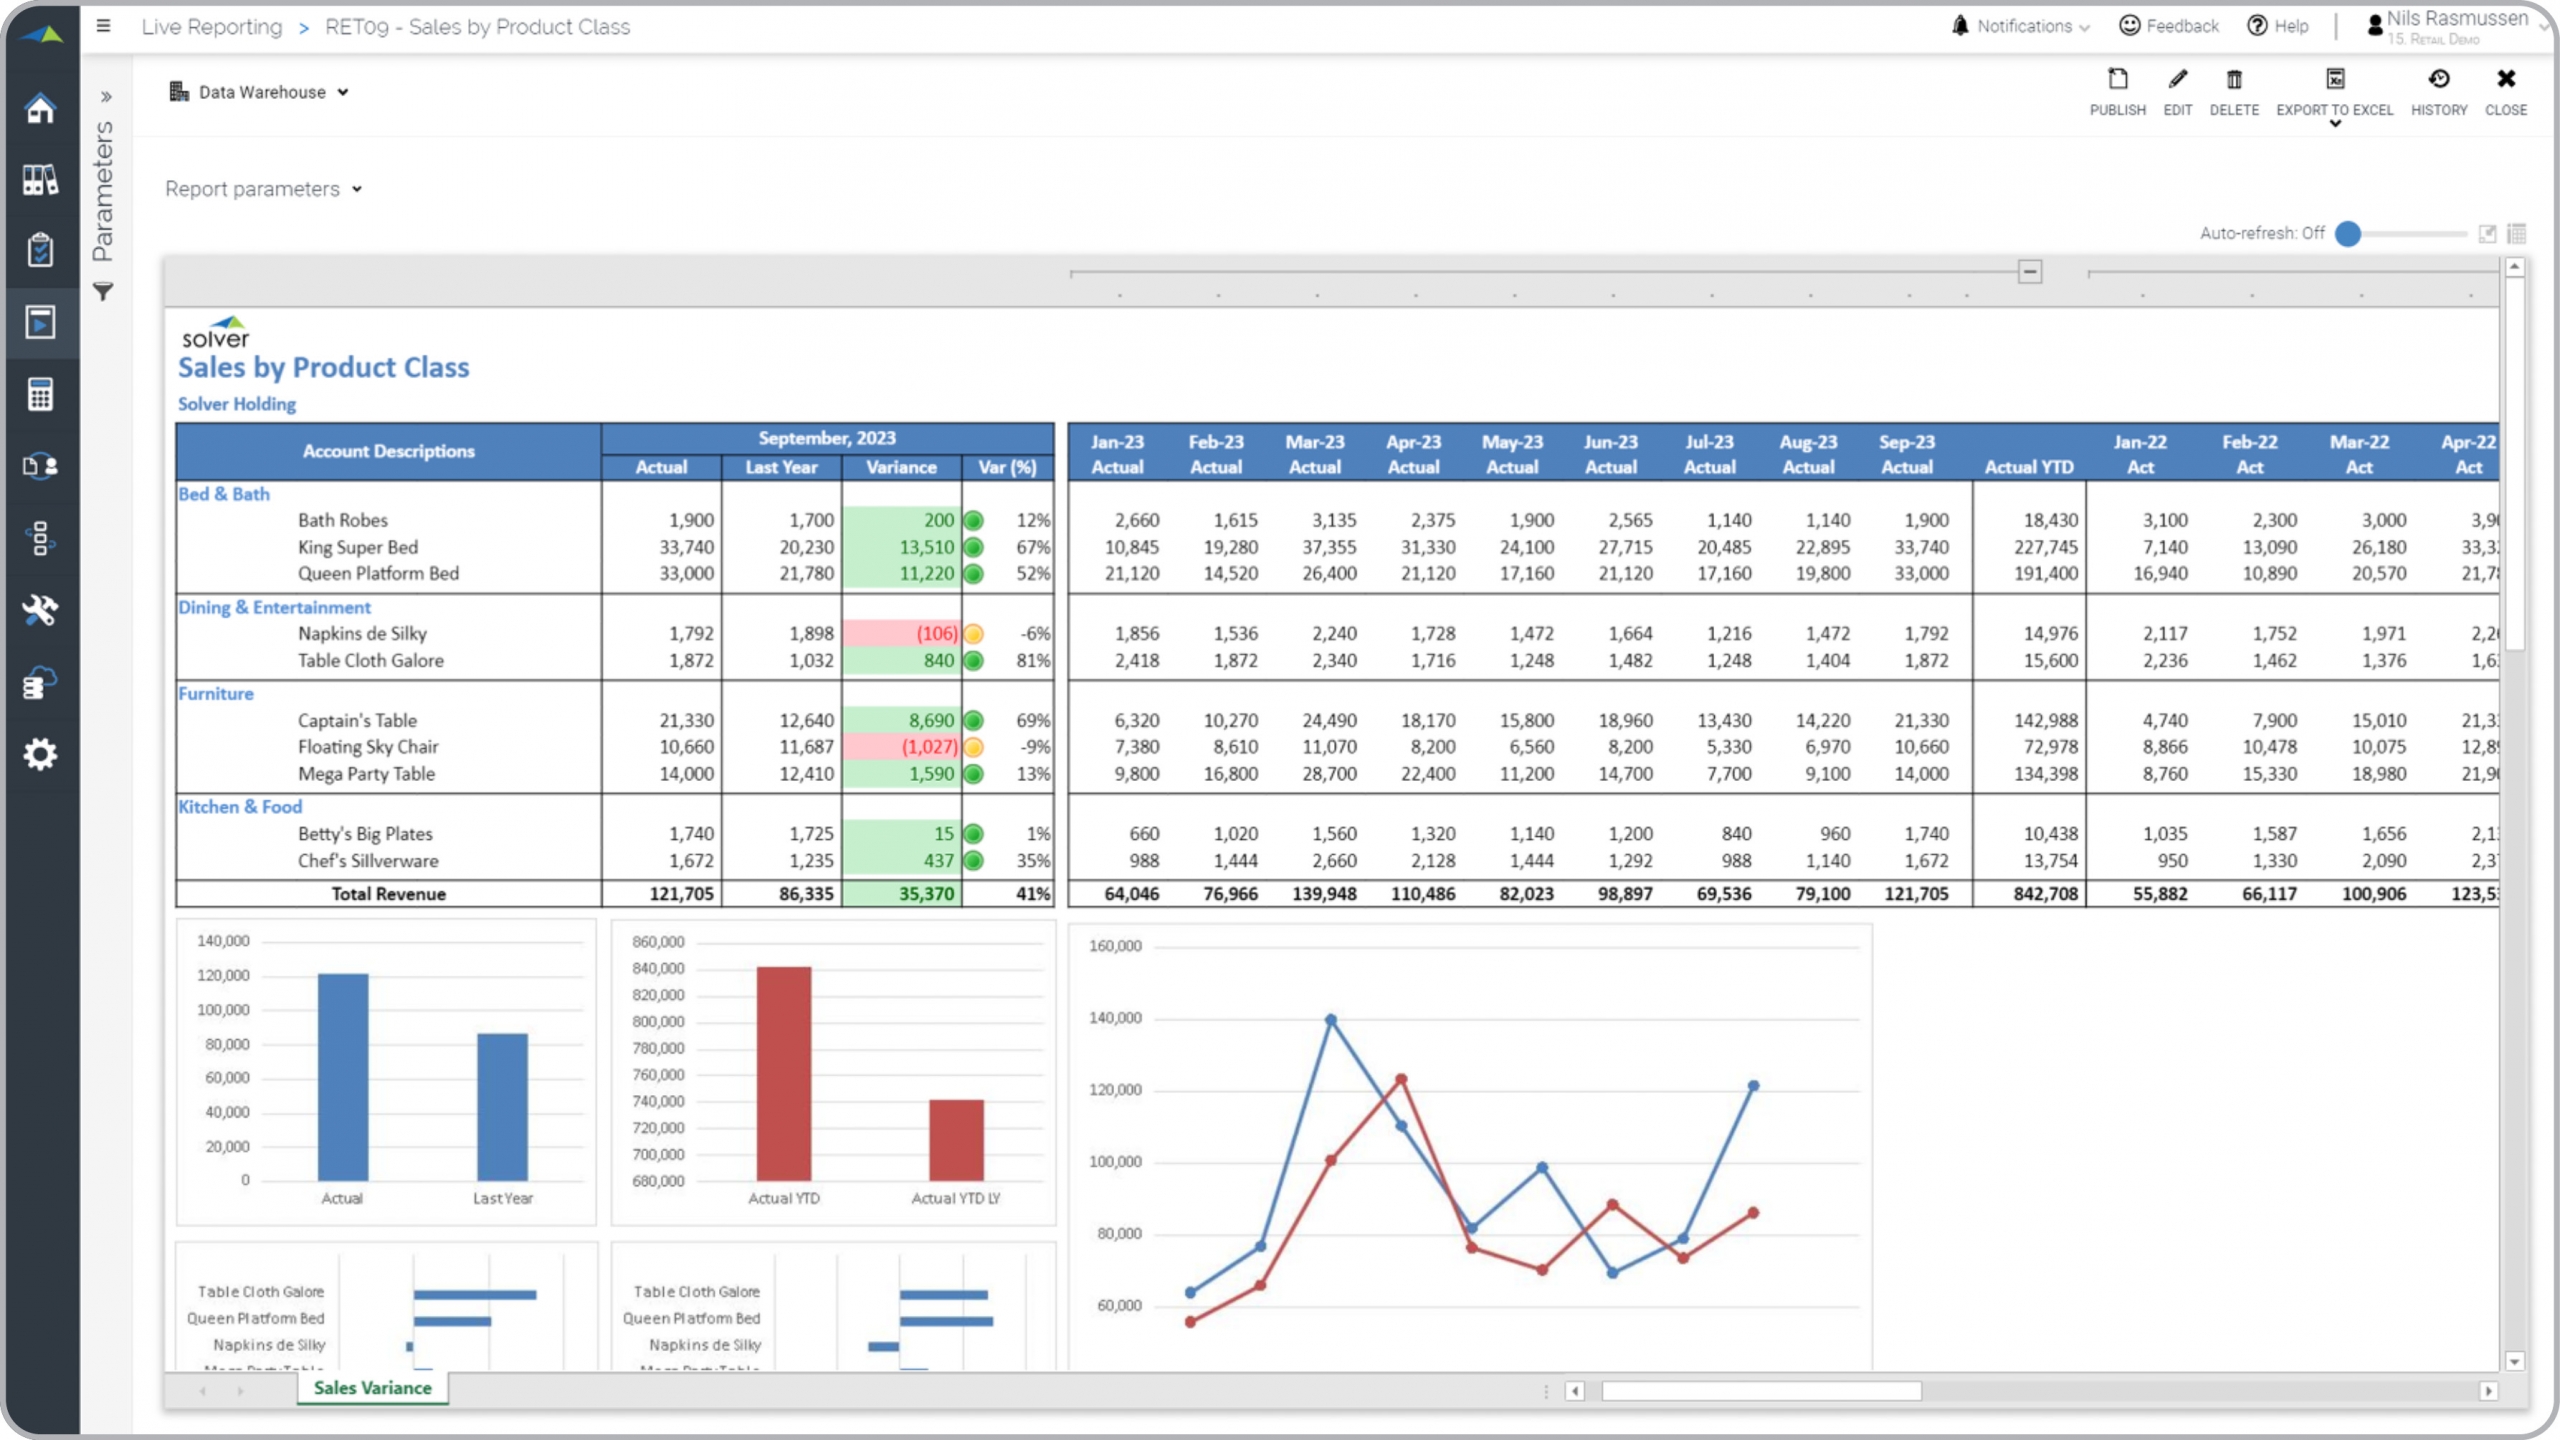
Retail – Sales Trend by Product
Shows monthly sales by product with variance analysis versus prior year.
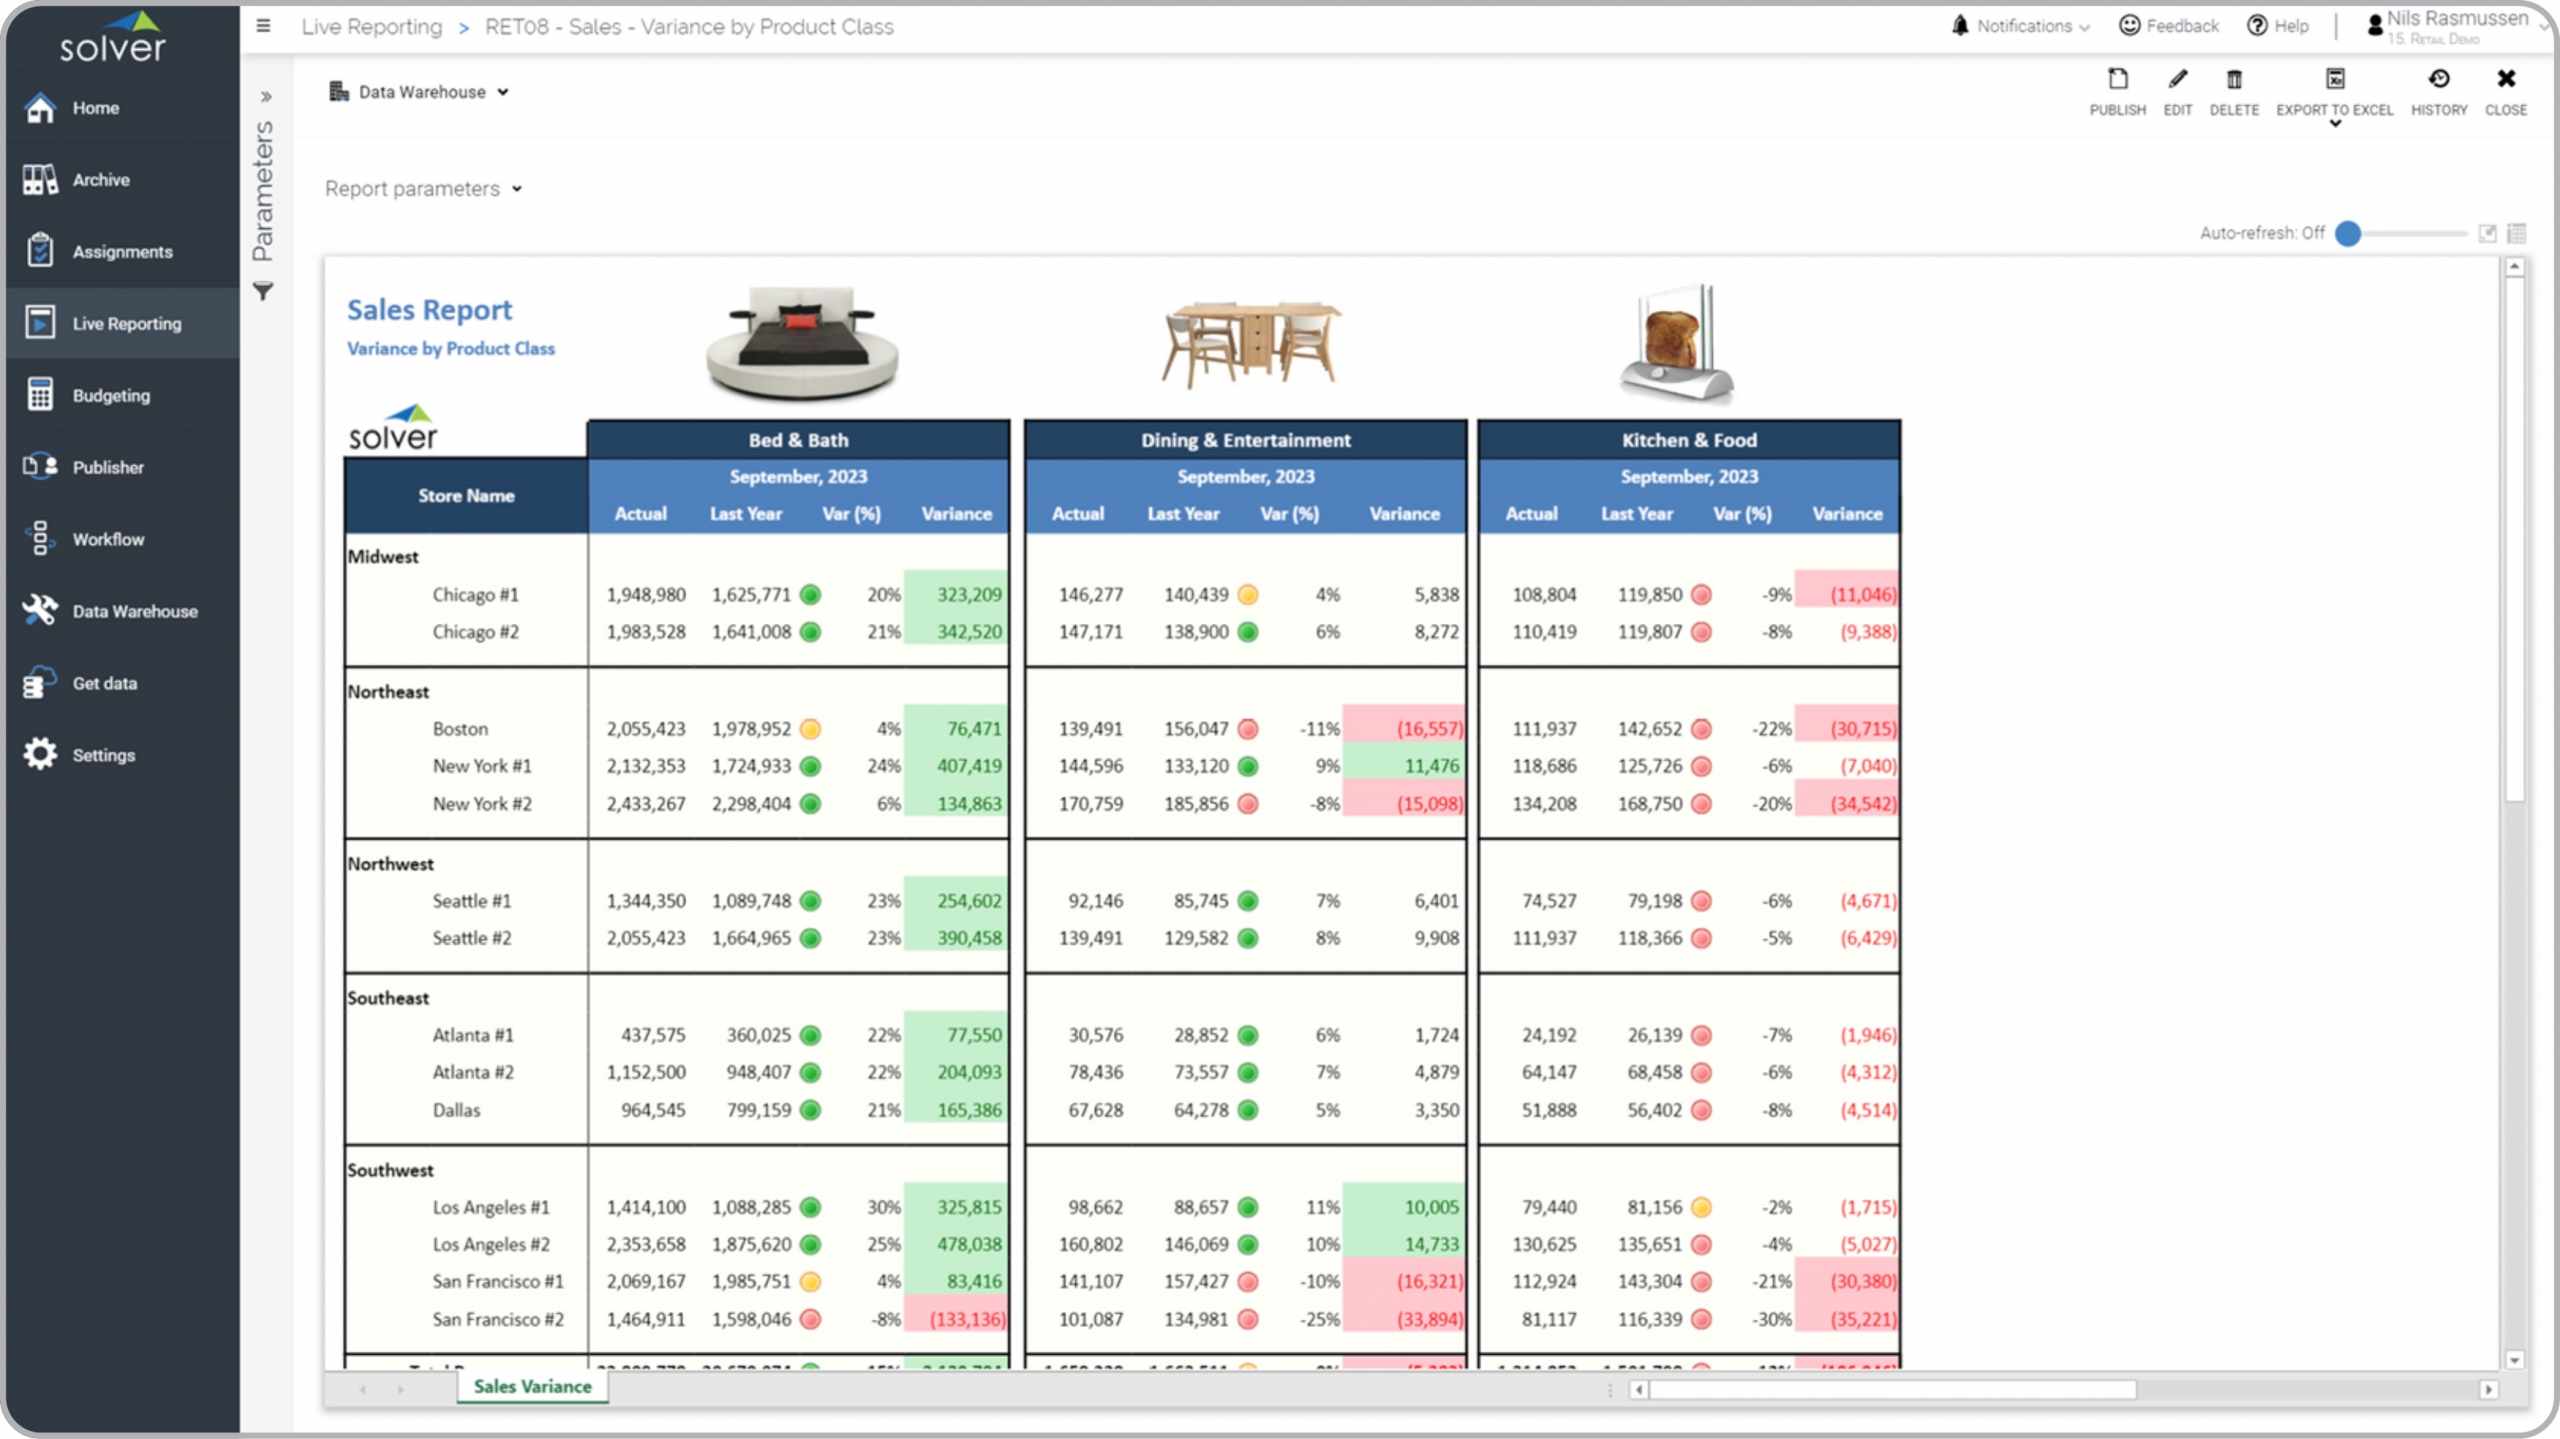
Retail – Product Sales by Store
This report provides actual vs last year sales by product group, store and region.
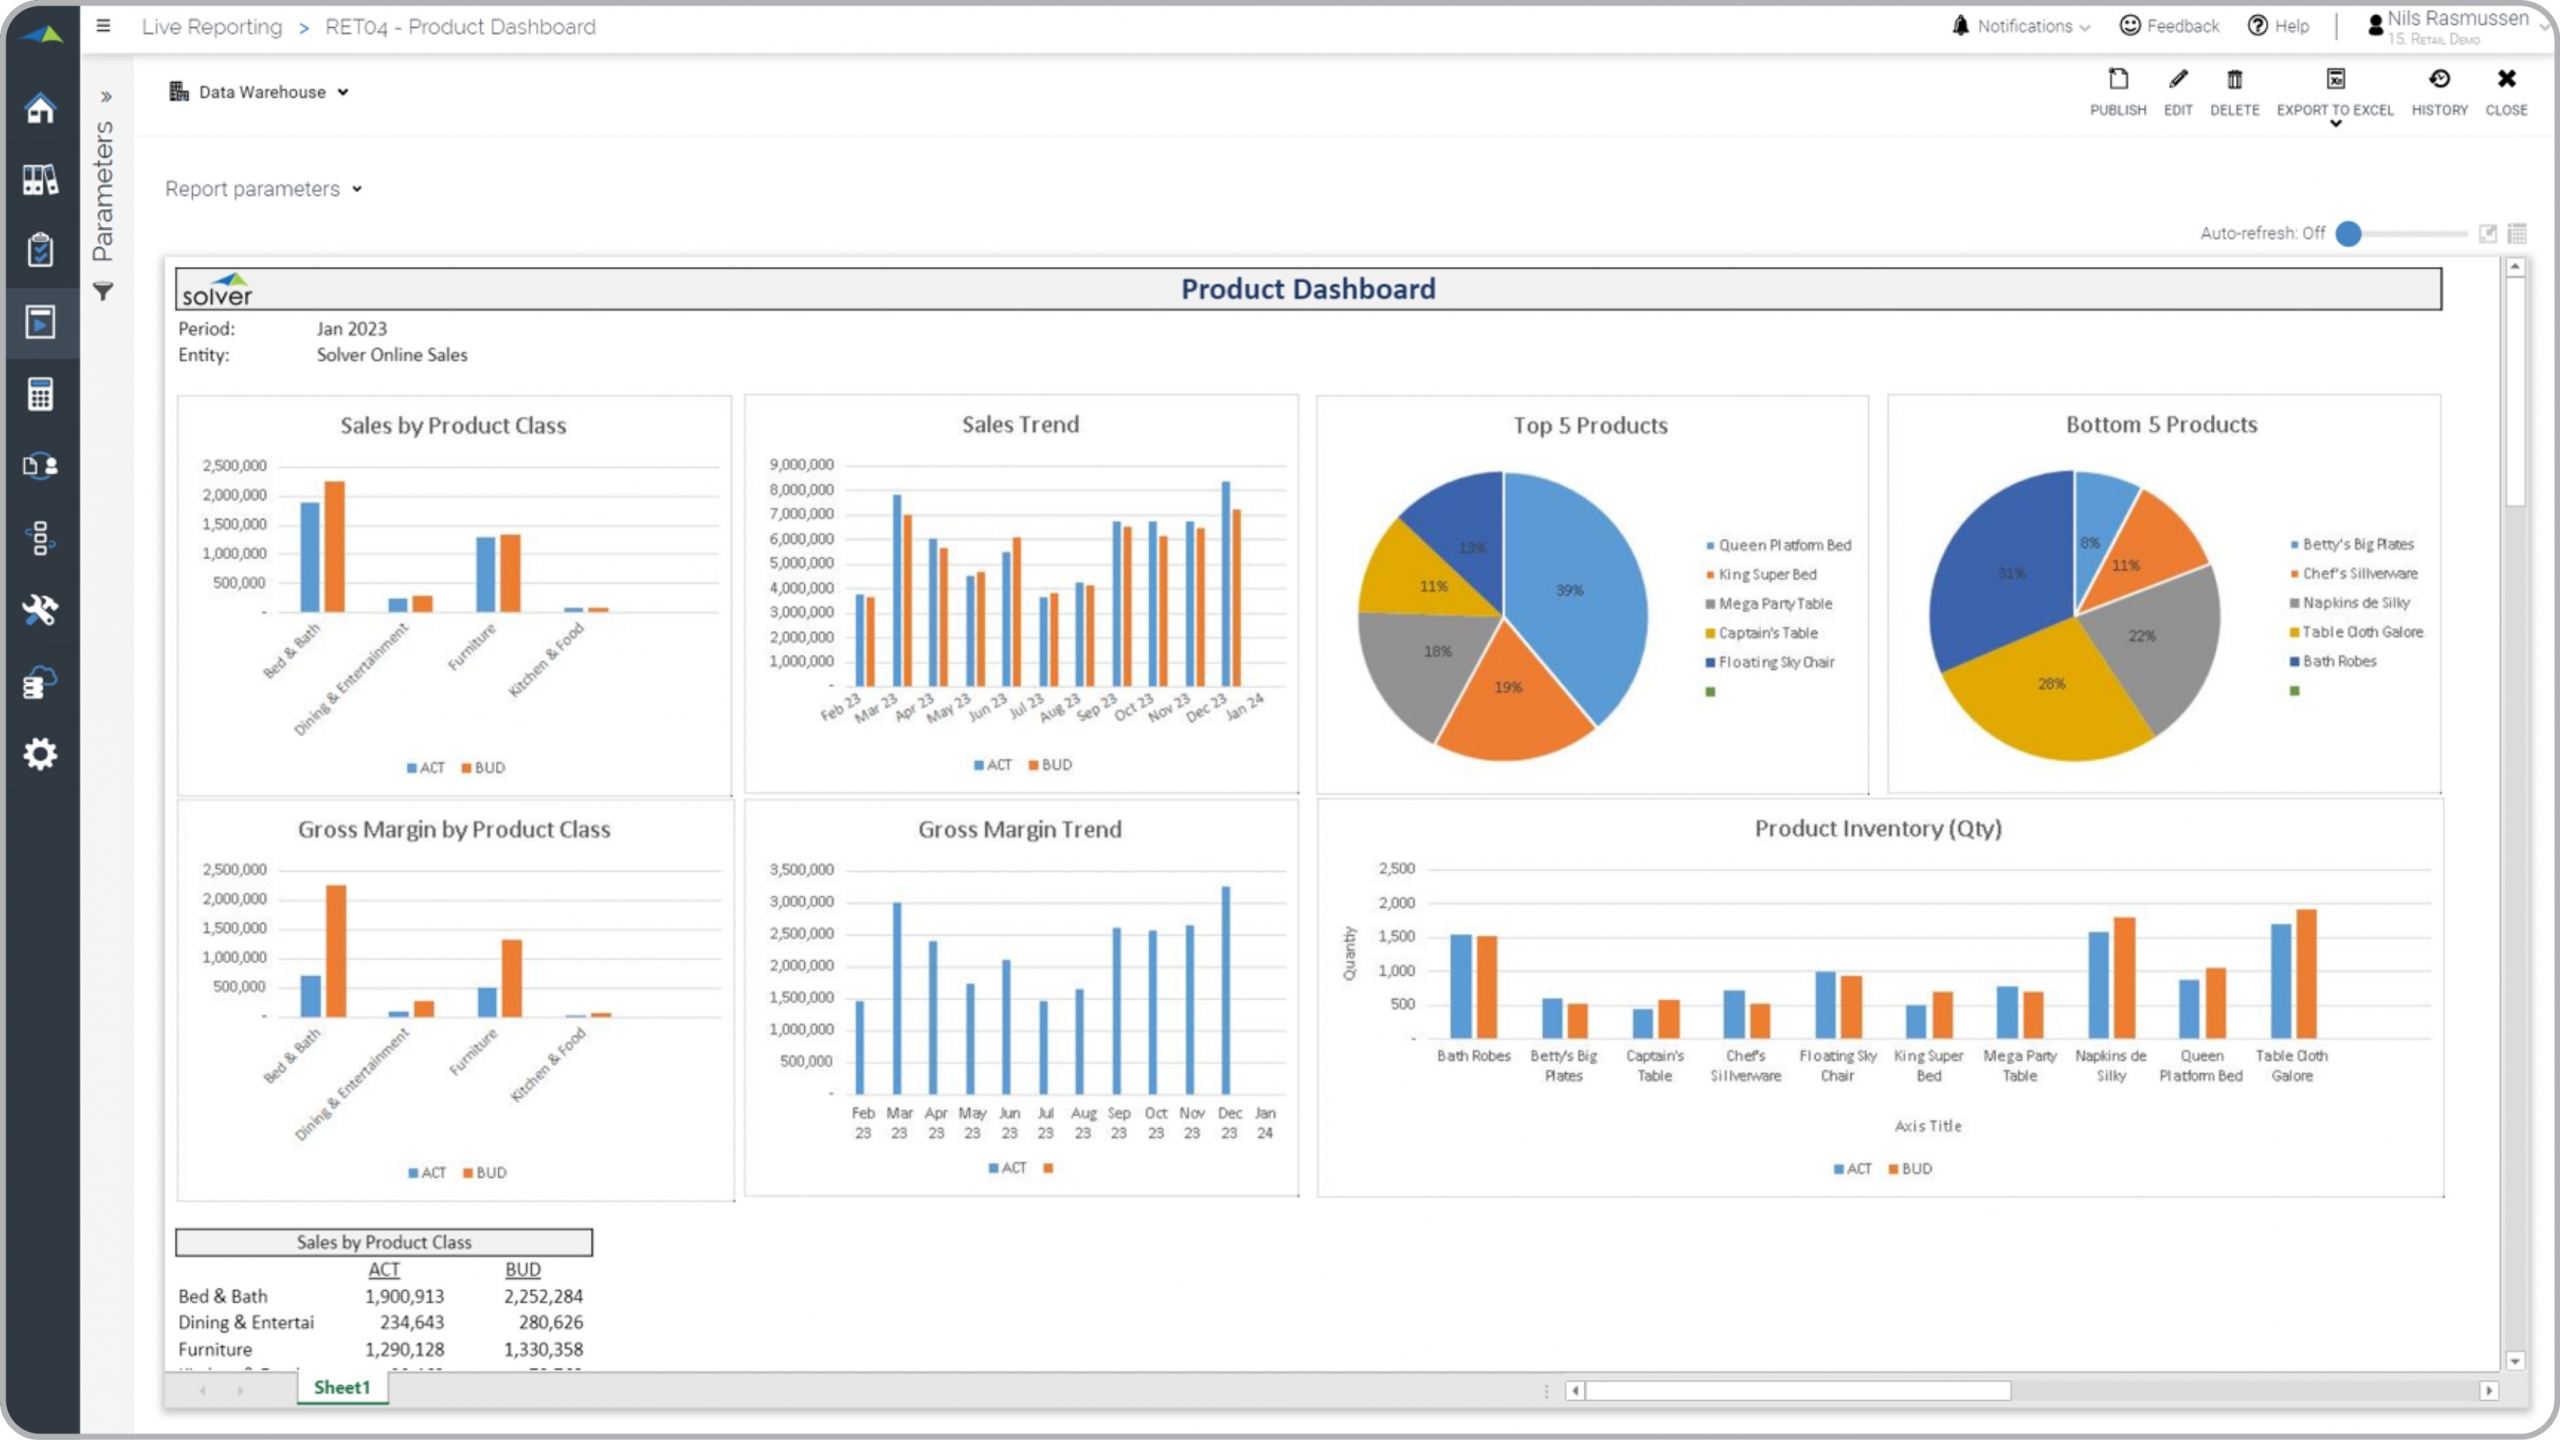
Retail – Product Dashboard
Shows graphical view of product KPIs like sales, gross margin, top performers and inventory.
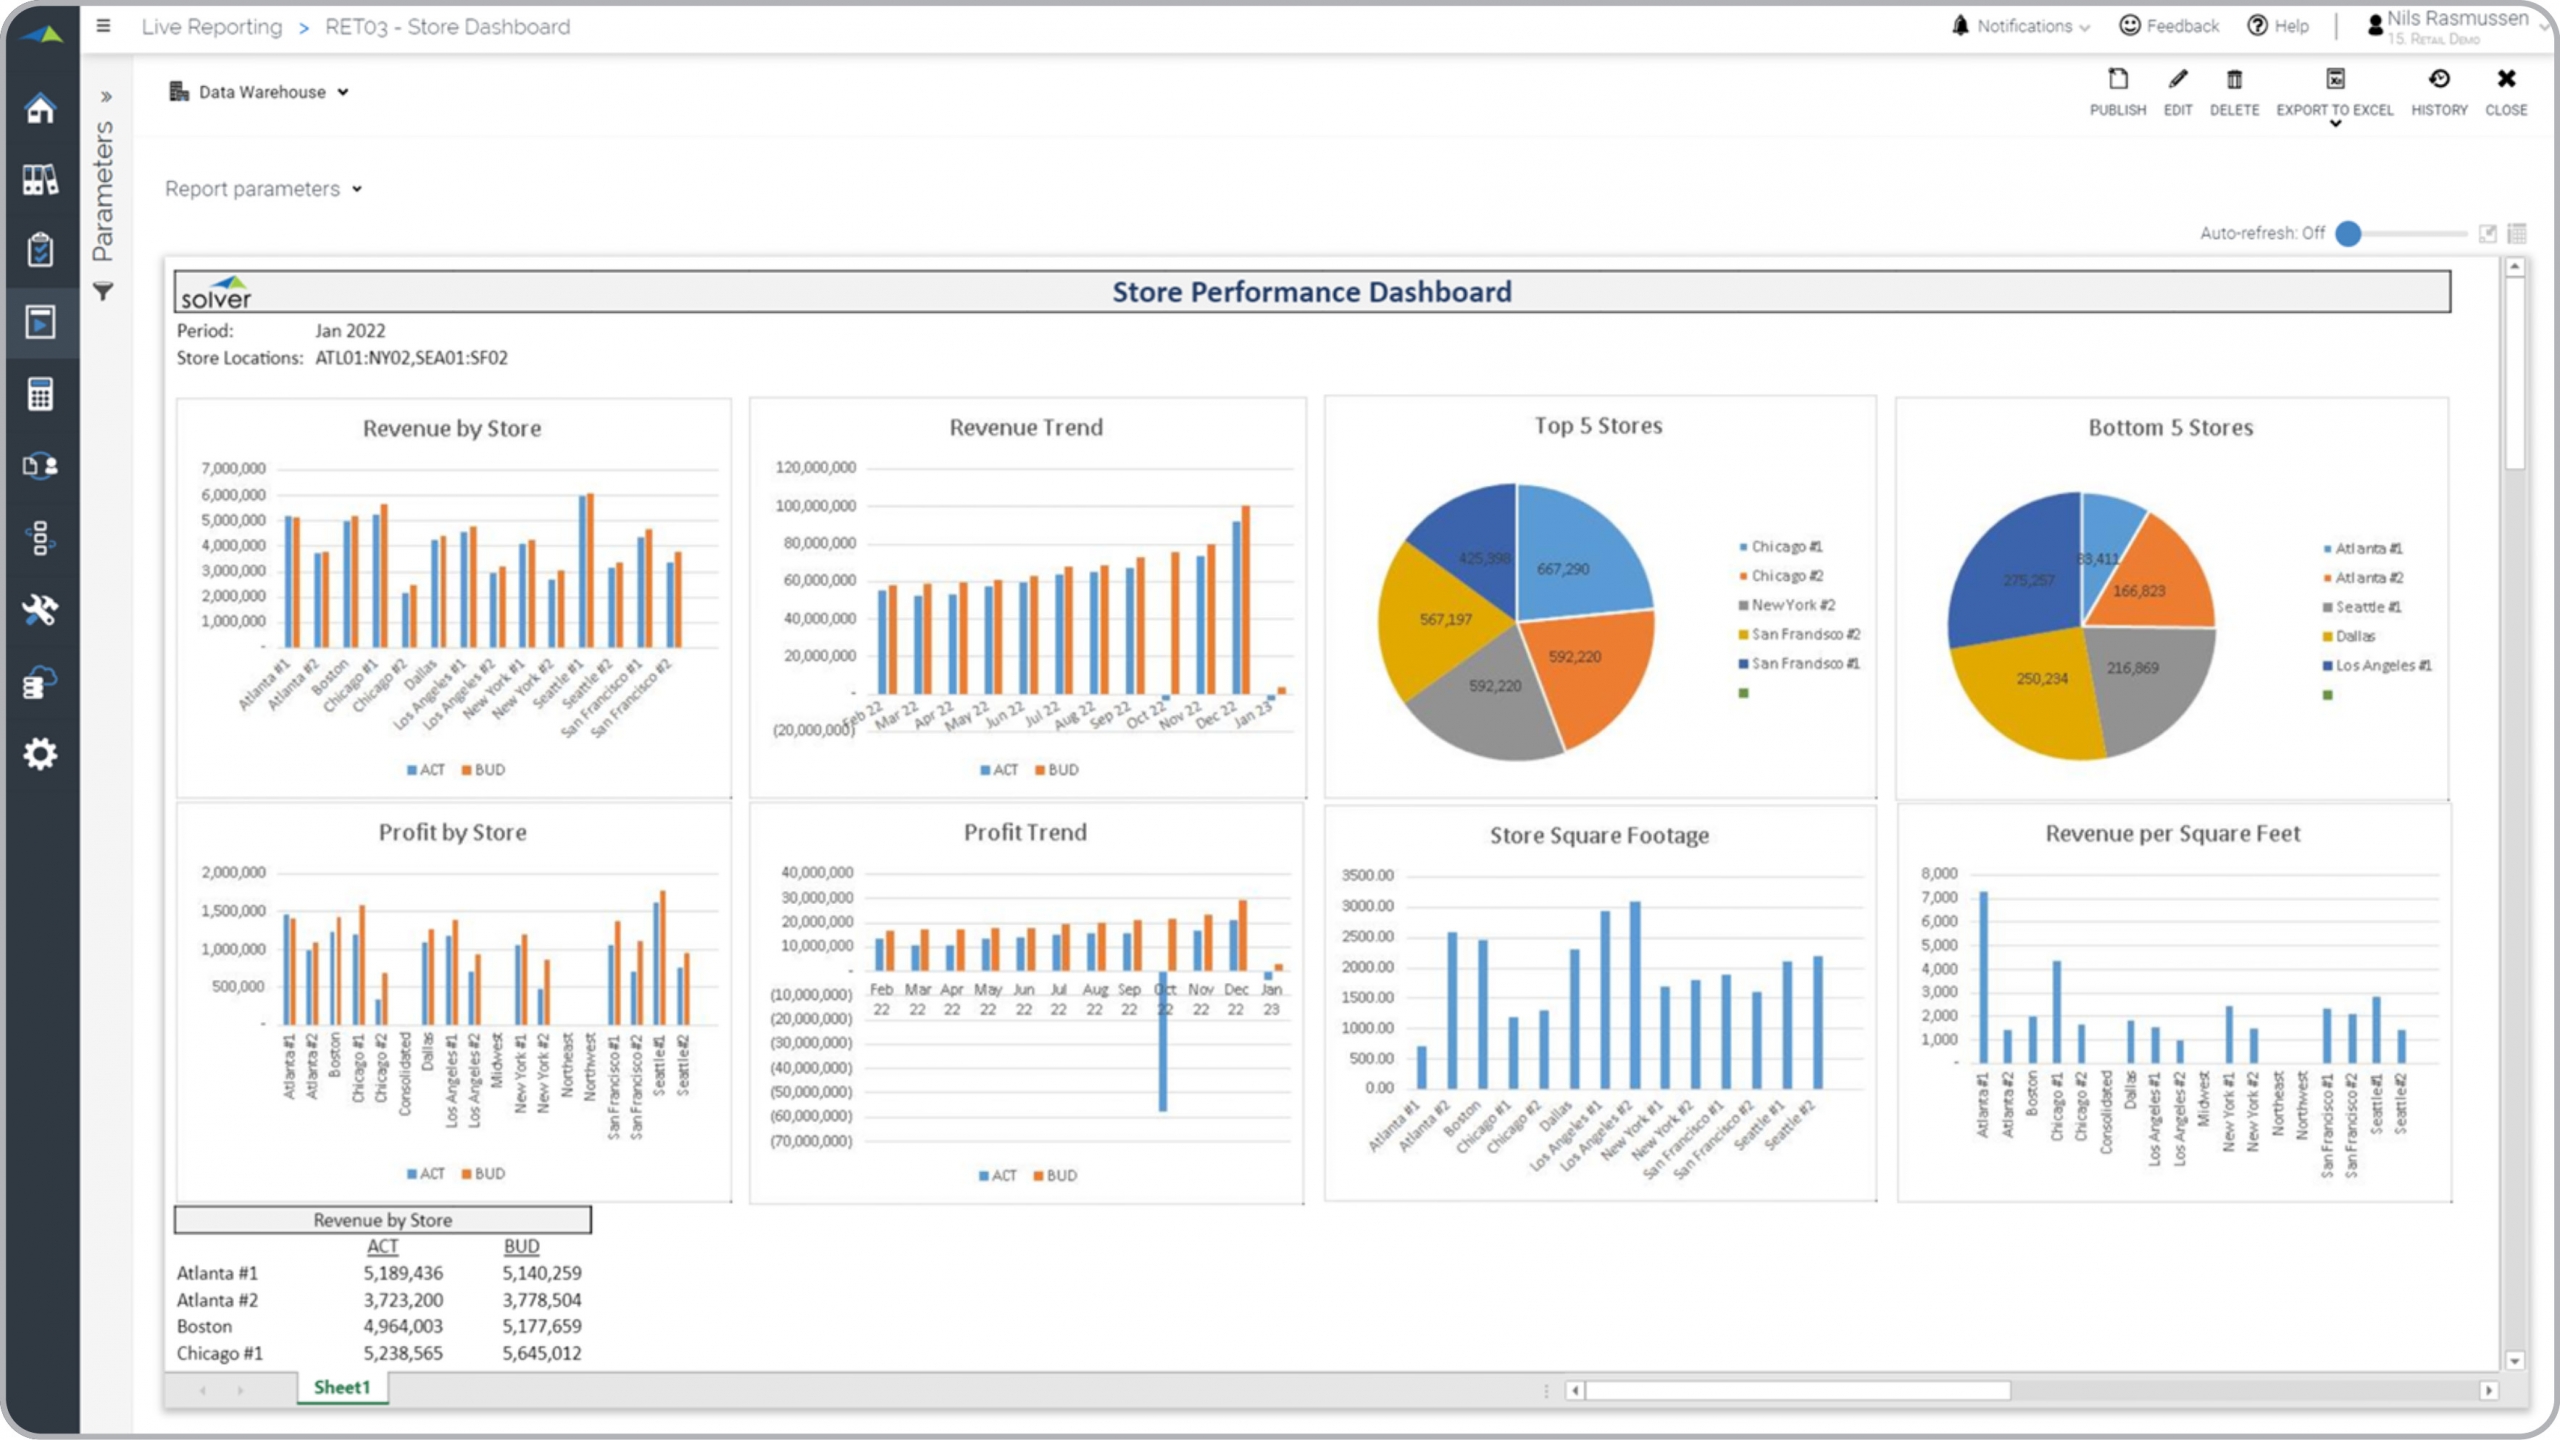
Retail – Store Performance Dashboard
Dashboard view of revenue, profit, revenue/SQ FT and other key store performance data
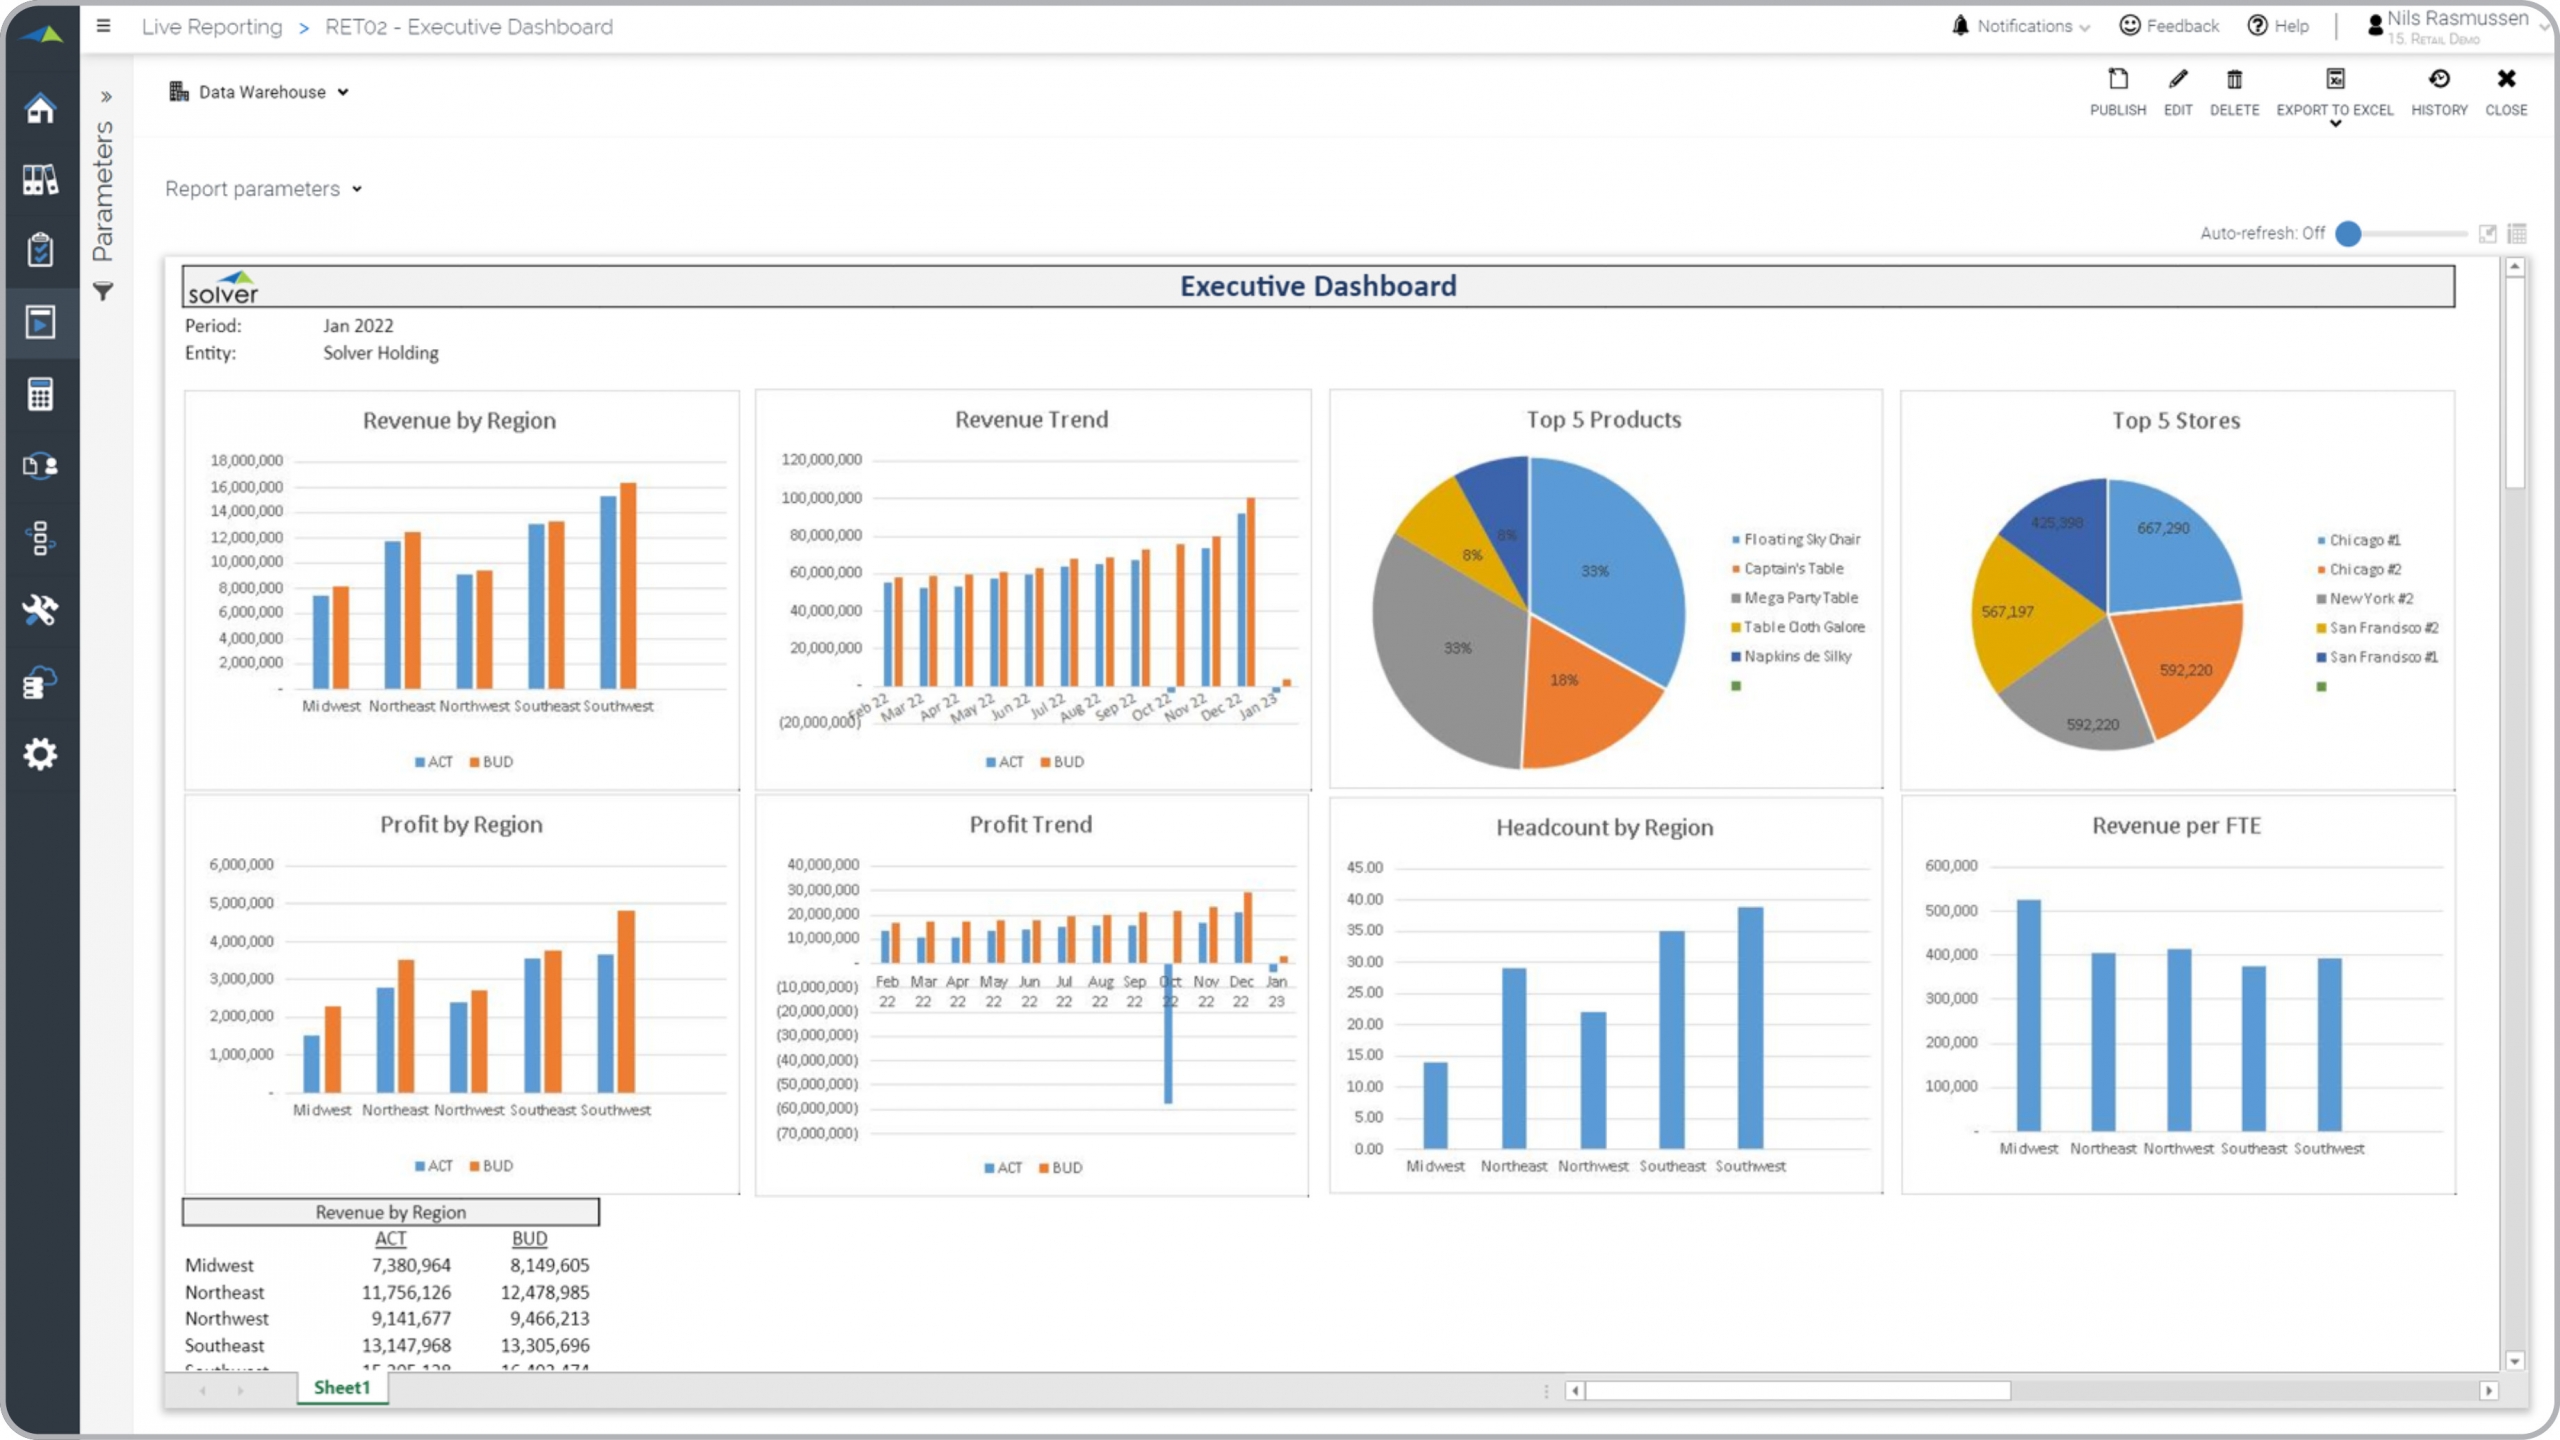
Retail – Executive Dashboard
Provides retail executives with trend and comparative analysis of revenue, profit and FTEs.
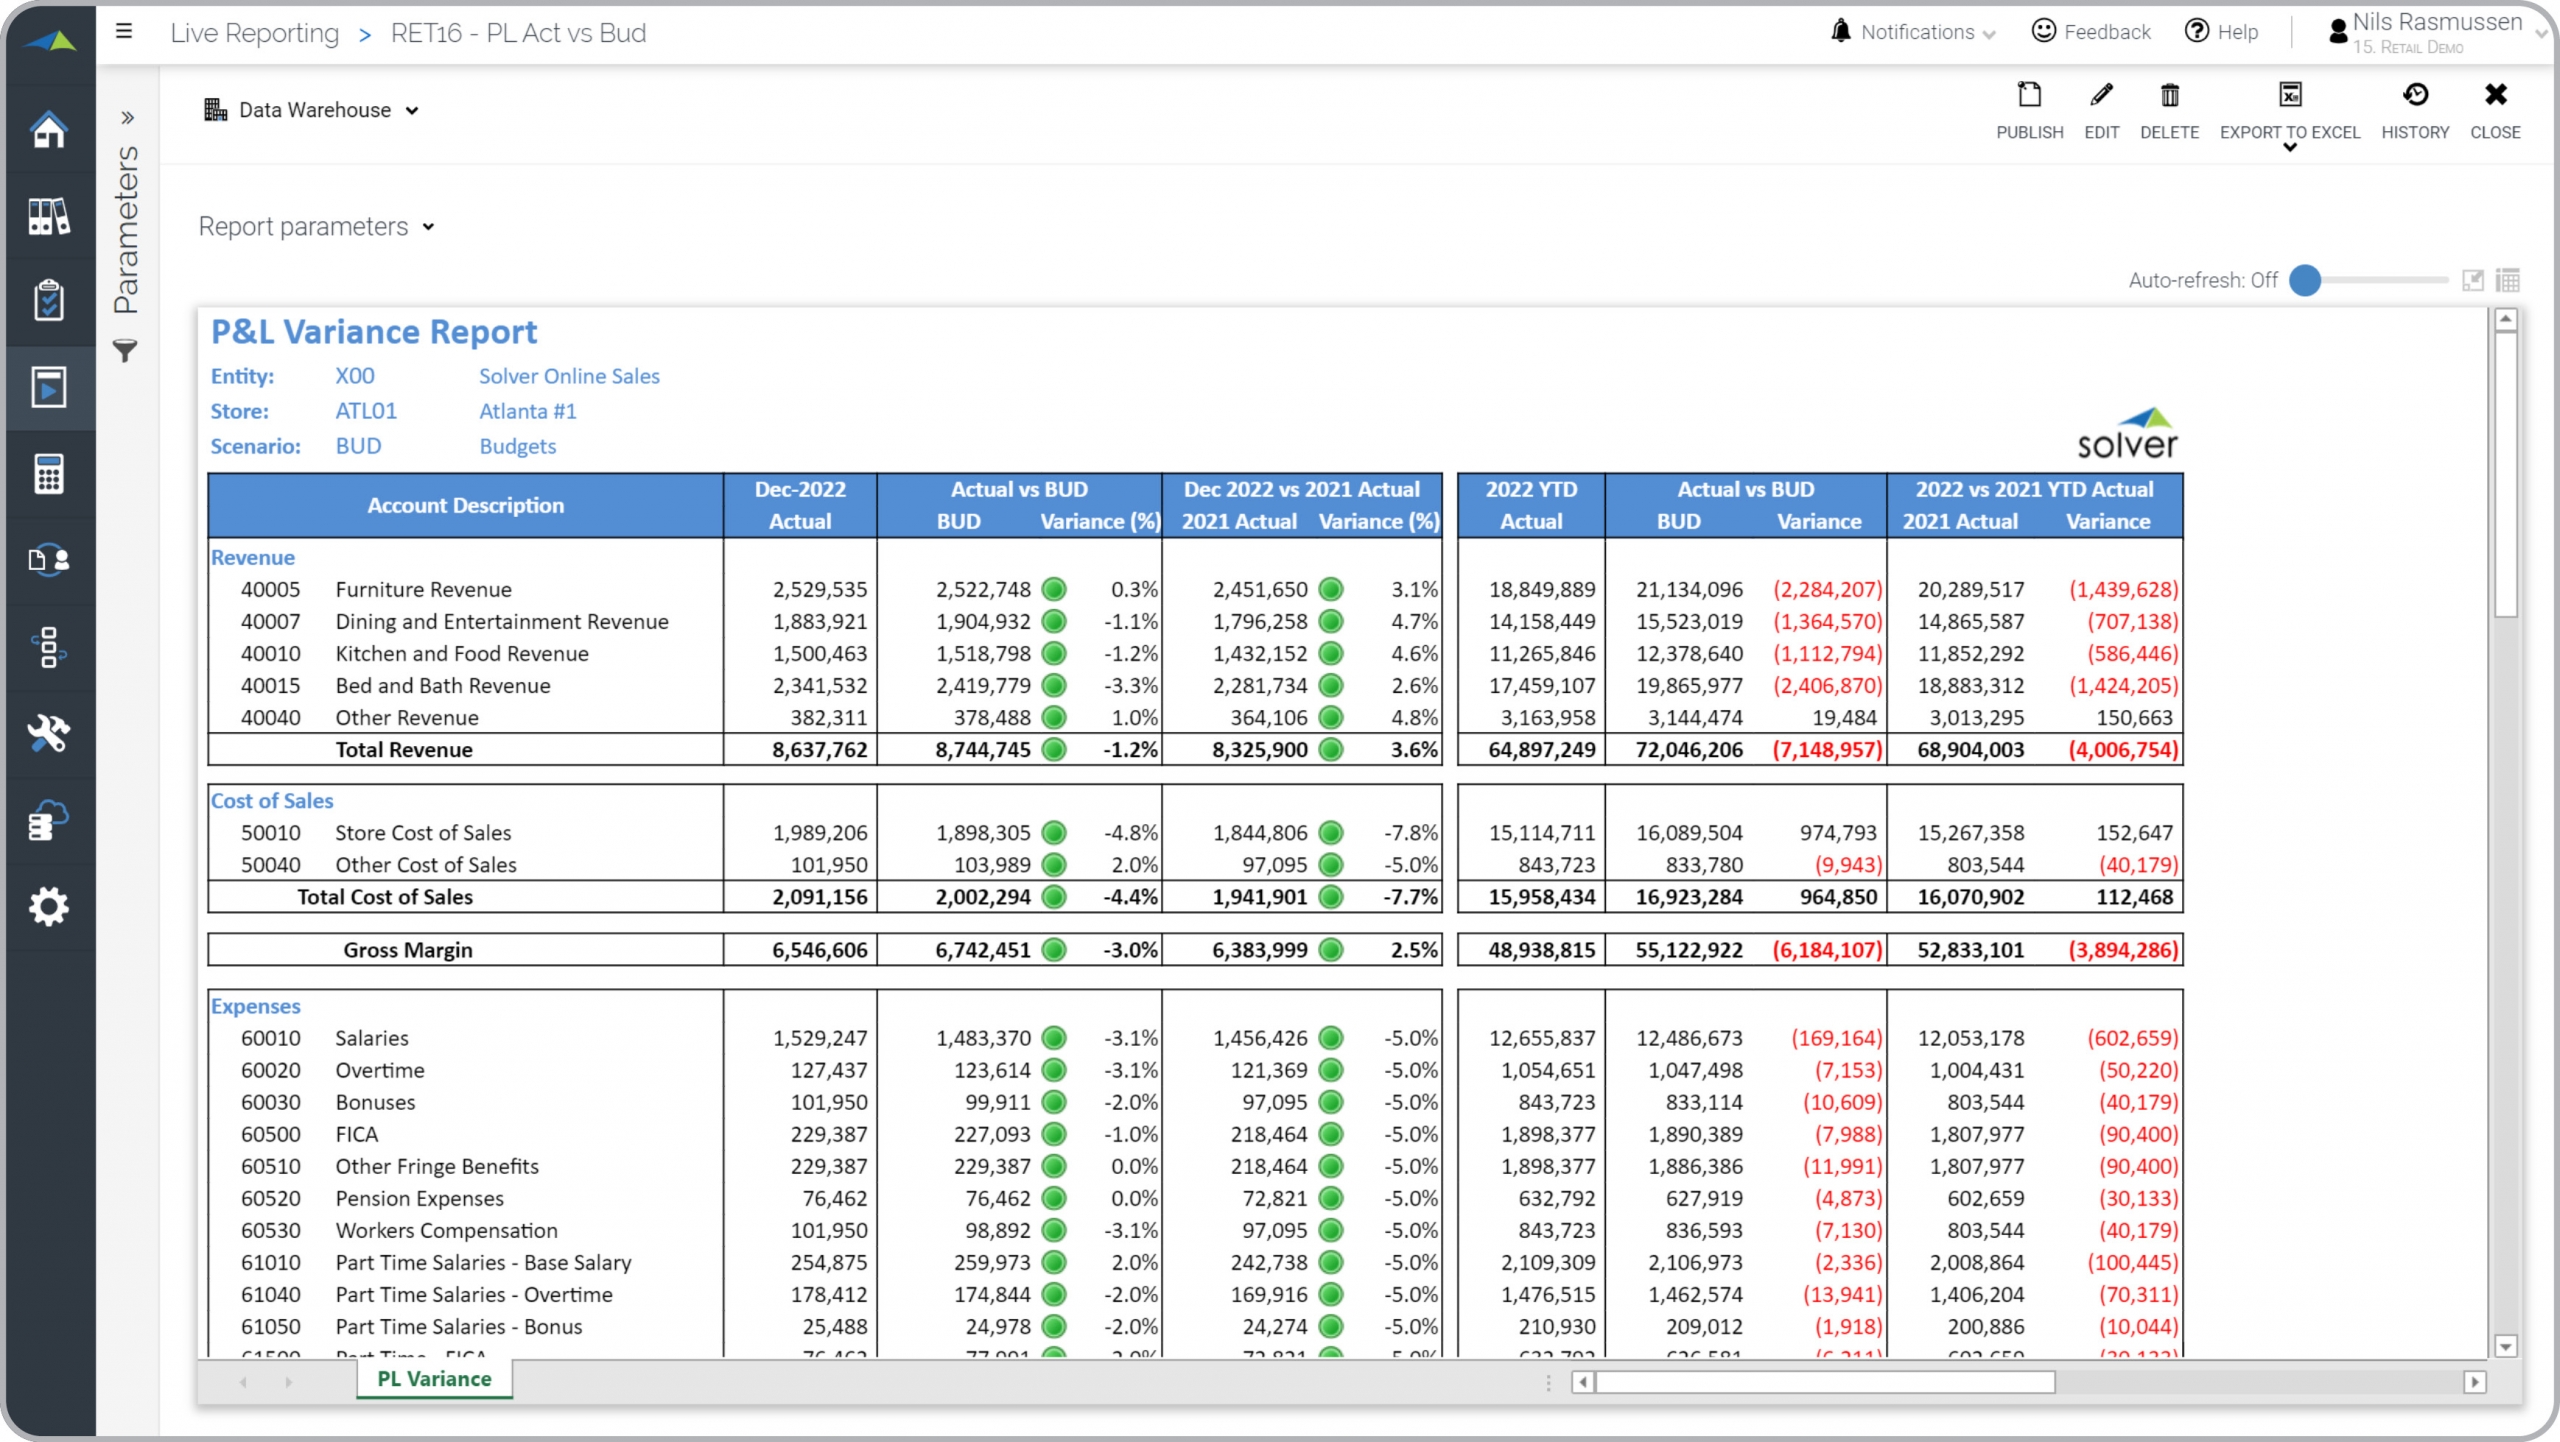
Retail – P&L Variance Report
Typical Profit & Loss with actual, budget and last year for monthly and YTD data.
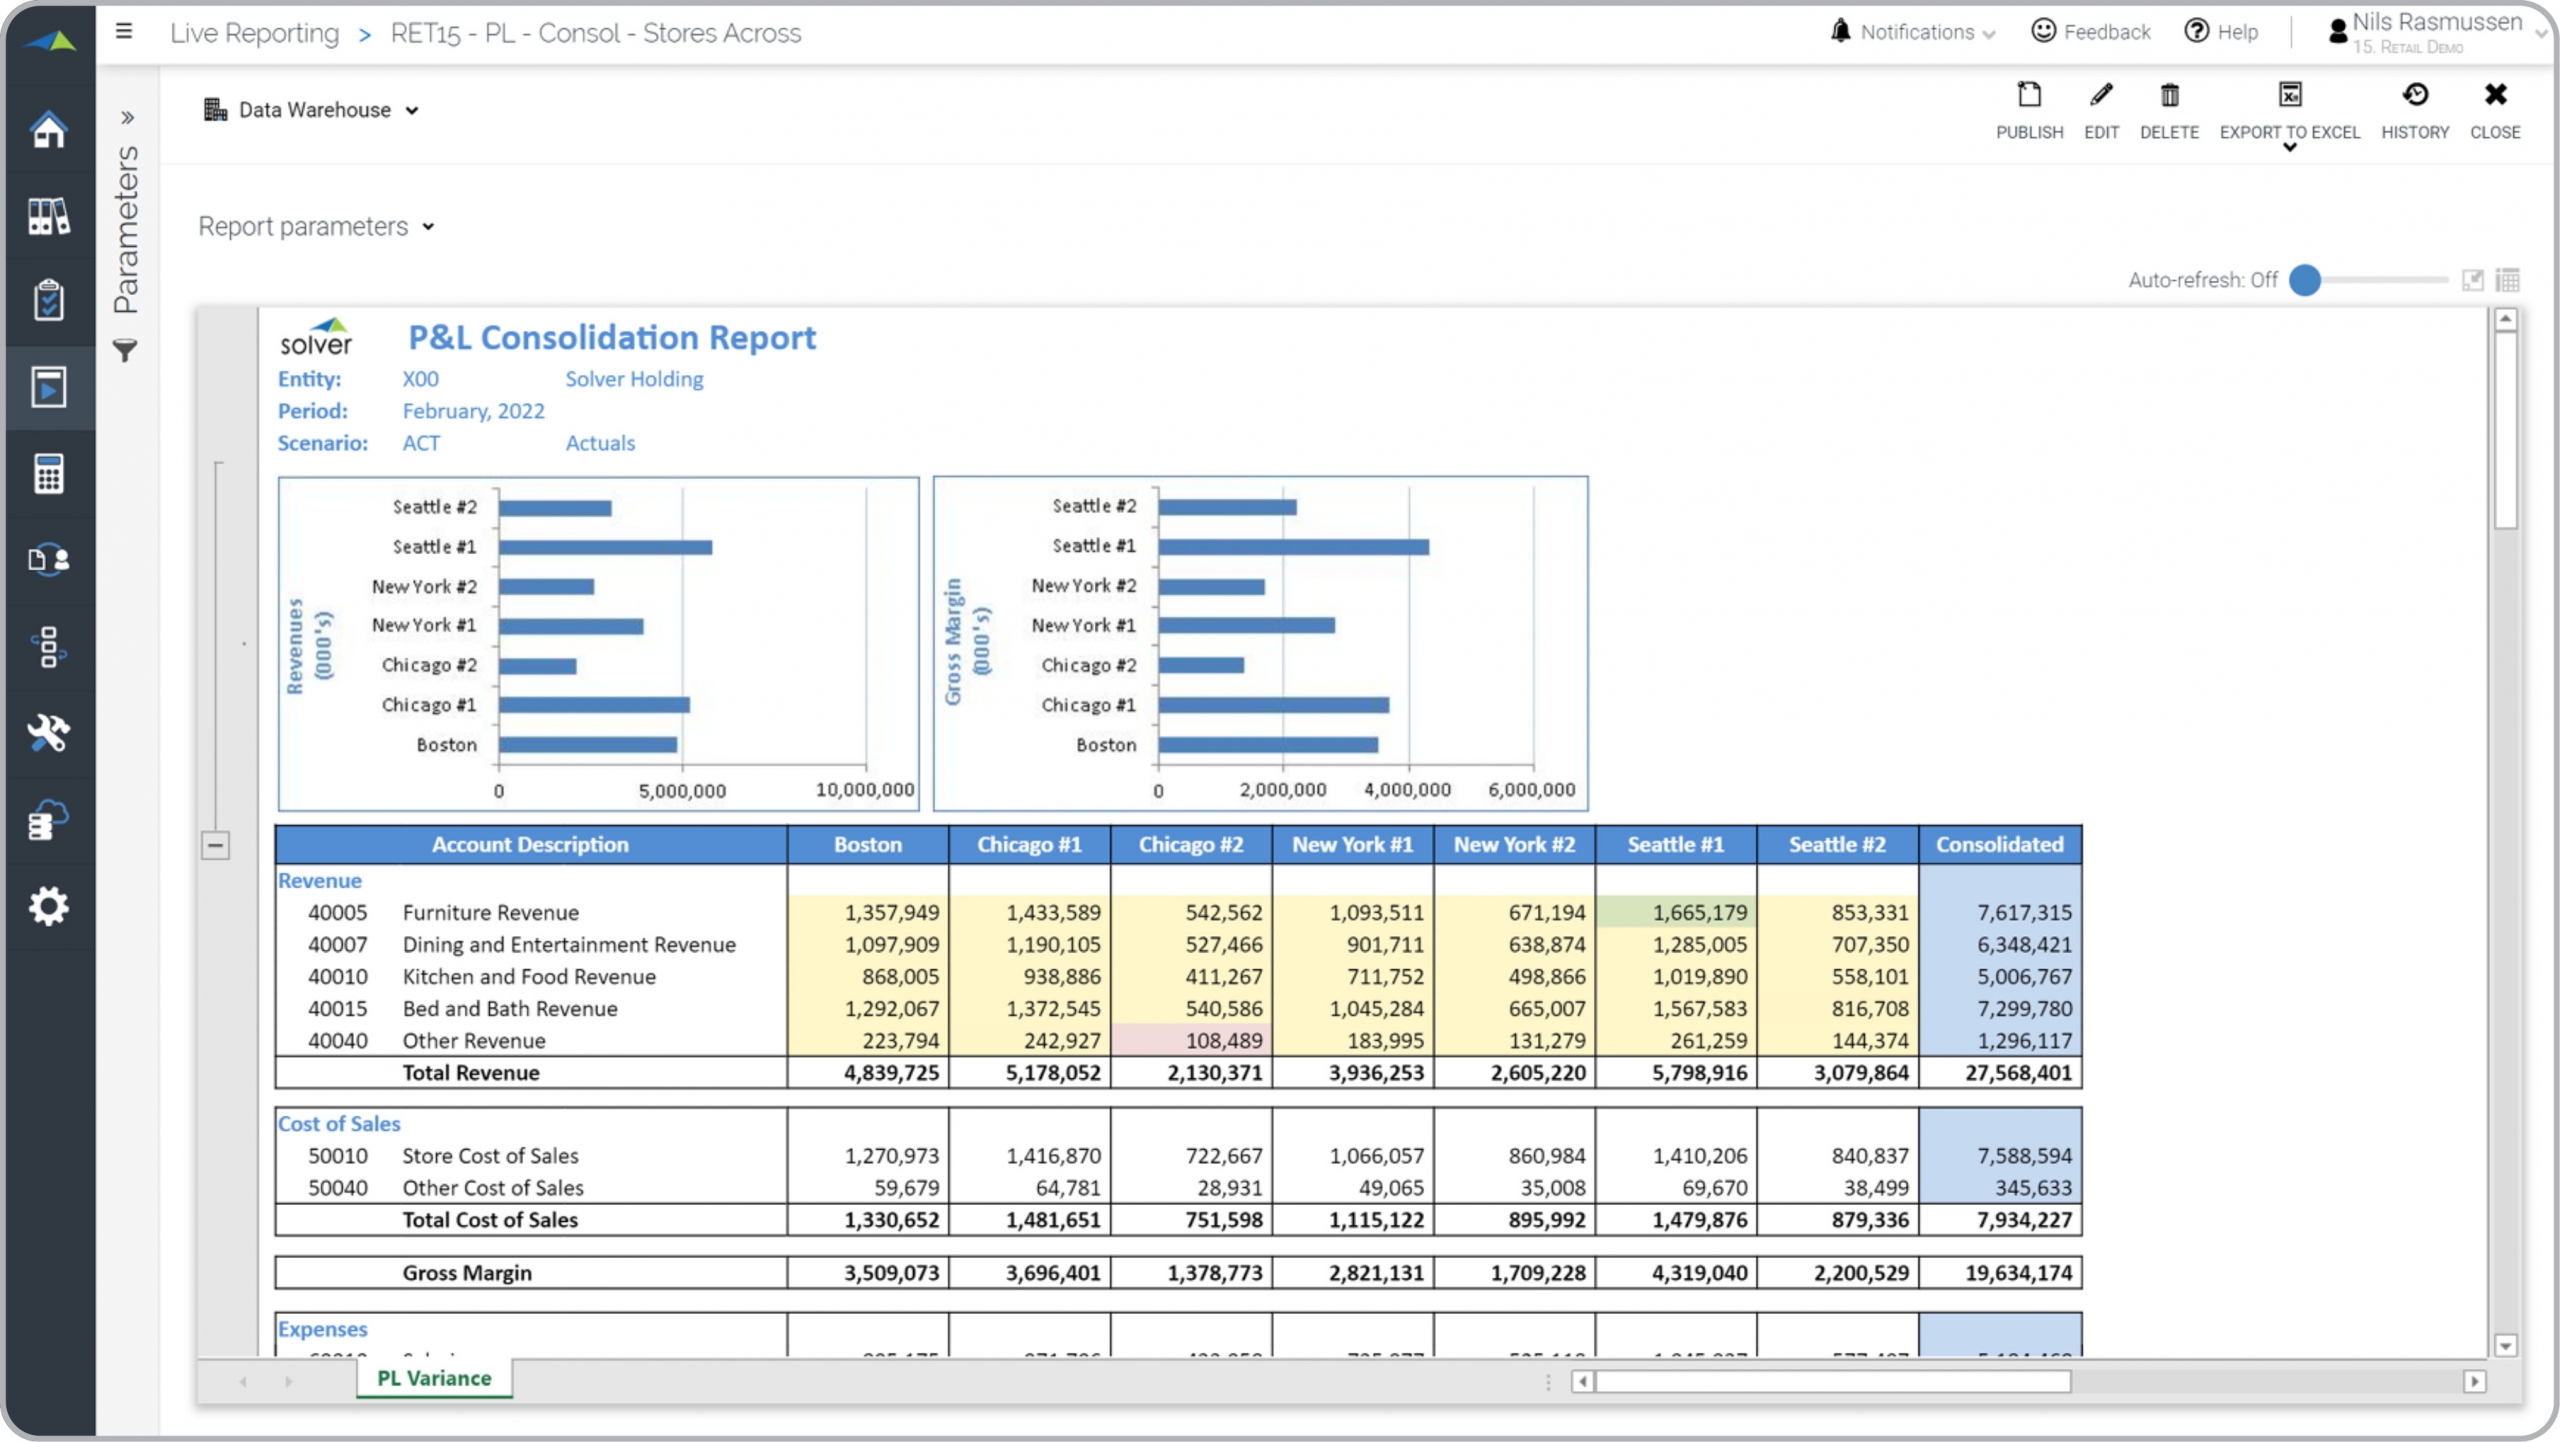
Retail – P&L Consolidation Report
This Profit & Loss report displays selected stores across the columns with KPIs in the charts.
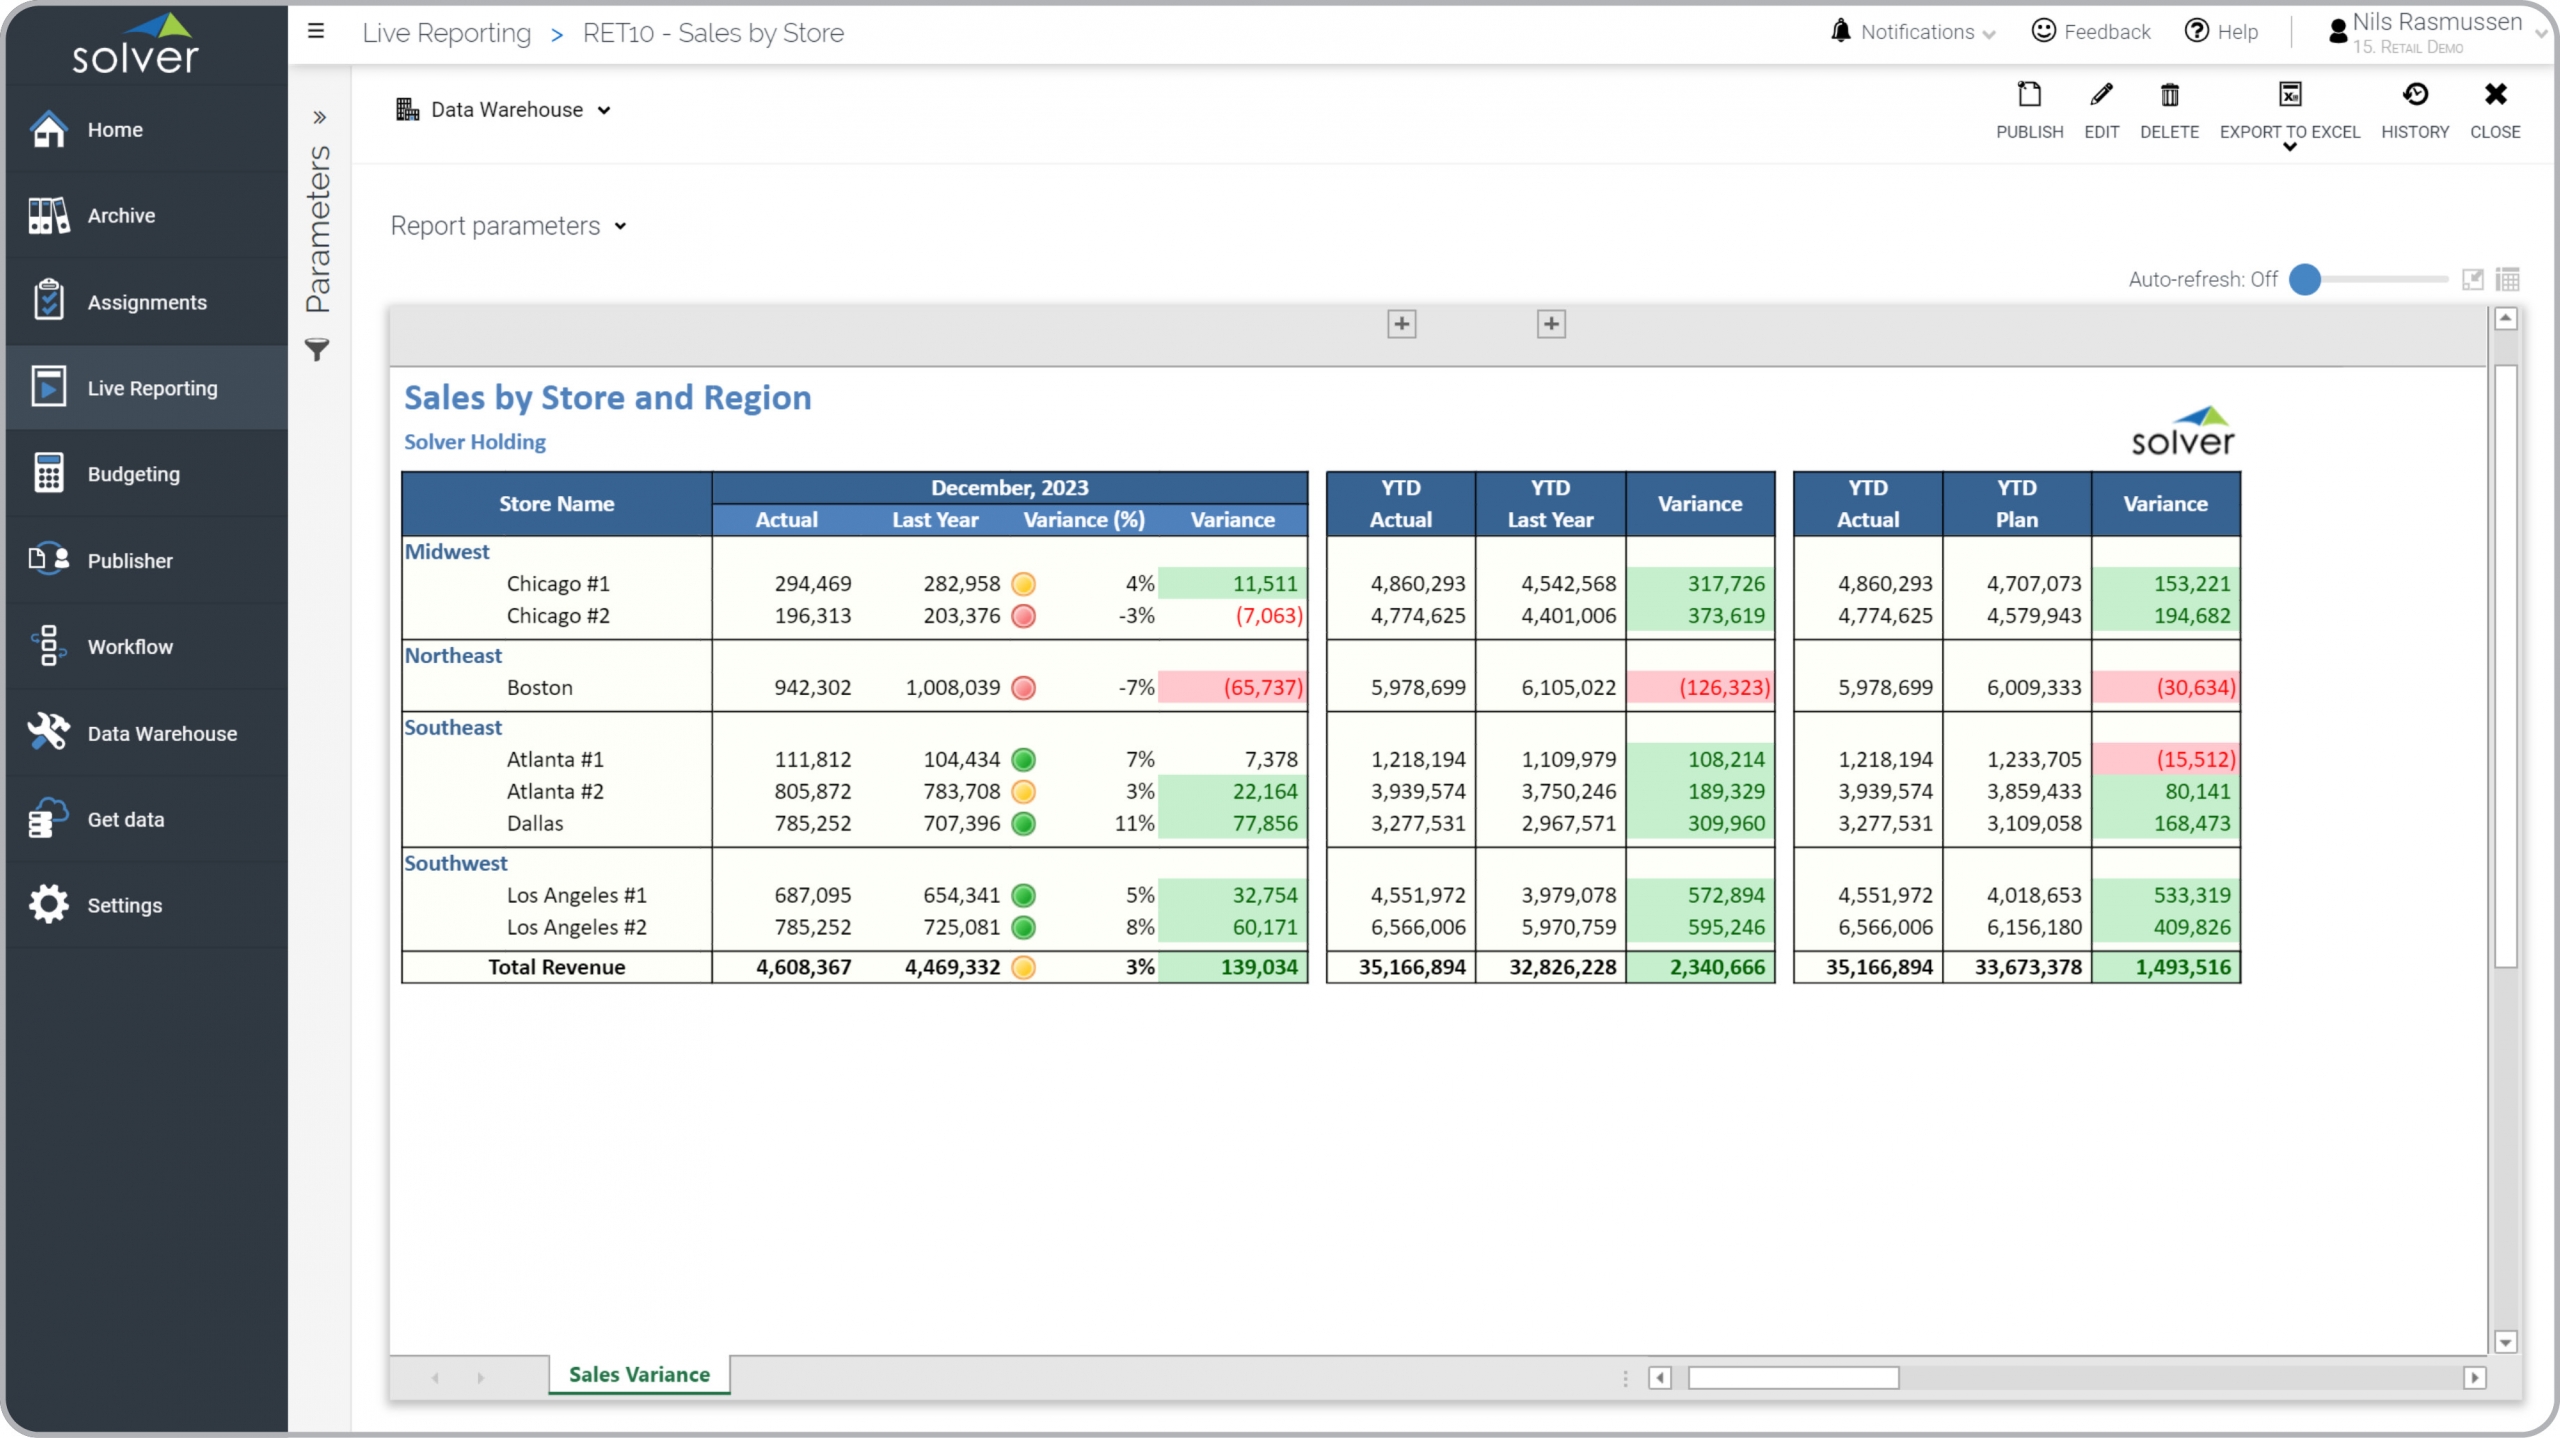
Retail – Sales by Region and Store
This report shows actual, budget and last year sales for each store and with roll-up to region.
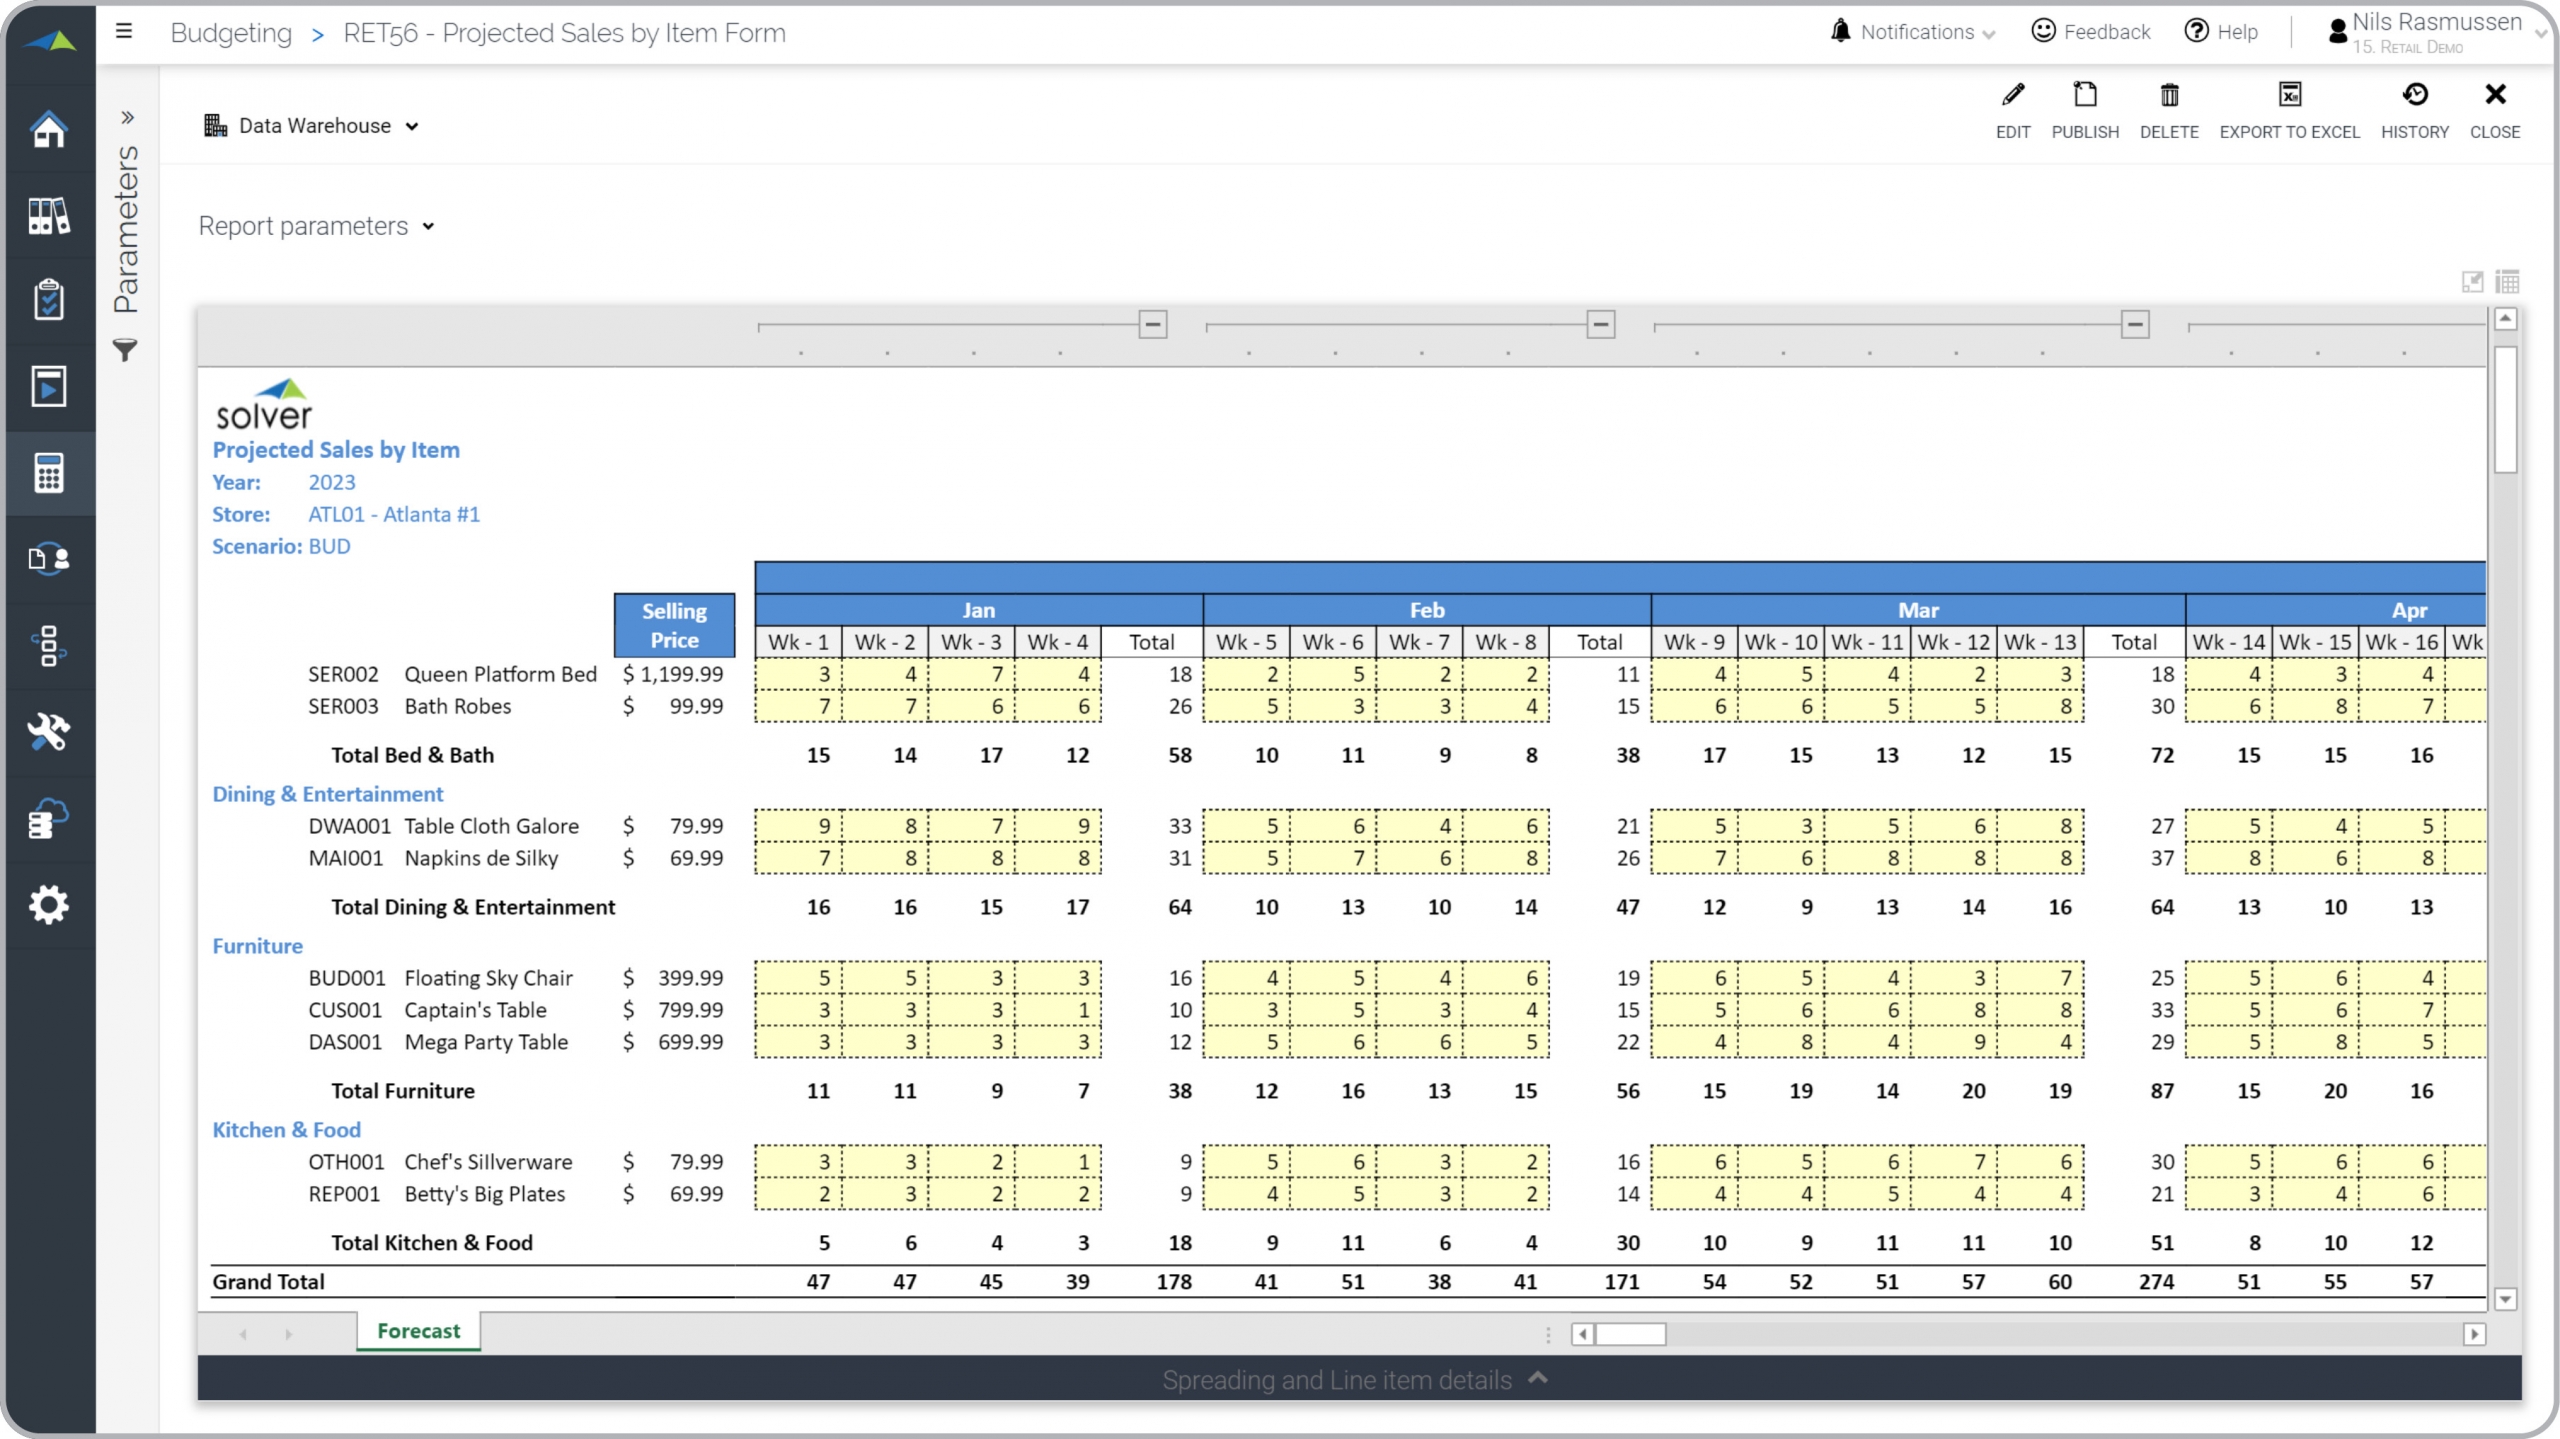
Retail – Weekly Sales Forecast
Input of sales quantity per product per week. This will drive the sales revenue forecast.
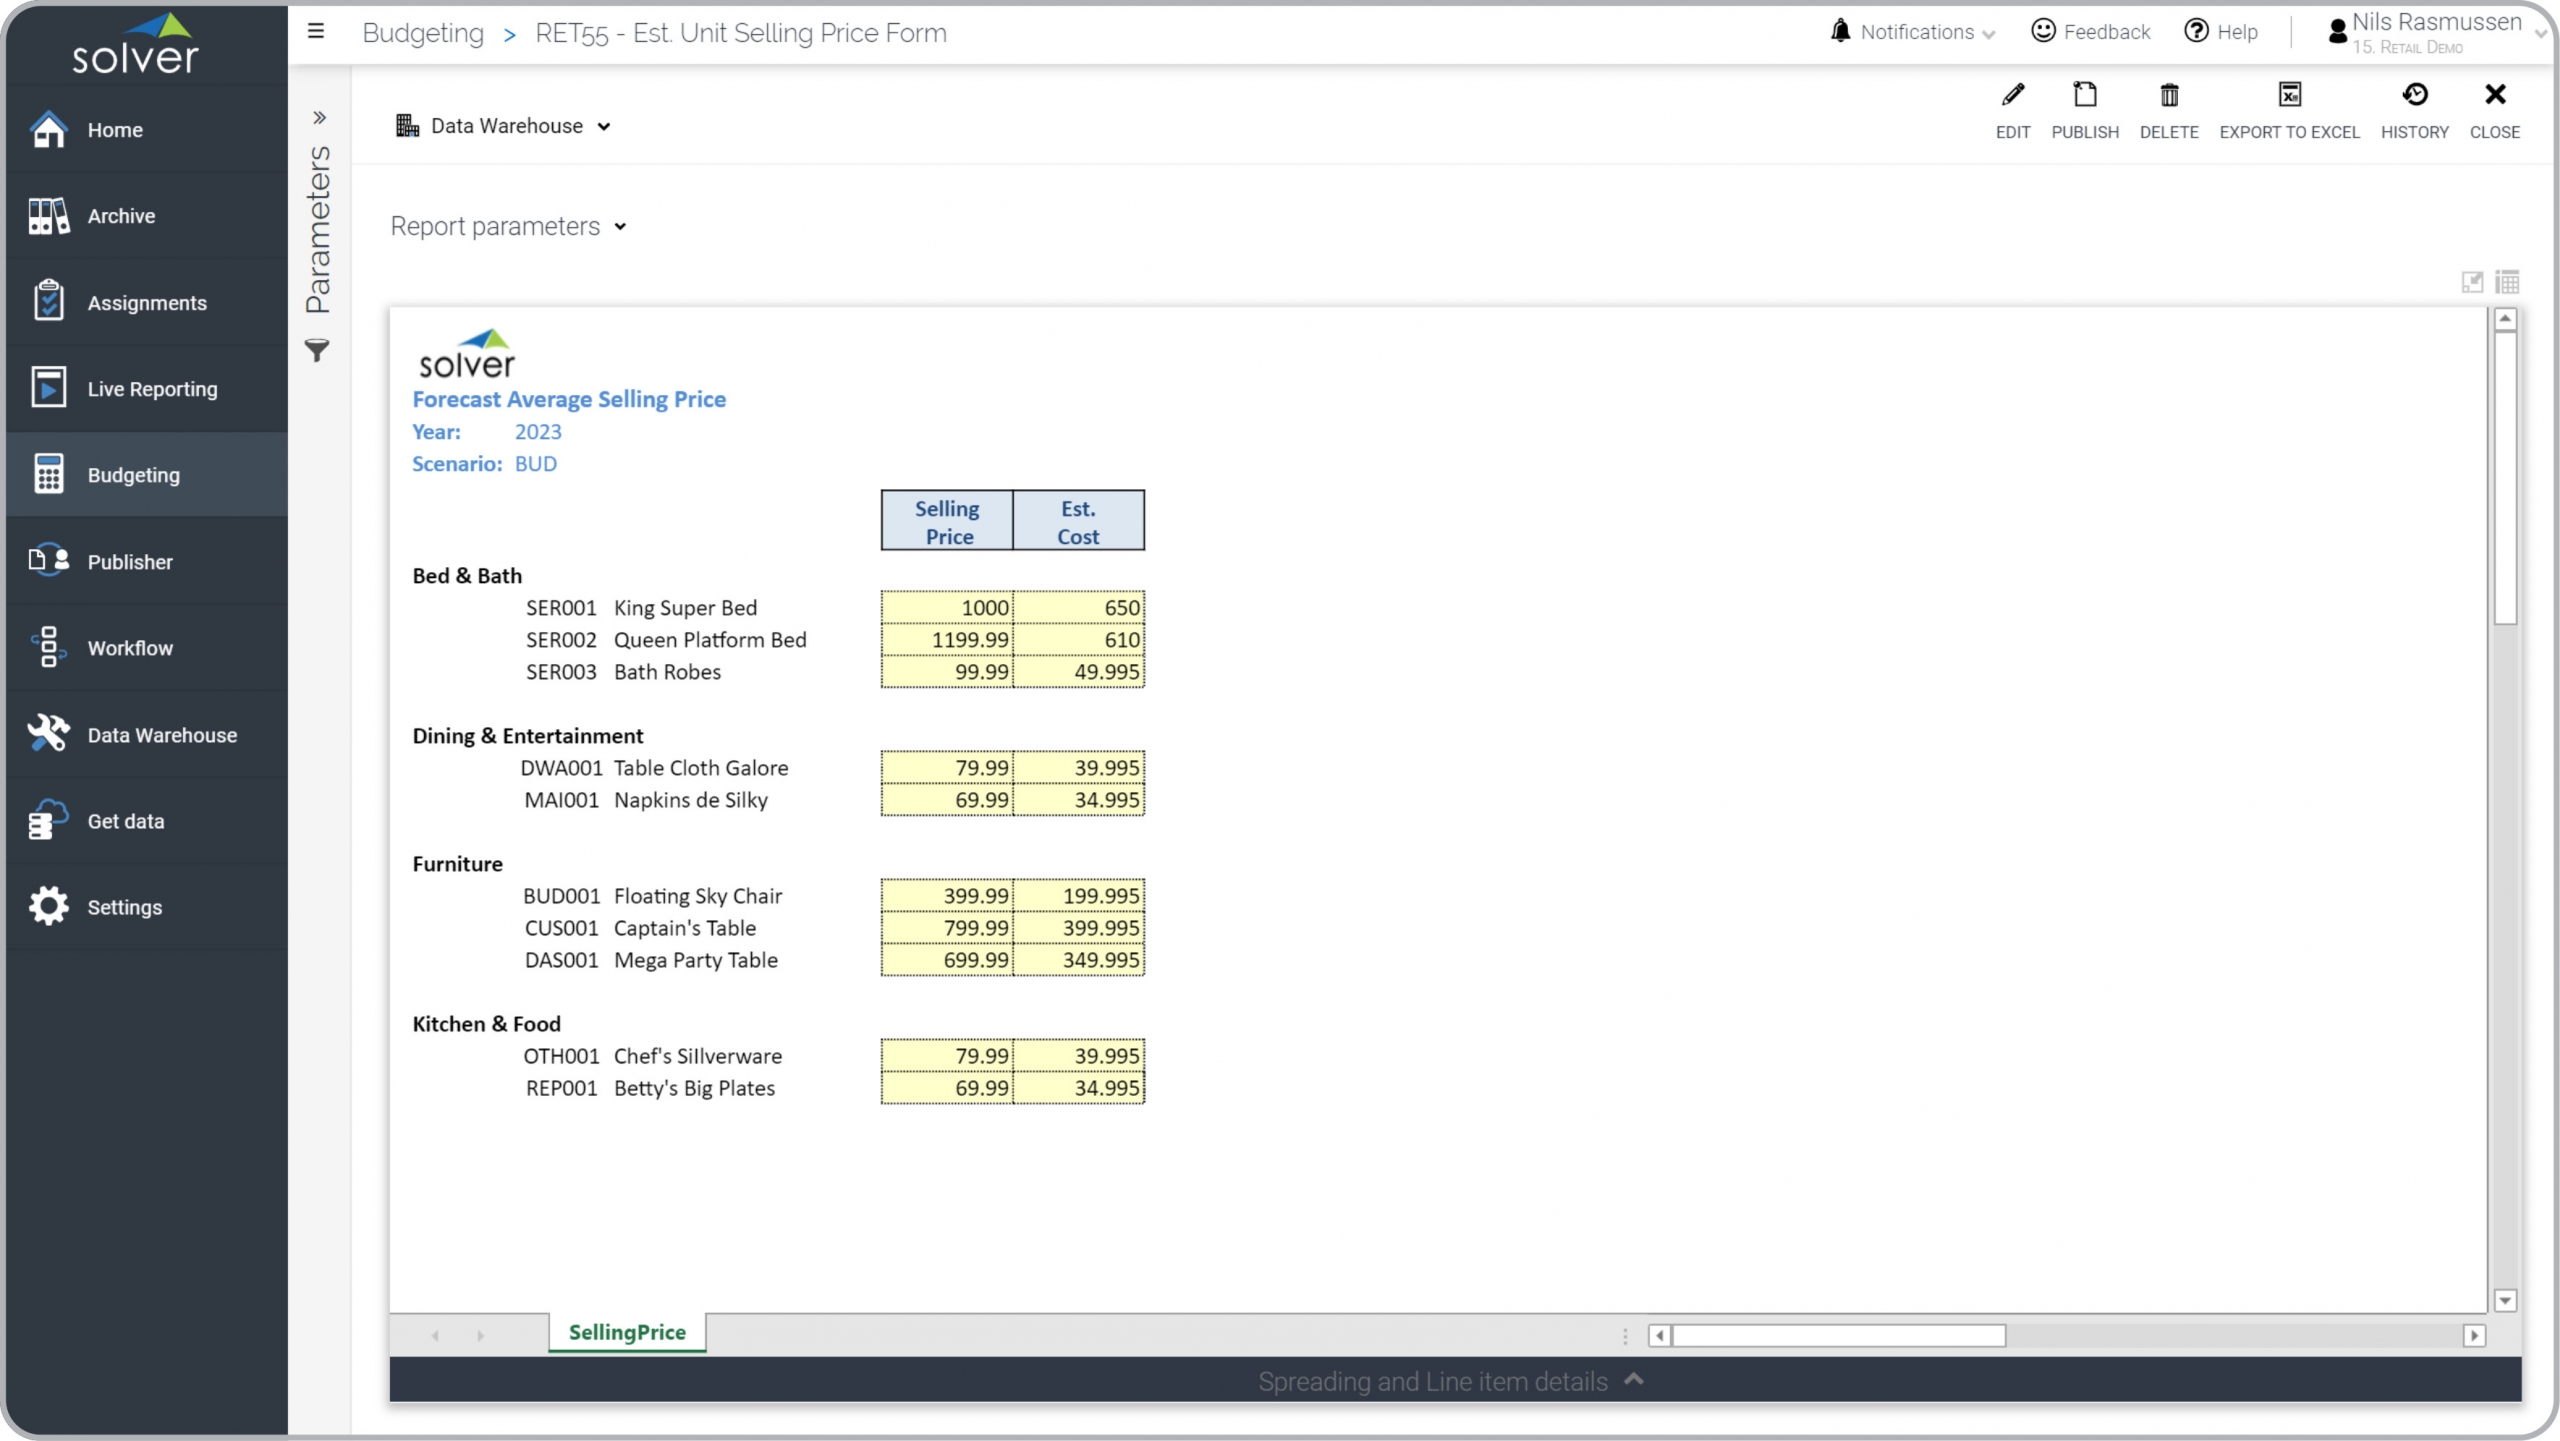
Retail – Average Selling Price Budget
Input of budget or forecast for average selling price per product, which is in the sales plan.
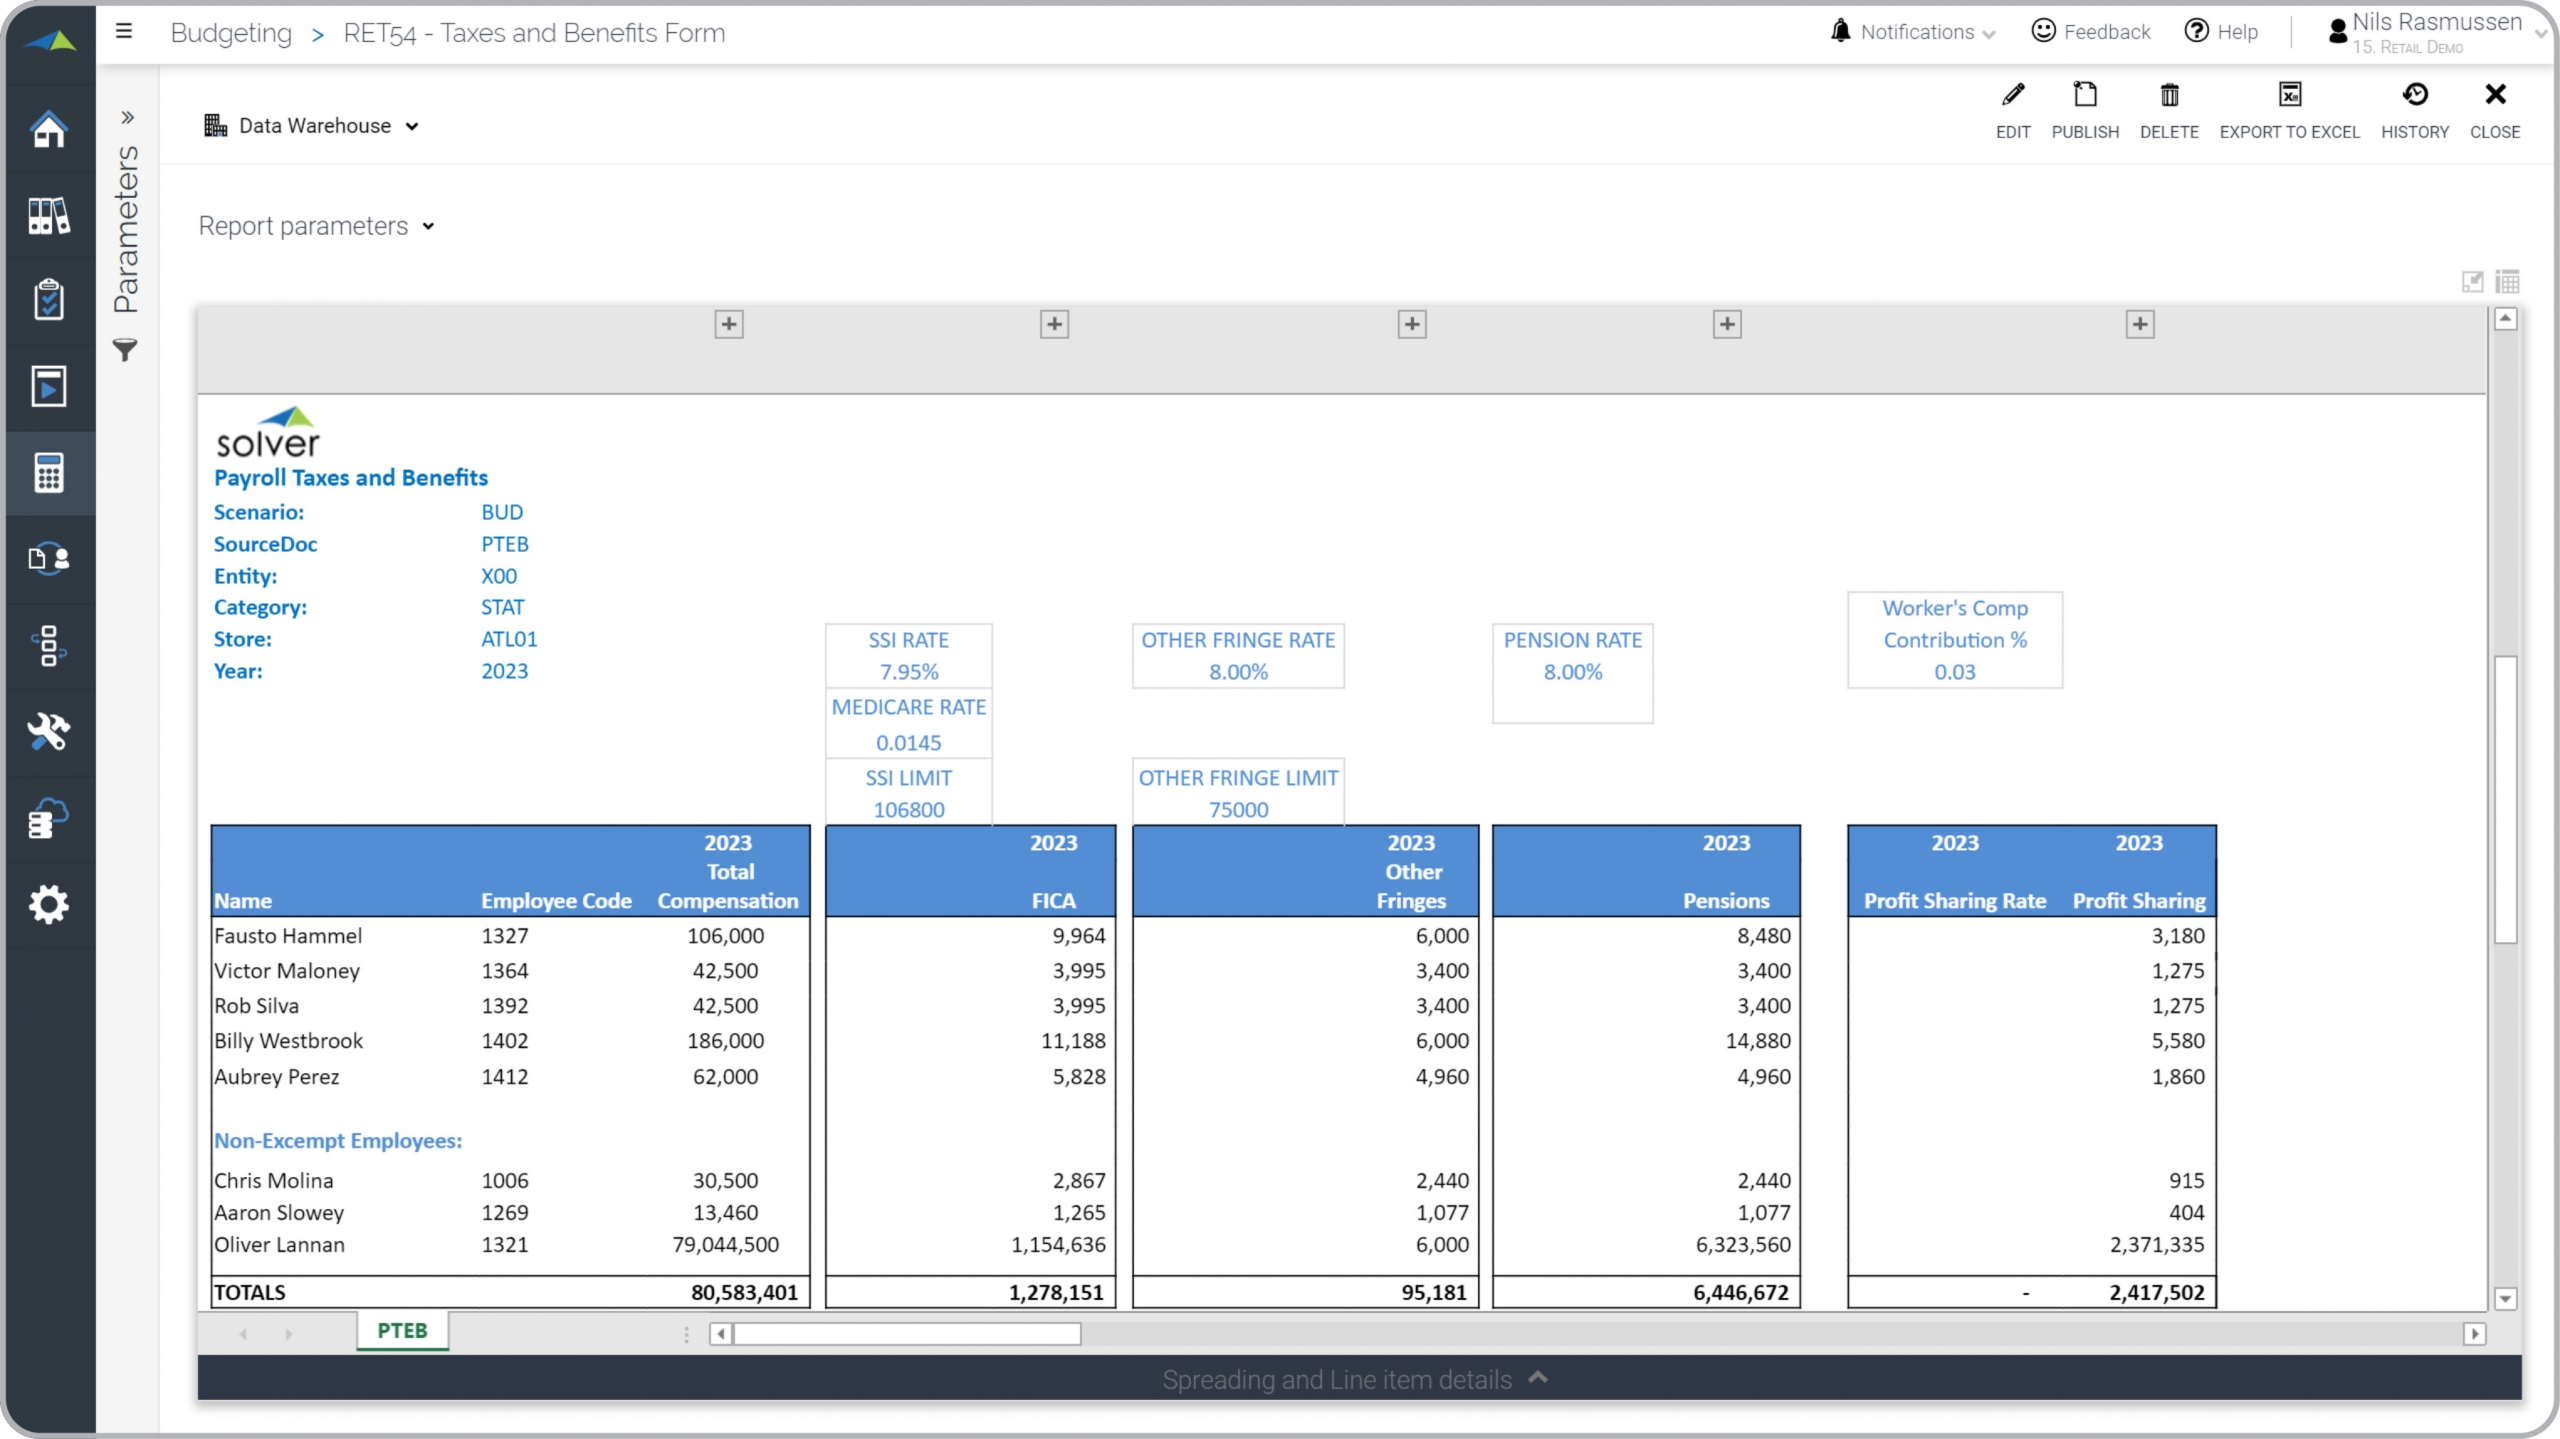
Retail – Employee Taxes and Benefits
Input and drivers for employee taxes and benefits for exempt and non-exempt staff.
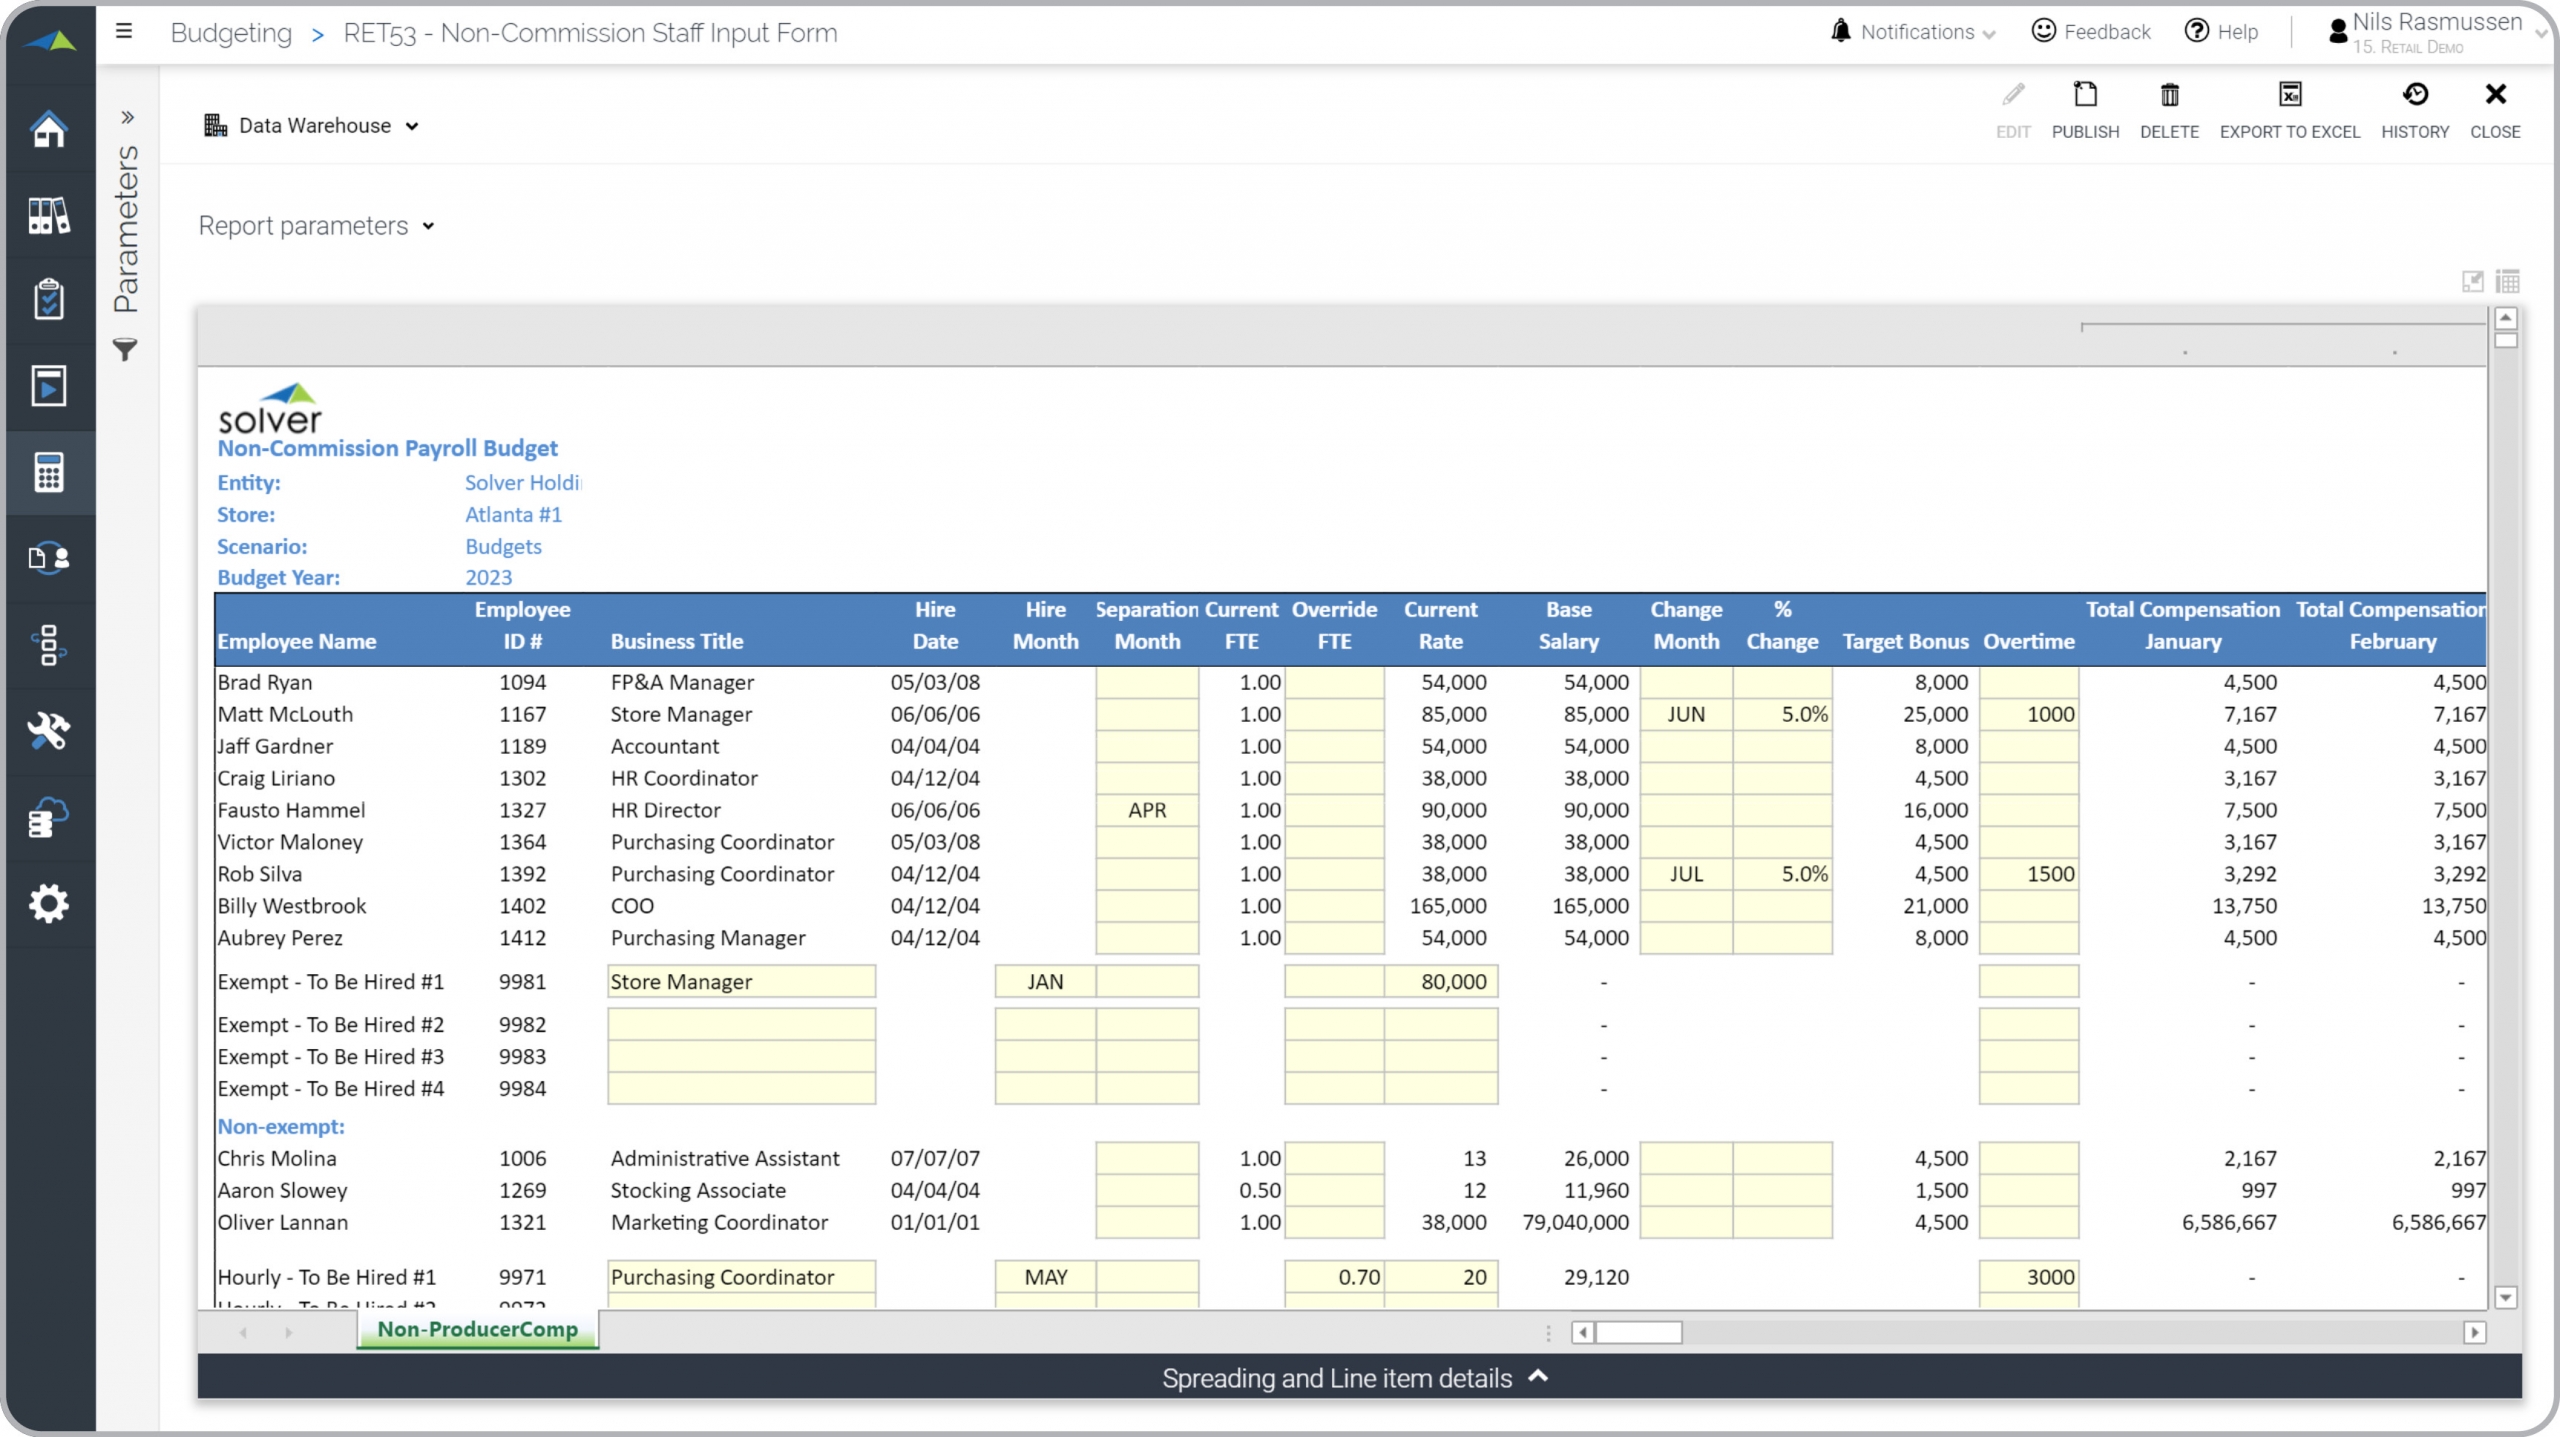
Retail – Non-Commissioned Staff Budget
Input of payroll budget for non-commissioned staff.
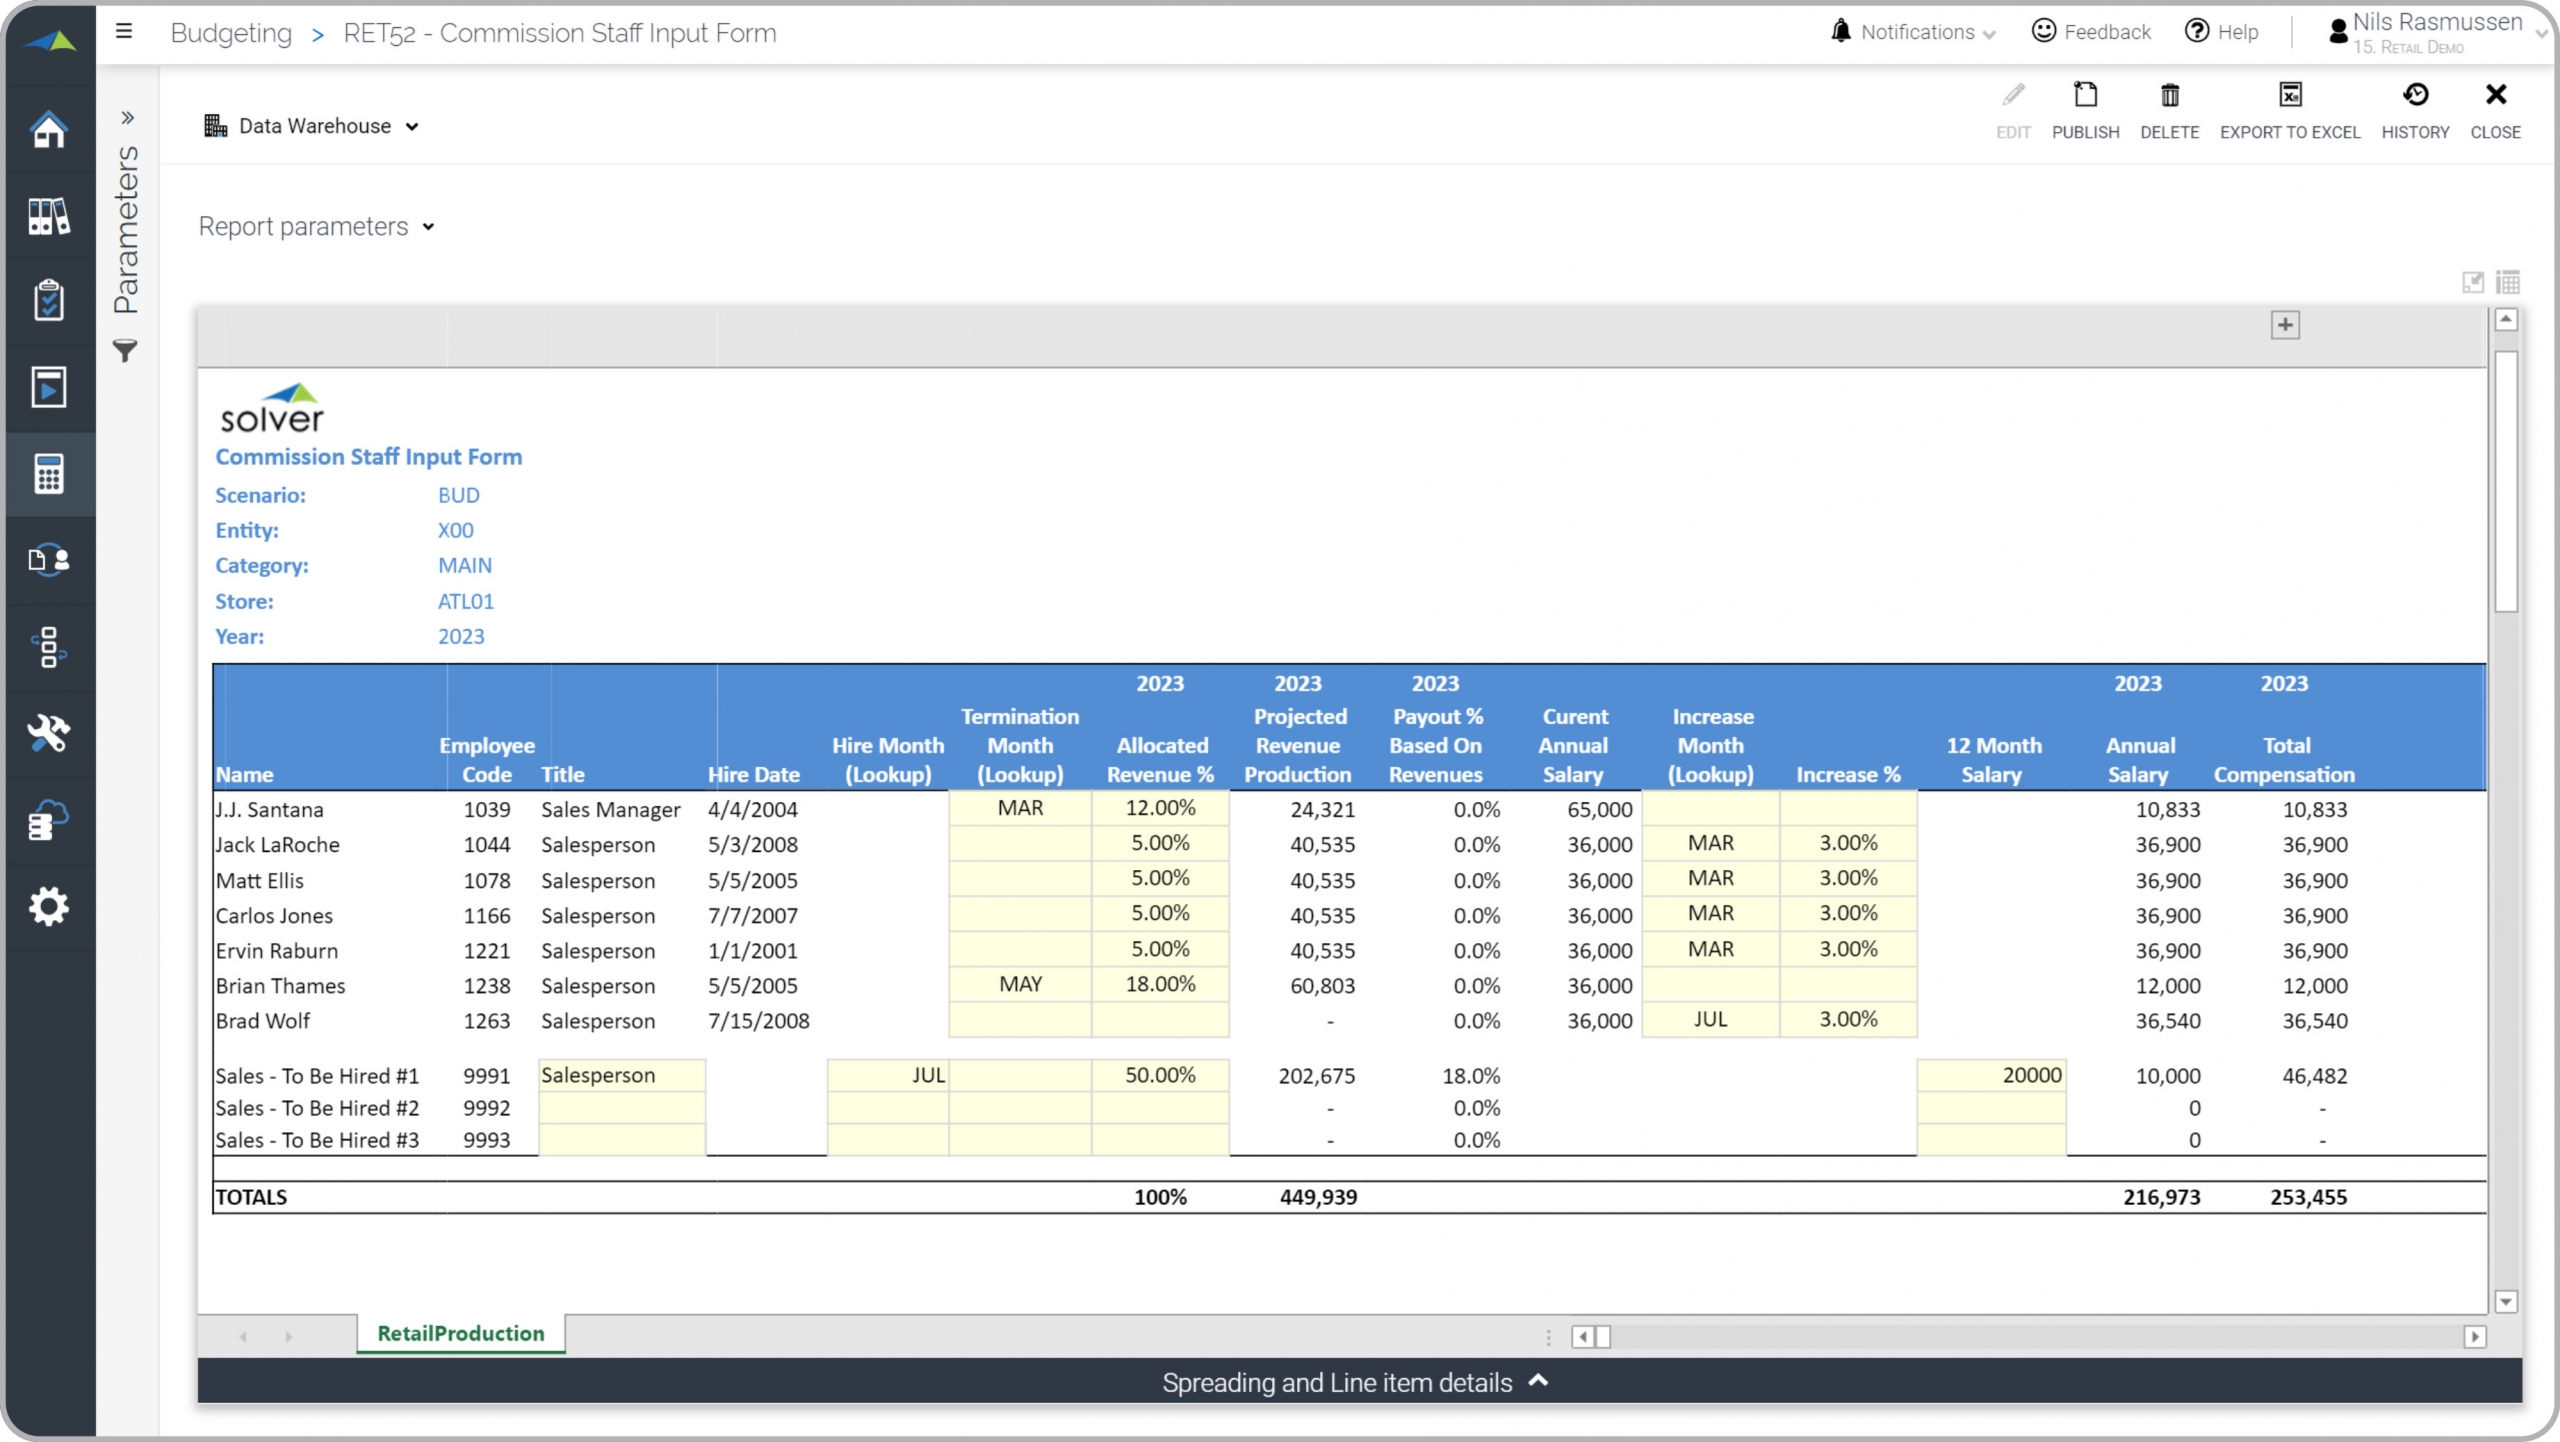
Retail – Commissioned Staff Budget
Provides payroll budget input for commissioned staff based on assumptions (other form).
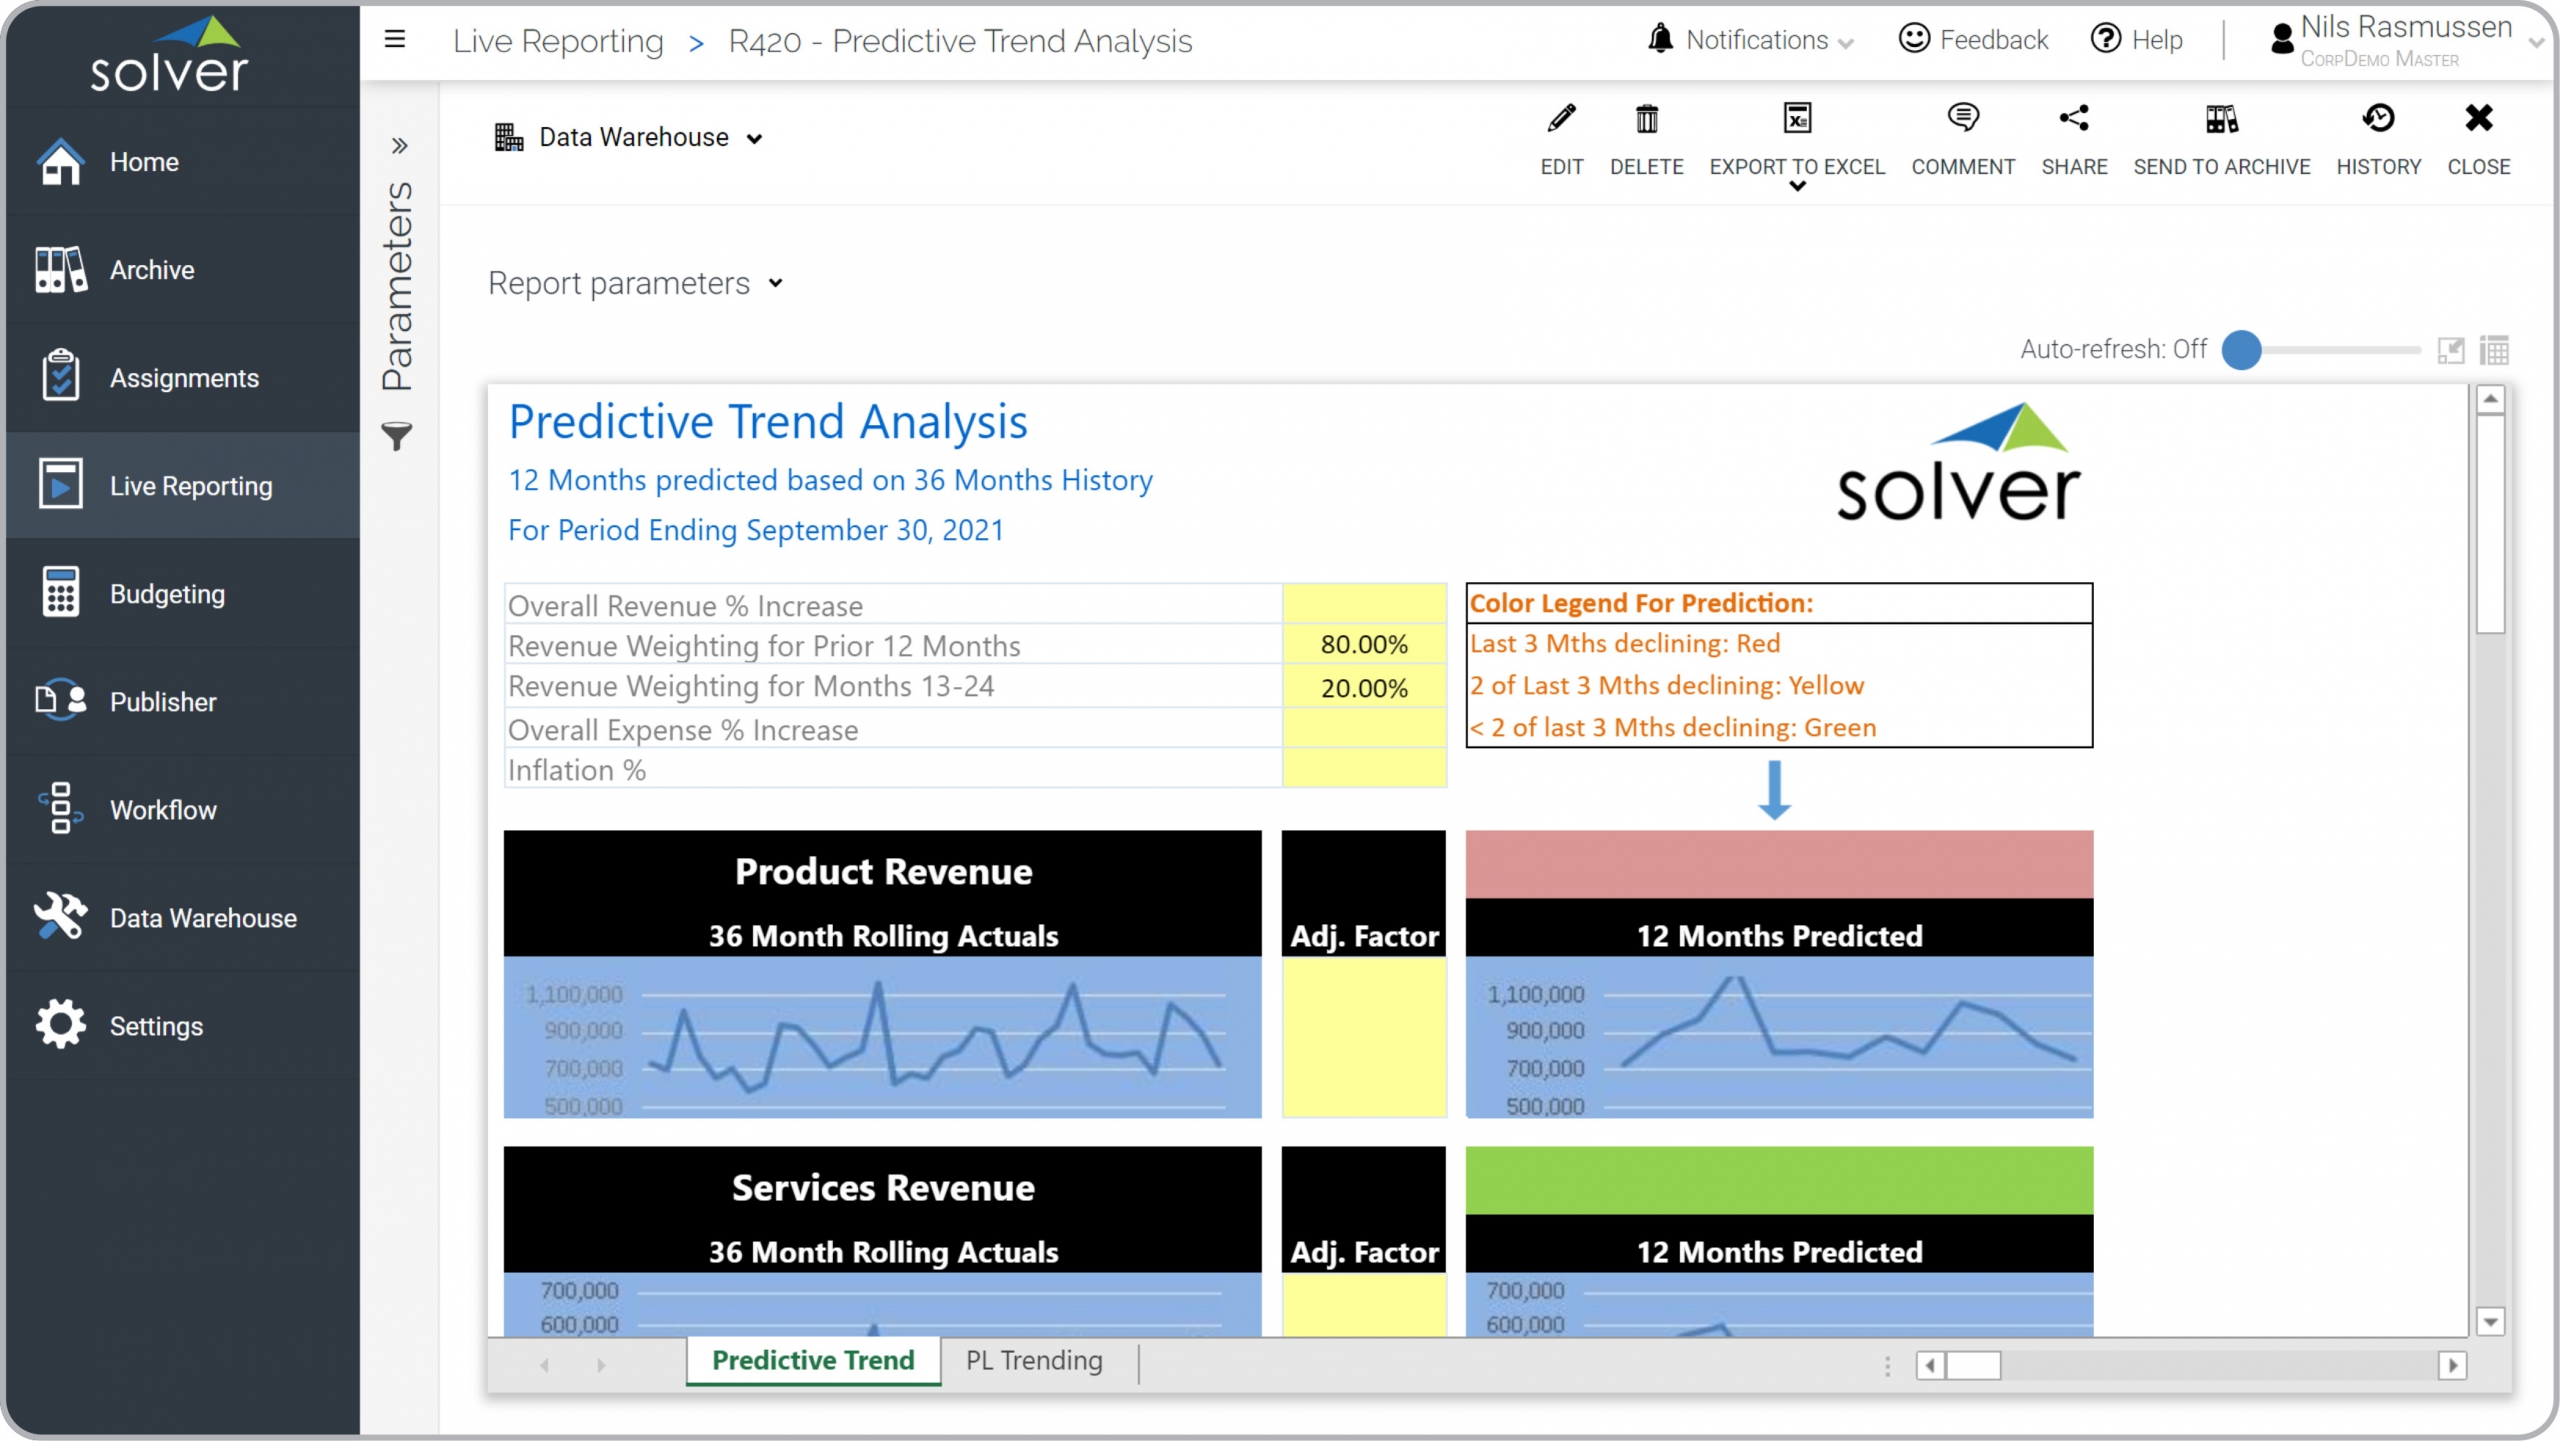
Predictive Trend Analysis
This report shows 3 years of history and uses weighted algorithms to forecast 12 months.
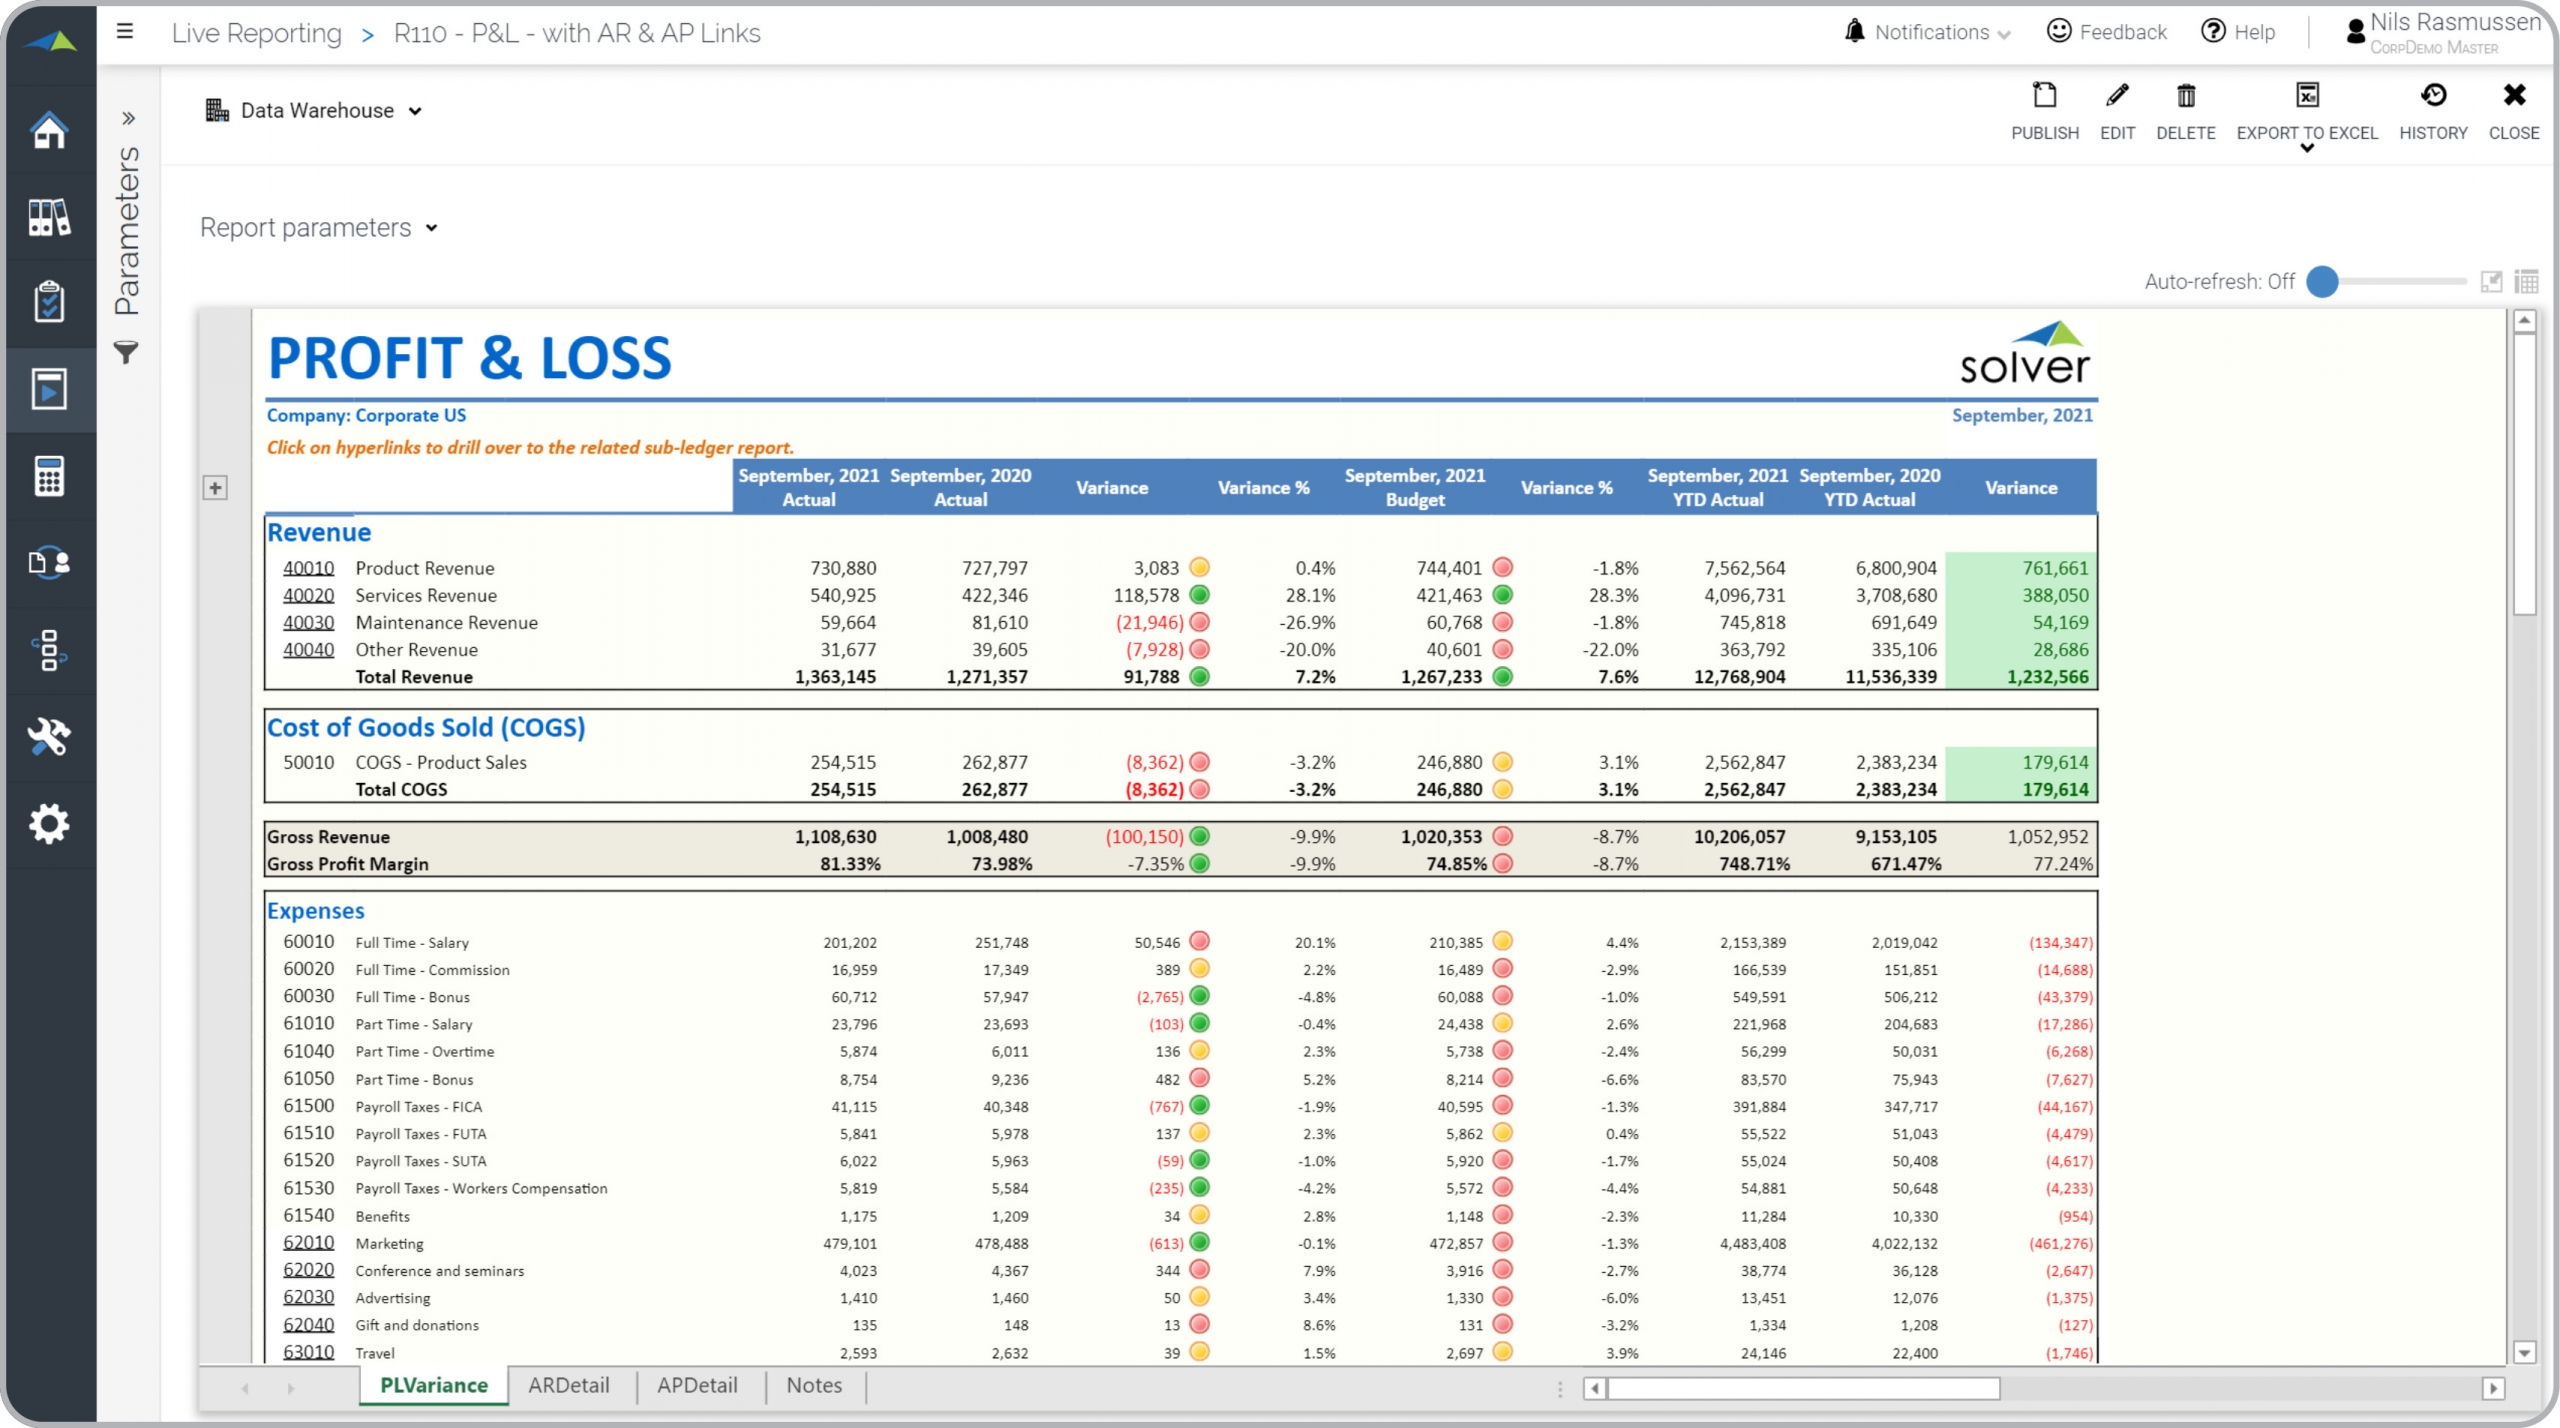
P&L – With links to AR & AP Reports
Variance report with links to underlying sub-ledger reports to explore variances.
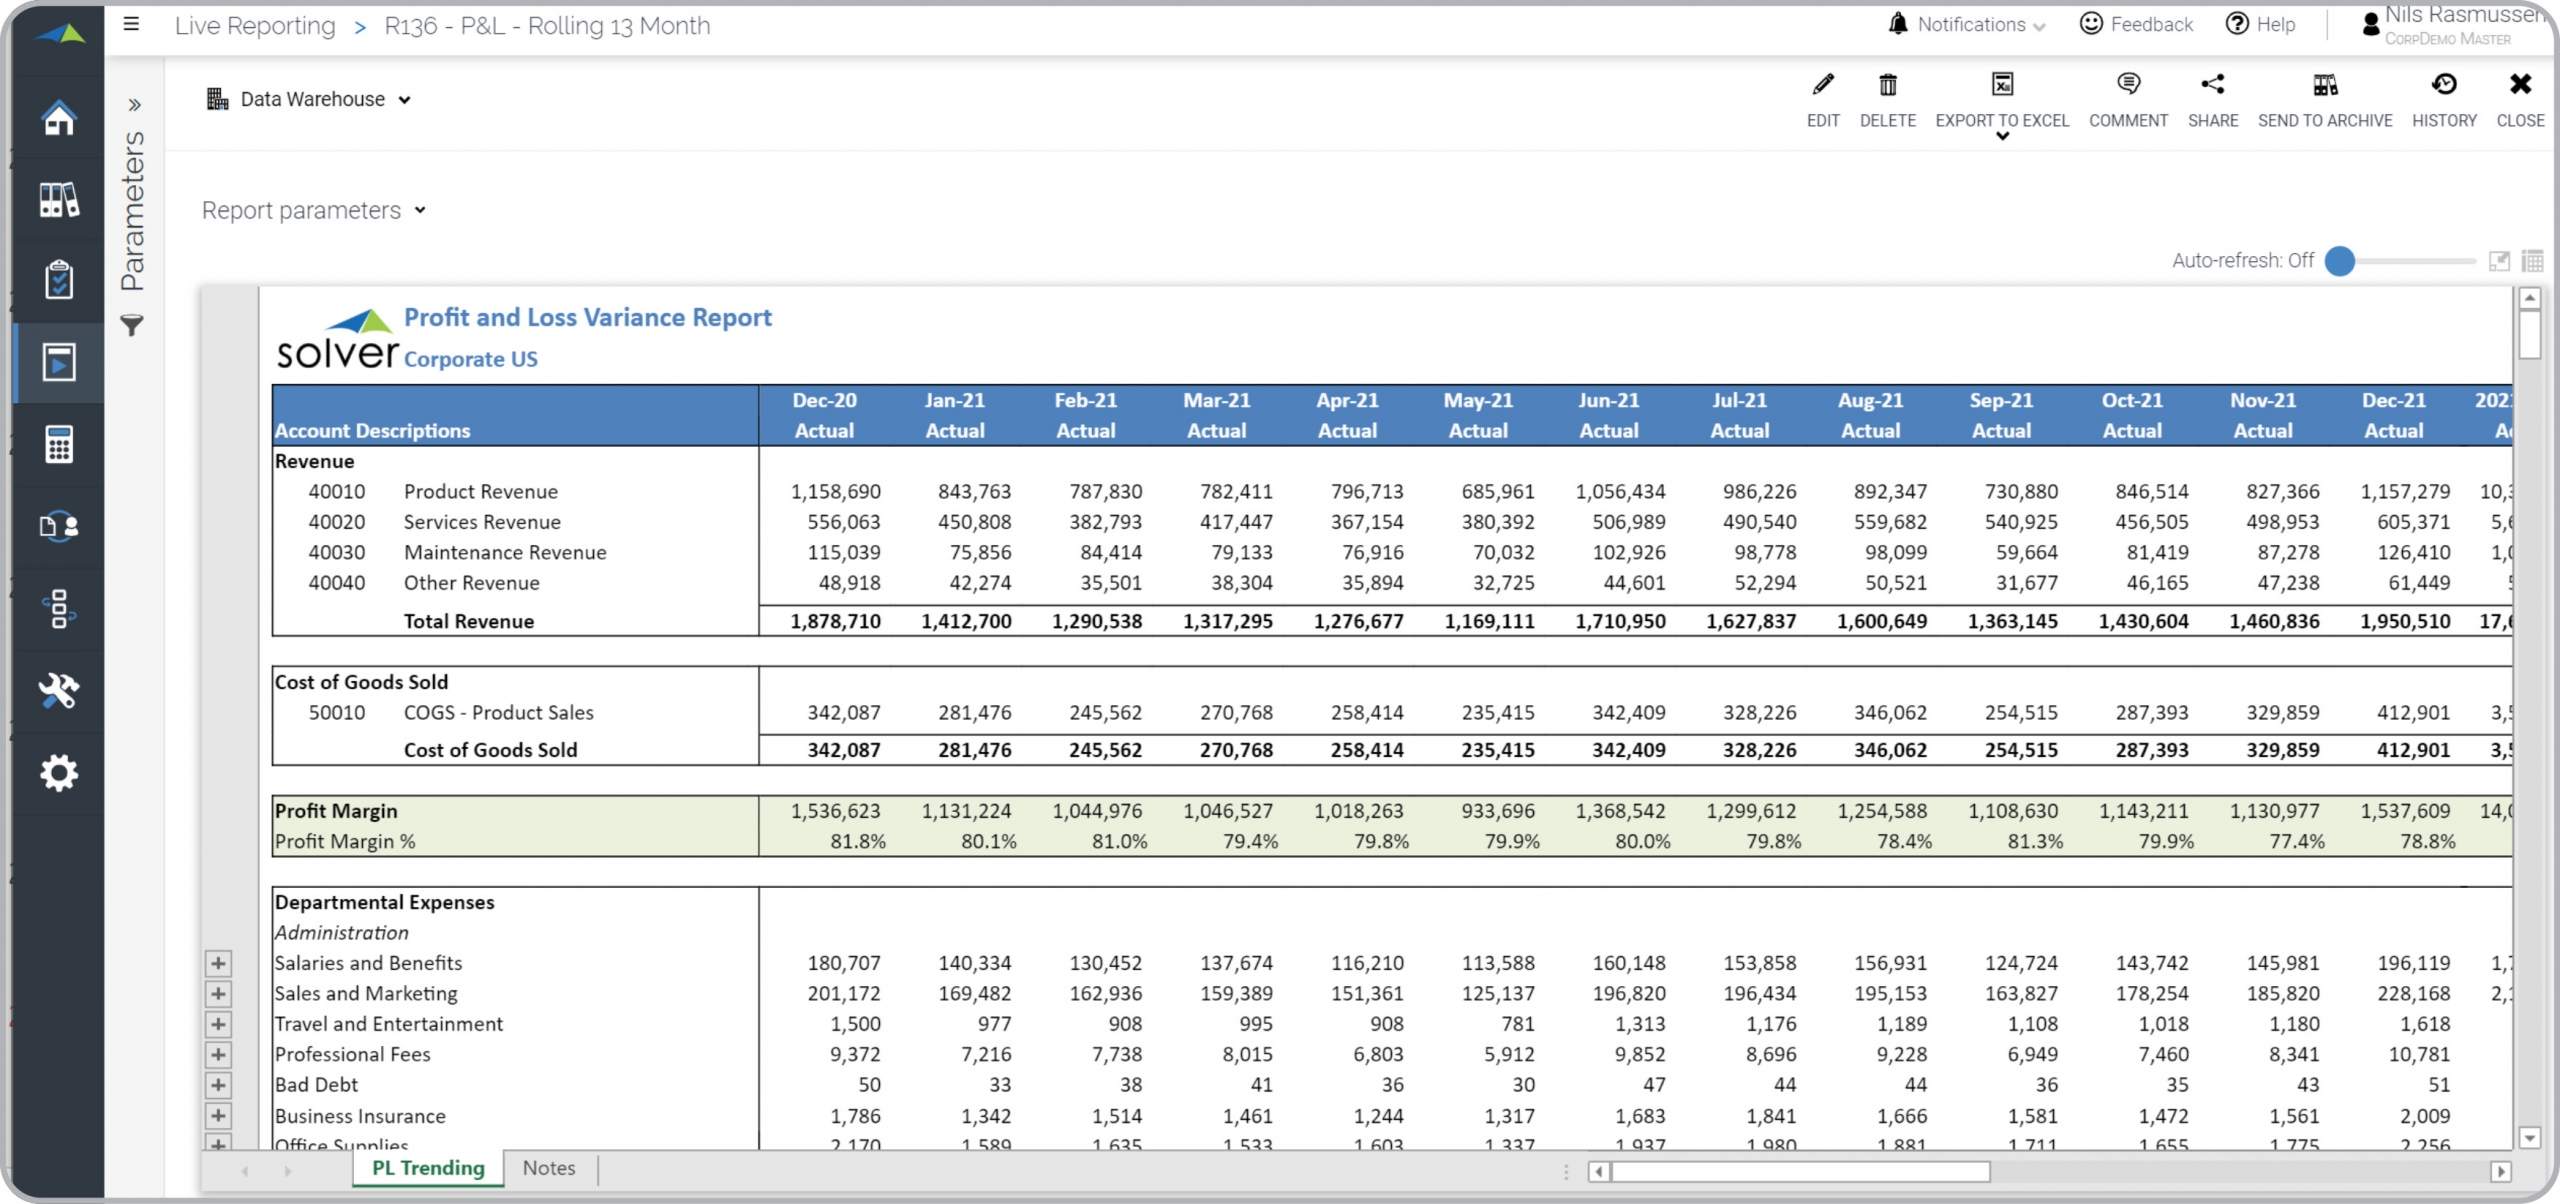
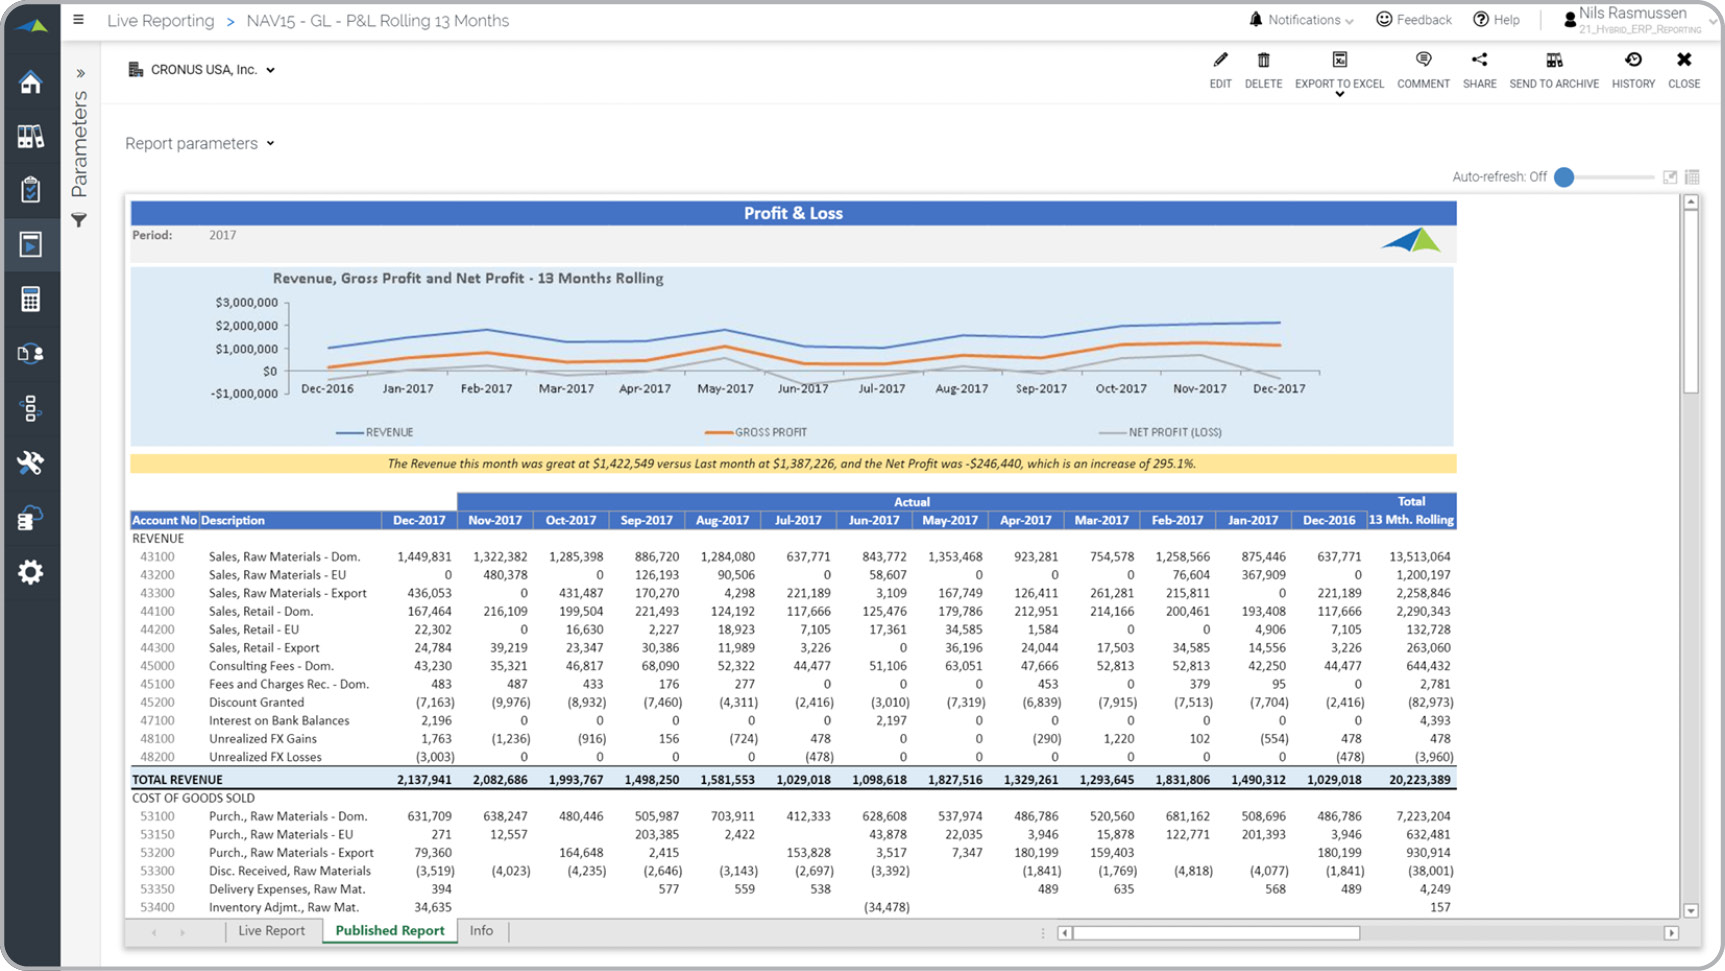
P&L – Rolling 13 Month
Provides monthly Profit & Loss comparisons over a 13-month rolling period.
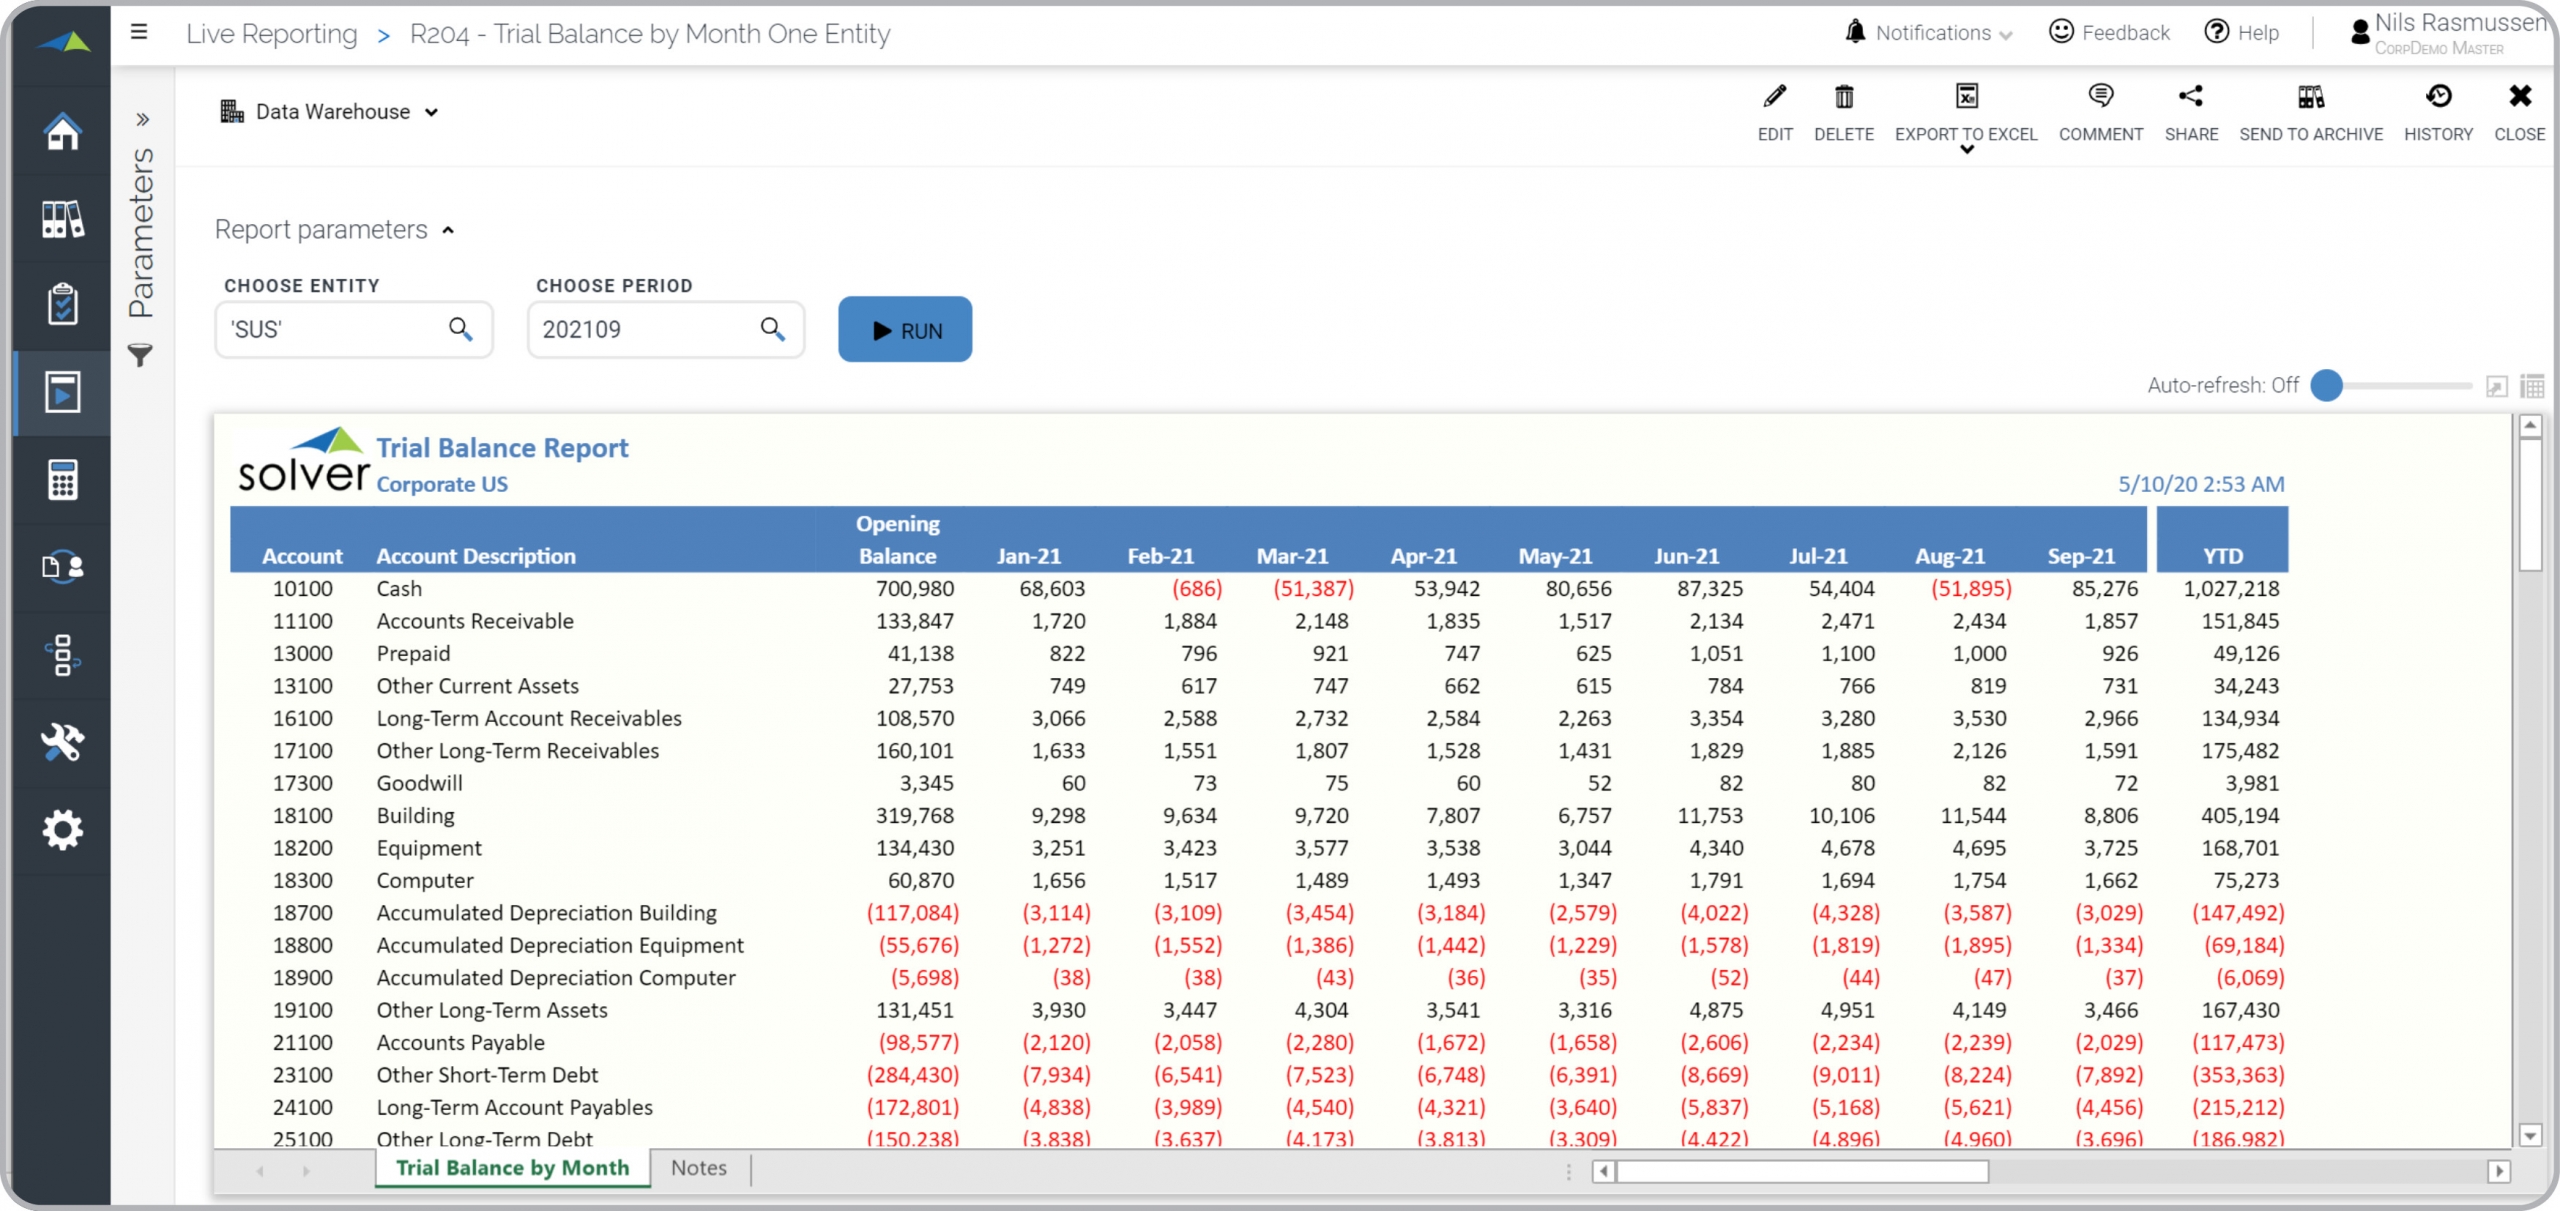
Trial Balance by Month
Allows for easy comparison by showing monthly balances up until the current period.
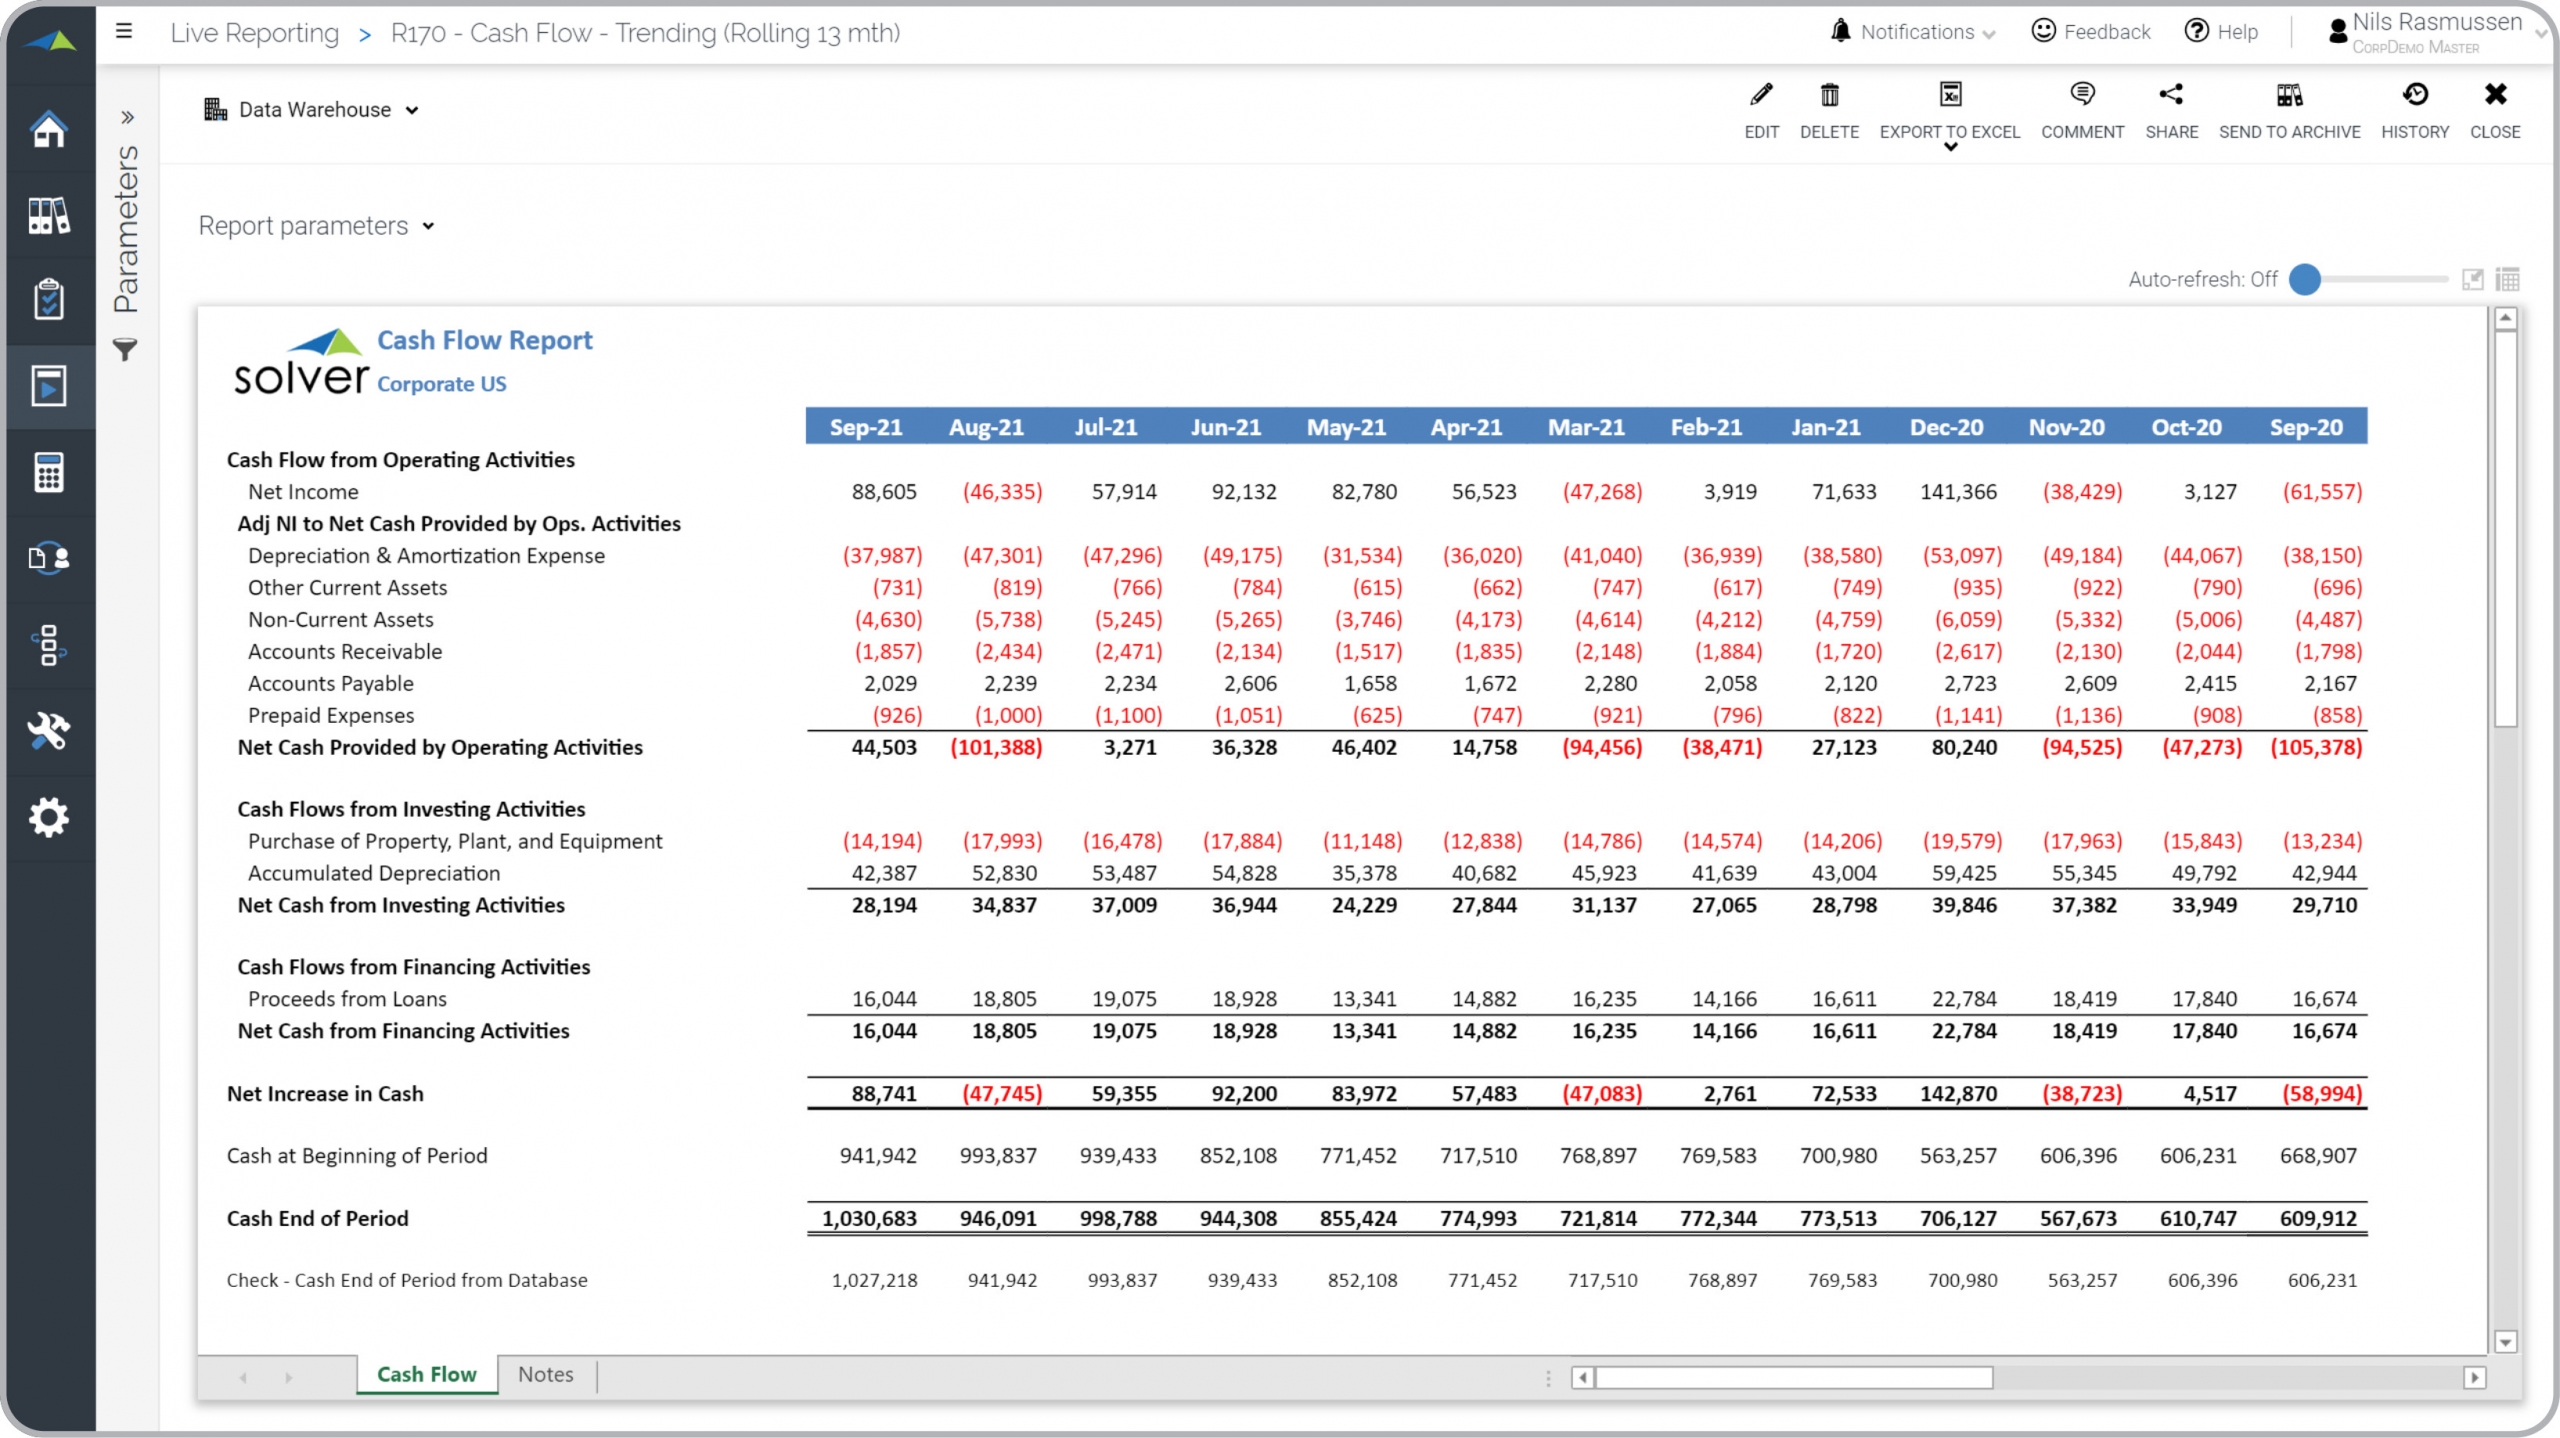
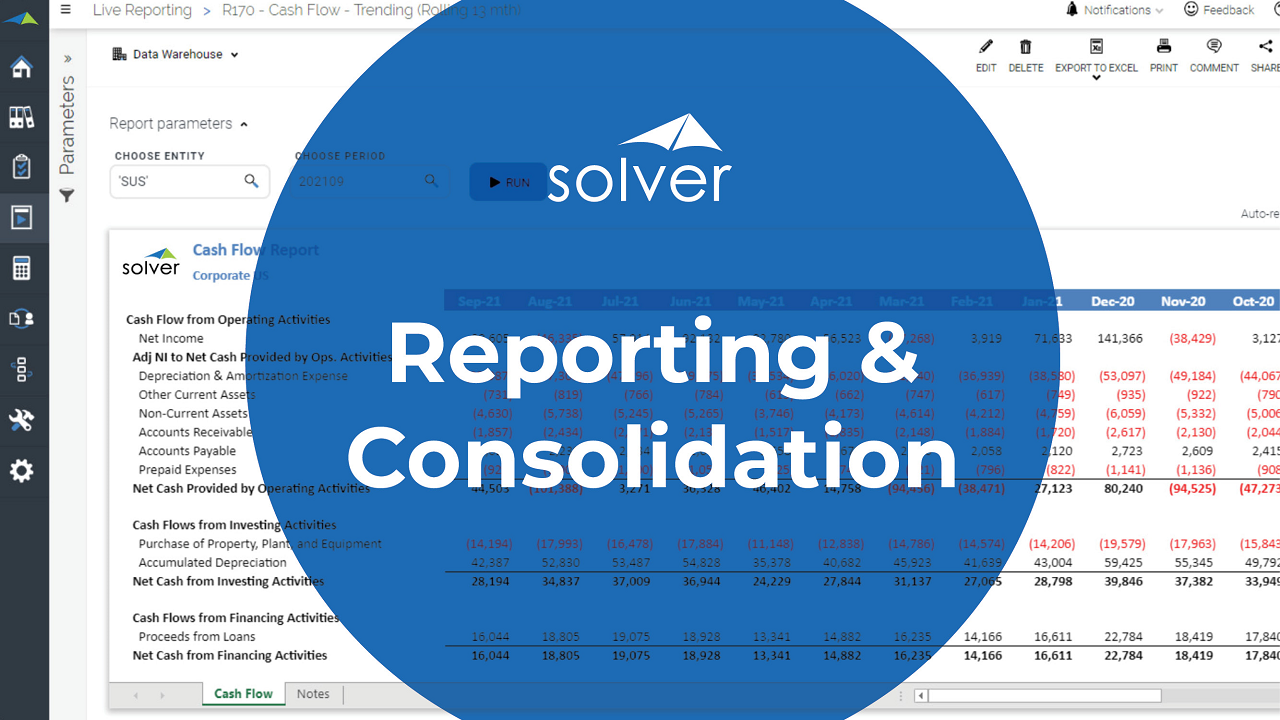
Cash Flow – Rolling 13
Cash Flow report that dynamically displays the past 13 months.
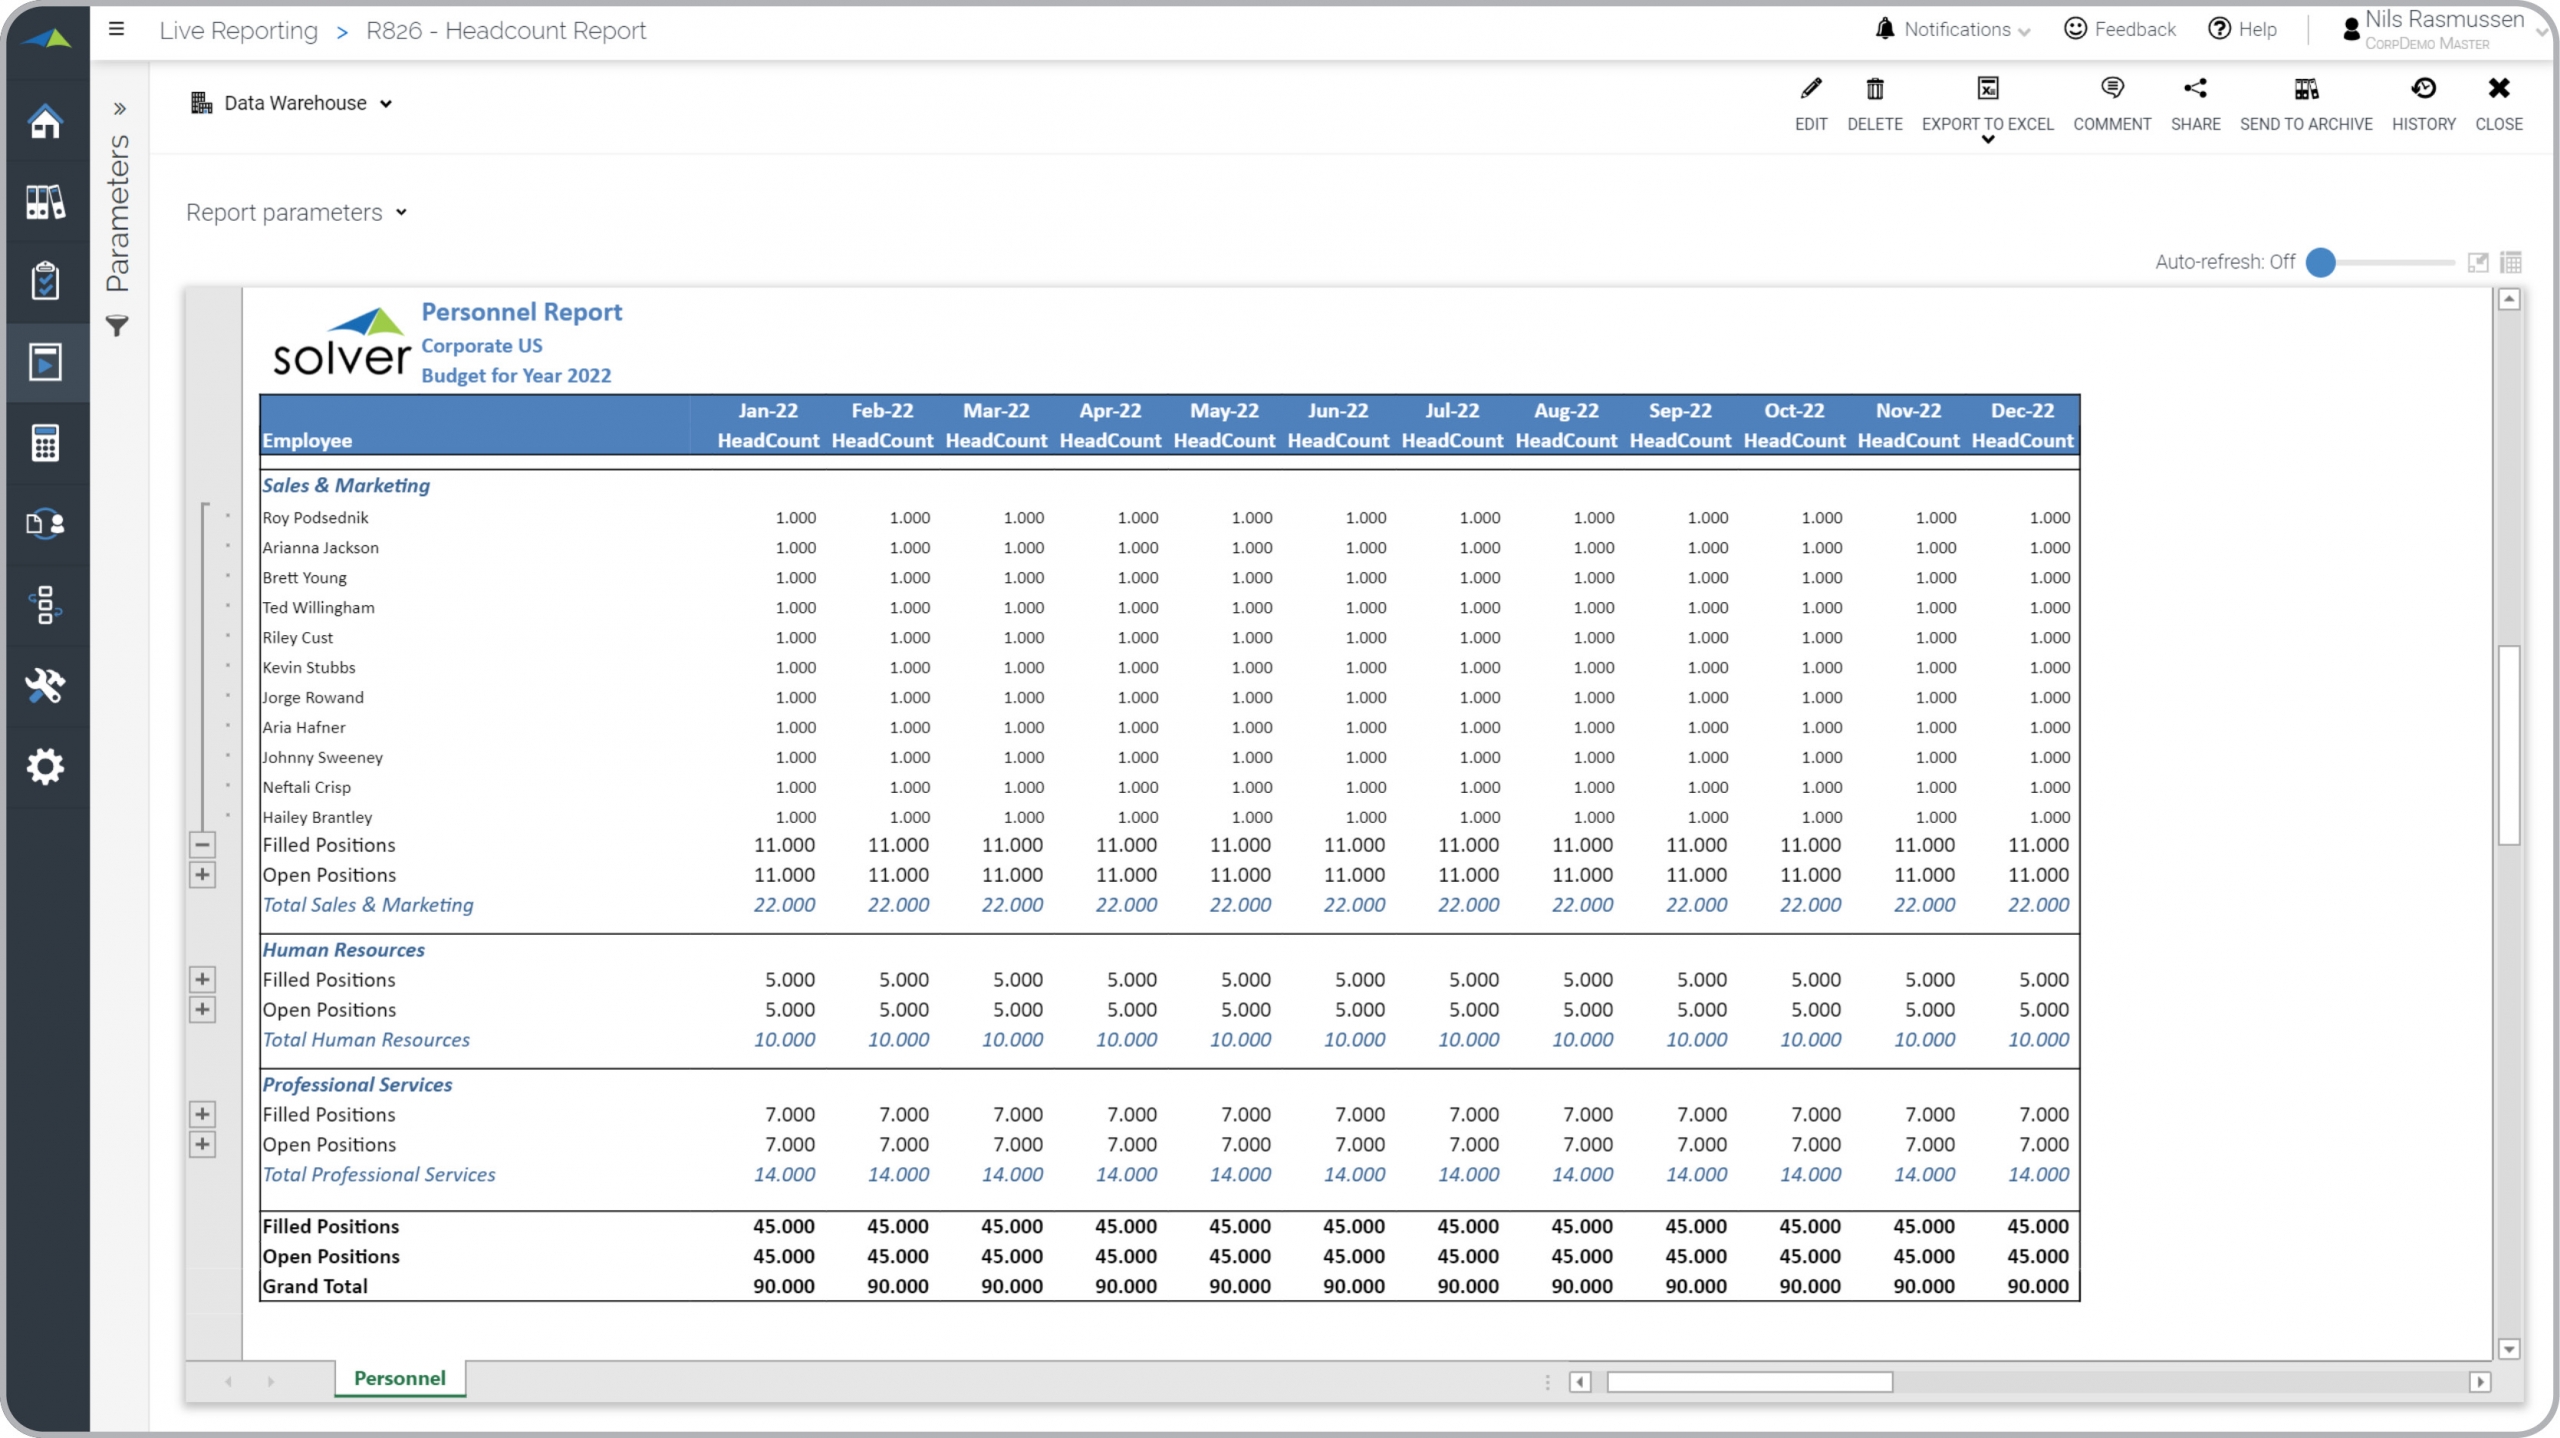
Personnel Budget Report
After budgets are created you can review headcount per department and by position type.
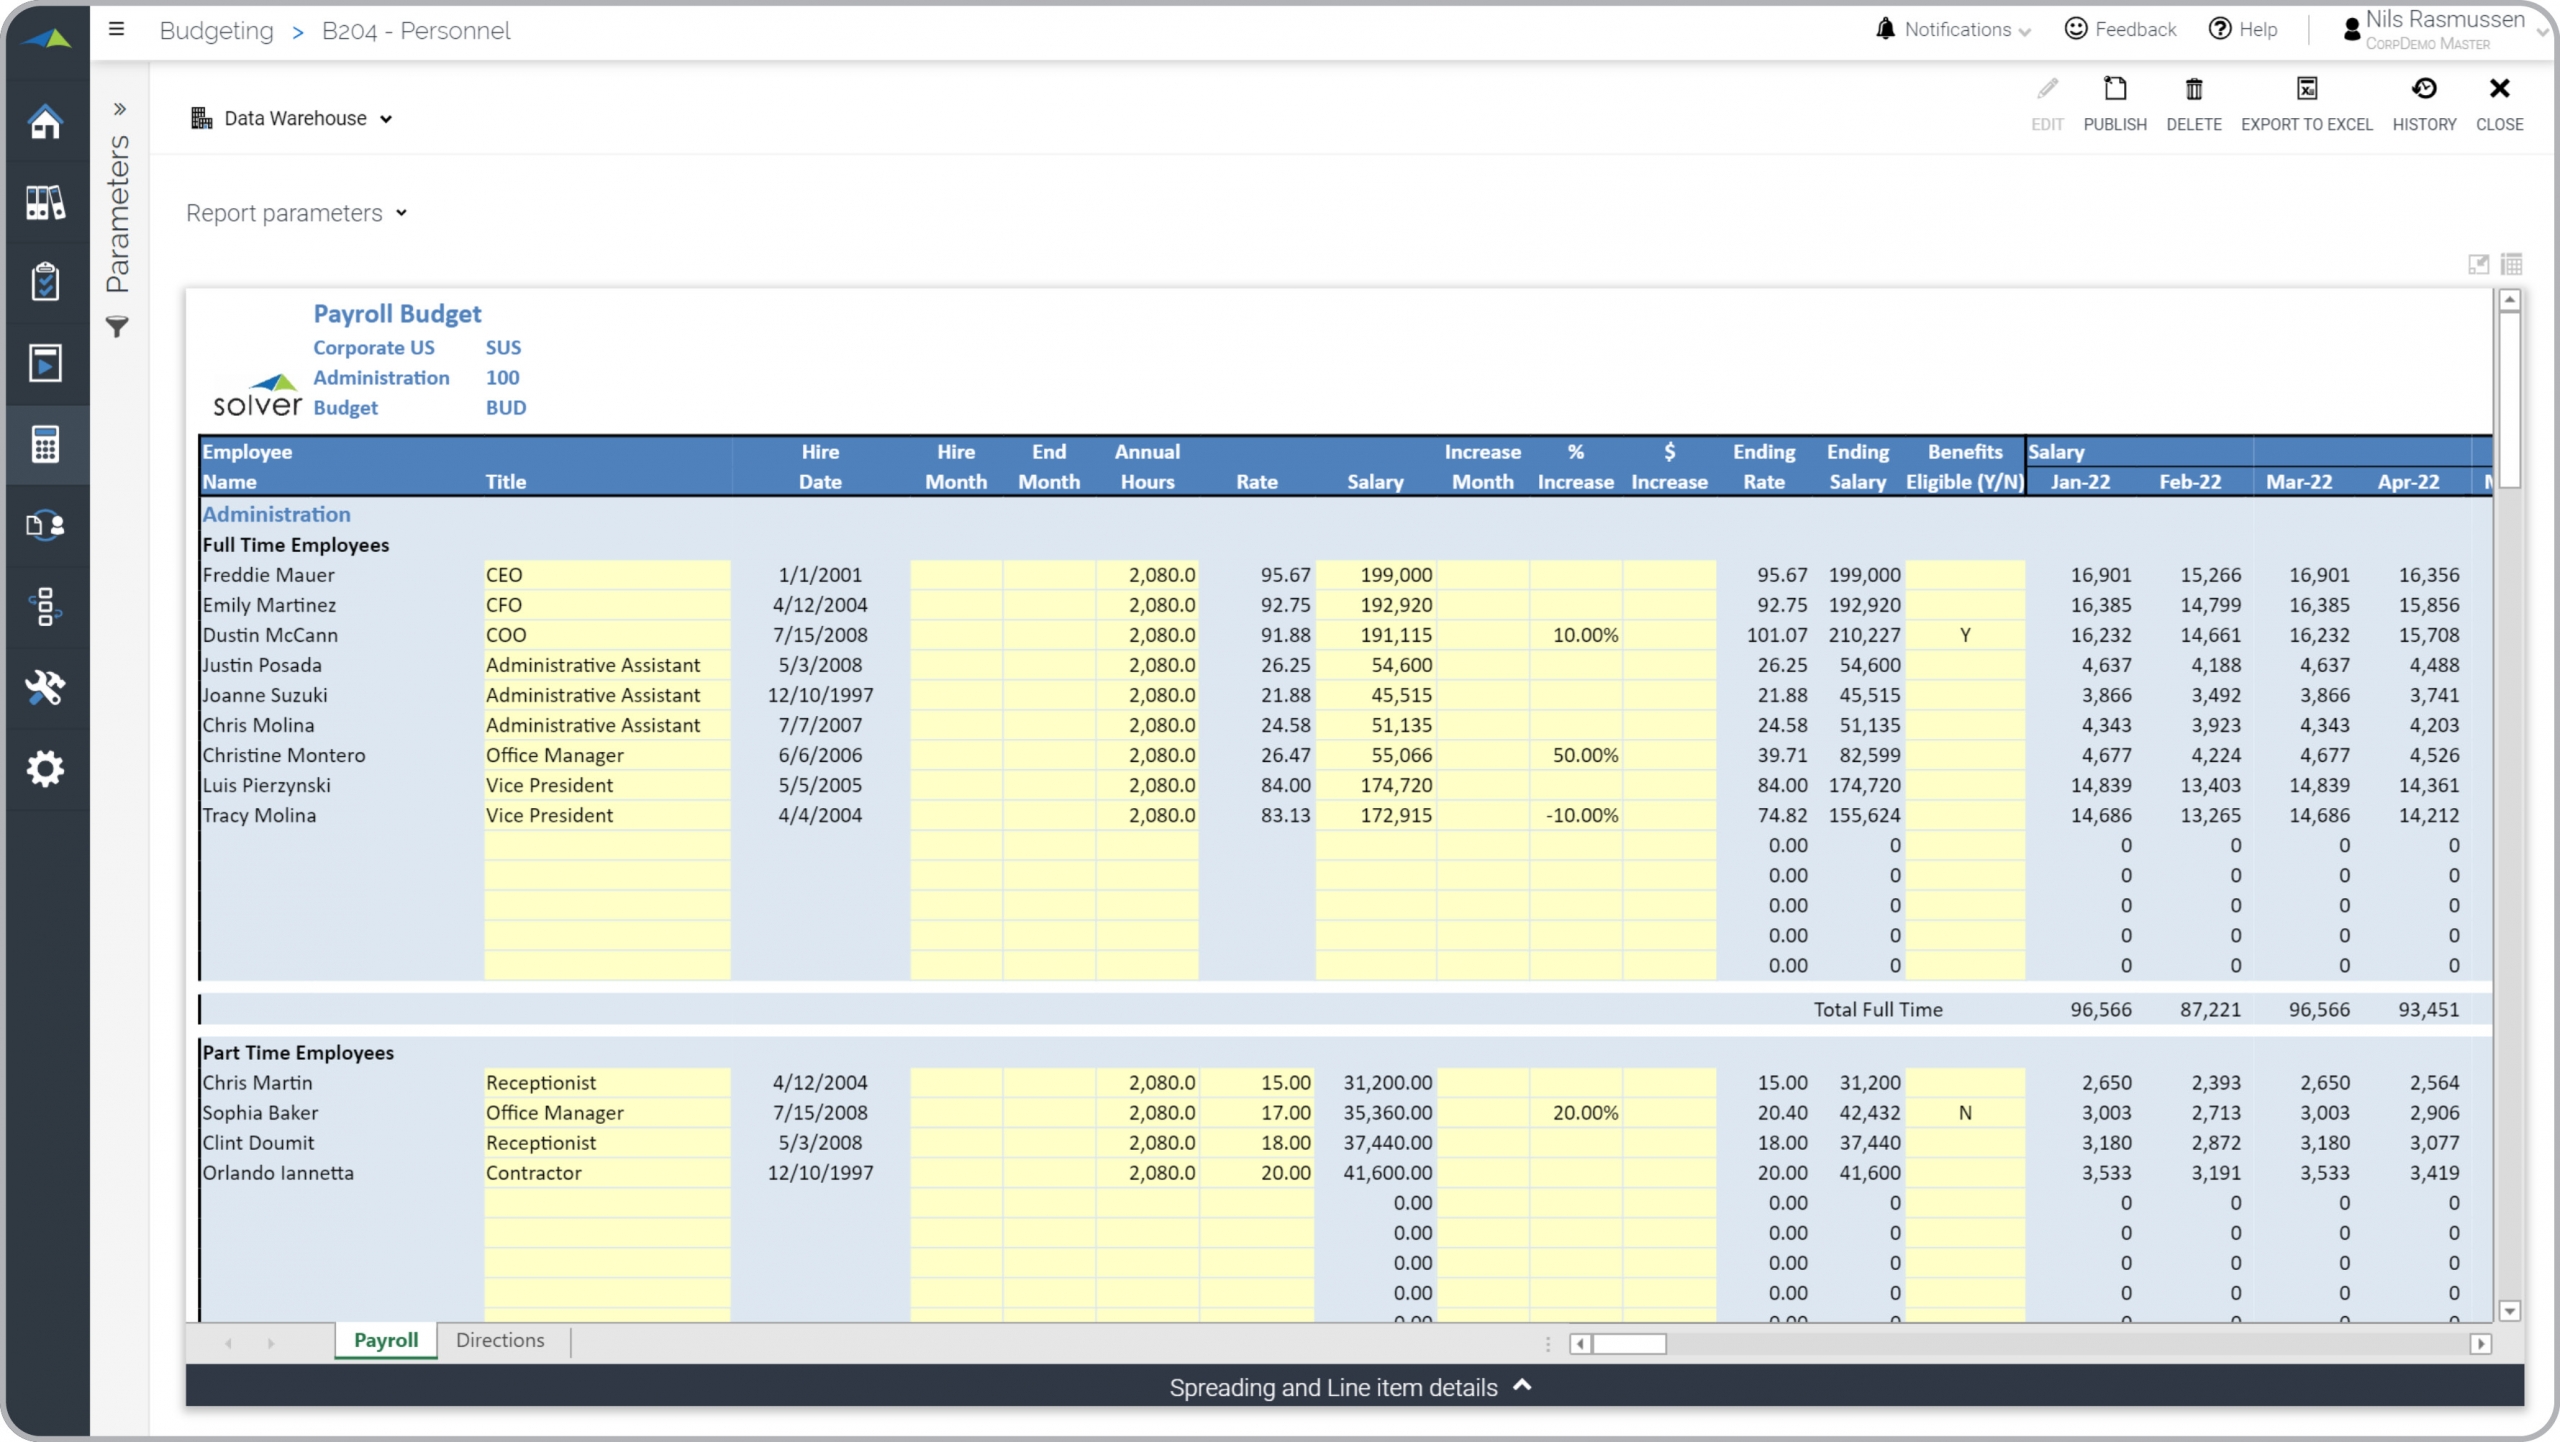
Payroll Budget
Enter key information and let the form calculate monthly salaries, benefits, taxes, etc.
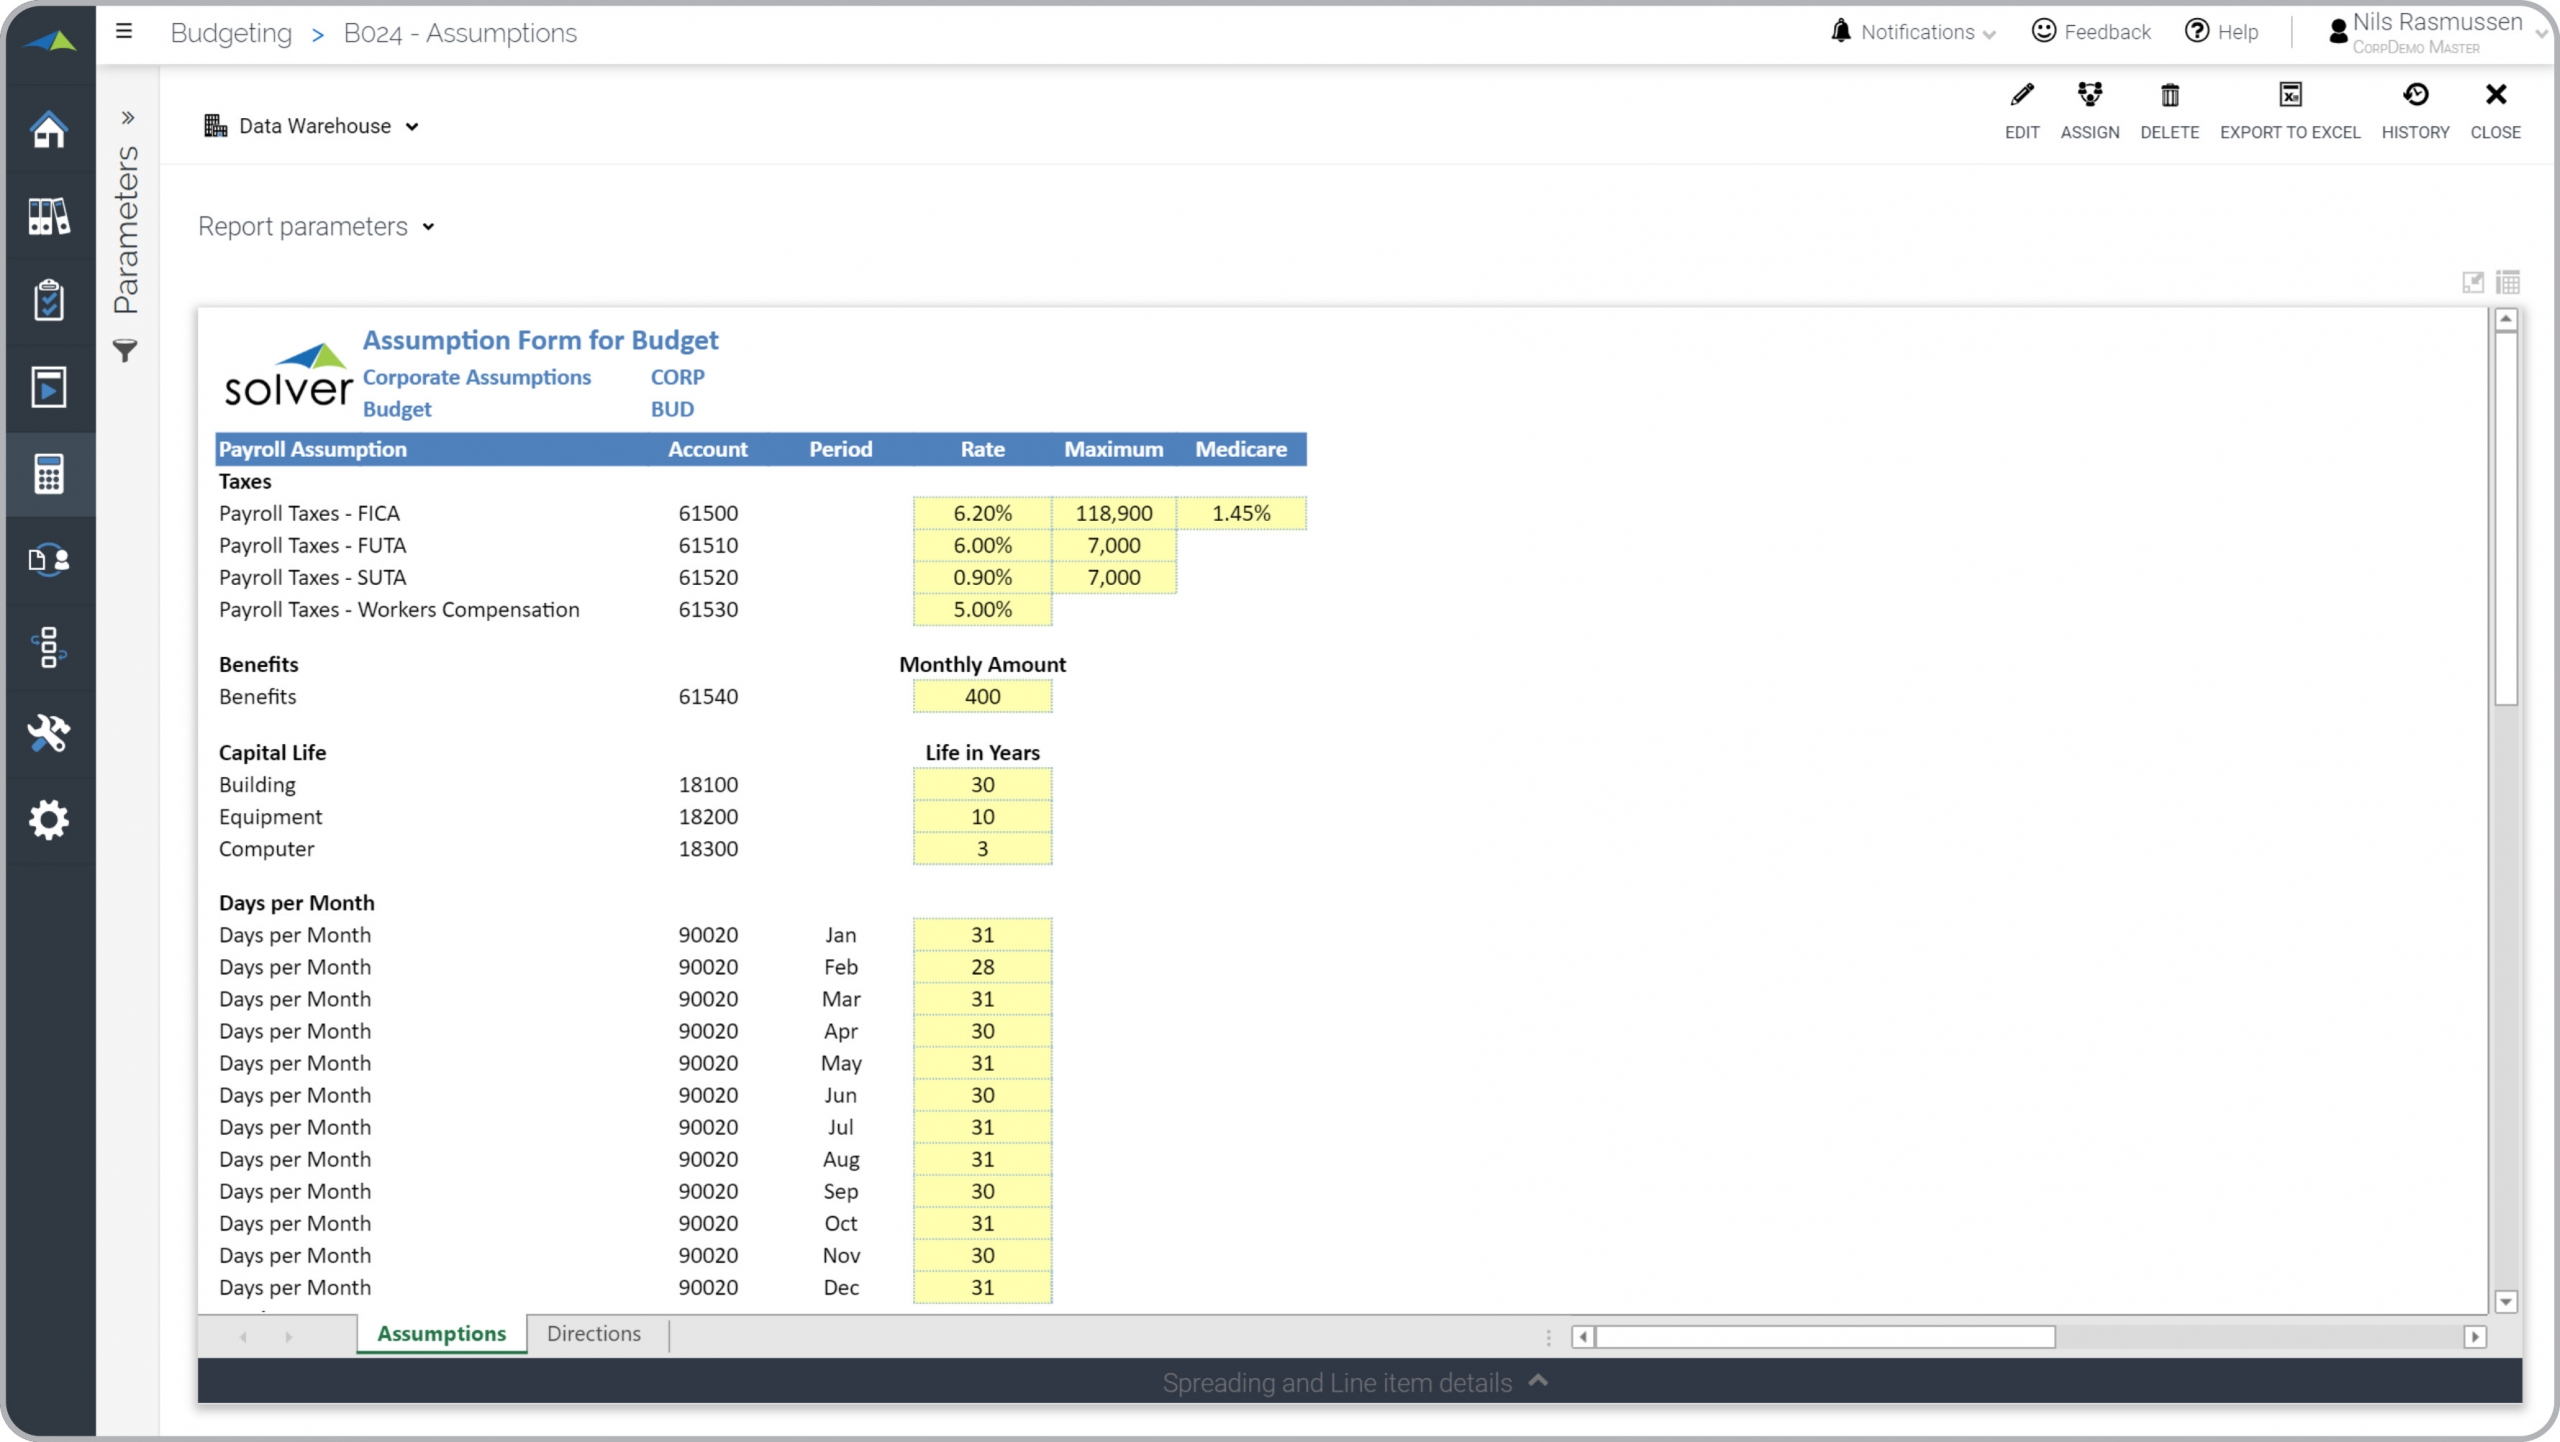
Payroll Assumptions – Budget
Enter assumptions that will drive the payroll and headcount budget.
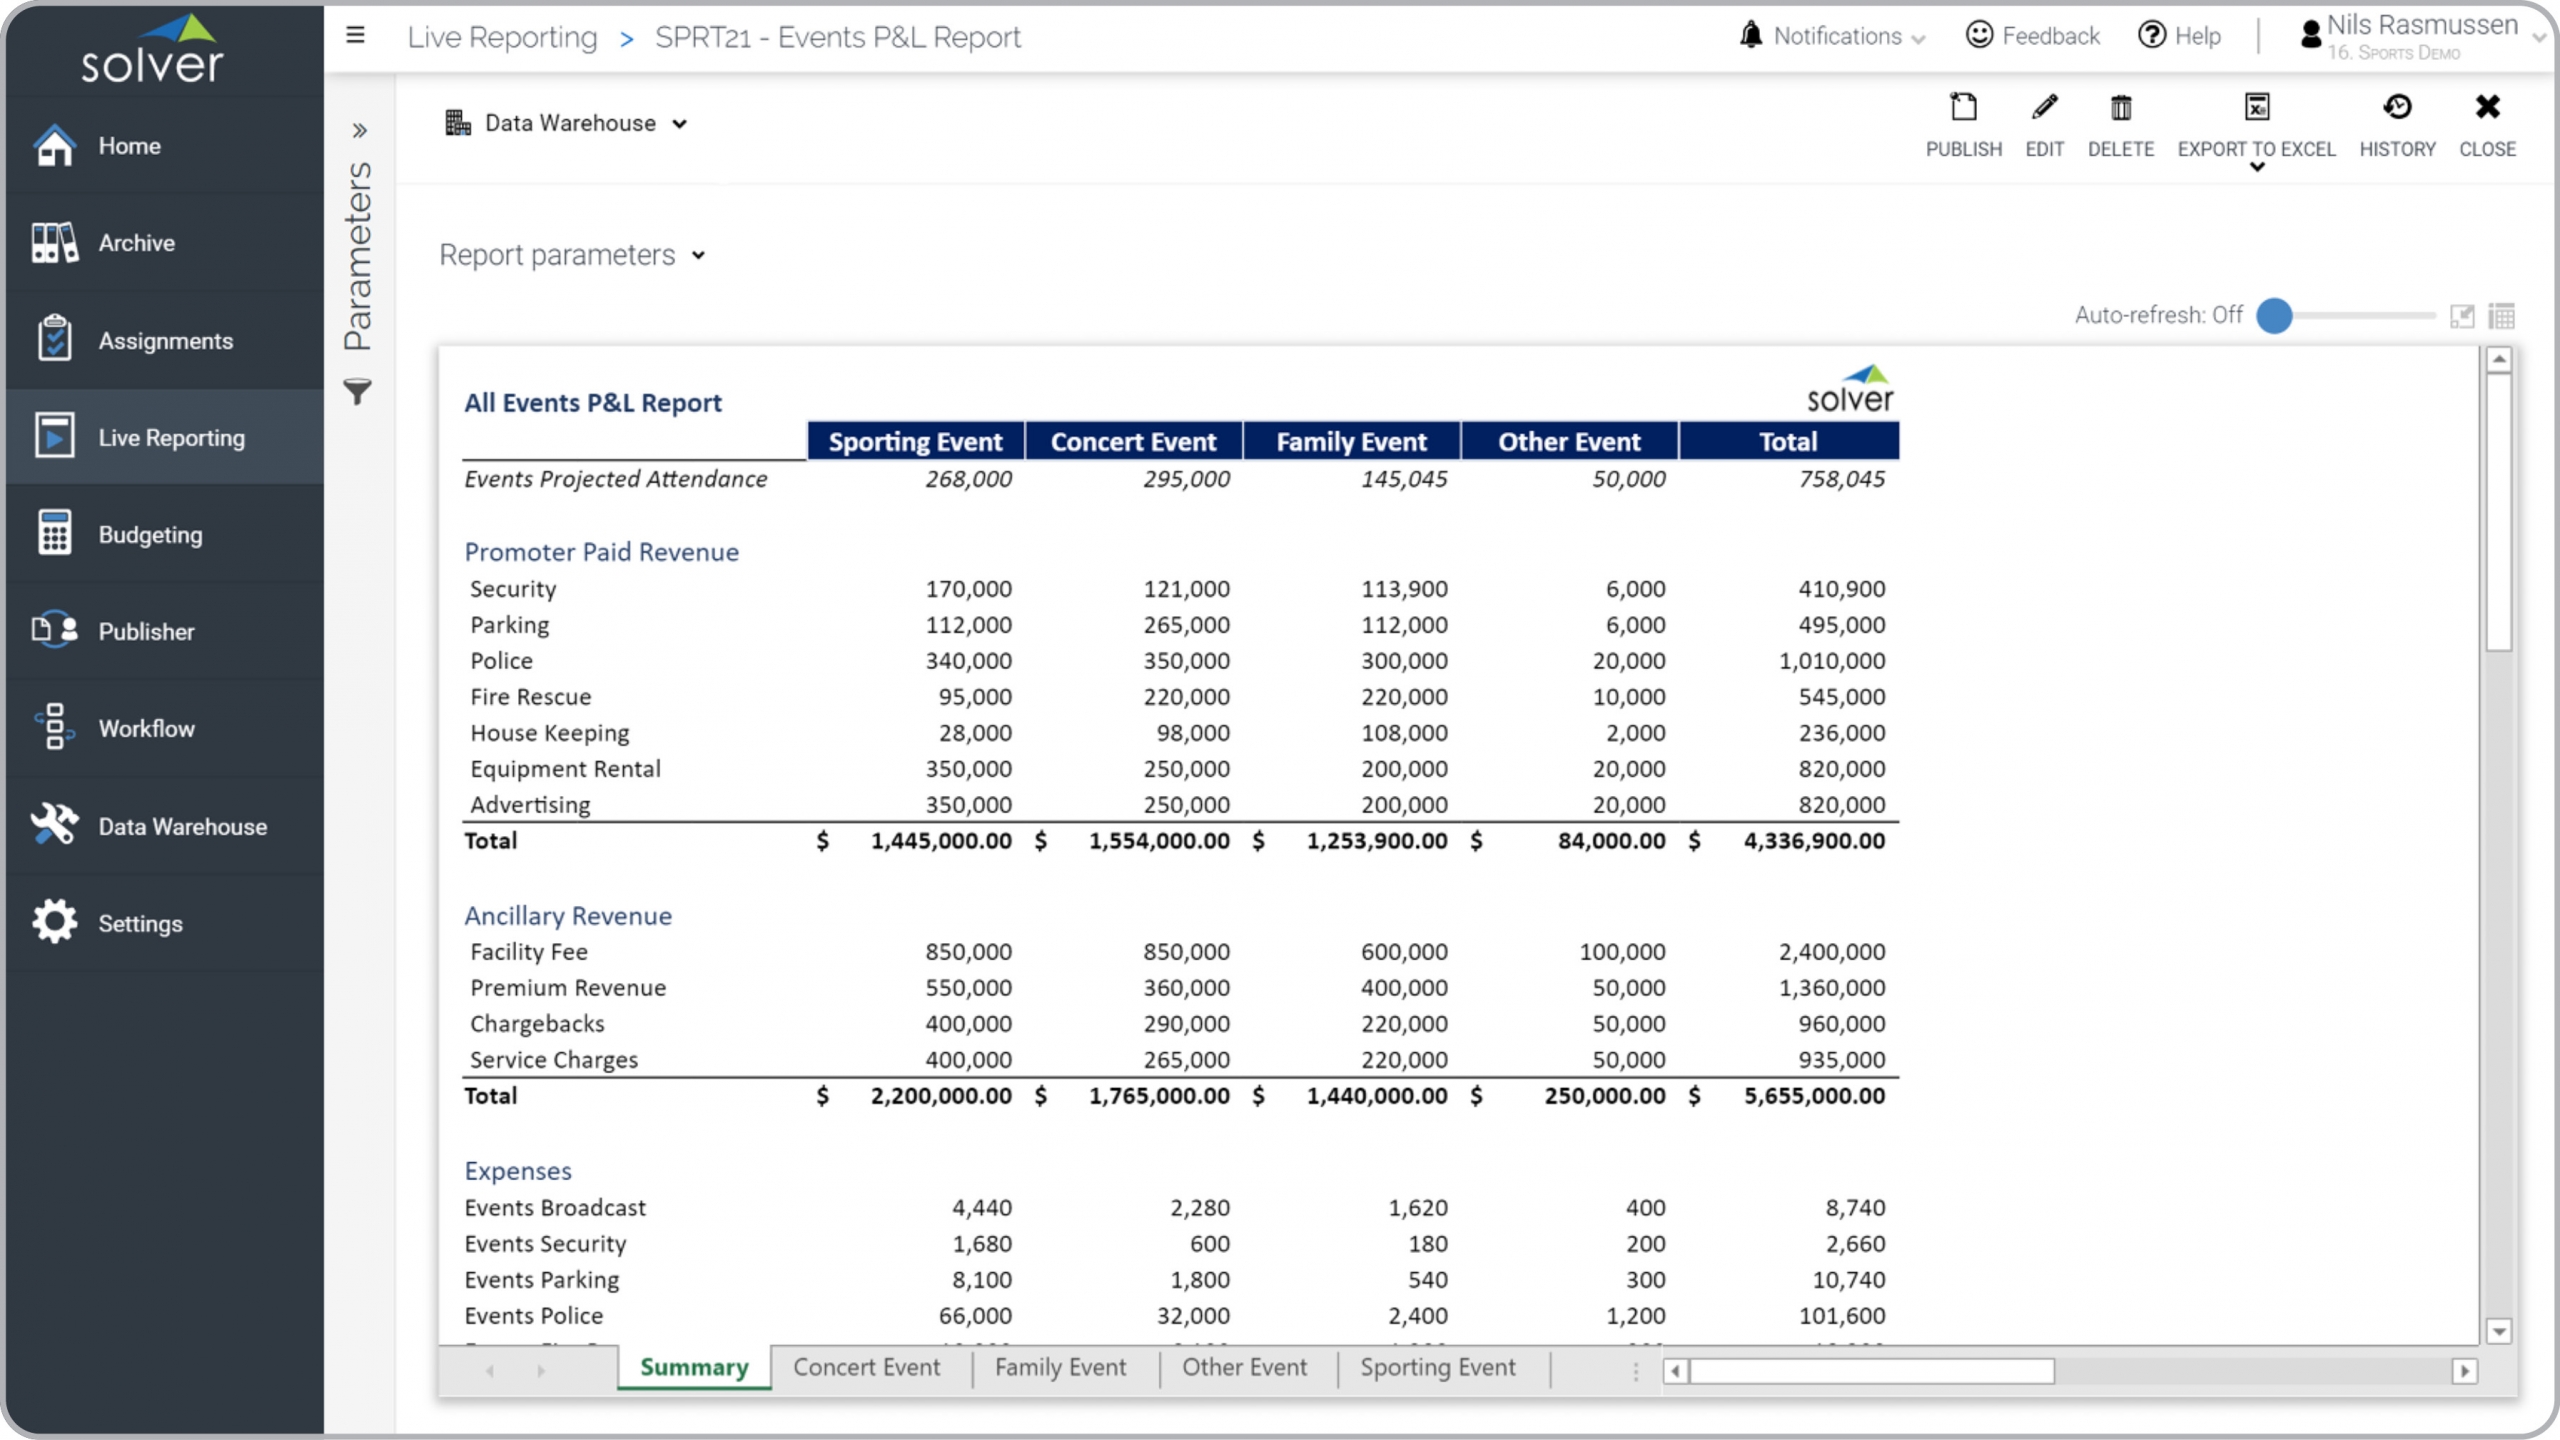
Sports – P&L by Event Type
This Profit & Loss report shows sports and other venue event types across the columns.
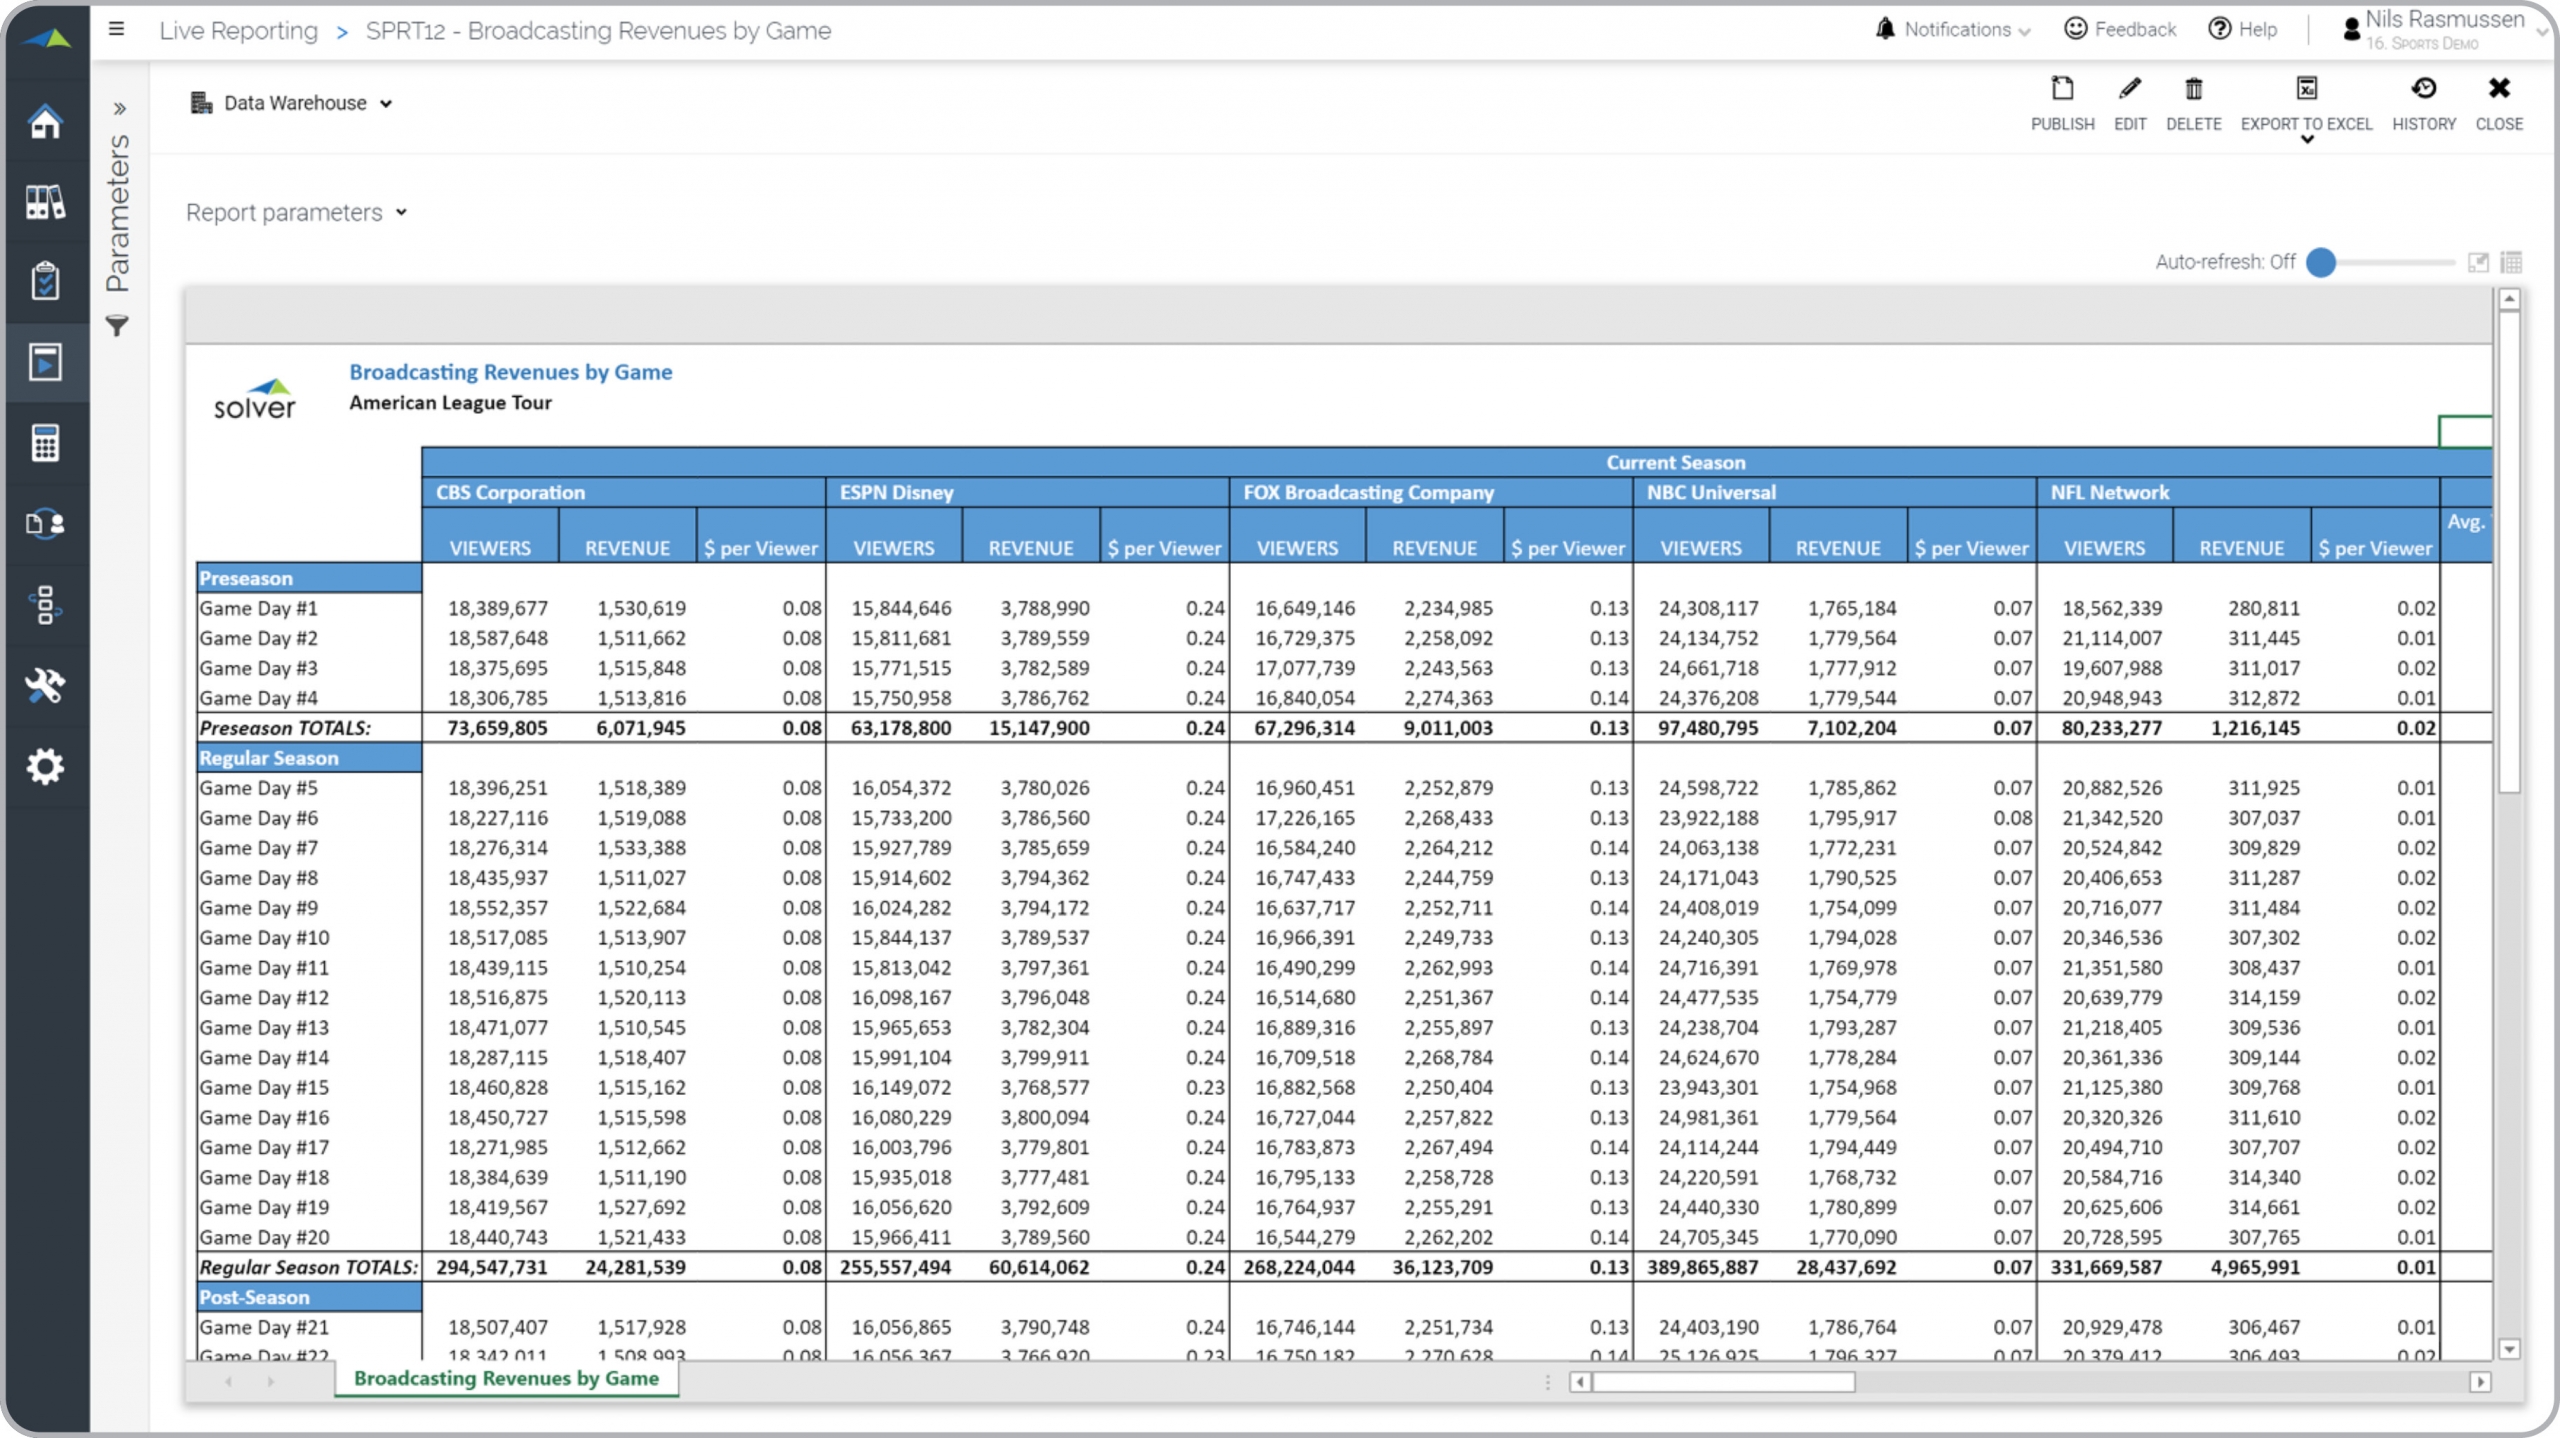
Sports – Broadcast Revenue Report
Report displays viewers, revenue and revenue per viewer by game and broadcaster.
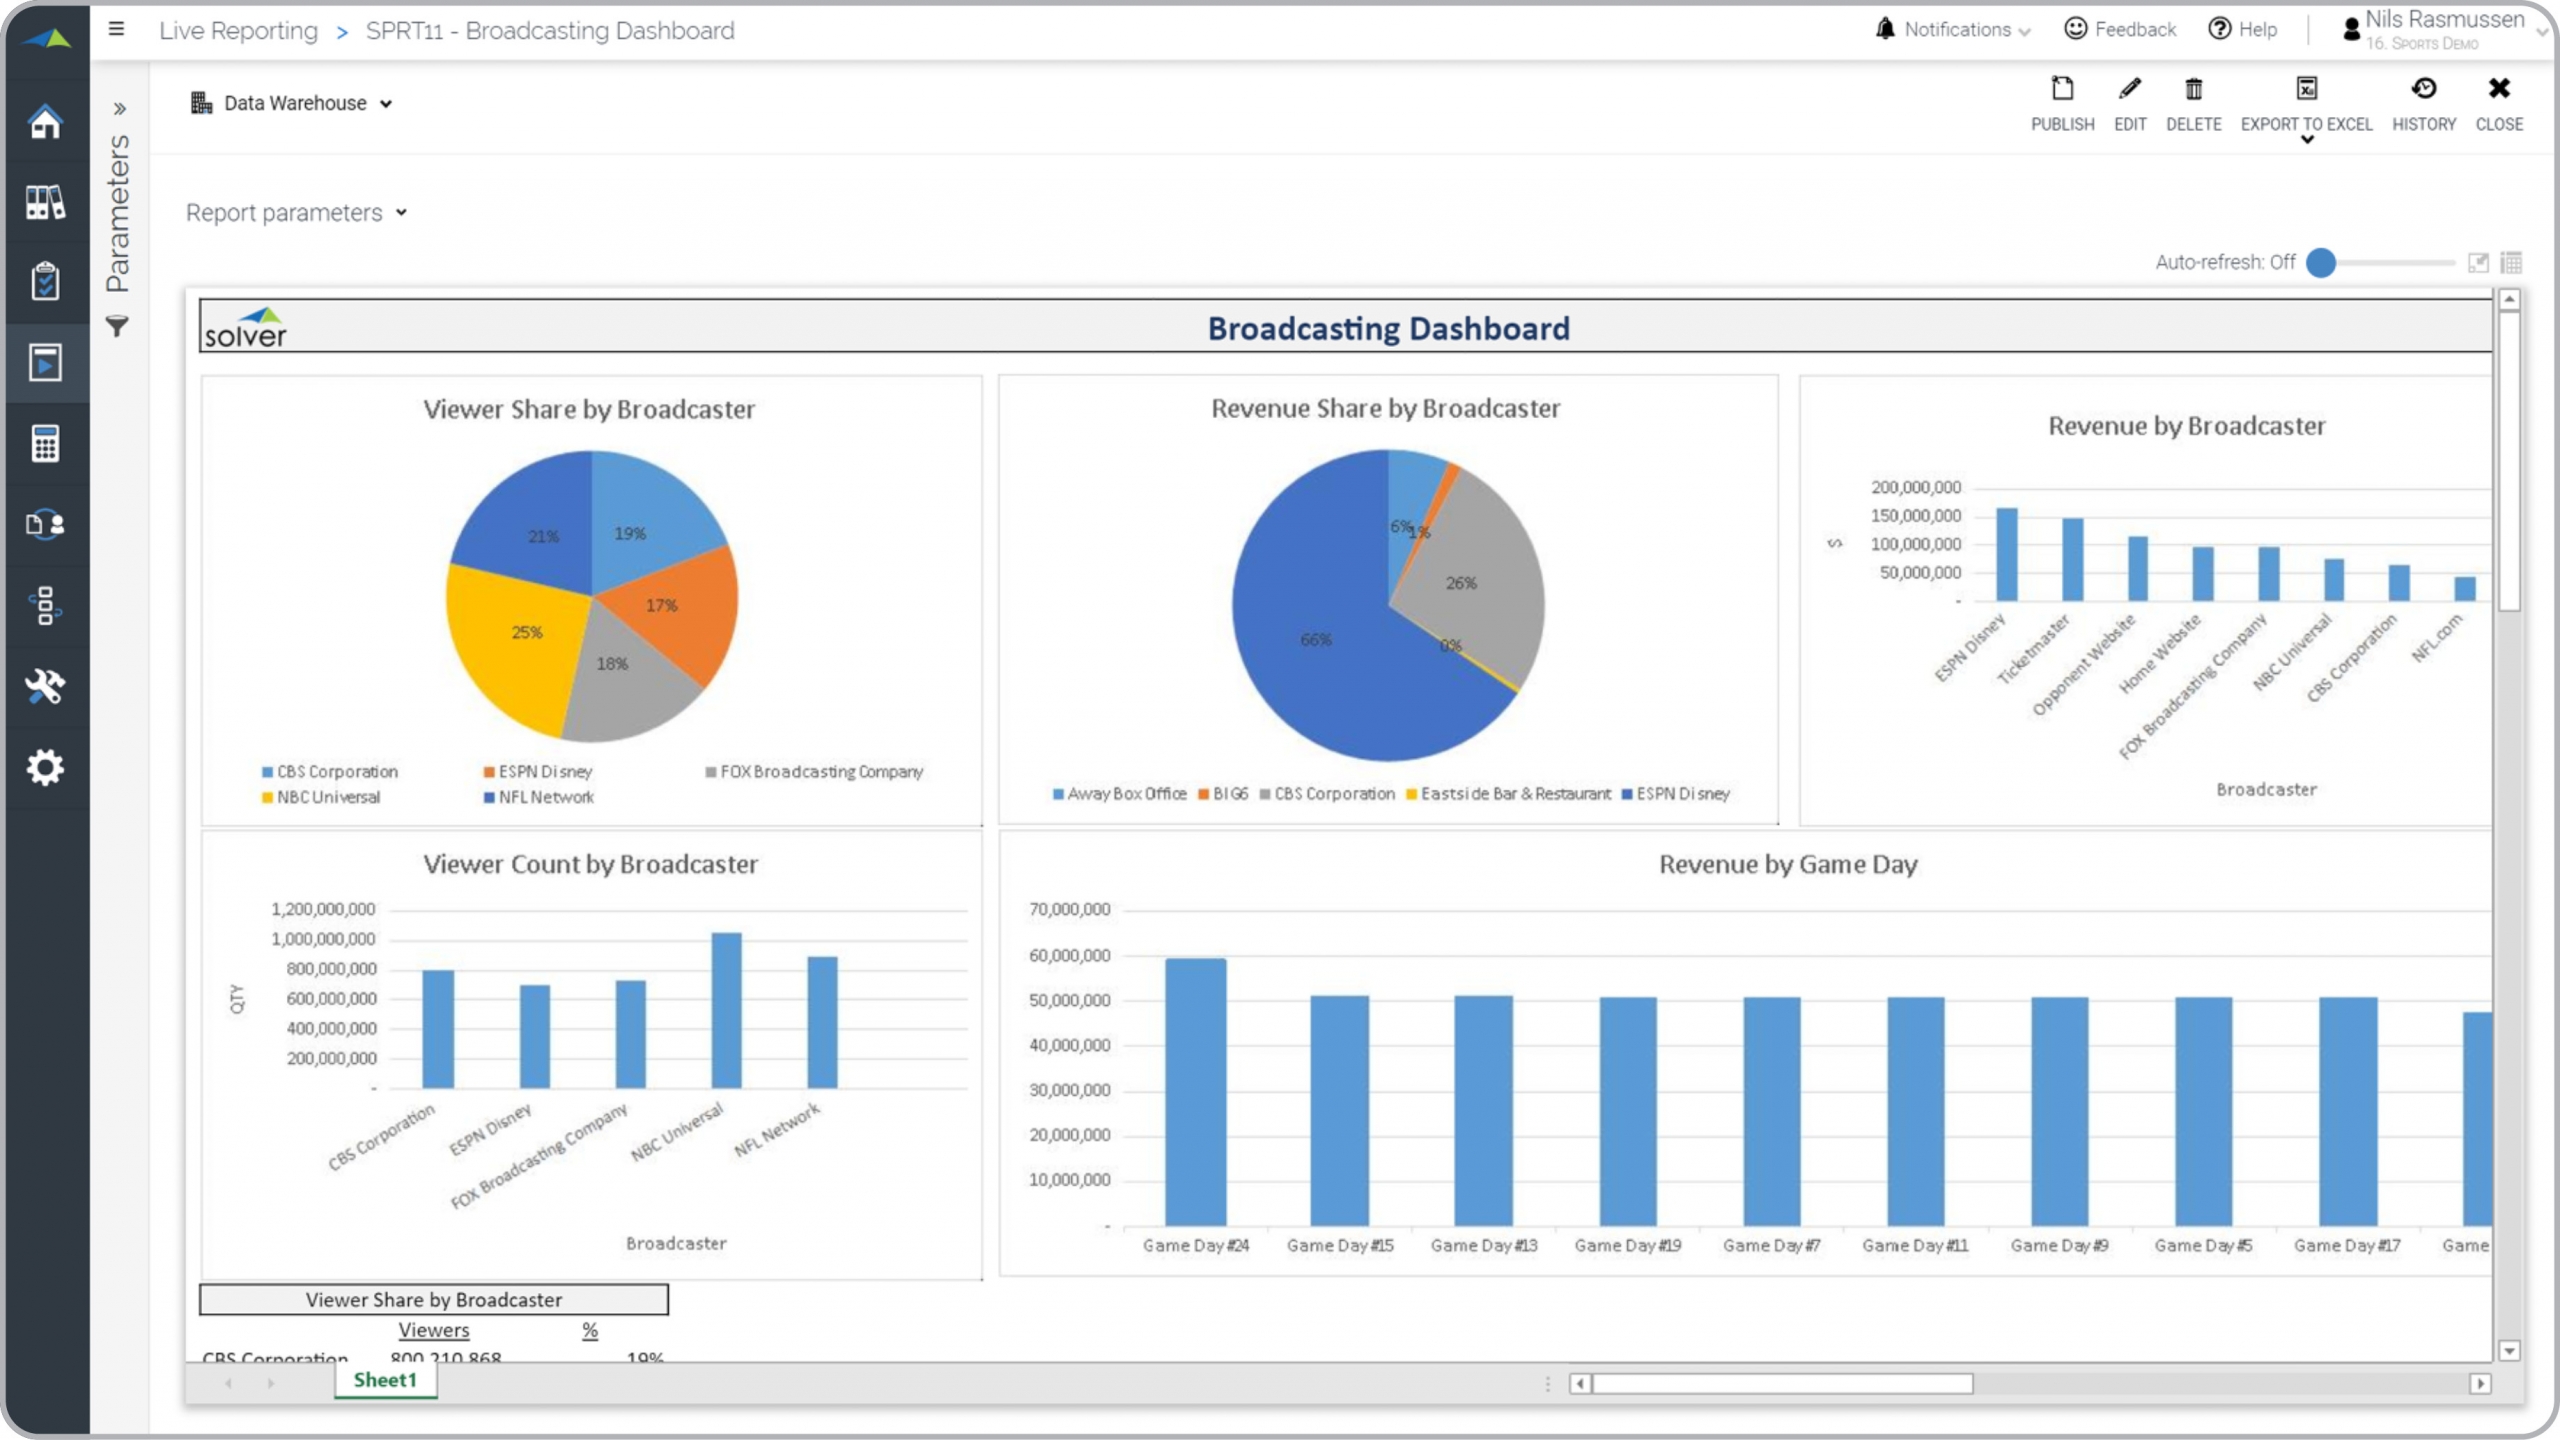
Sports – Broadcasting Dashboard
Analysis of revenue and viewers with dashboard showing detail per game and broadcaster.
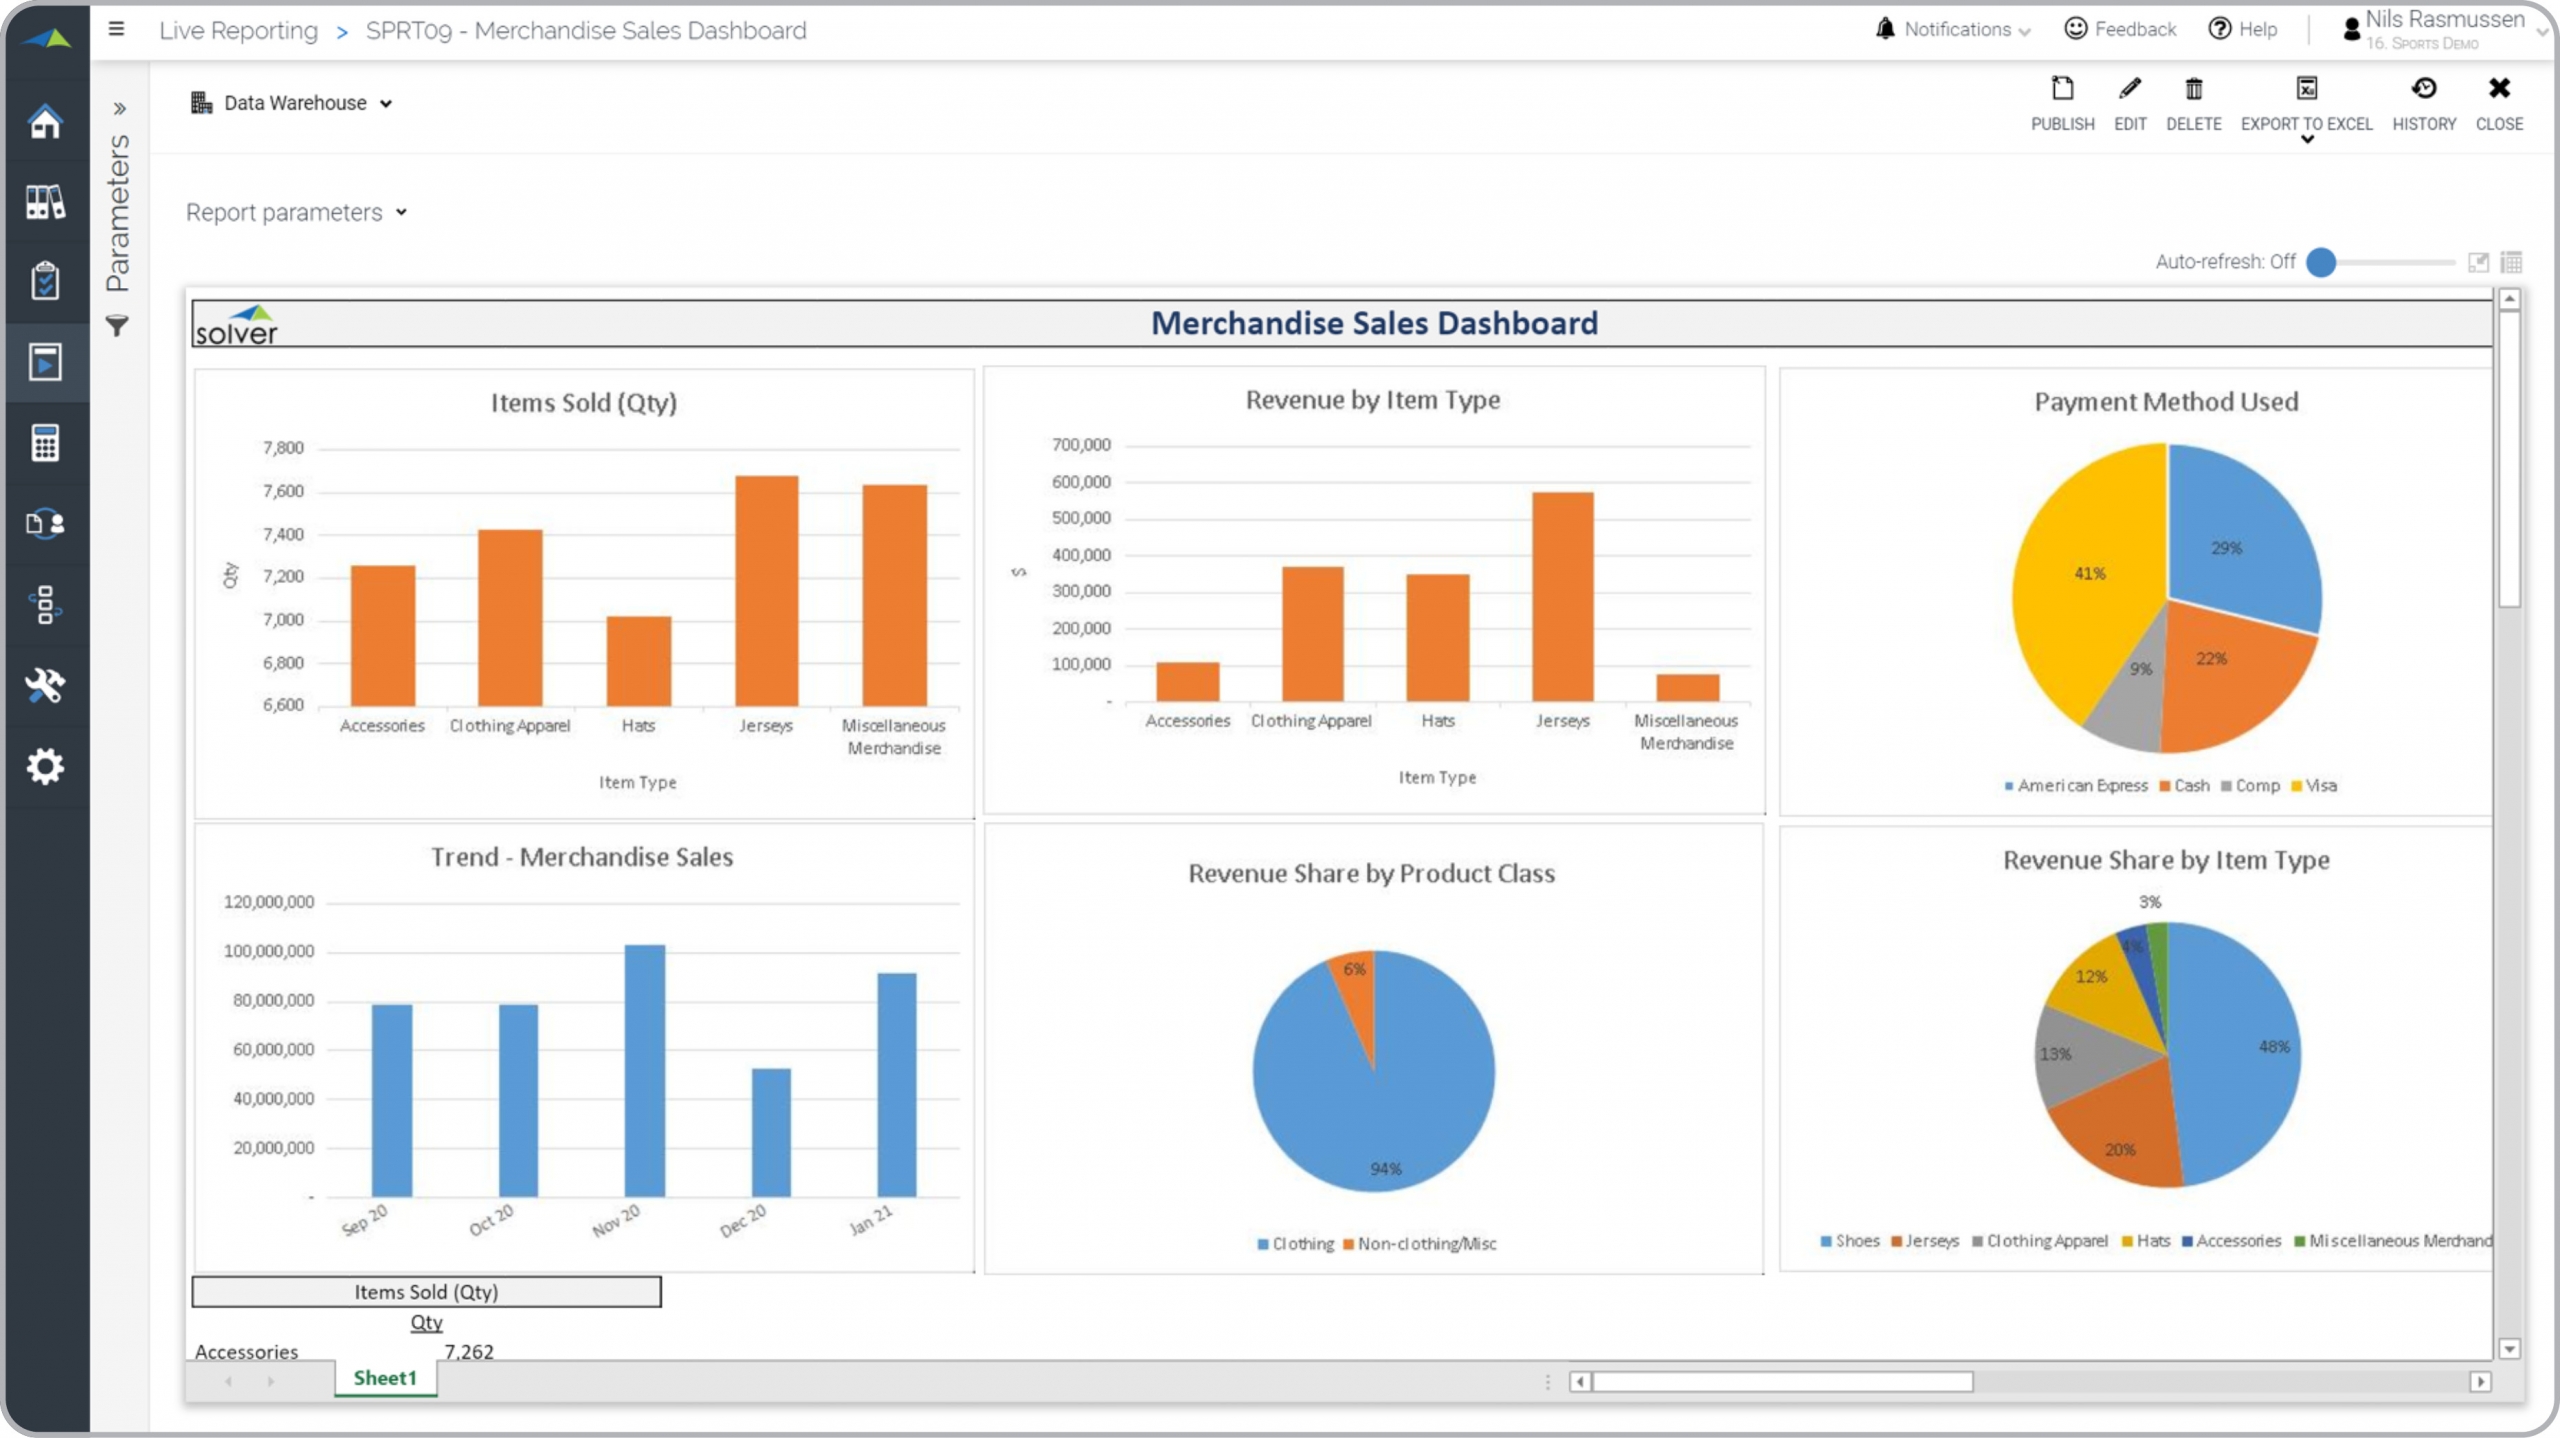
Sports – Merchandise Sales
The dashboard shows merchandise sales and quantity by item and type, with trend reporting.
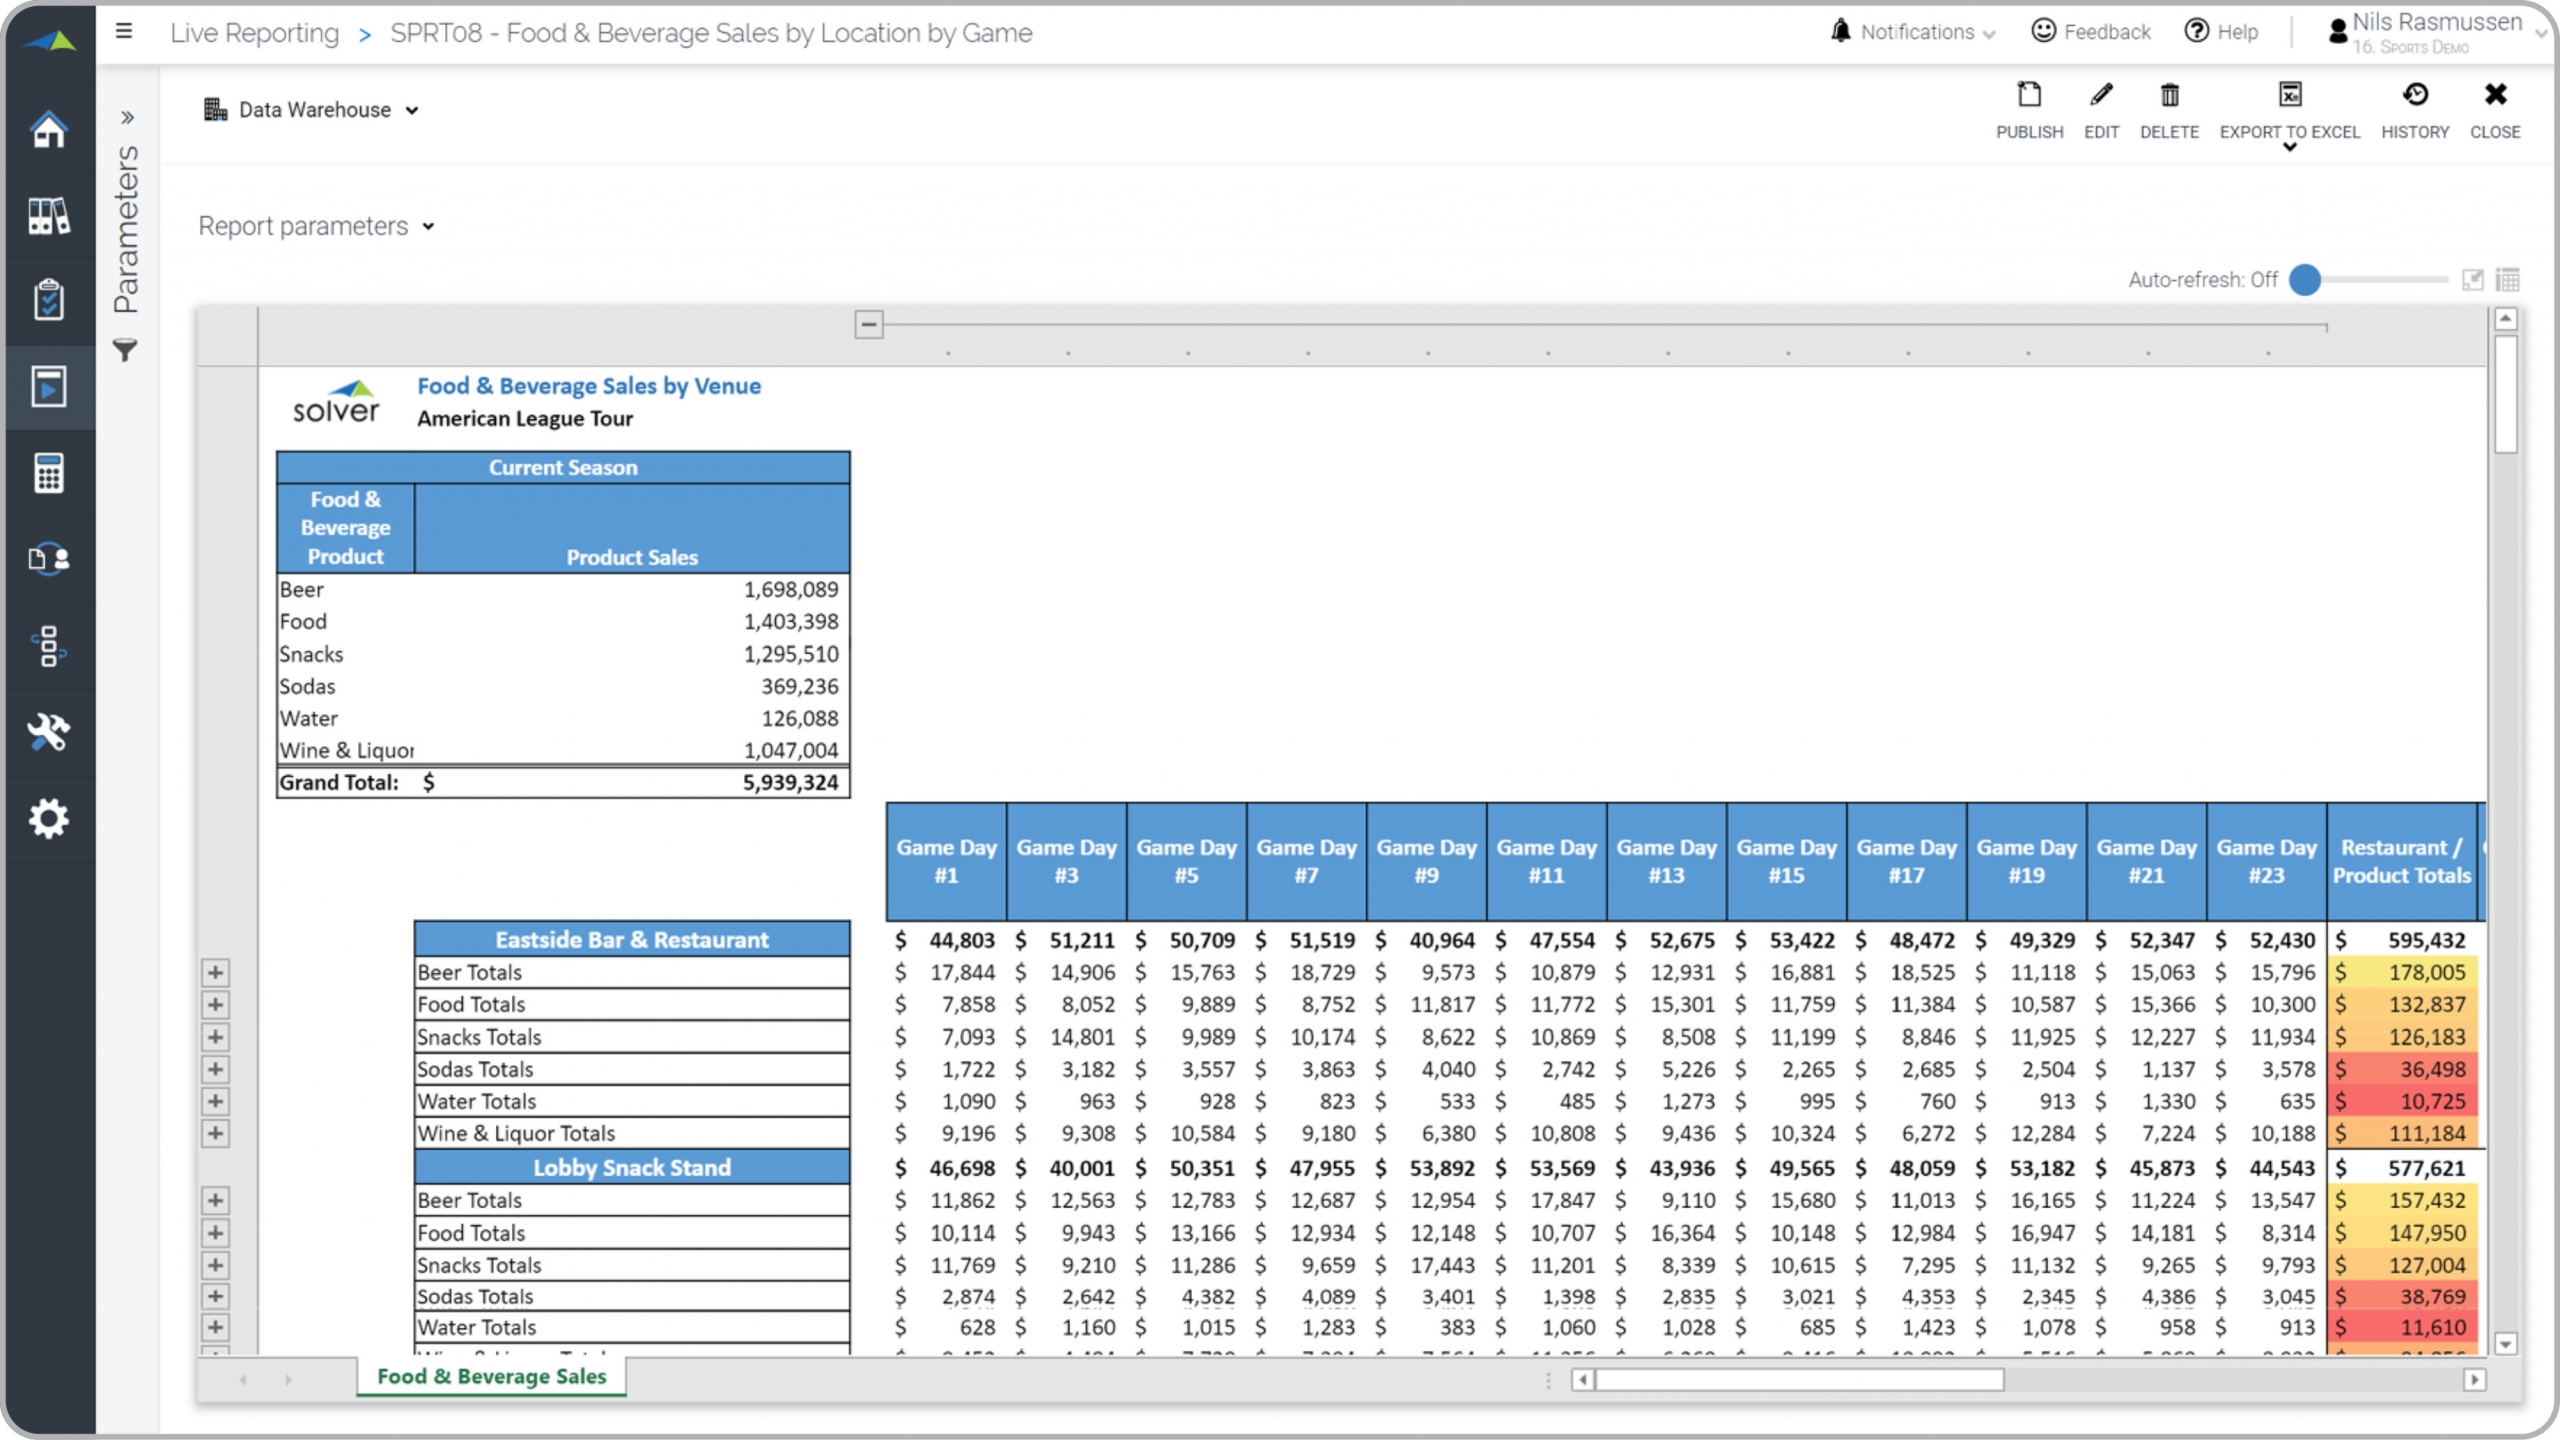
Sports – Food & Beverage by Venue
The report shows food and beverage sales by game by venue location in the sports arena.
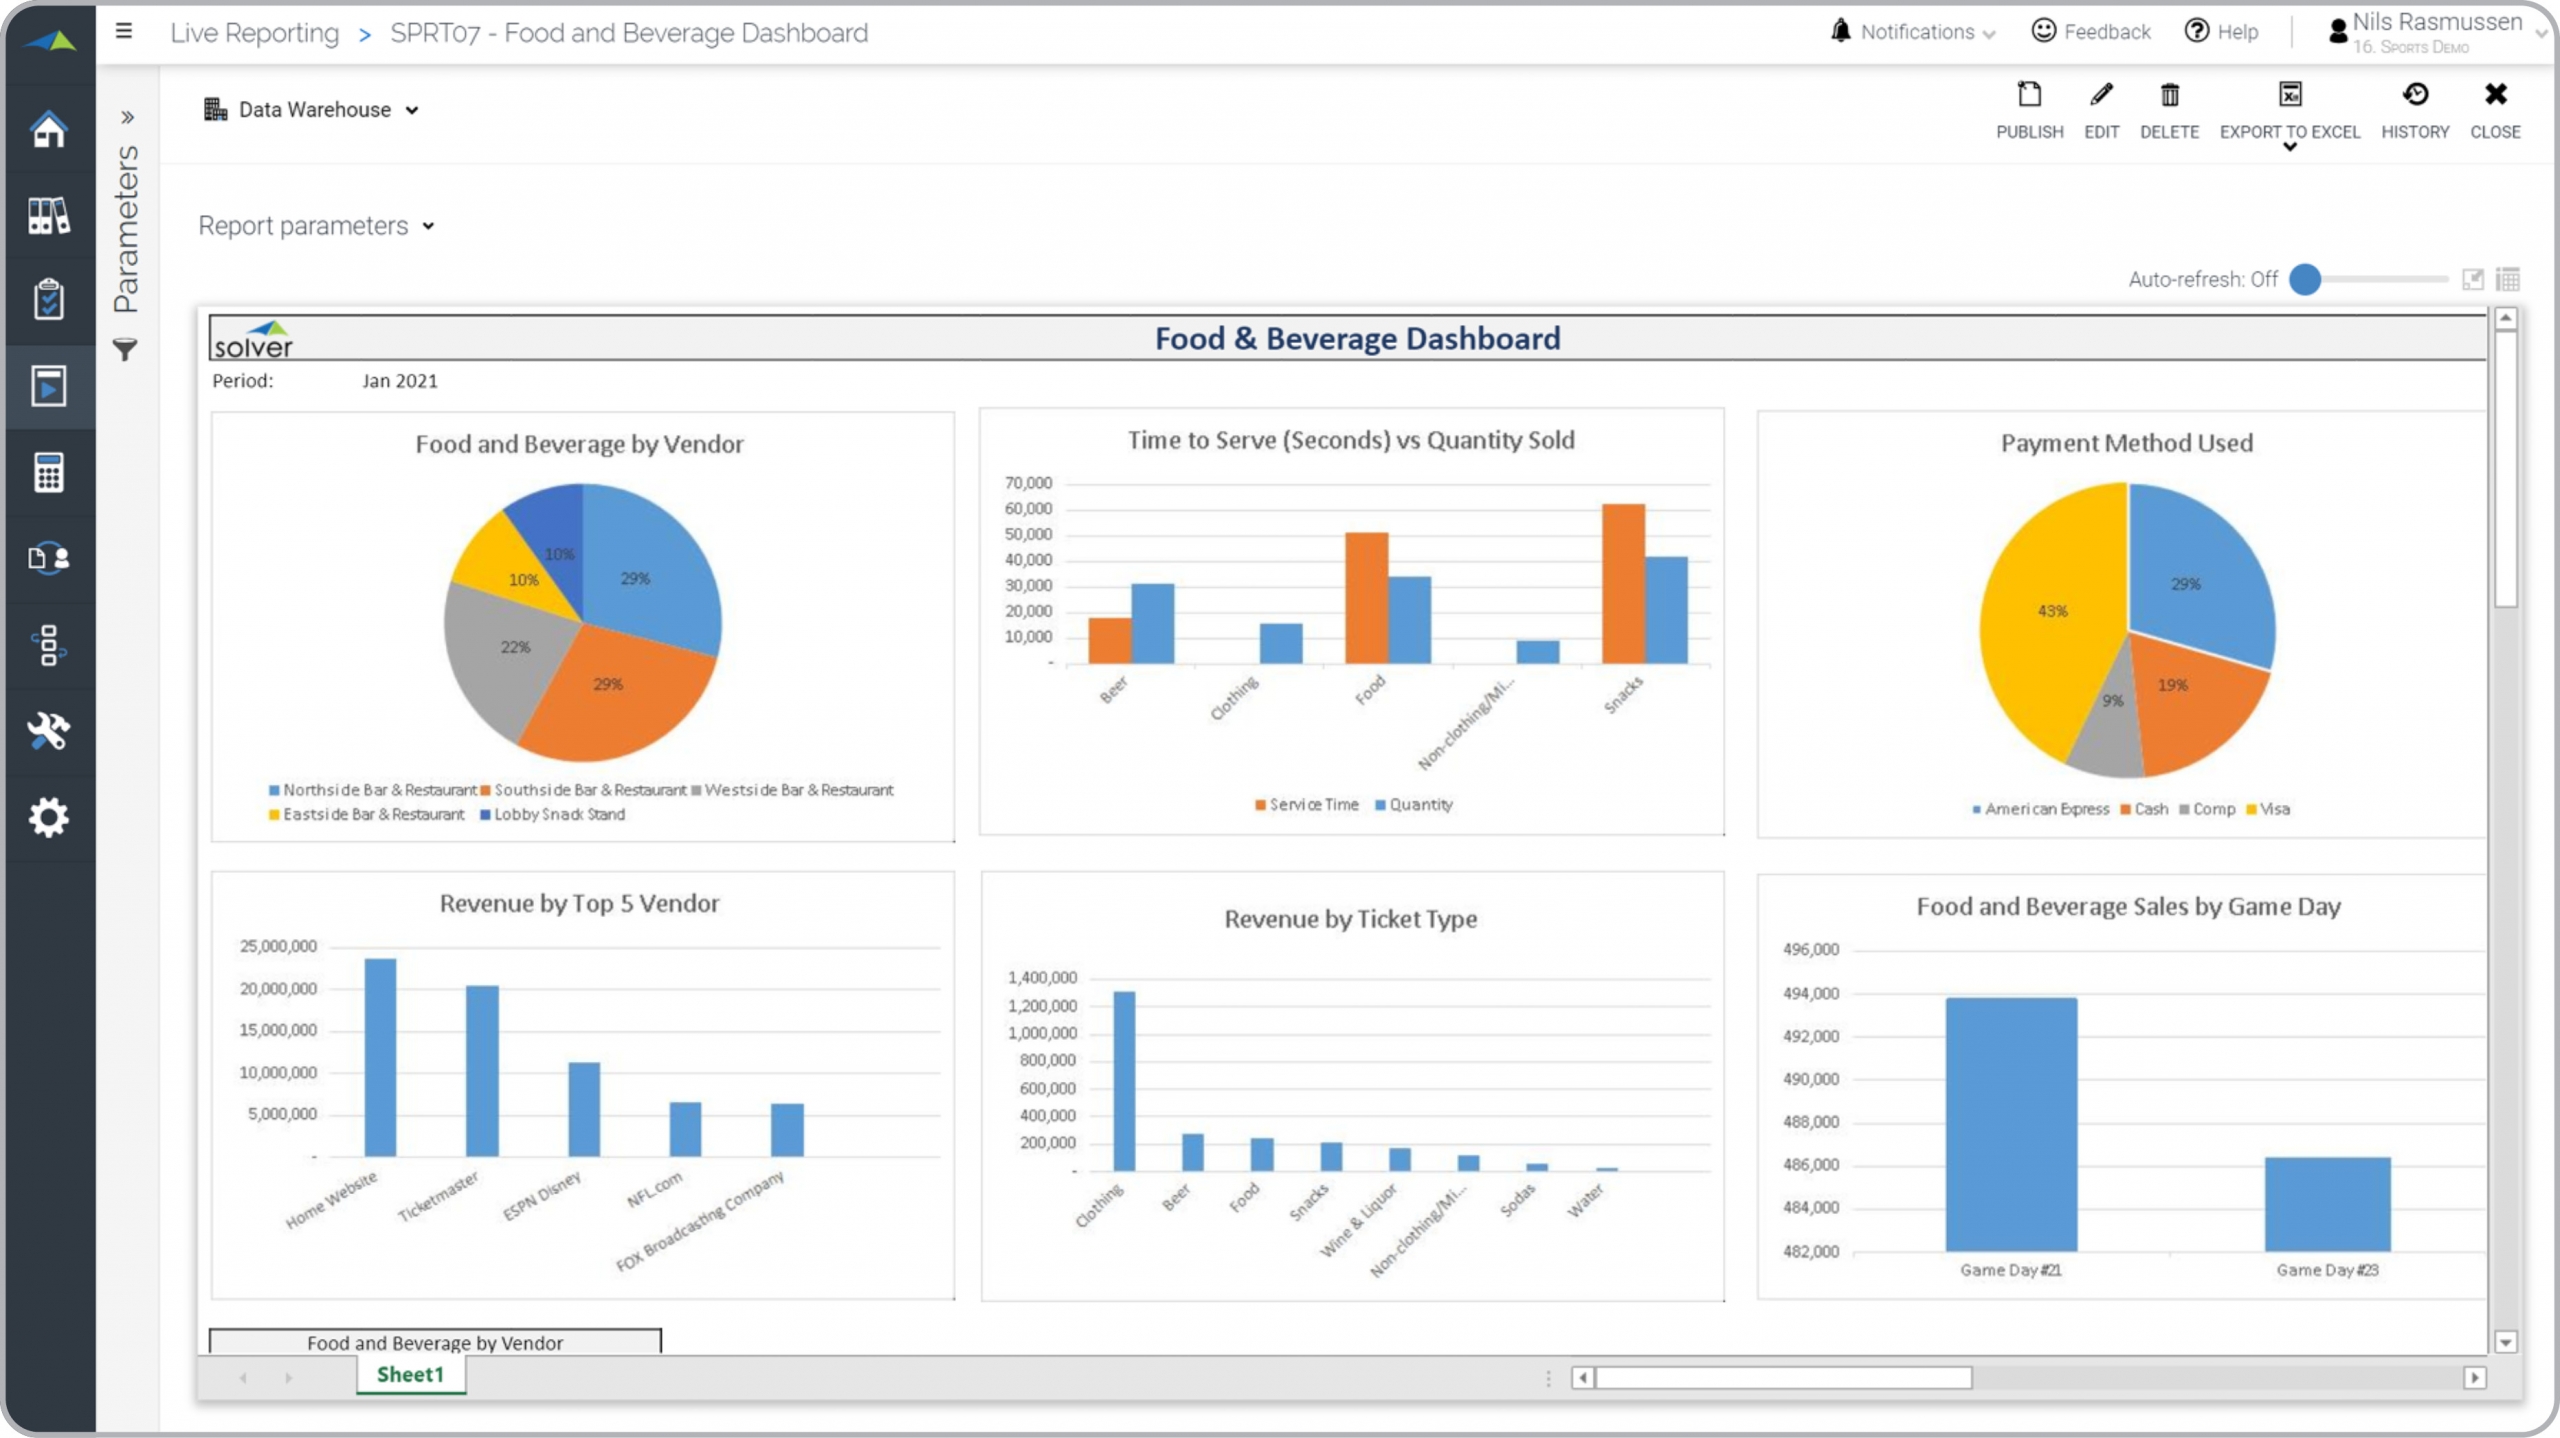
Sports – Food & Beverage Dashboard
Analysis of sales revenue by game day, vendor, ticket type and with time-to-serve metric.
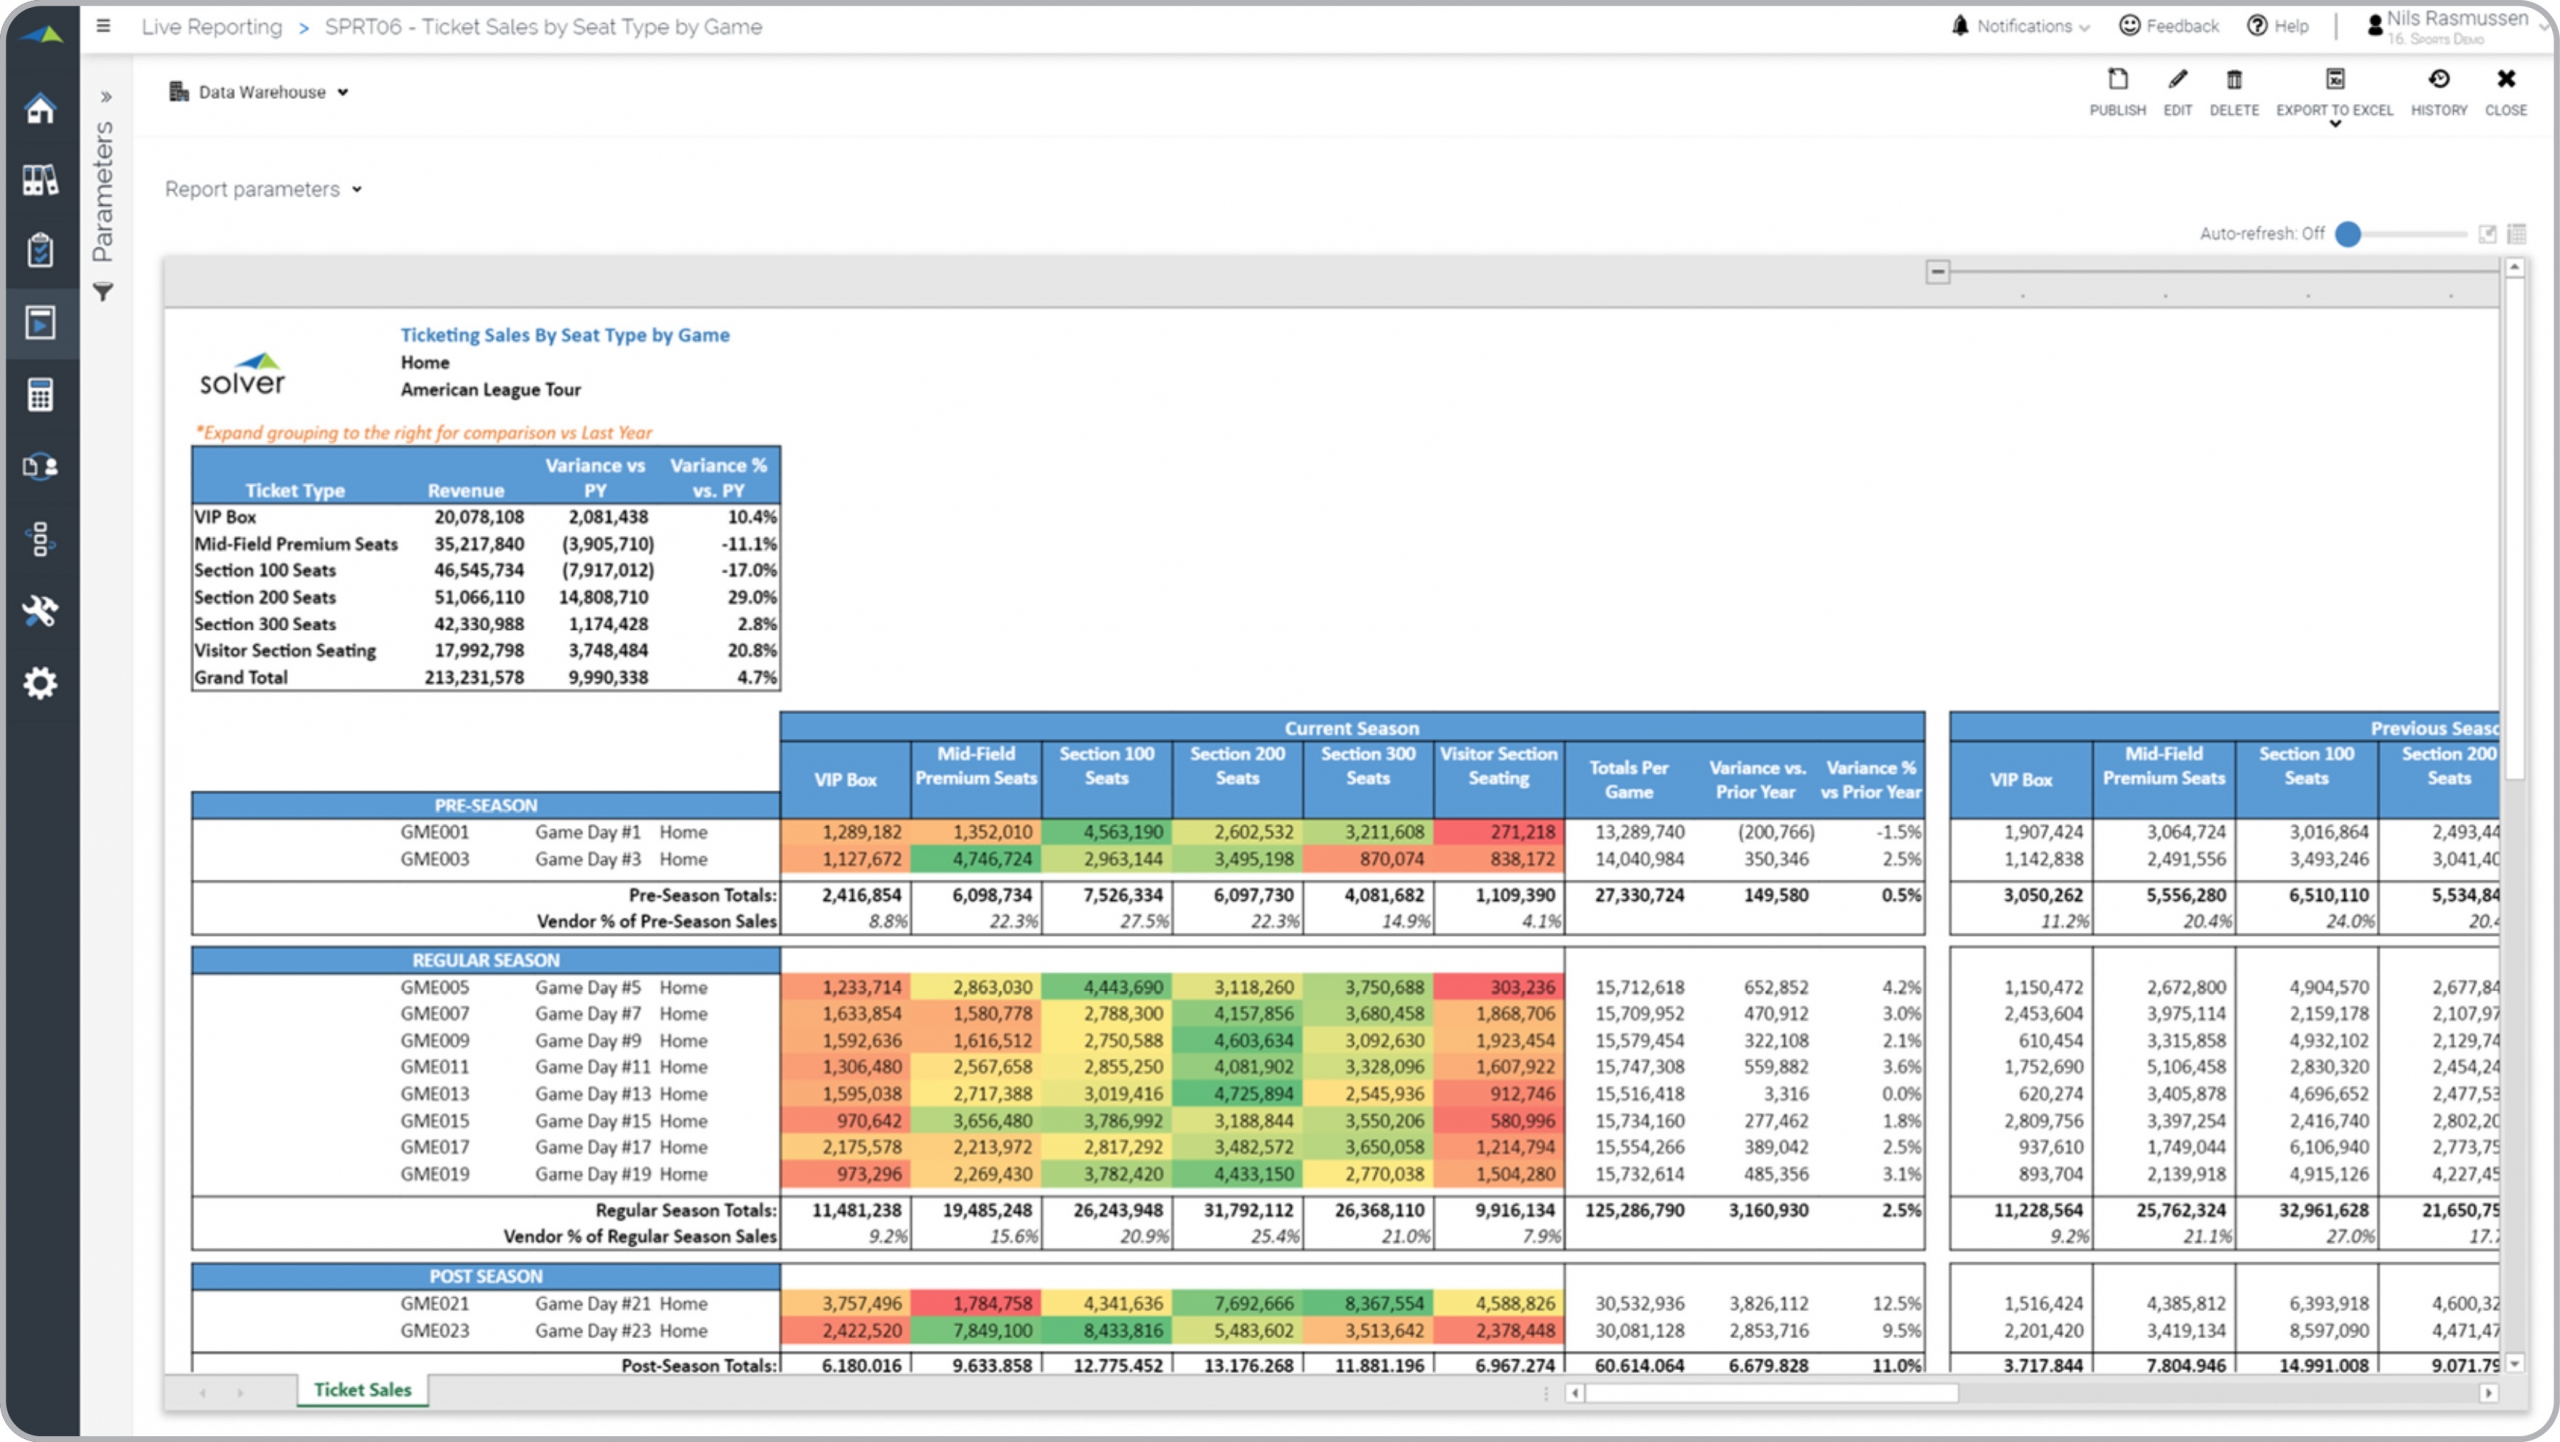
Sports – Ticket Sales by Seat Type
Shows report example with ticket sales by seat type by game with variance versus prior year.
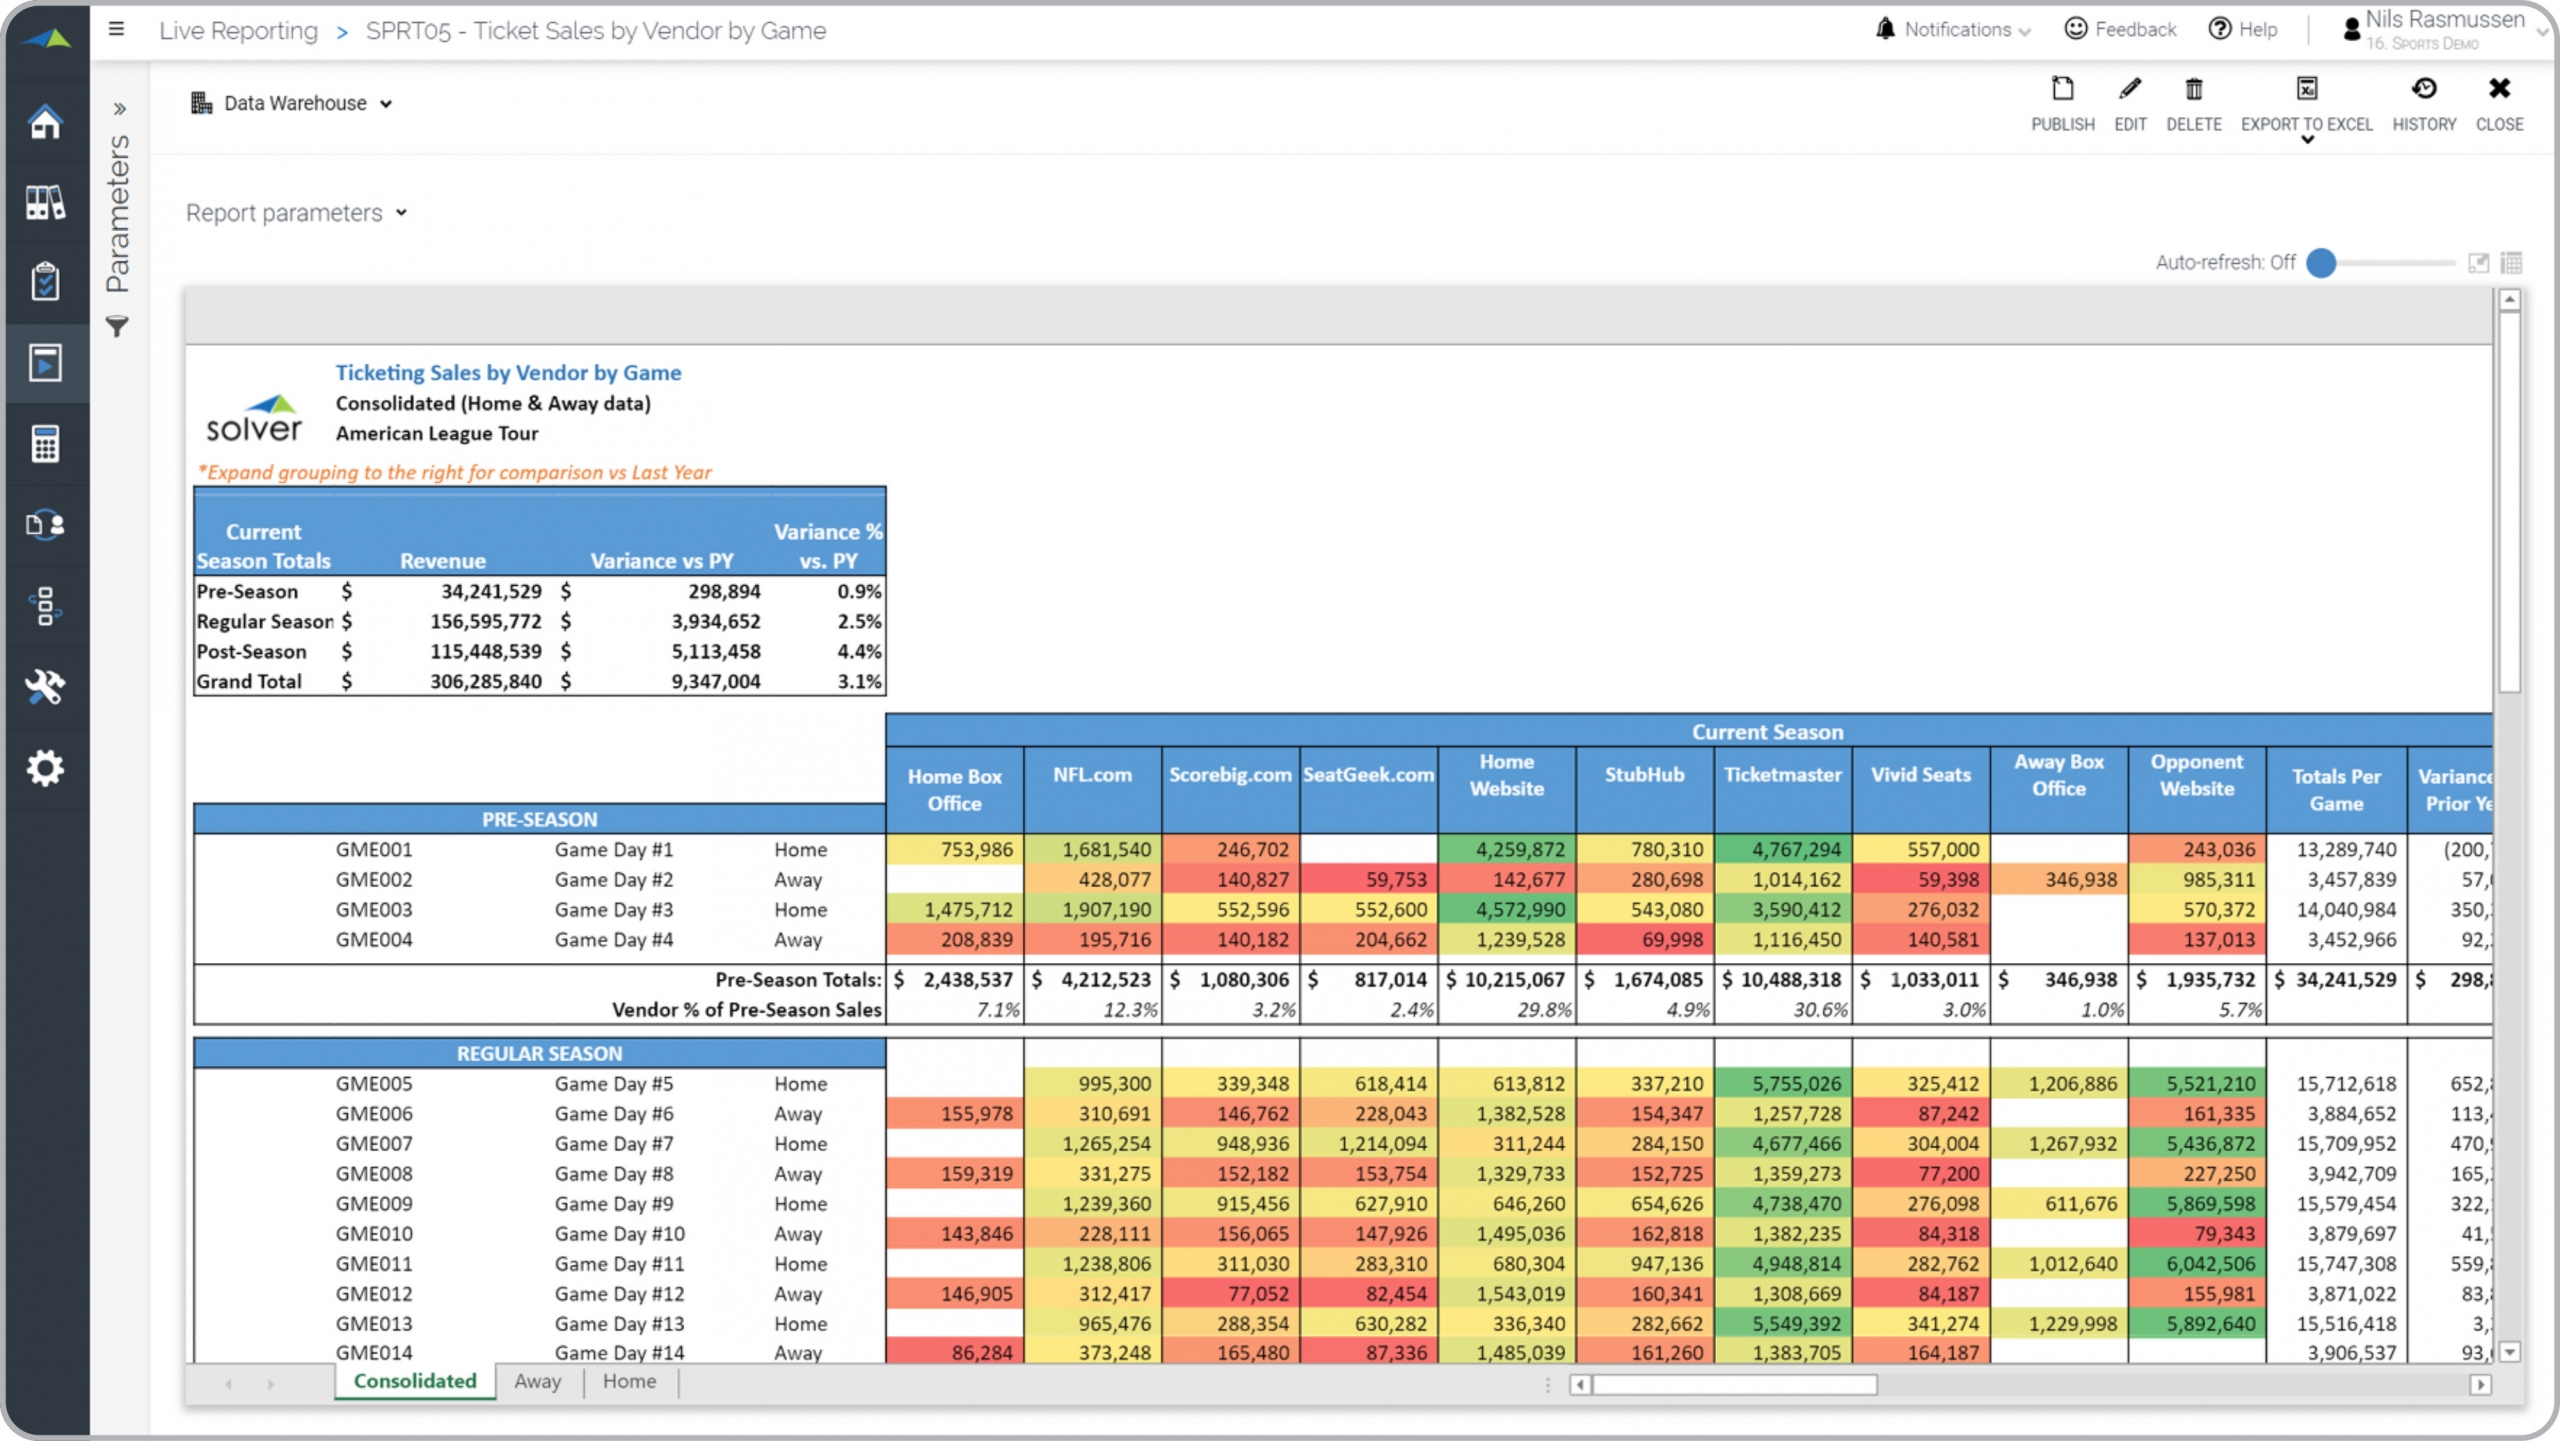
Sports – Ticket Sales by Vendor
This report provides ticket sales figures by season, game, vendor and more.
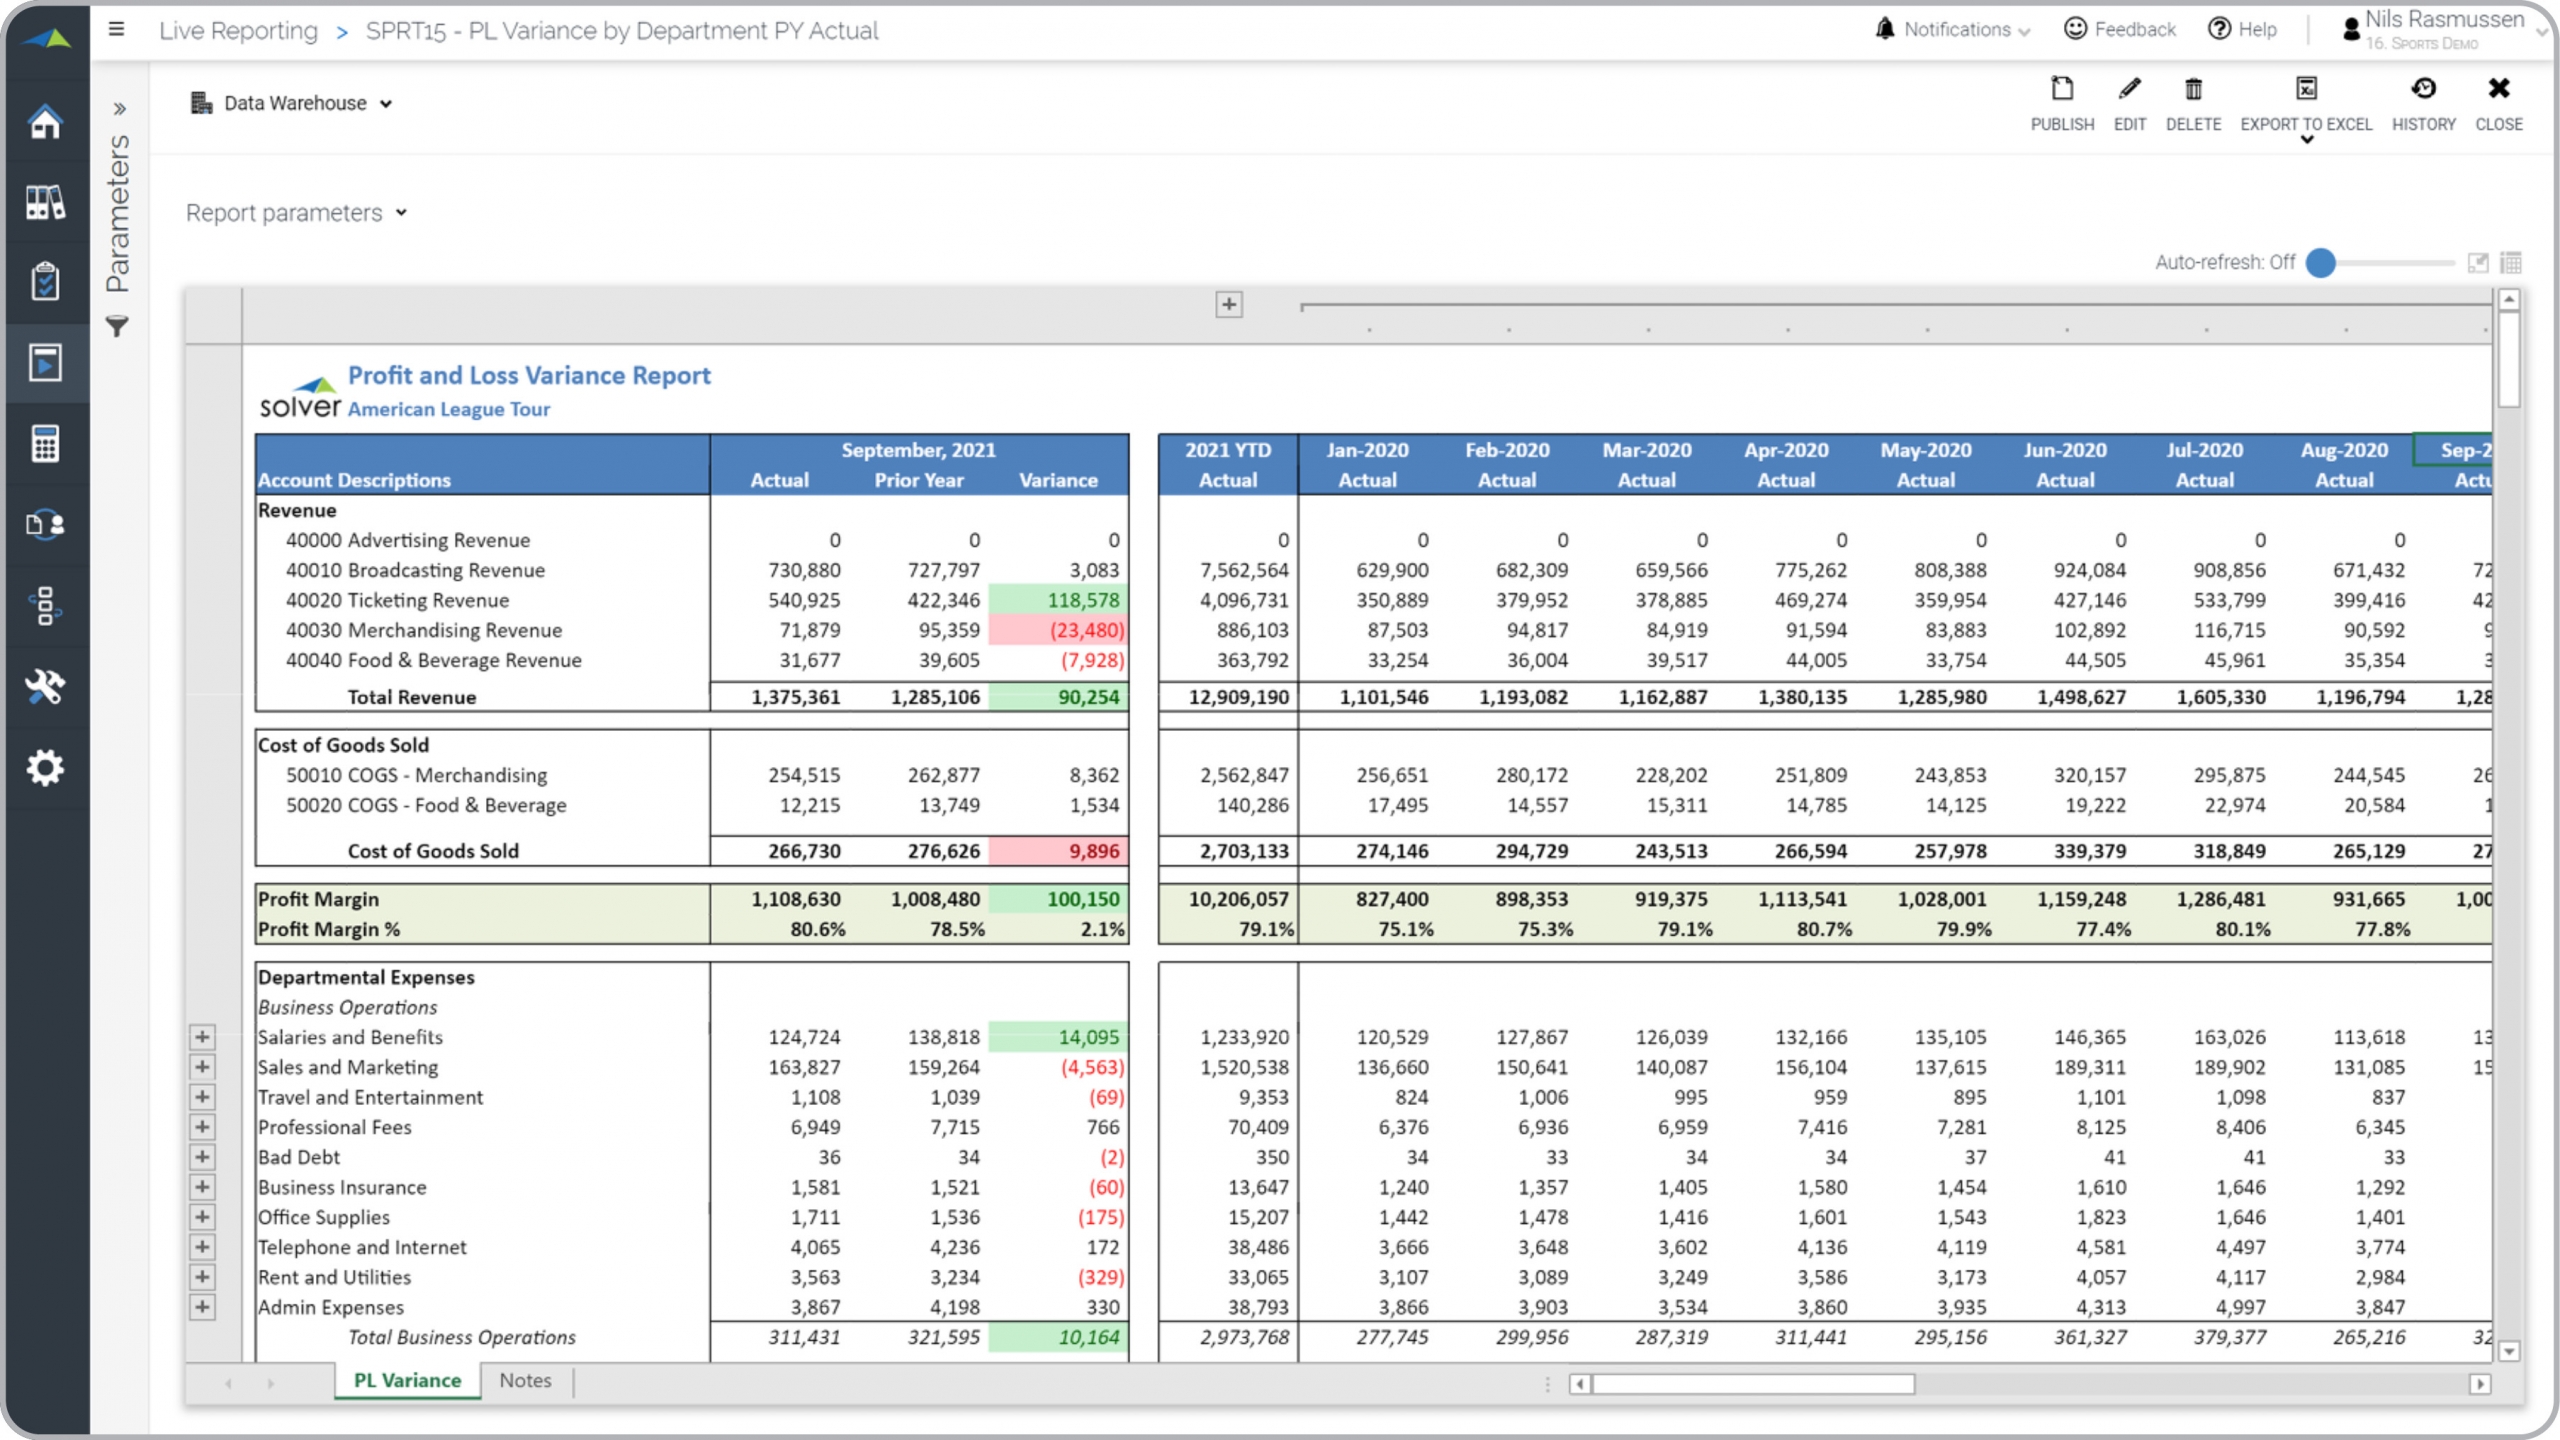
Sports – P&L with Variance Analysis
A detailed Profit & Loss report with comparison to last year with monthly and YTD columns.
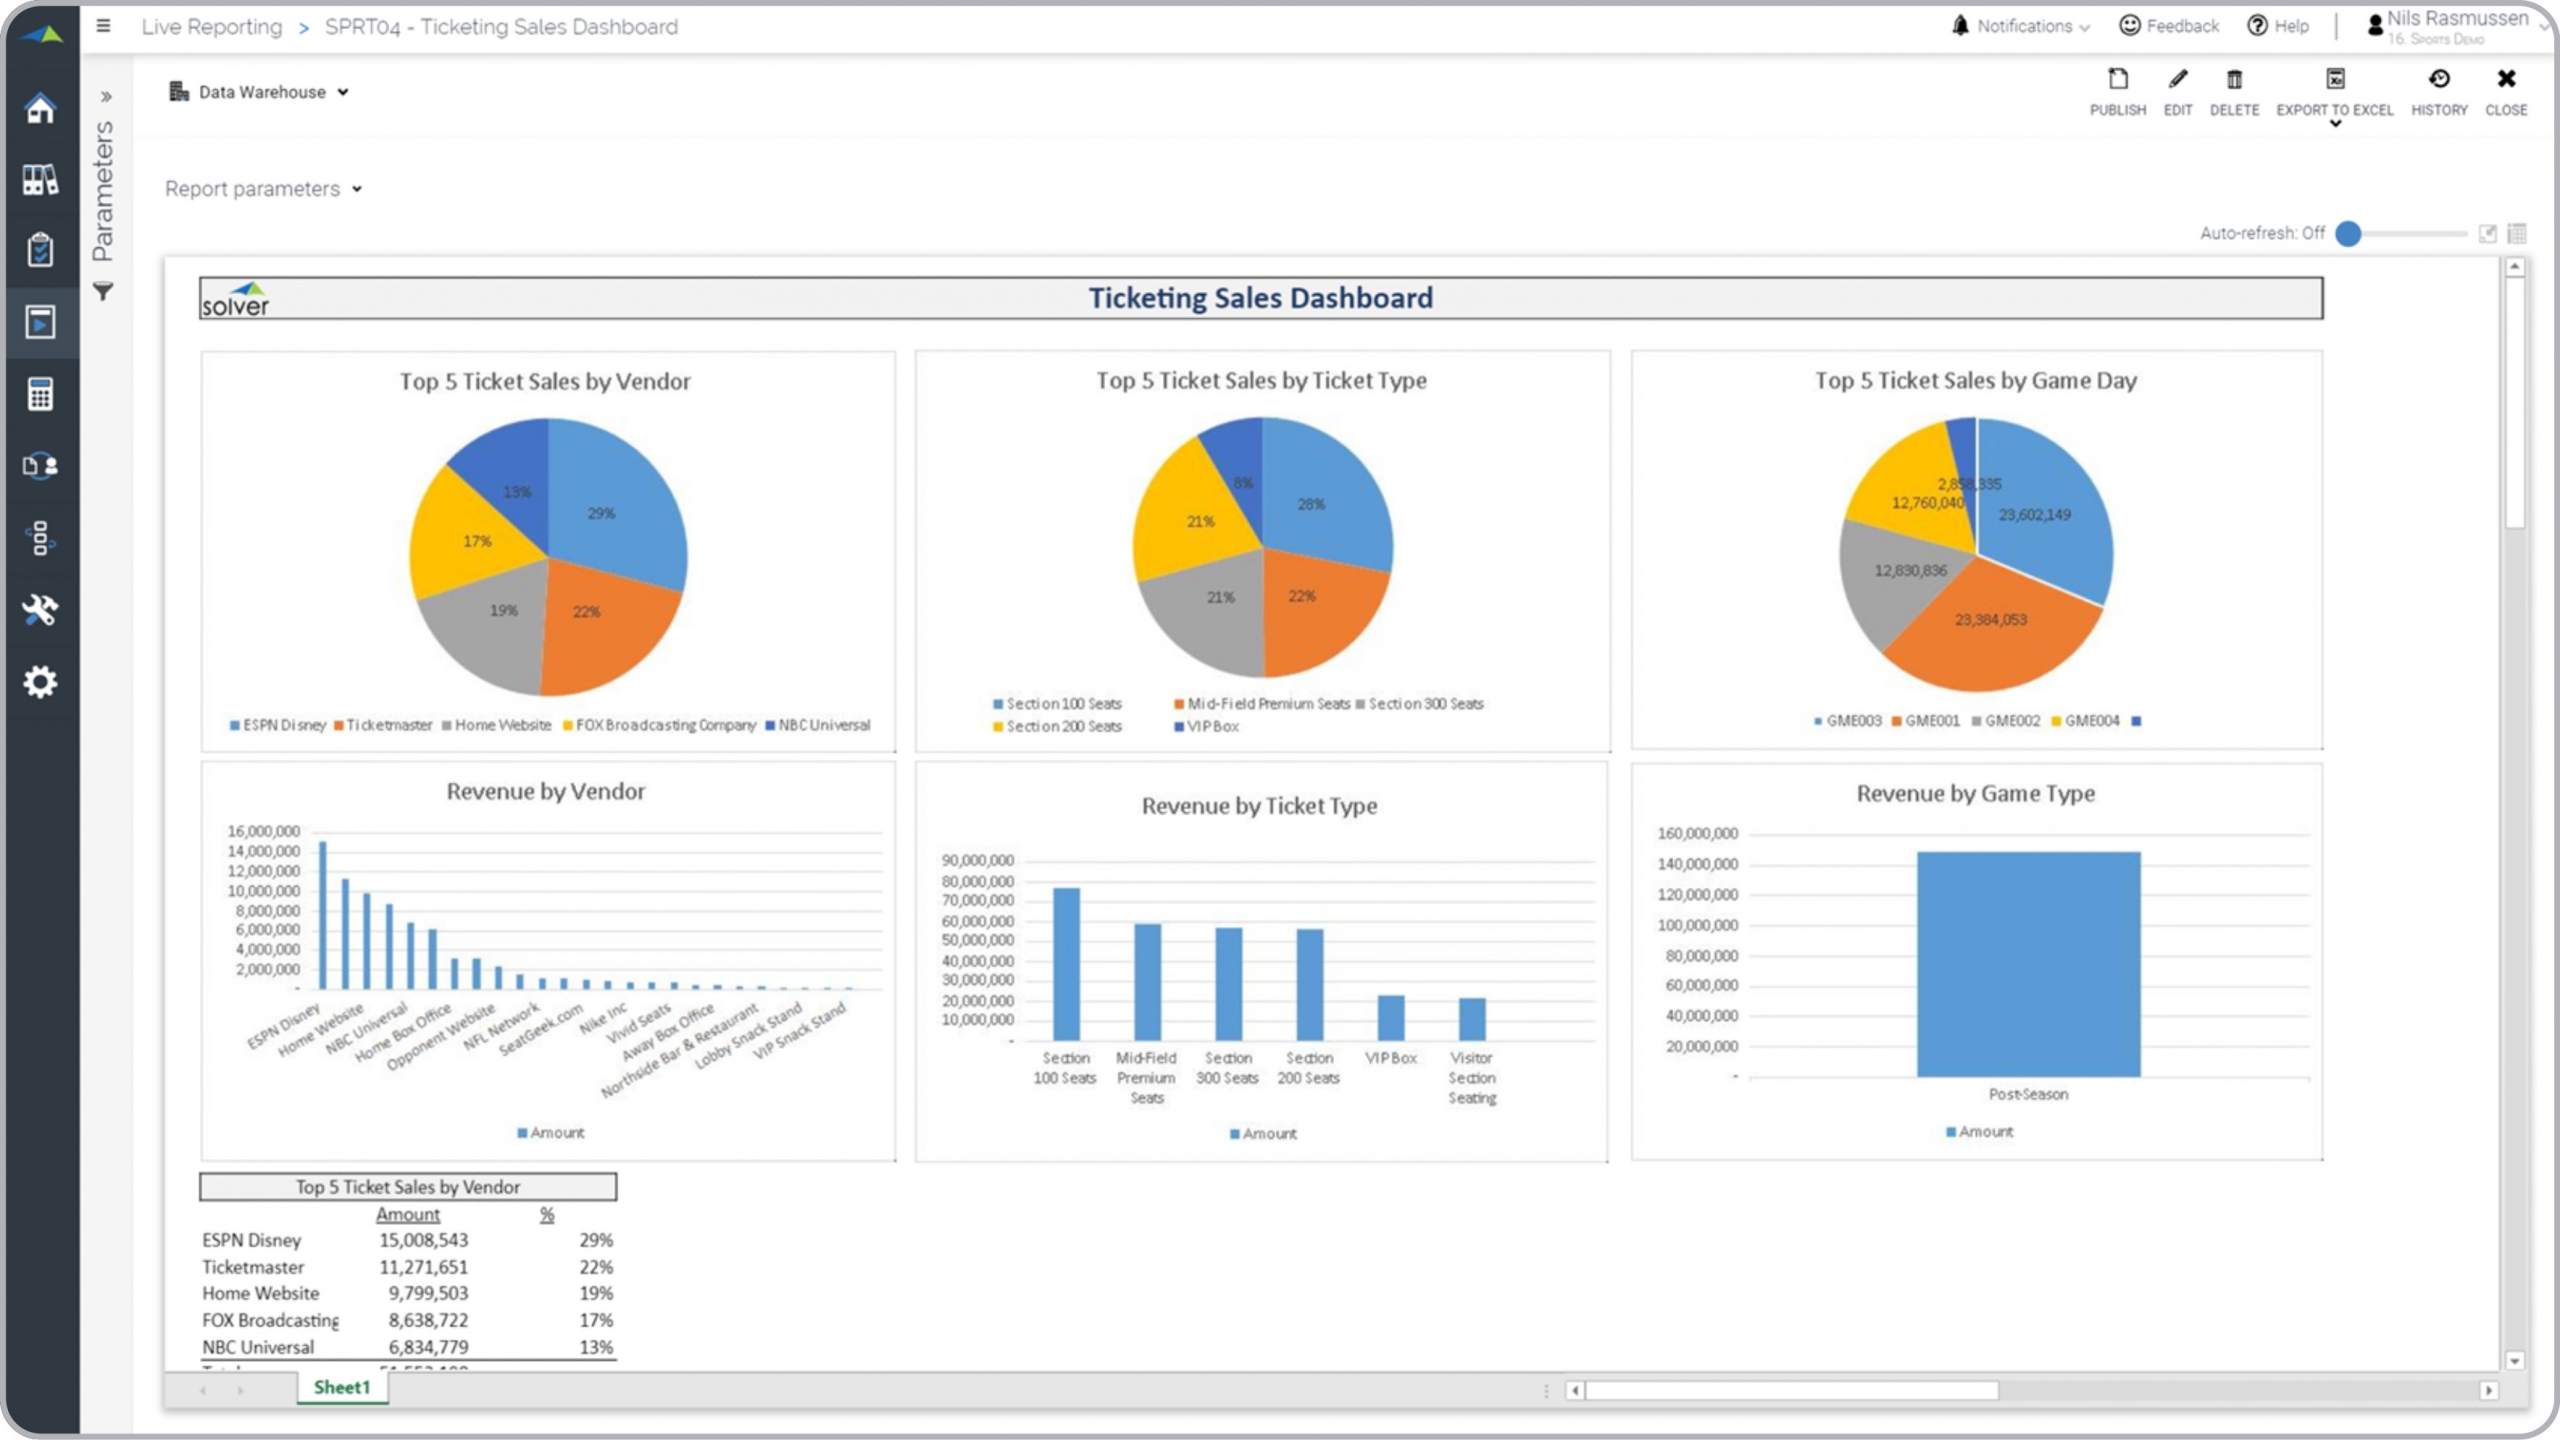
Sports – Ticket Sales Dashboard
This graphical report analyze ticket sales by vendor, game type, game and ticket type.
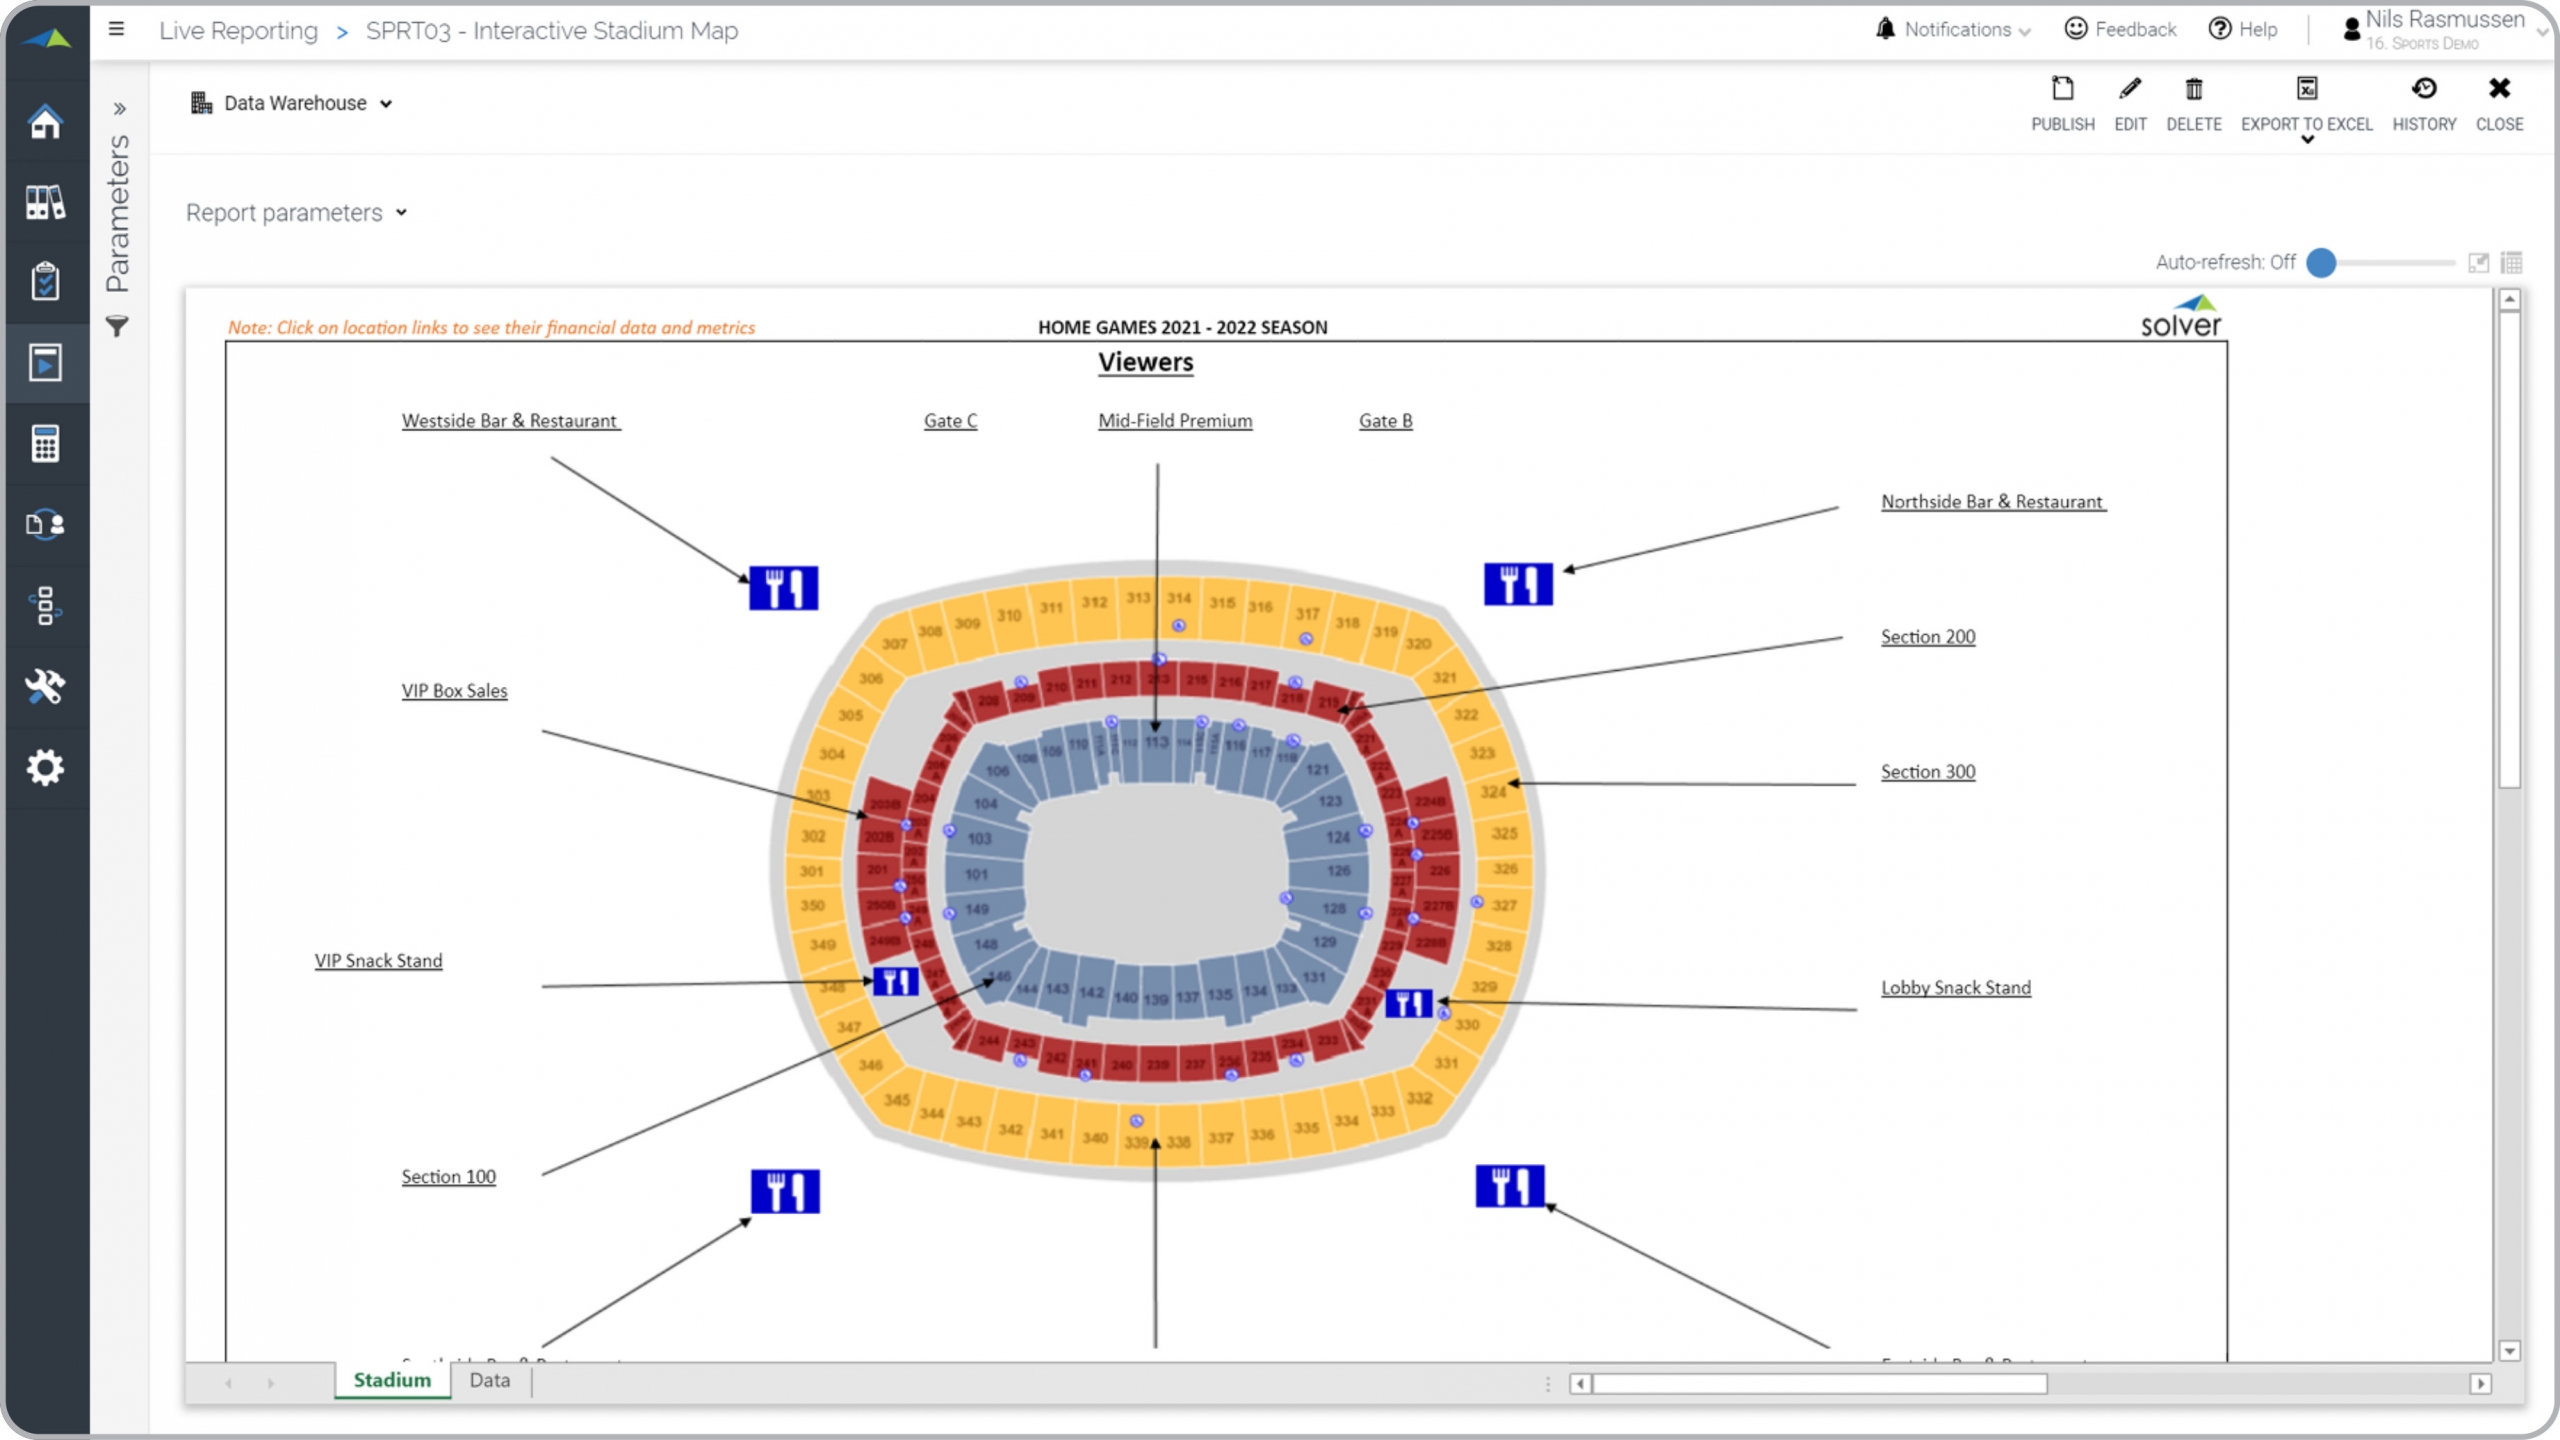
Sports – Stadium Metrics
Shows an interactive stadium map with retail outlet locations and drill down to a report.
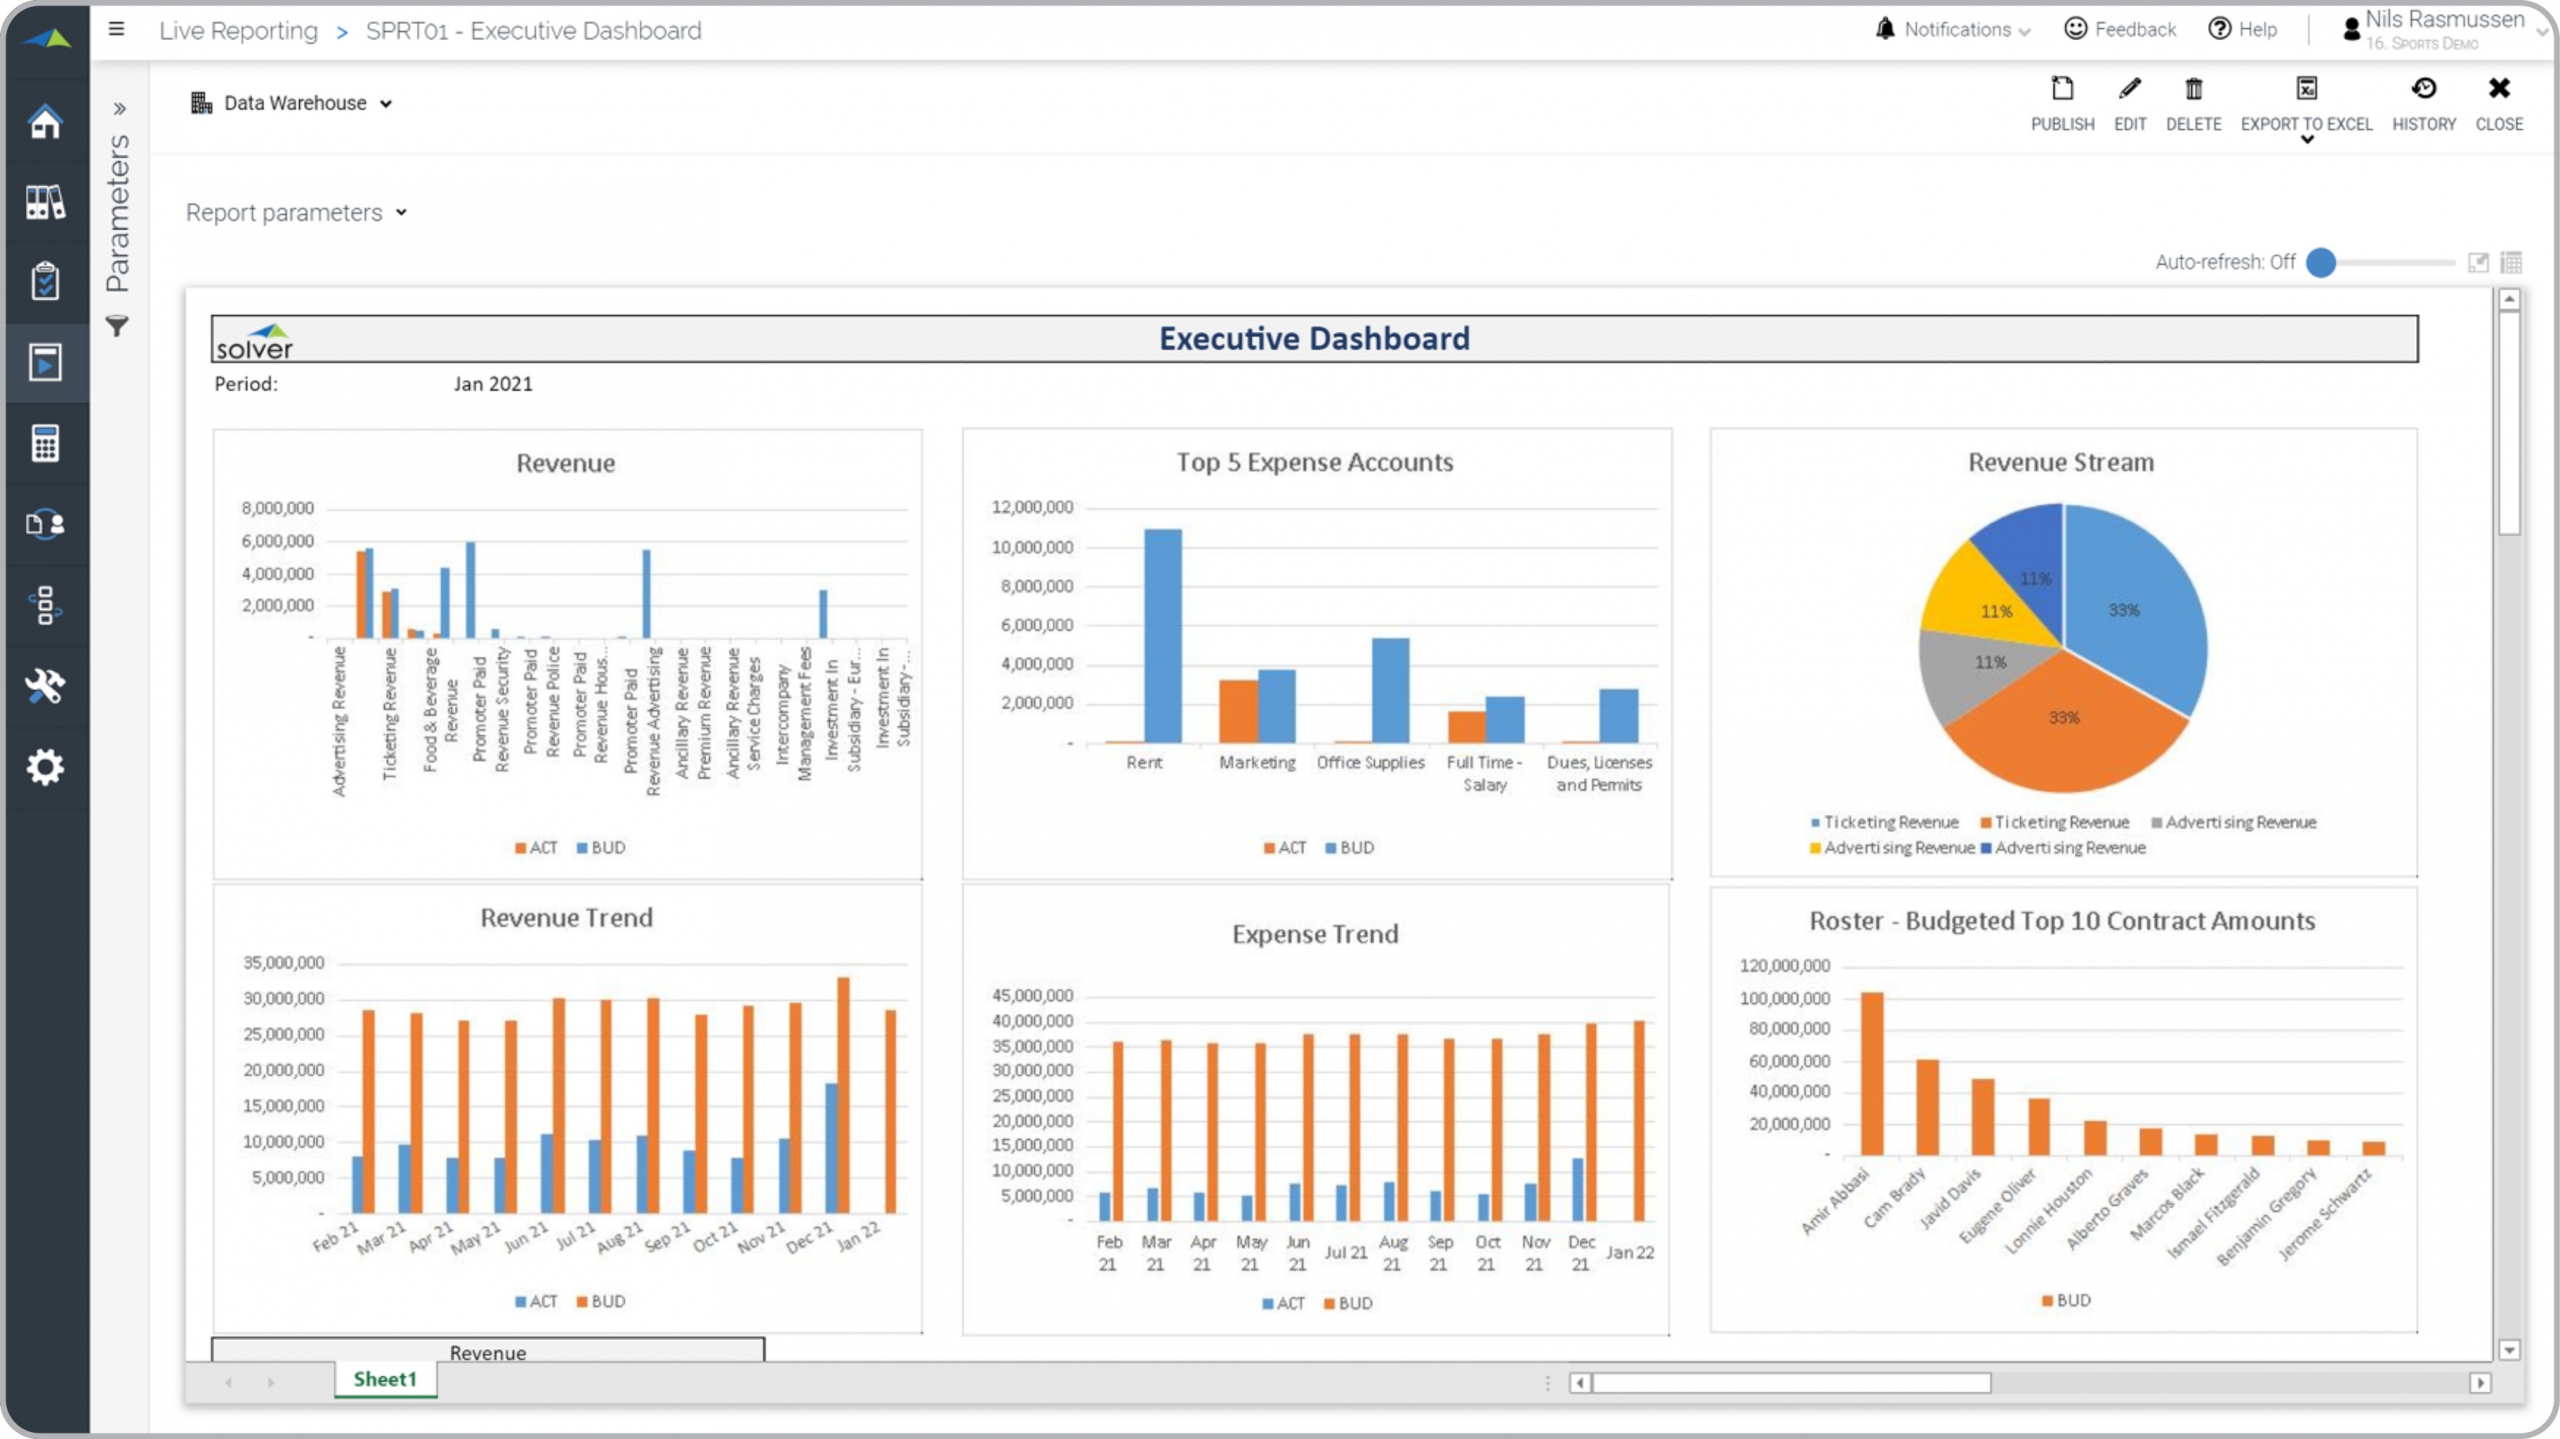
Sports – Executive Dashboard
Provides actual to budget graphical reporting on key team revenue and expense metrics.
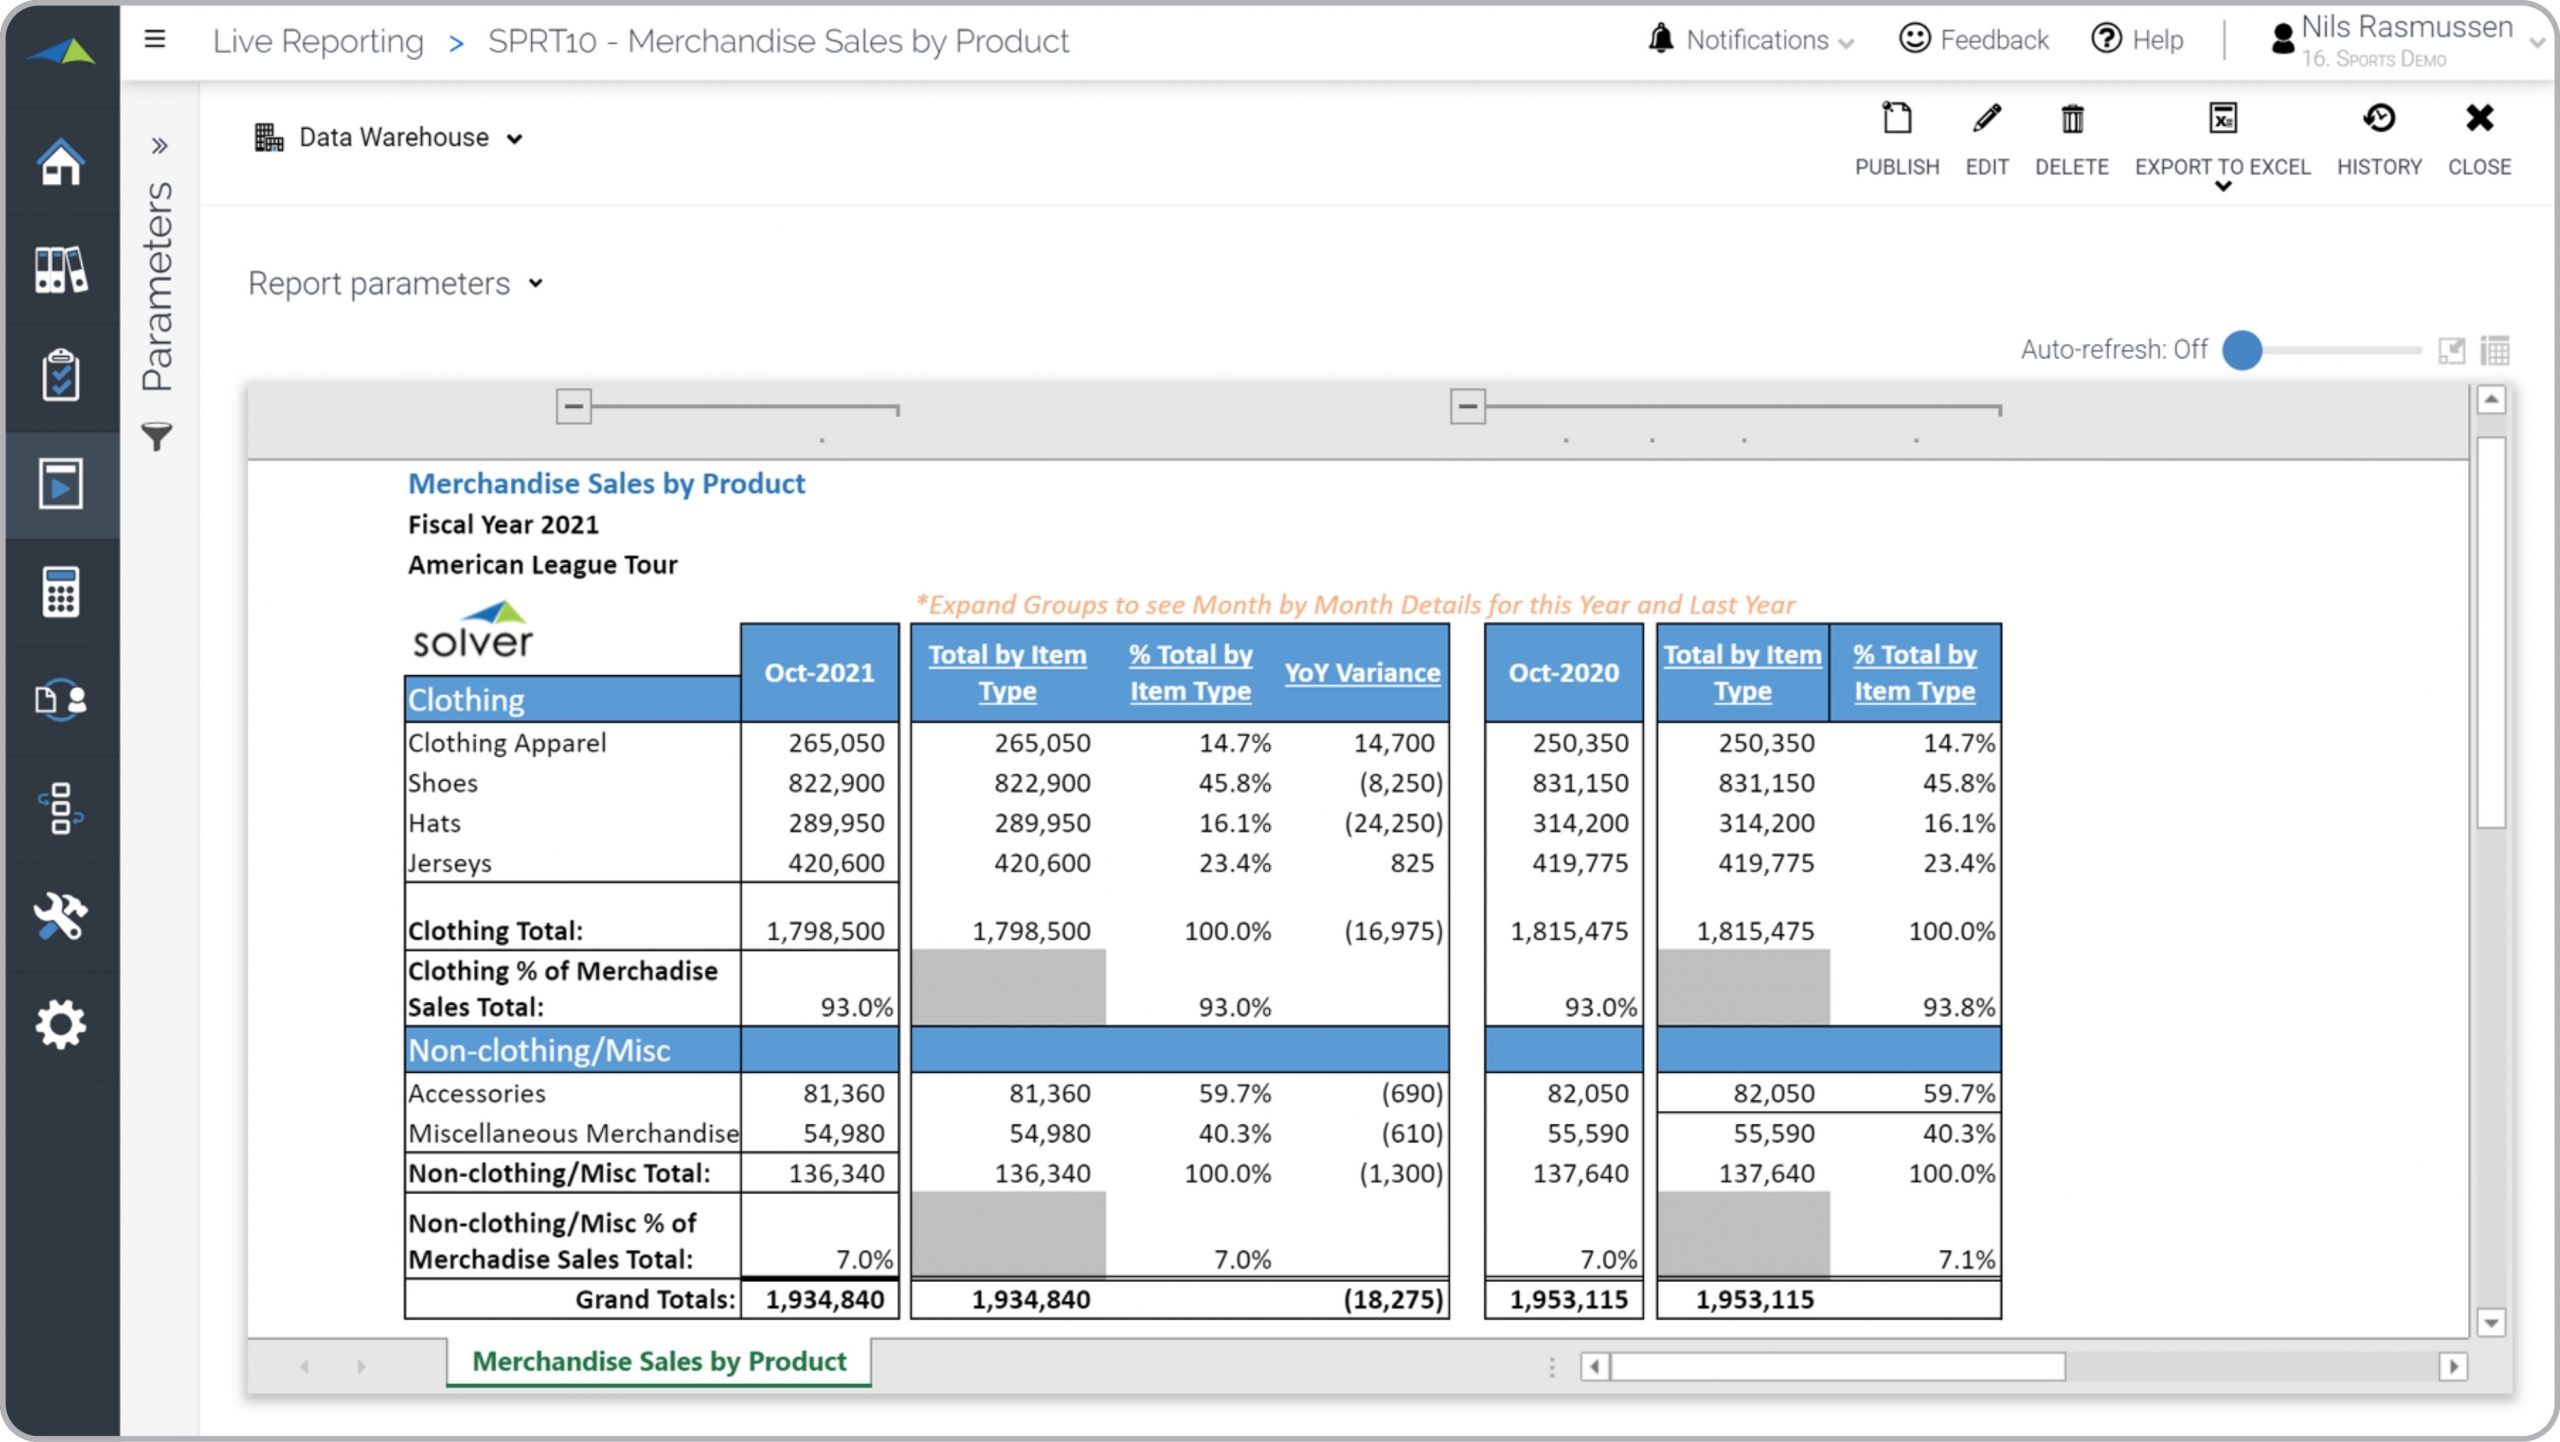
Sports – Merchandise Sales
The report shows merchandise sales per product compared to prior year.
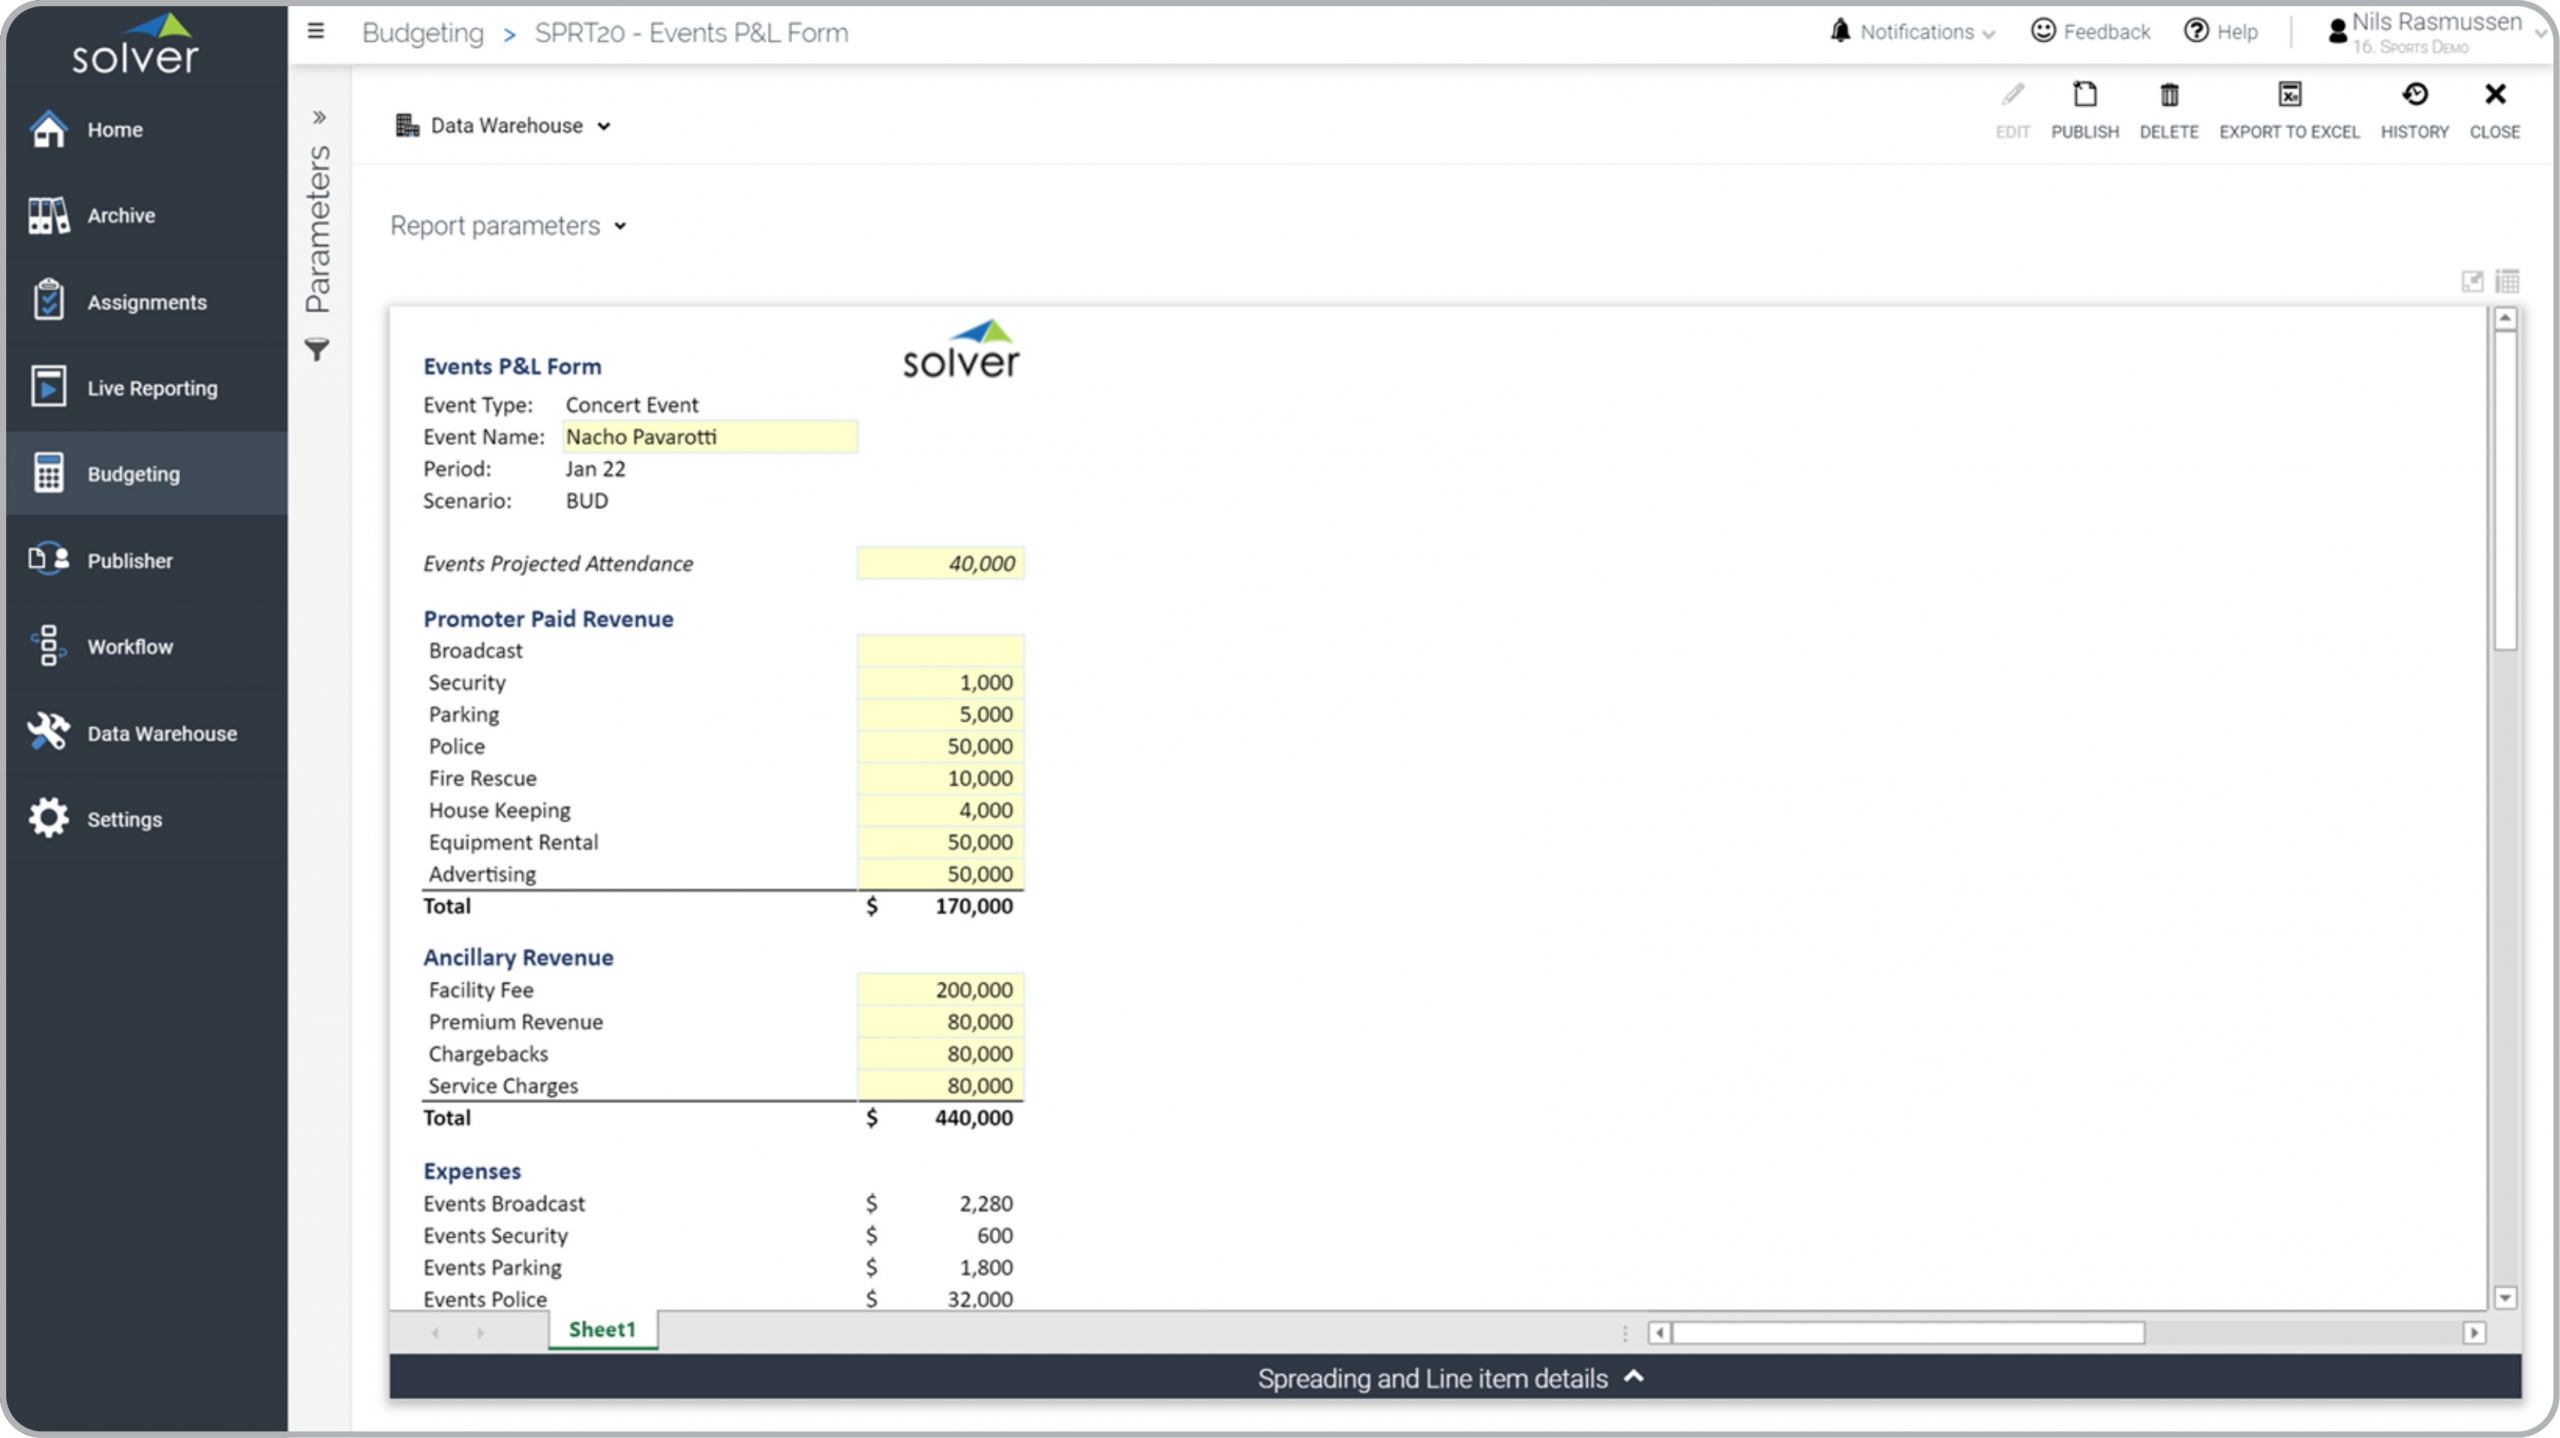
Sports – Event P&L Budget
Input or automatically calculate a full P&L budget per event.
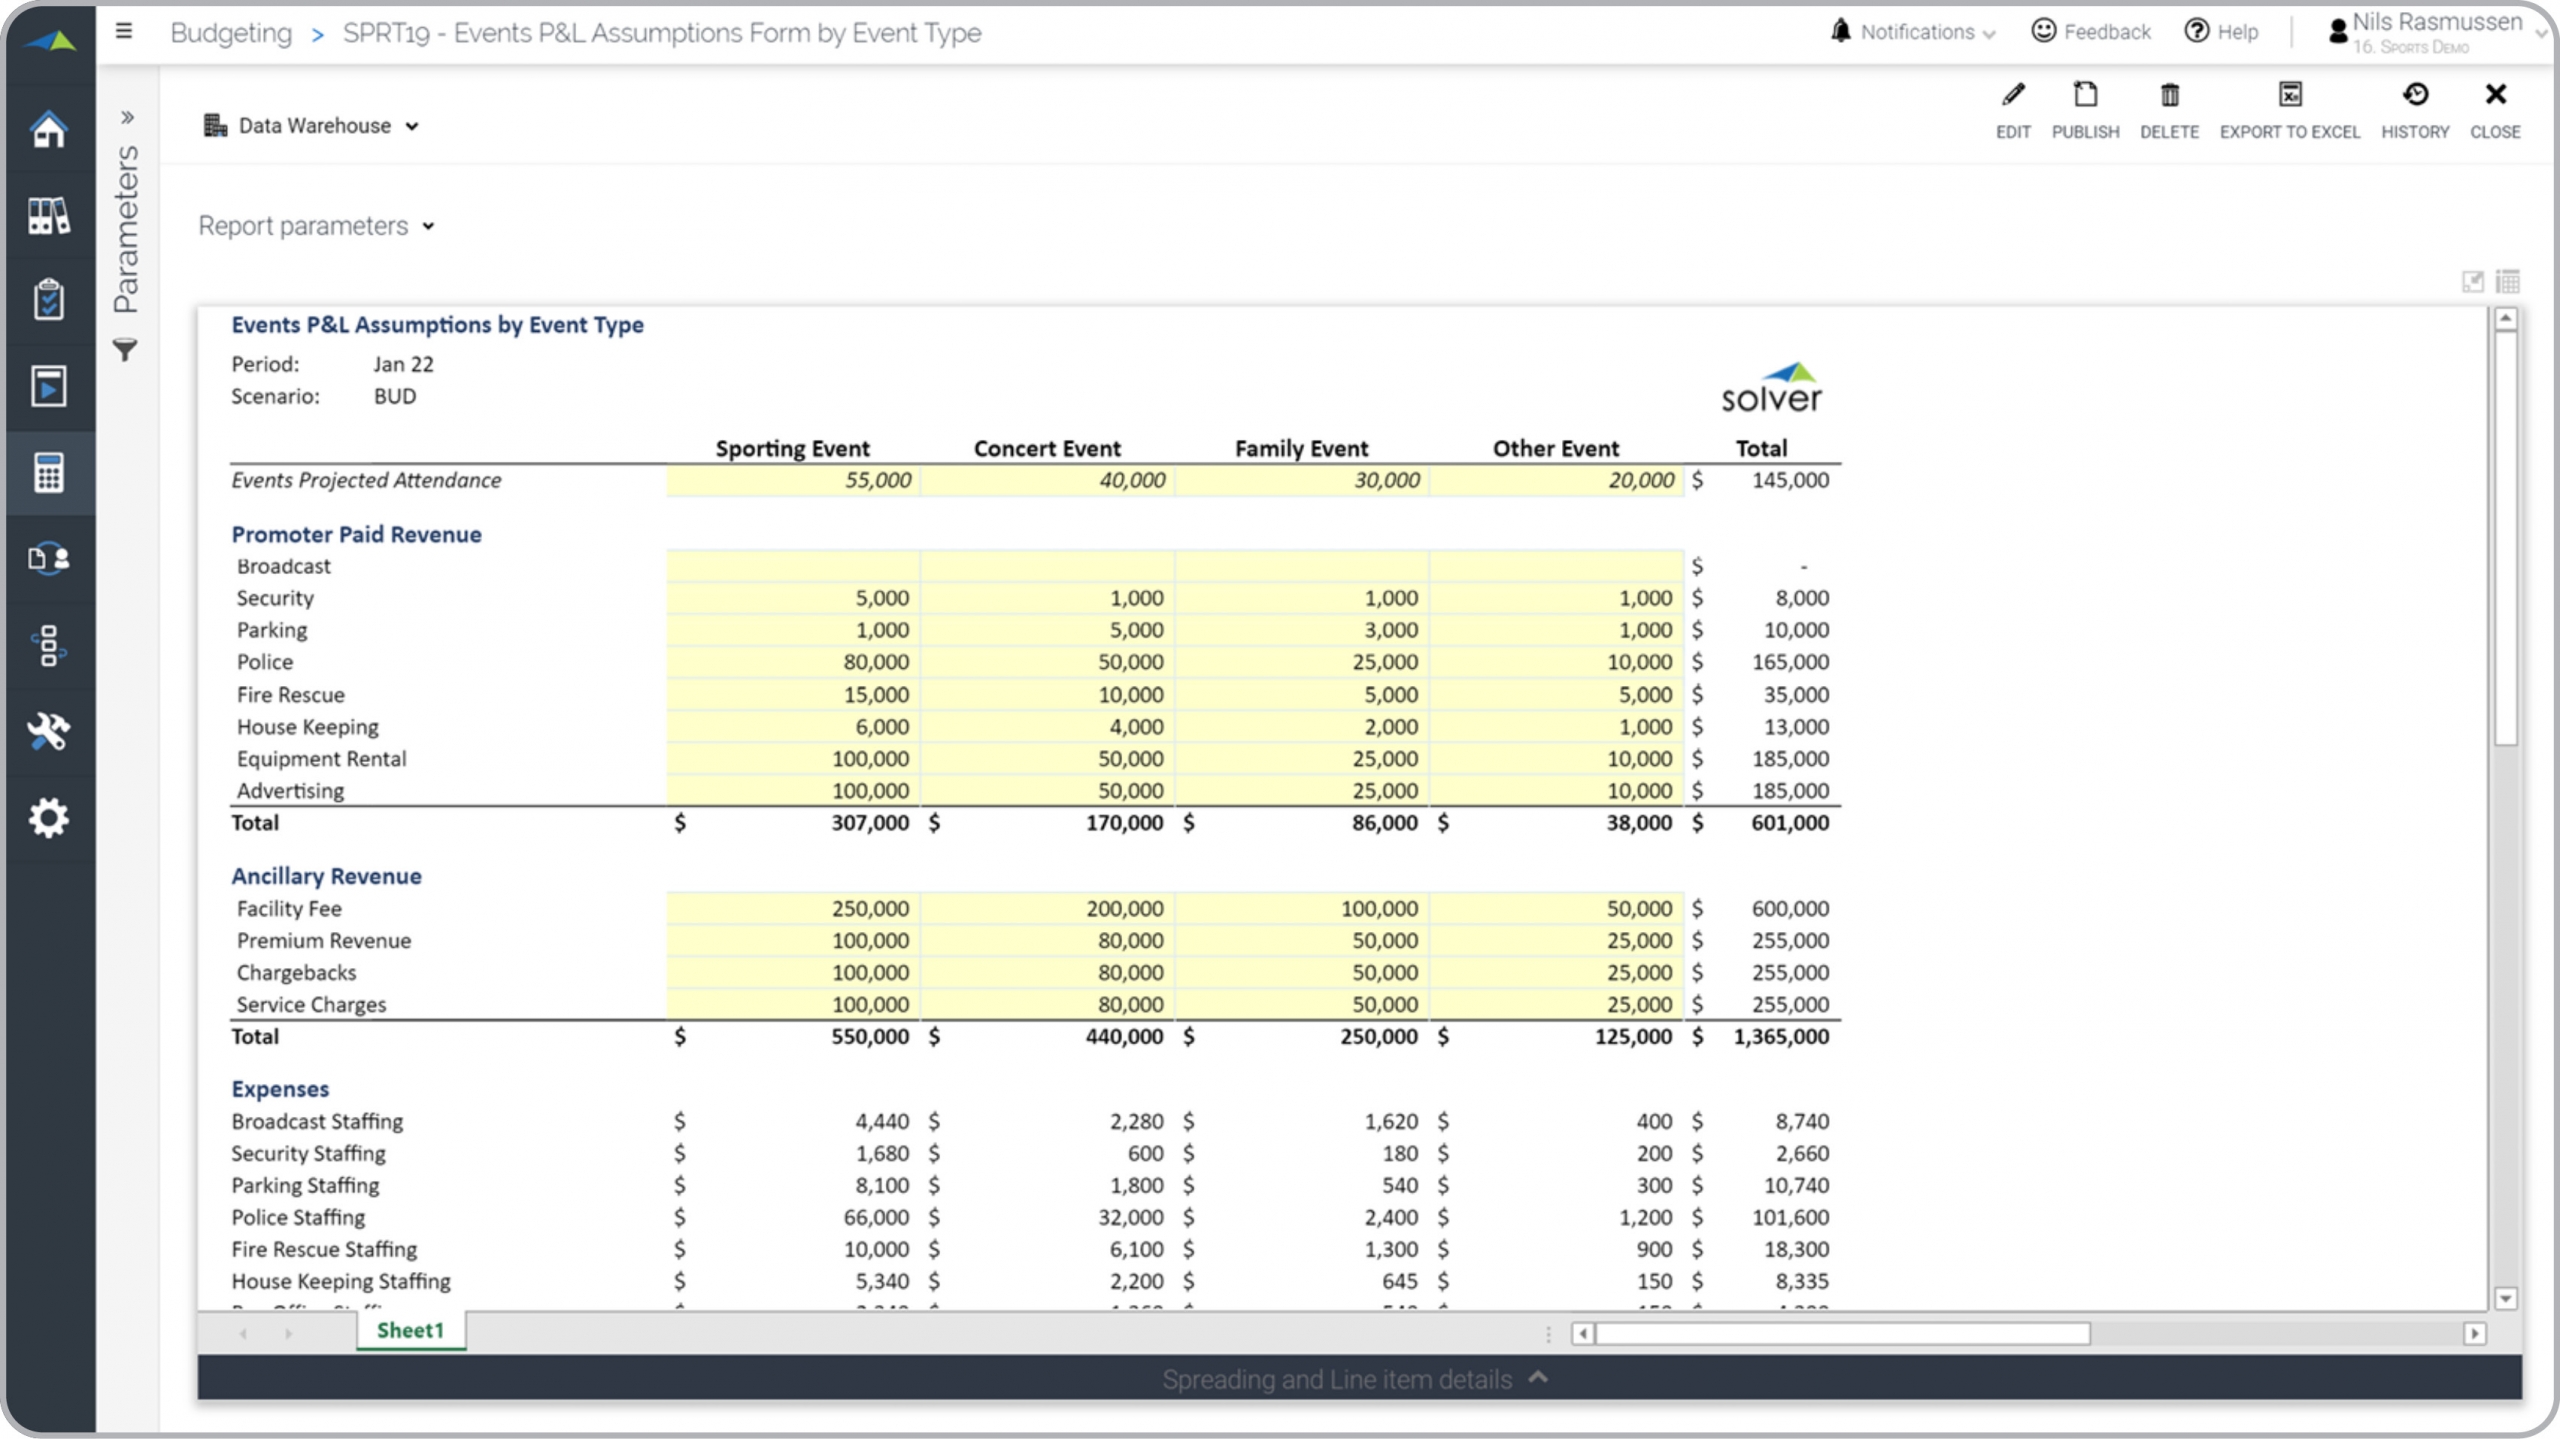
Sports – Event Revenue Assumptions
Input assumptions for event-related activities that will drive the revenue budget.
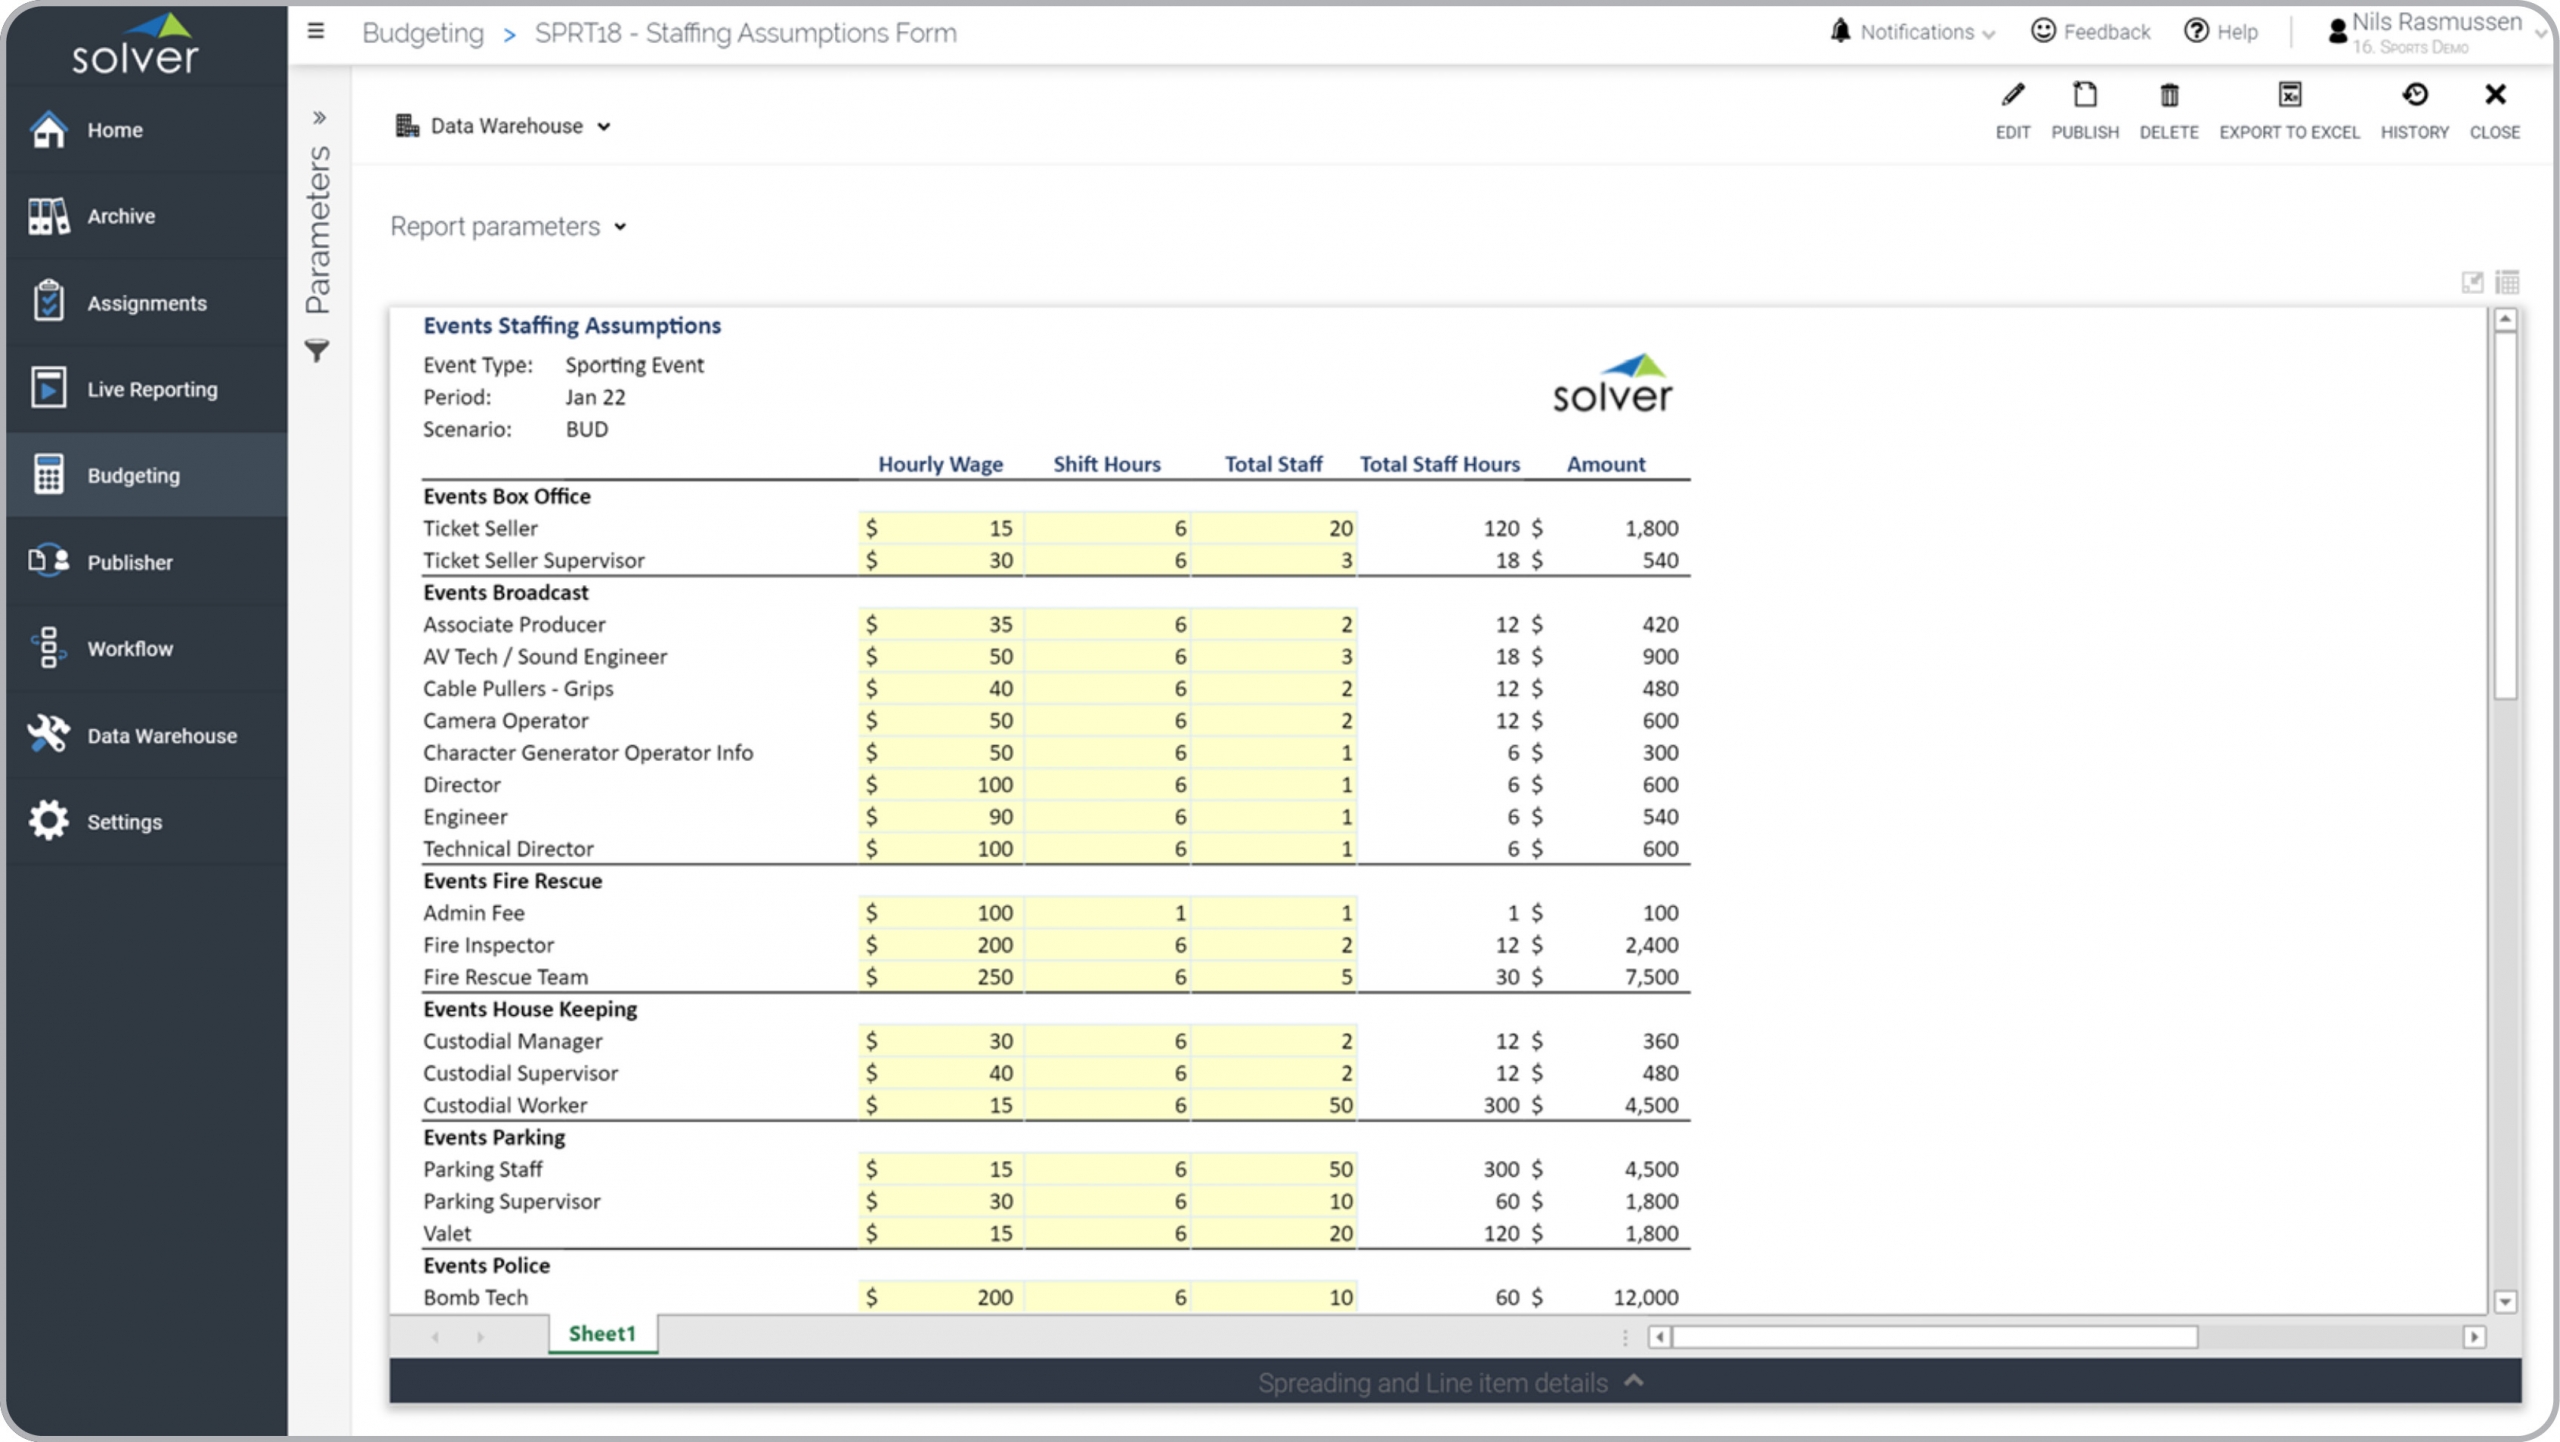
Sports – Event Staffing Assumptions
Input assumptions for event staffing-related activities that will drive the expense budget.
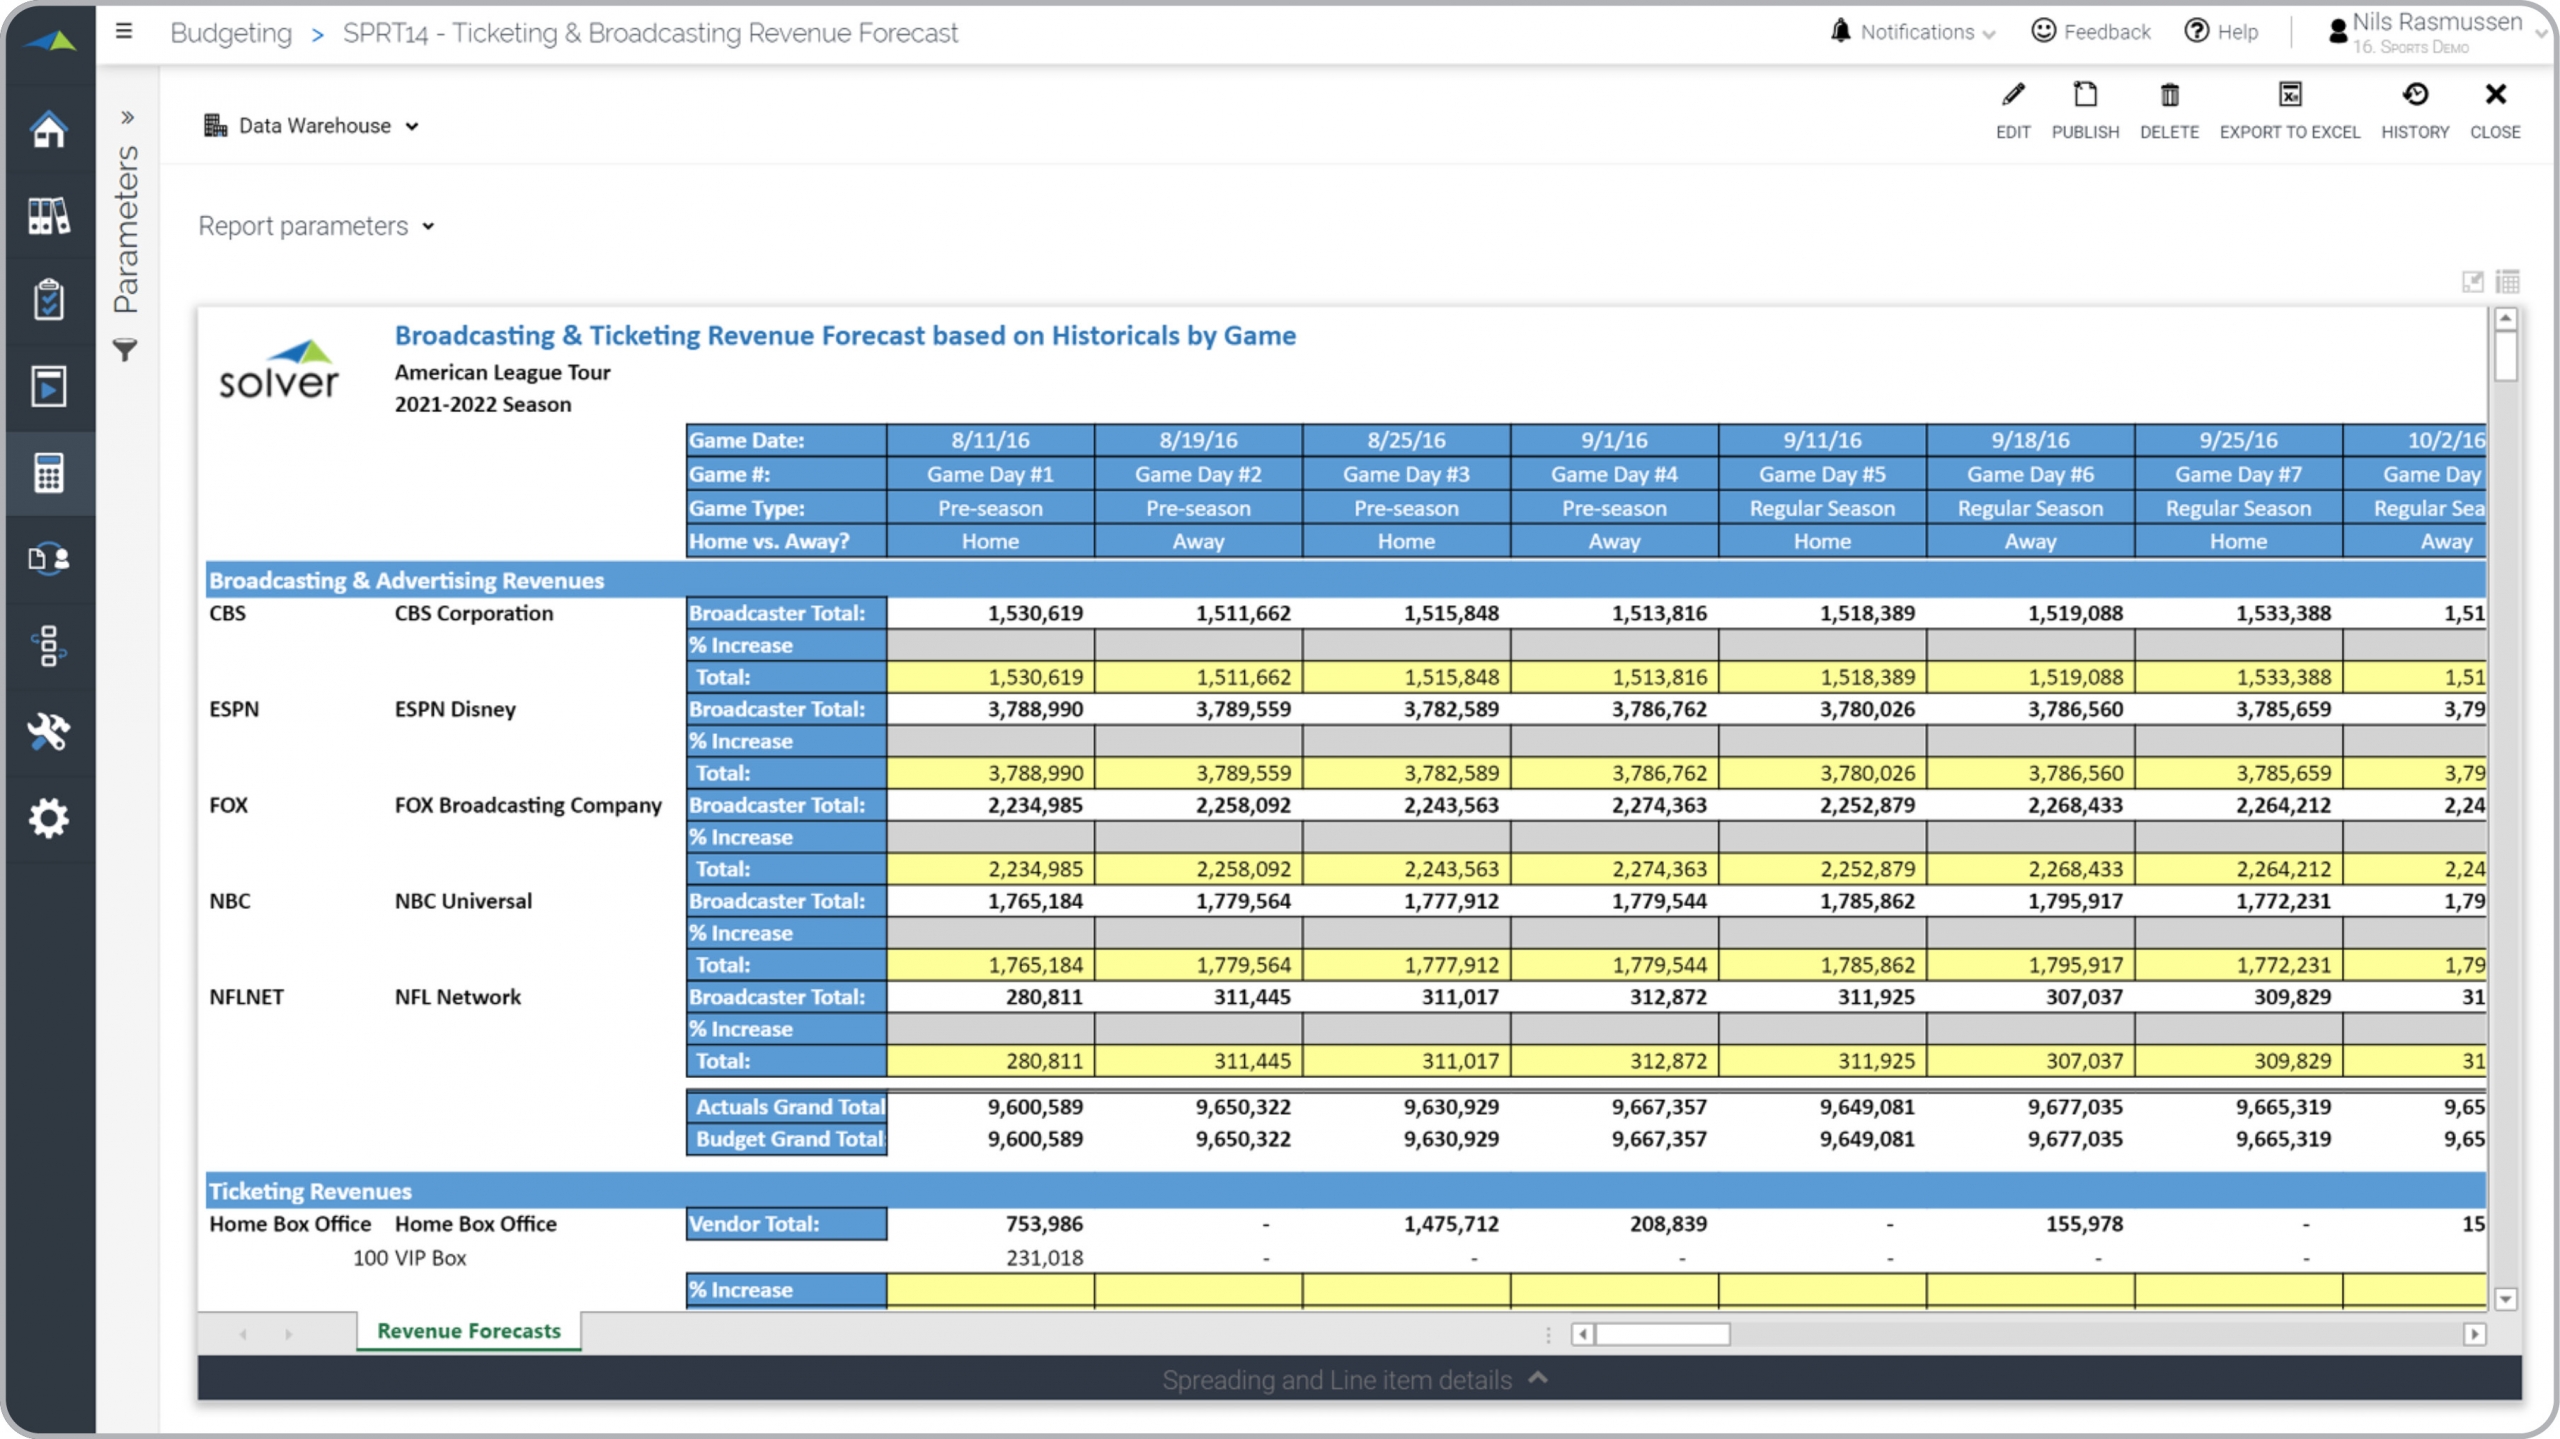
Sports – Ticket and Media Forecast
Forecast expected revenue from ticket and broadcast media sales based on game history.
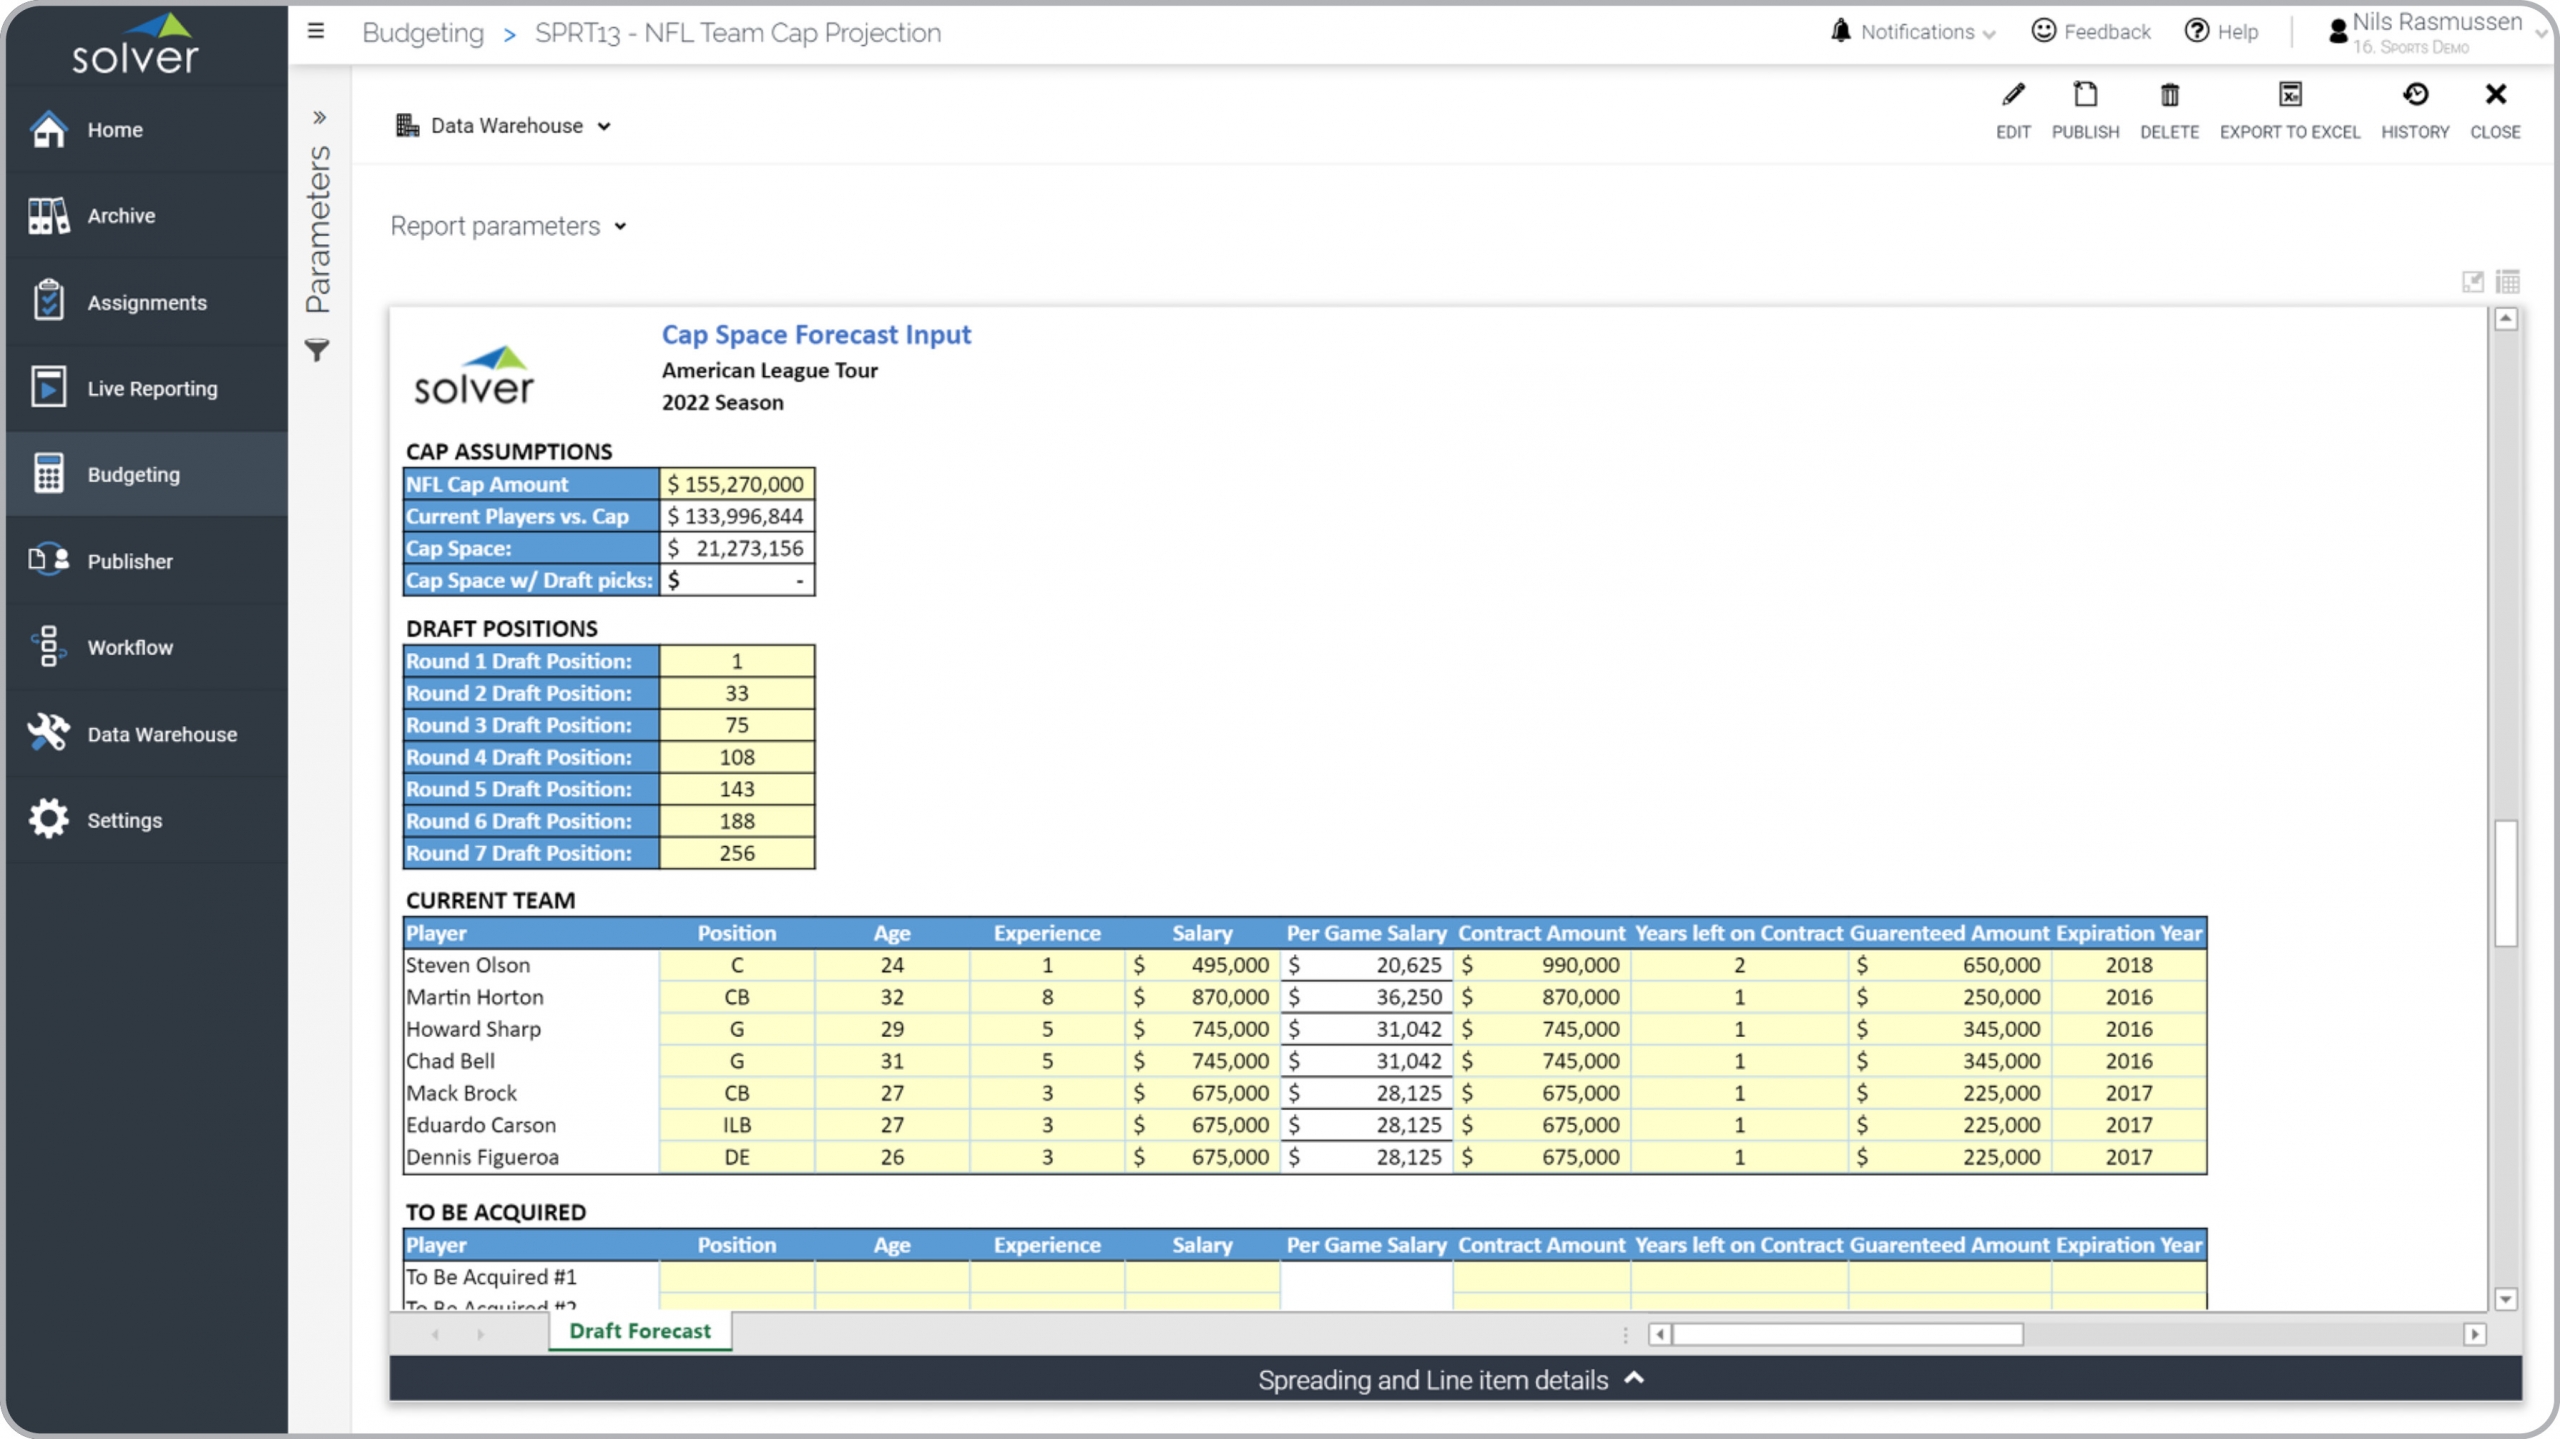
Sports – NFL Cap and Team Forecast
Using various assumptions, forecast total player compensation versus NFL cap.
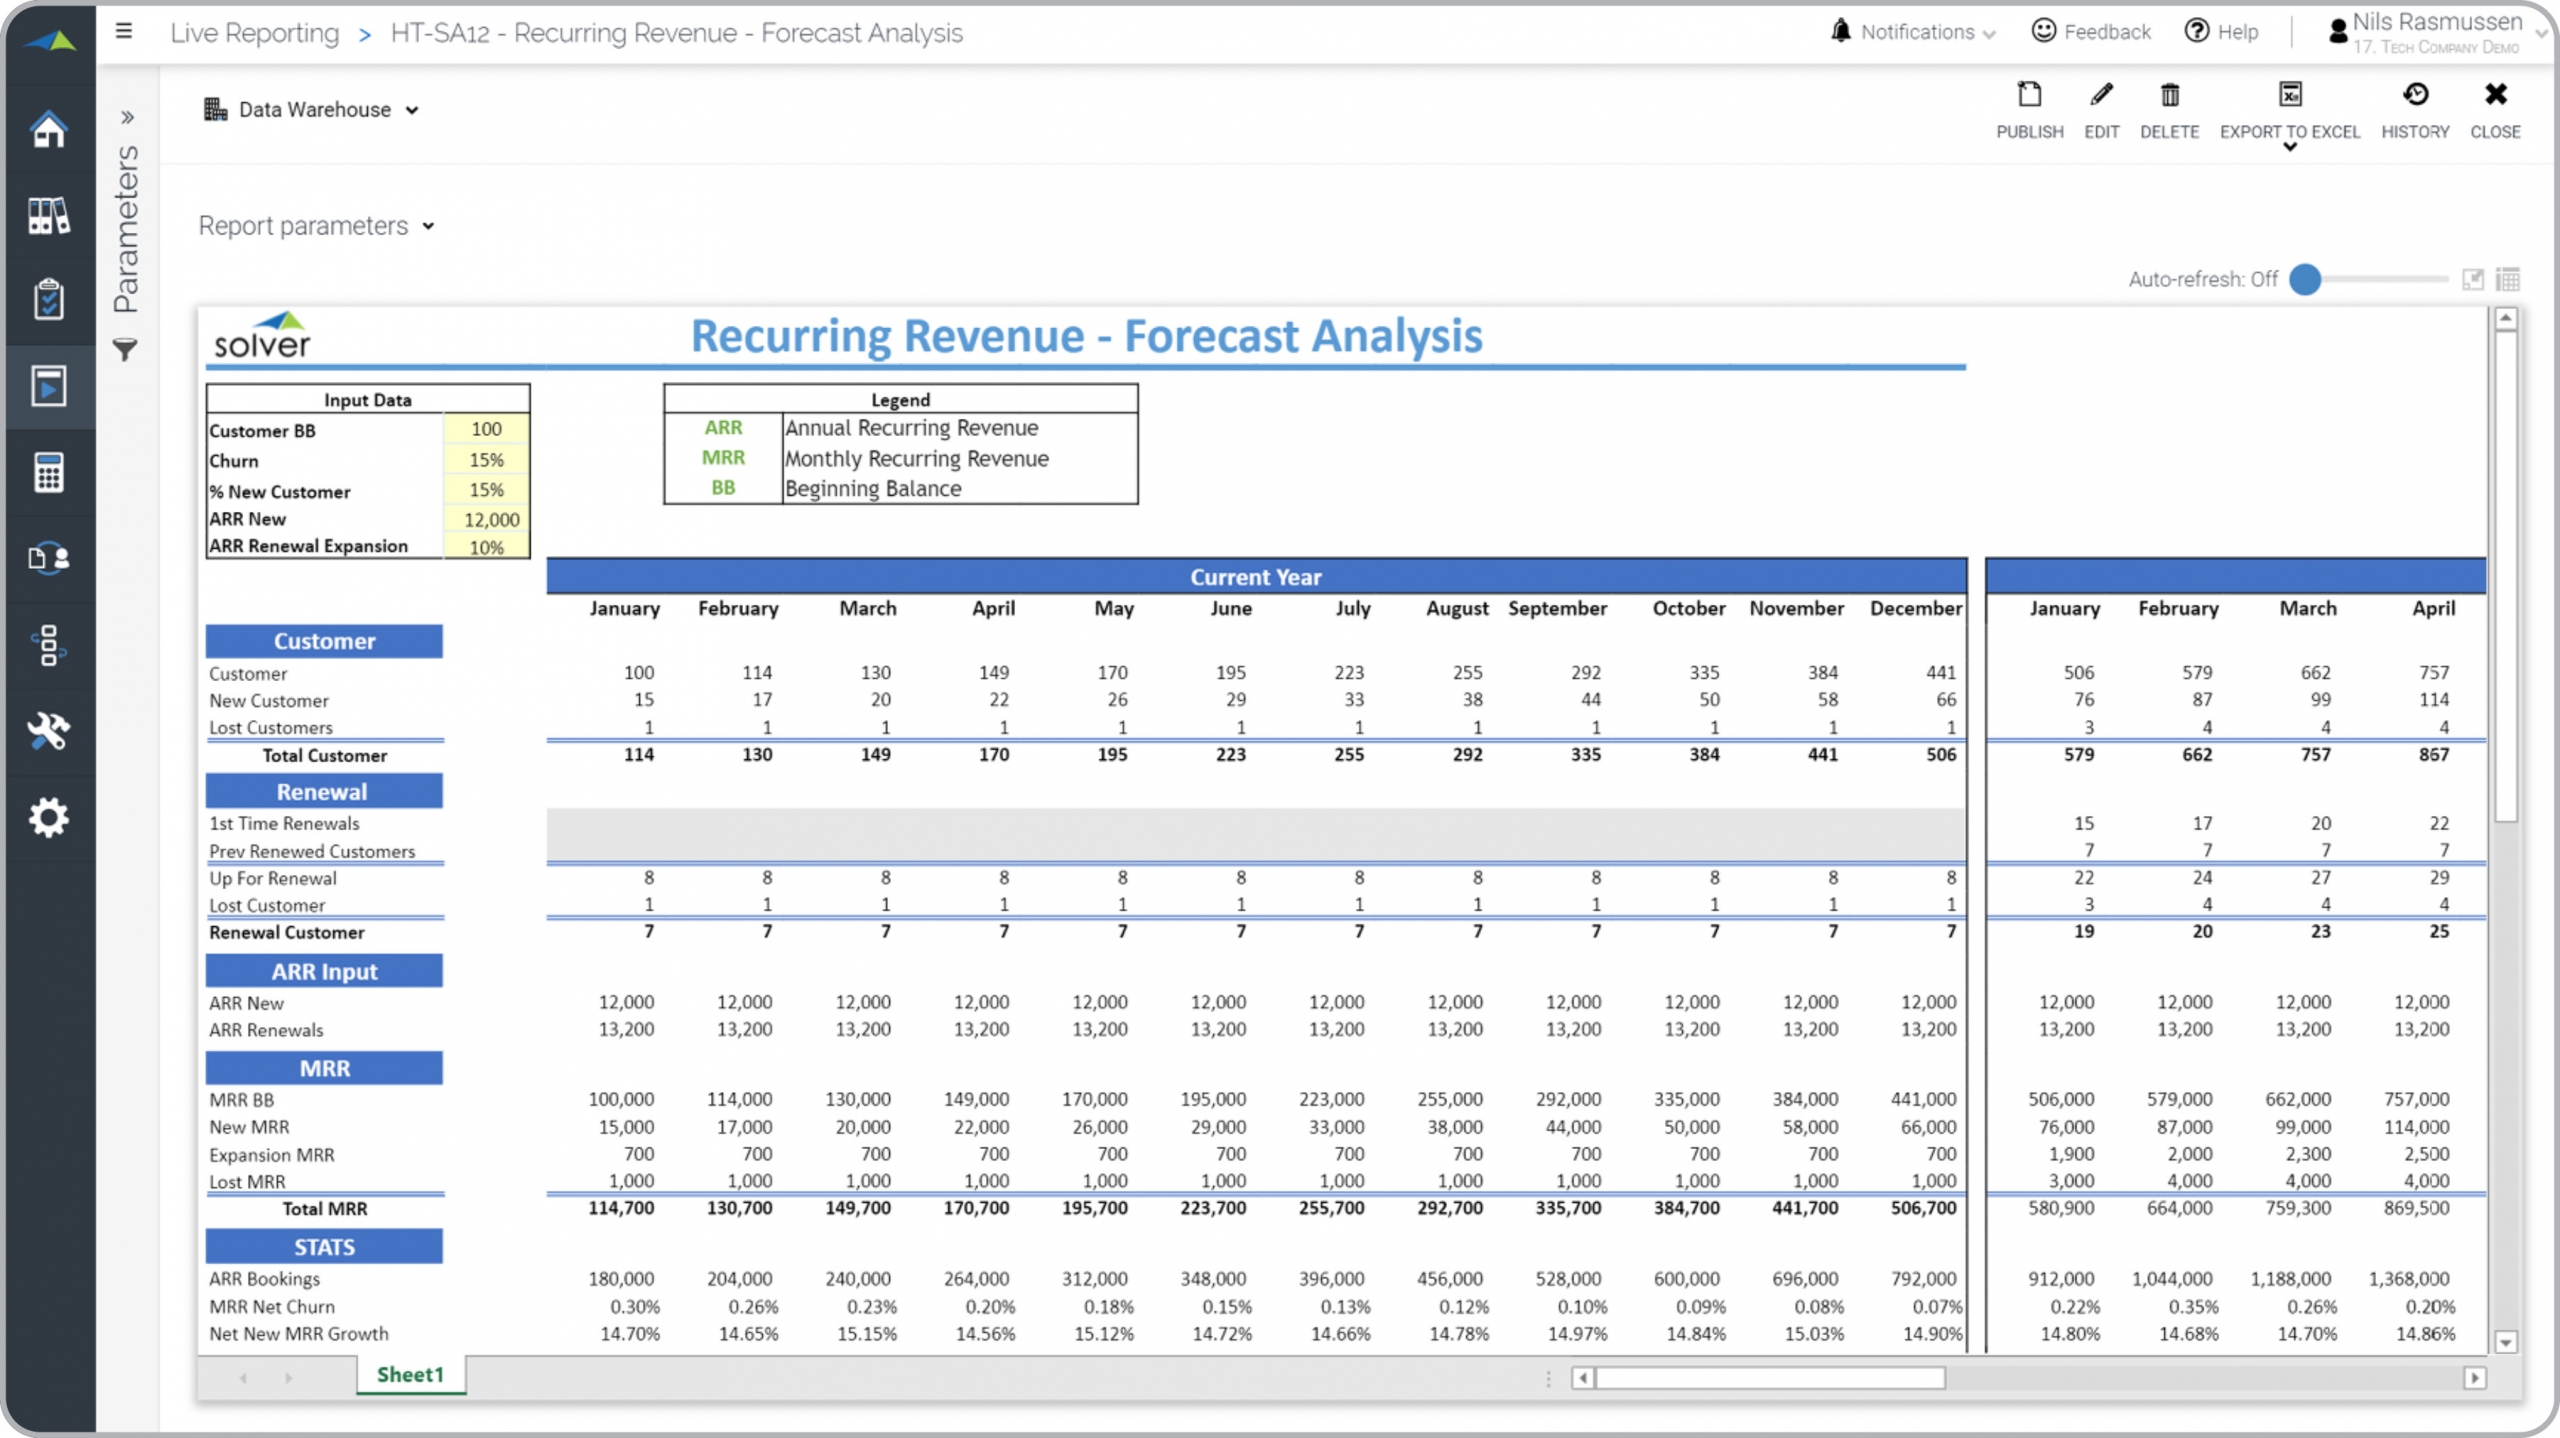
Tech – Recurring Revenue Forecast
Recurring revenue forecast report with KPIs like ARR and MRR, as well as deal count.
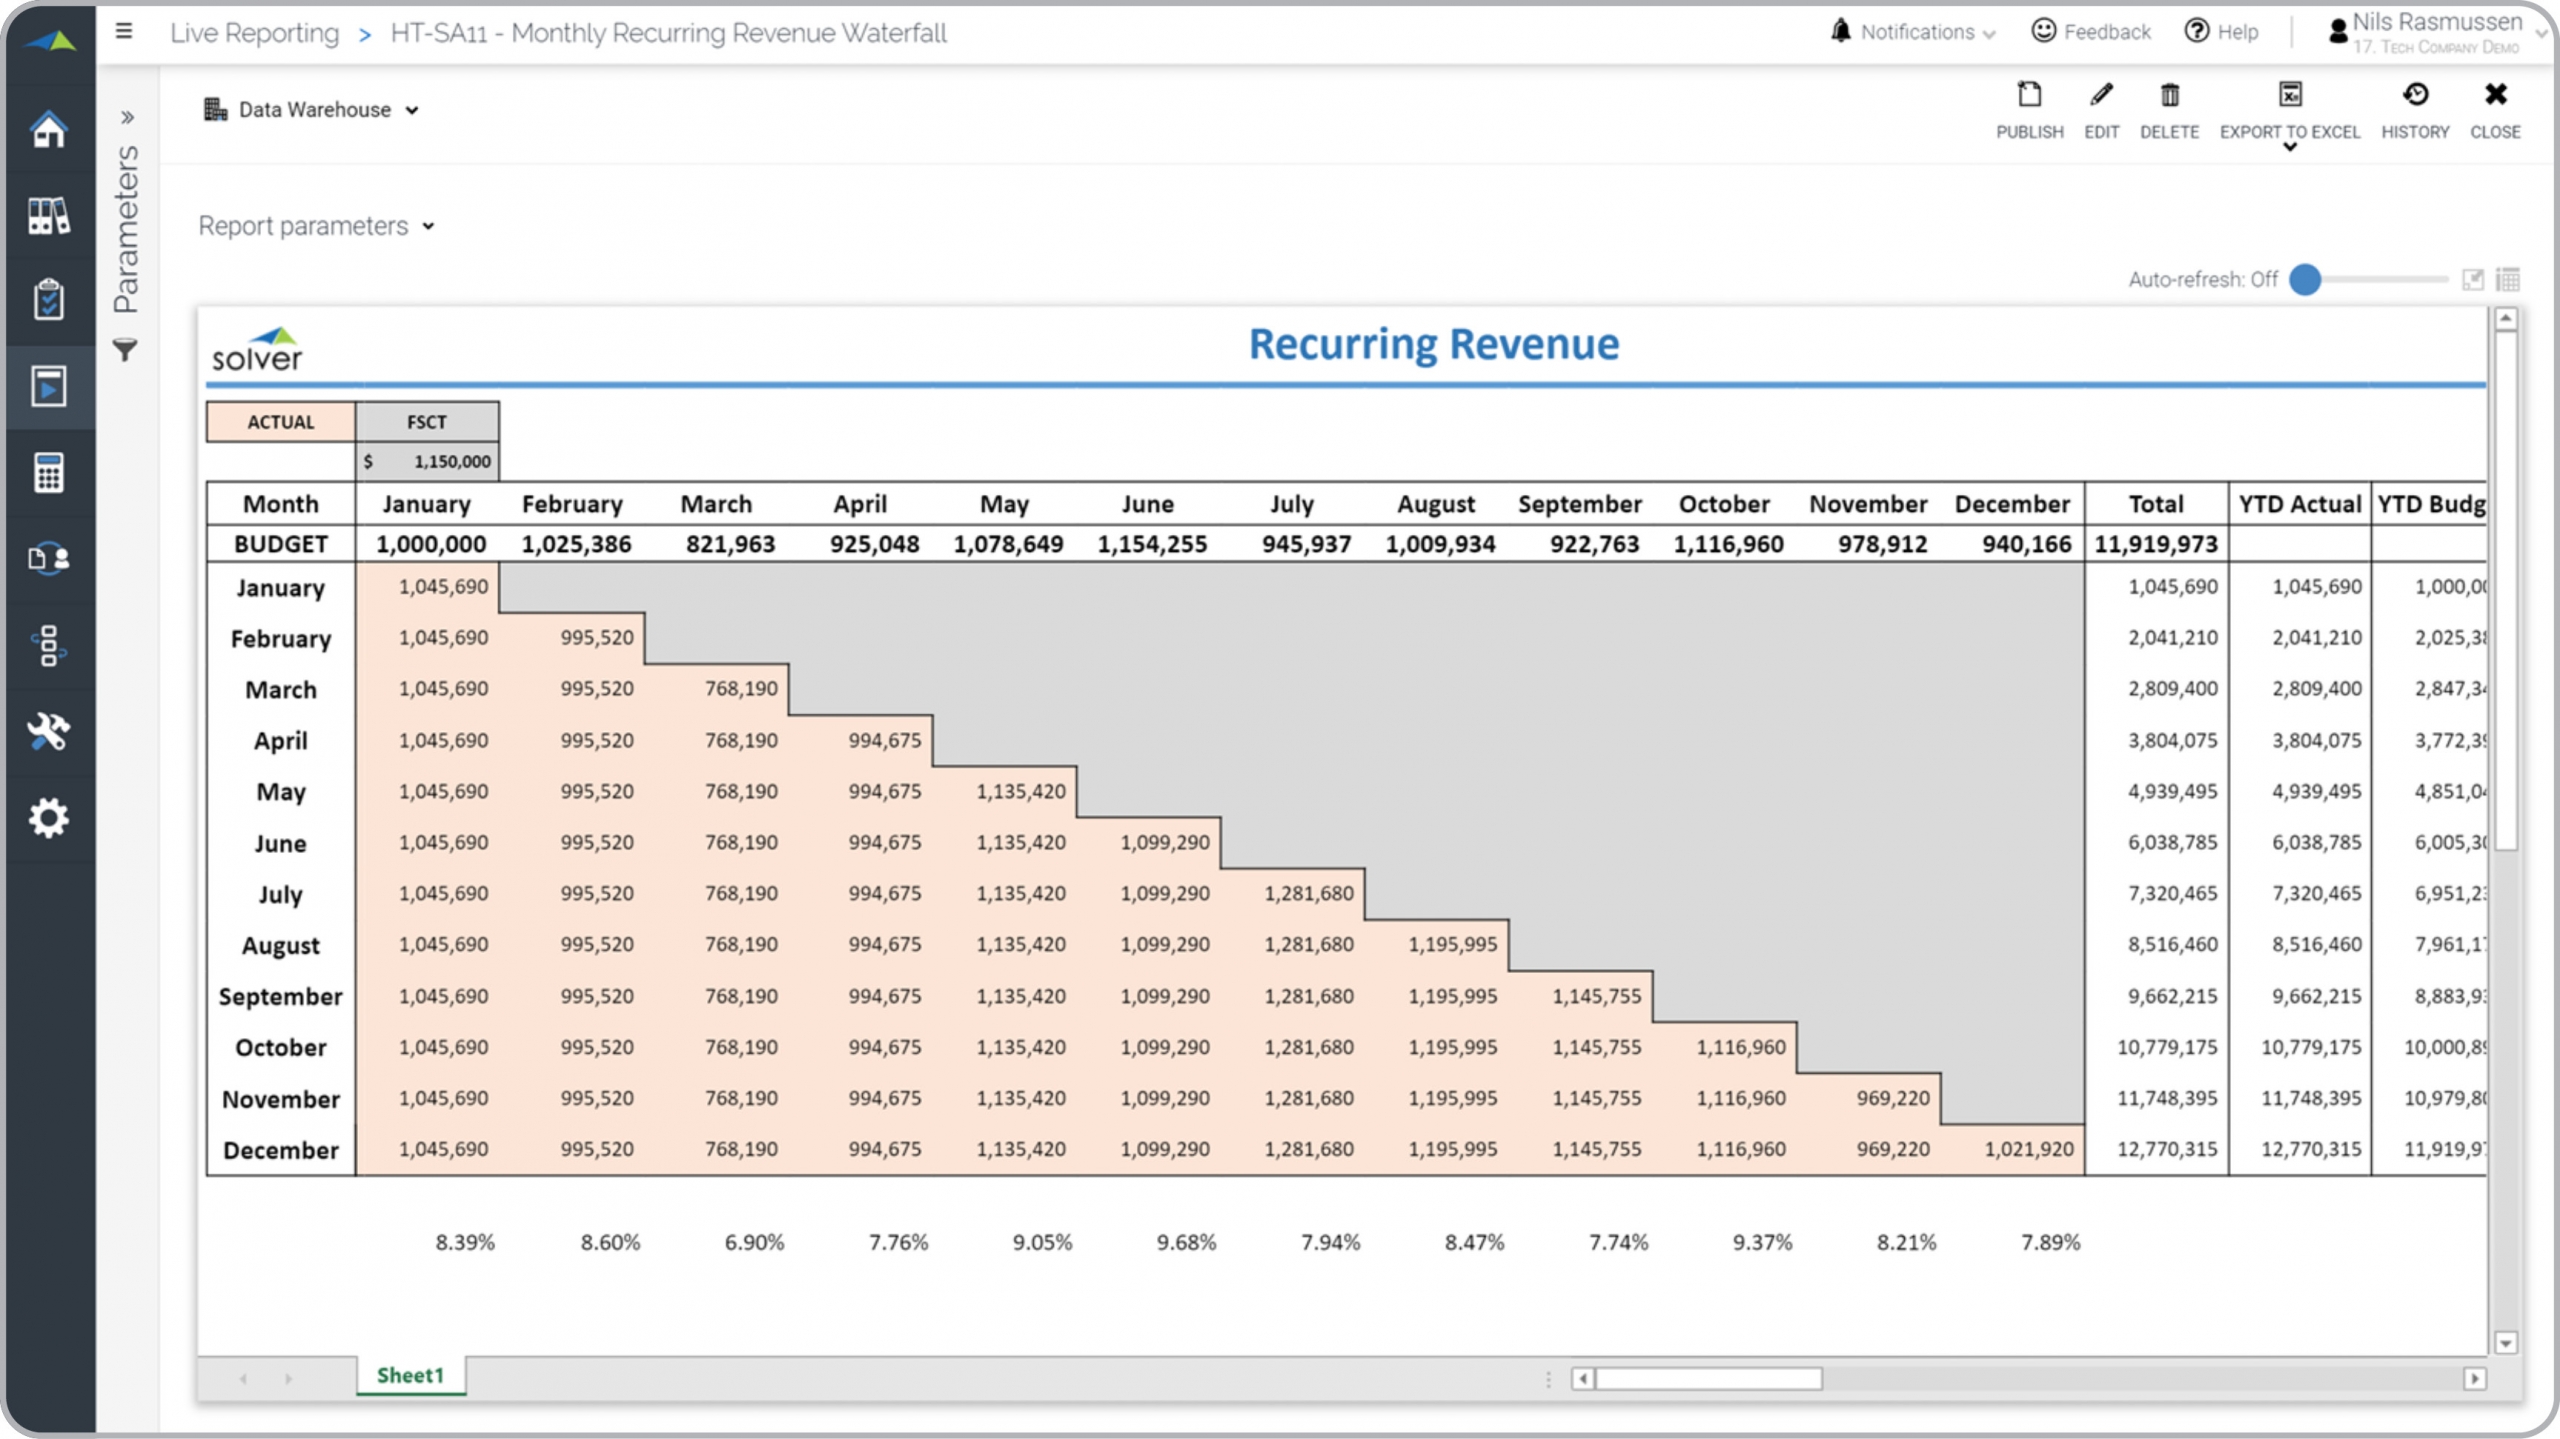
Tech – Recurring Revenue Waterfall
Recurring revenue waterfall report with actual and forecasted revenue.
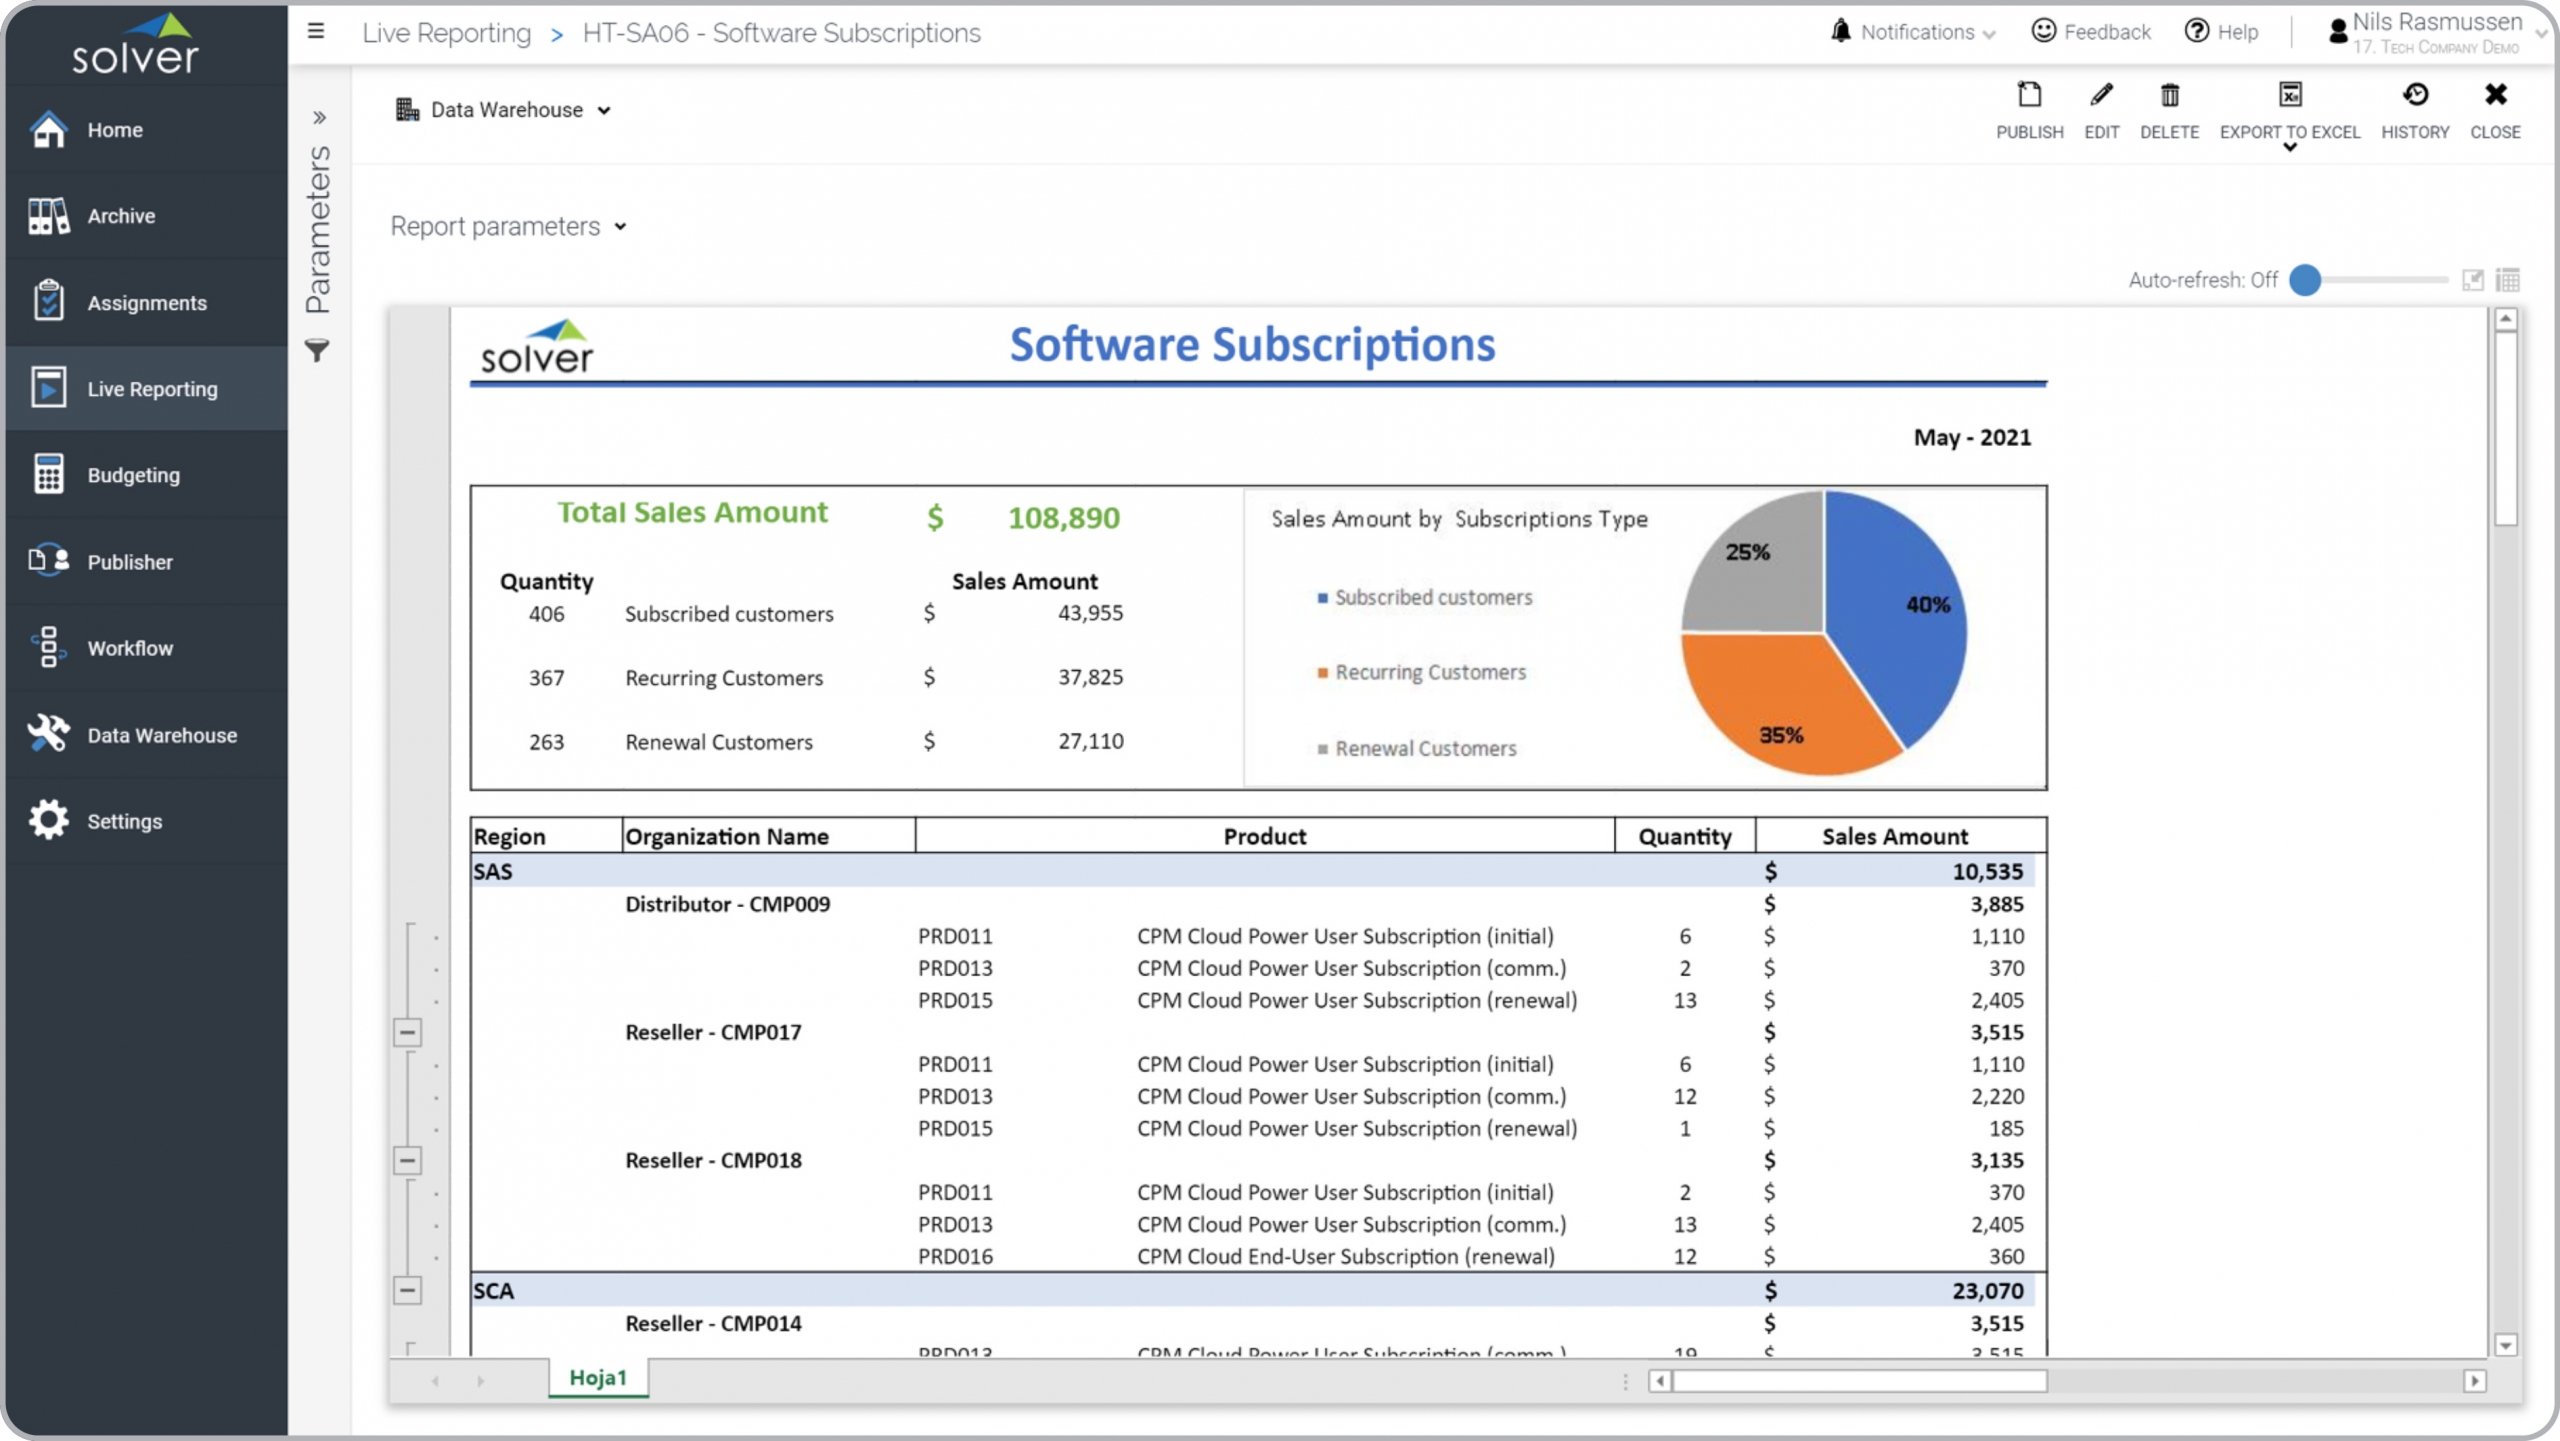
Tech – Subscription Sales by Product
Subscription revenue report with quantity and sales amount per product.
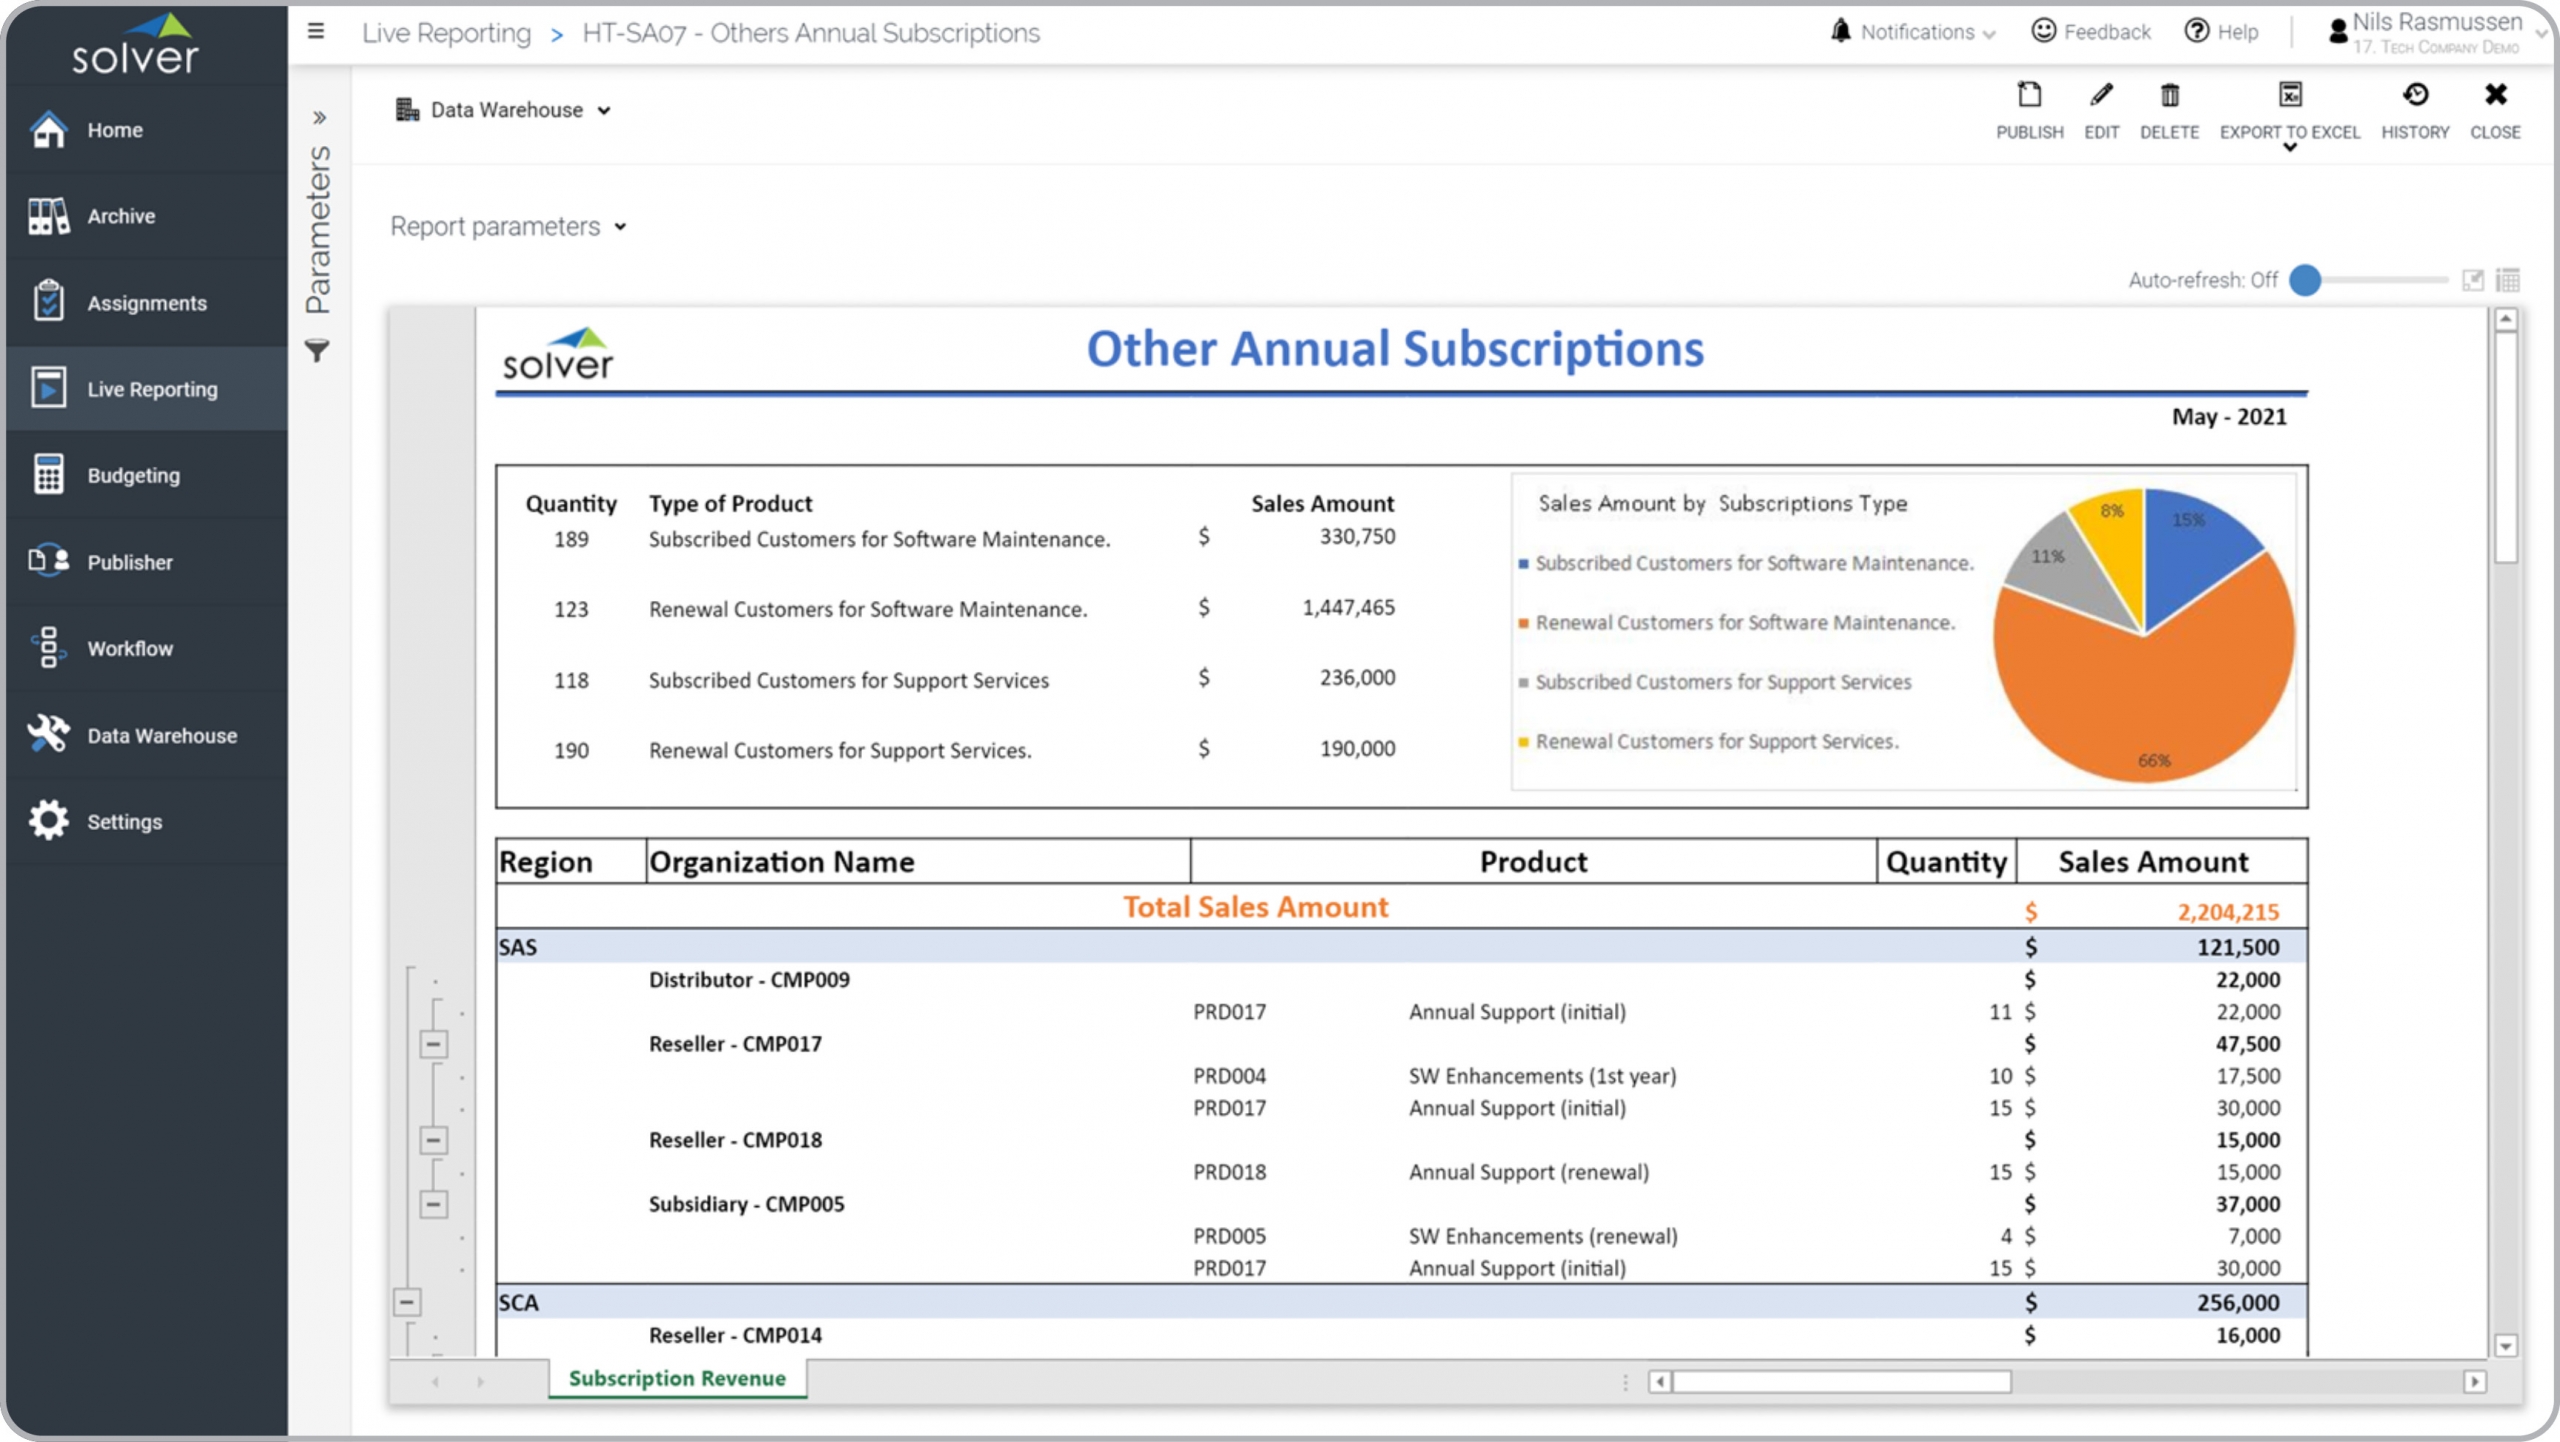
Tech – Subscription Sales by Type
Subscription revenue report with quantity and sales amount per product by customer type.
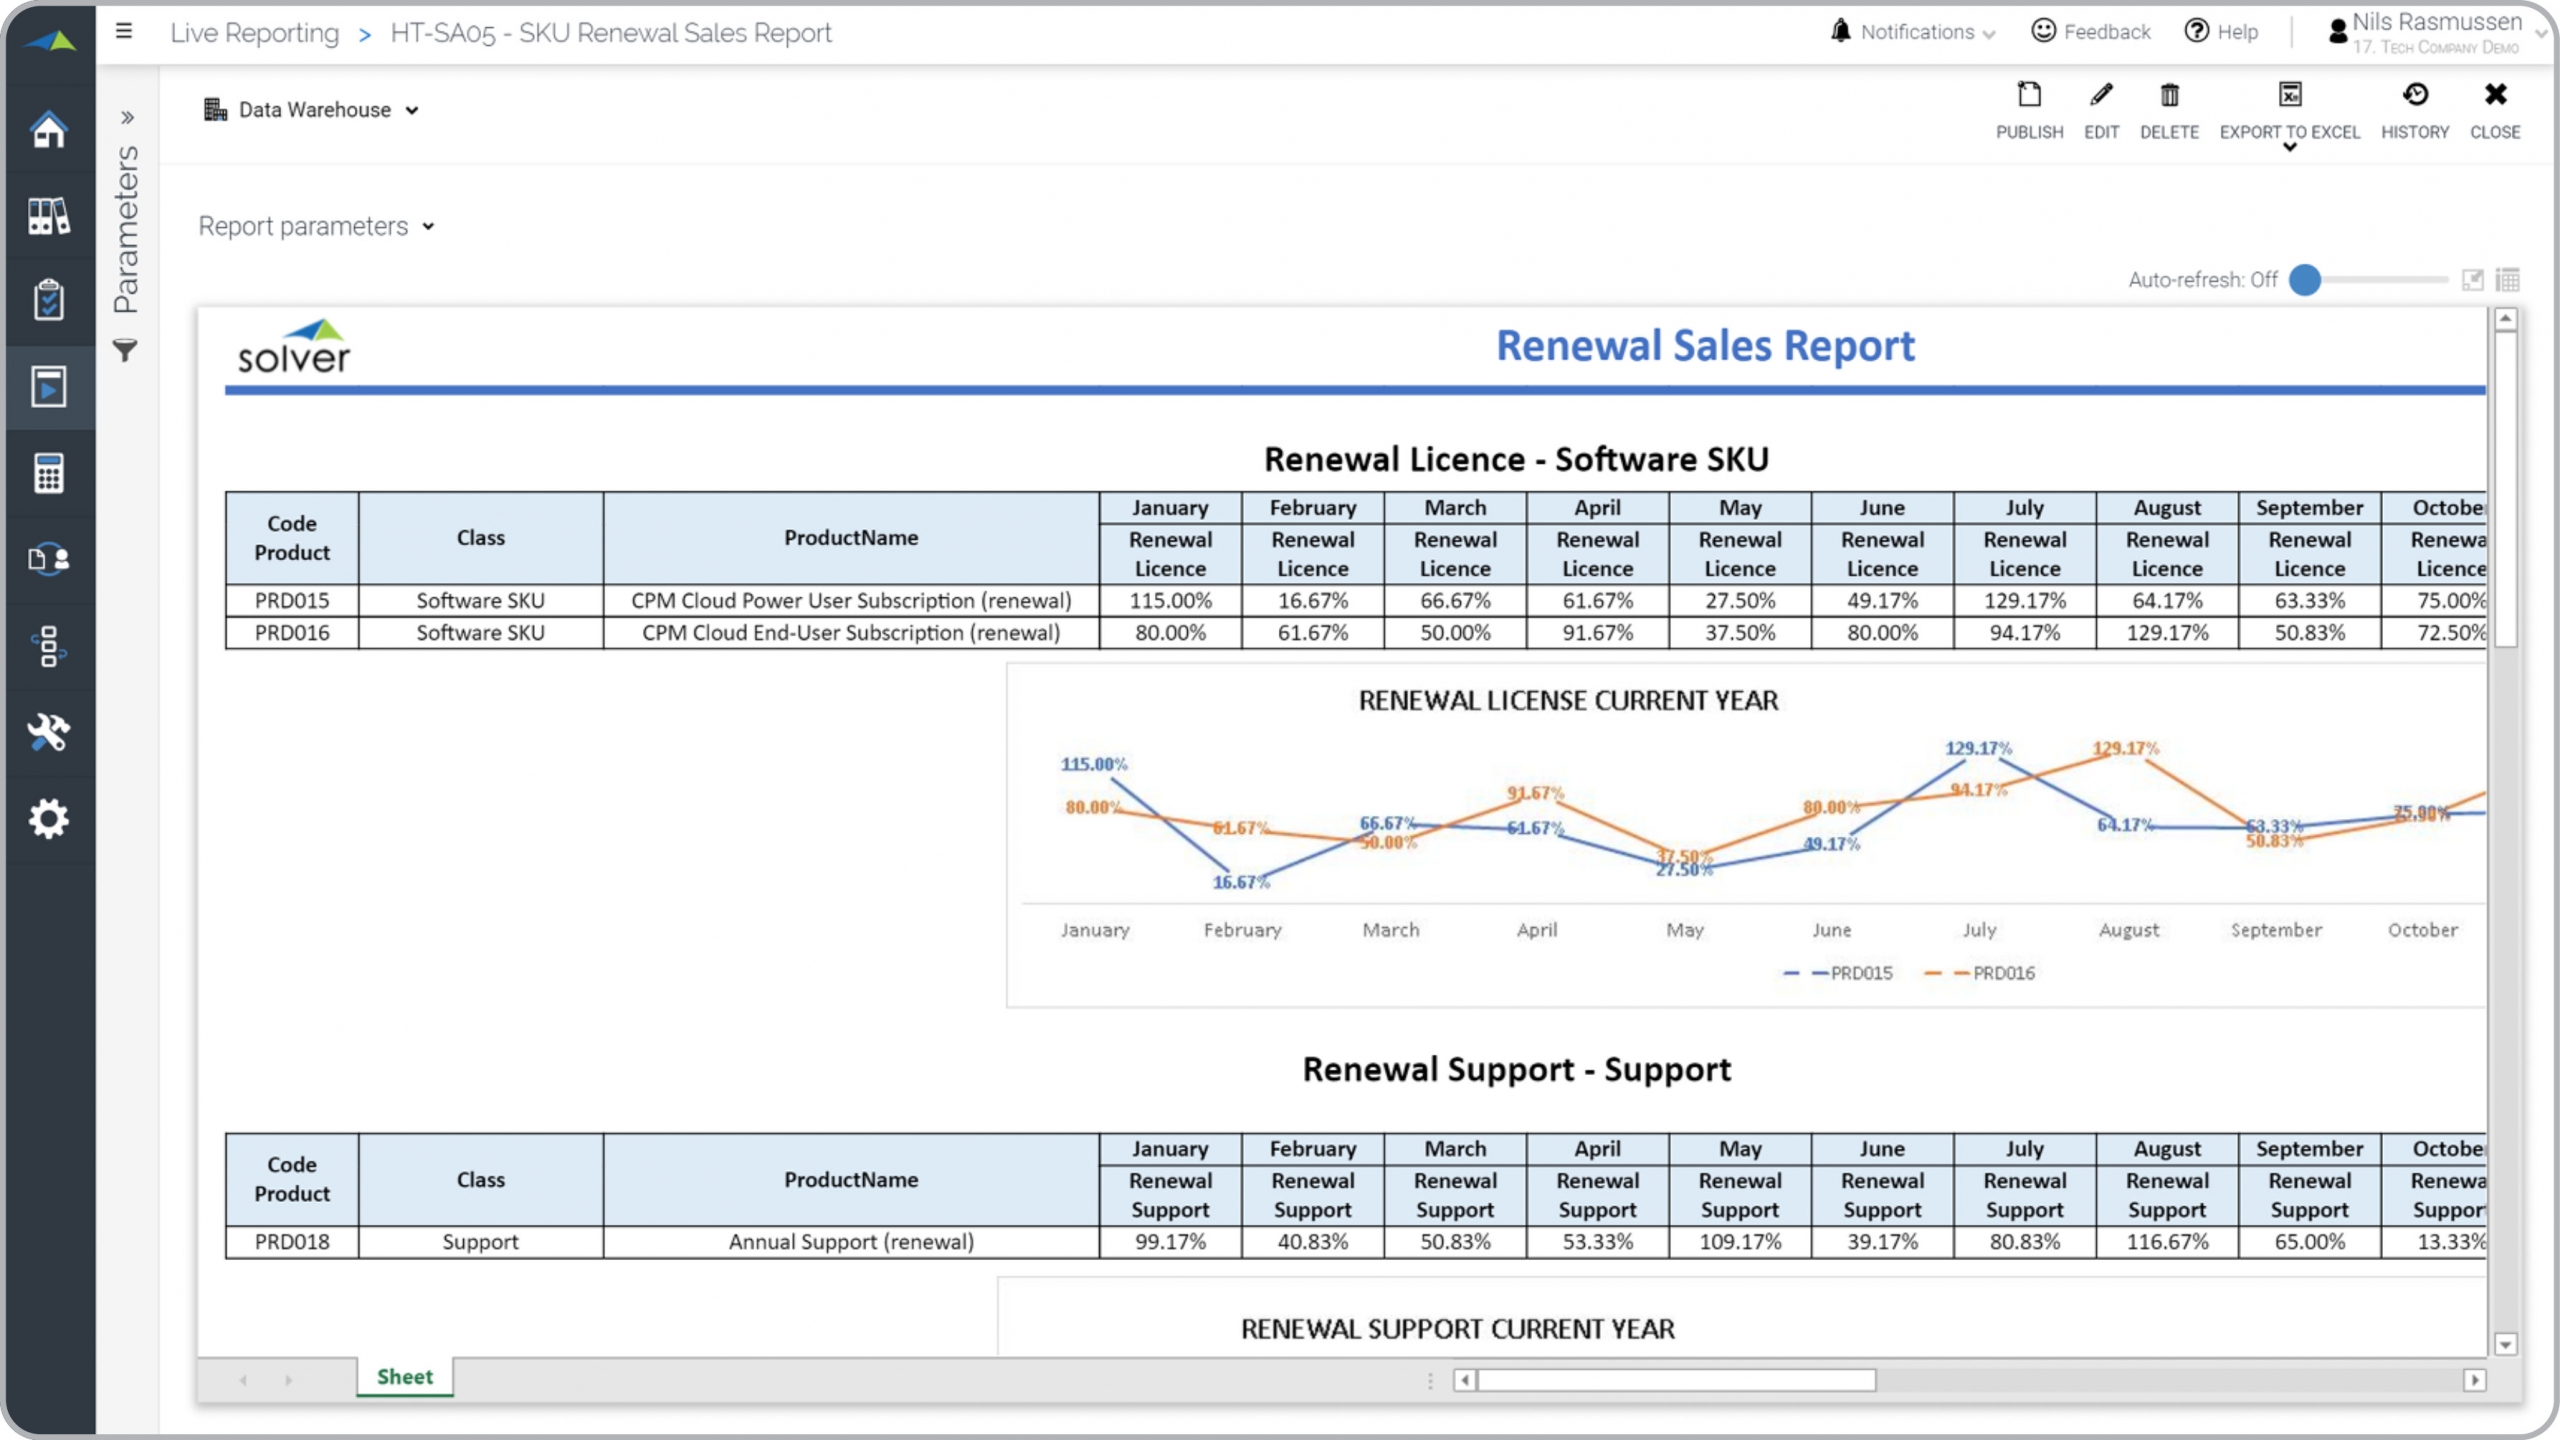
Tech – License Renewal Revenue
Monthly report showing renewal sales for product licenses and support.
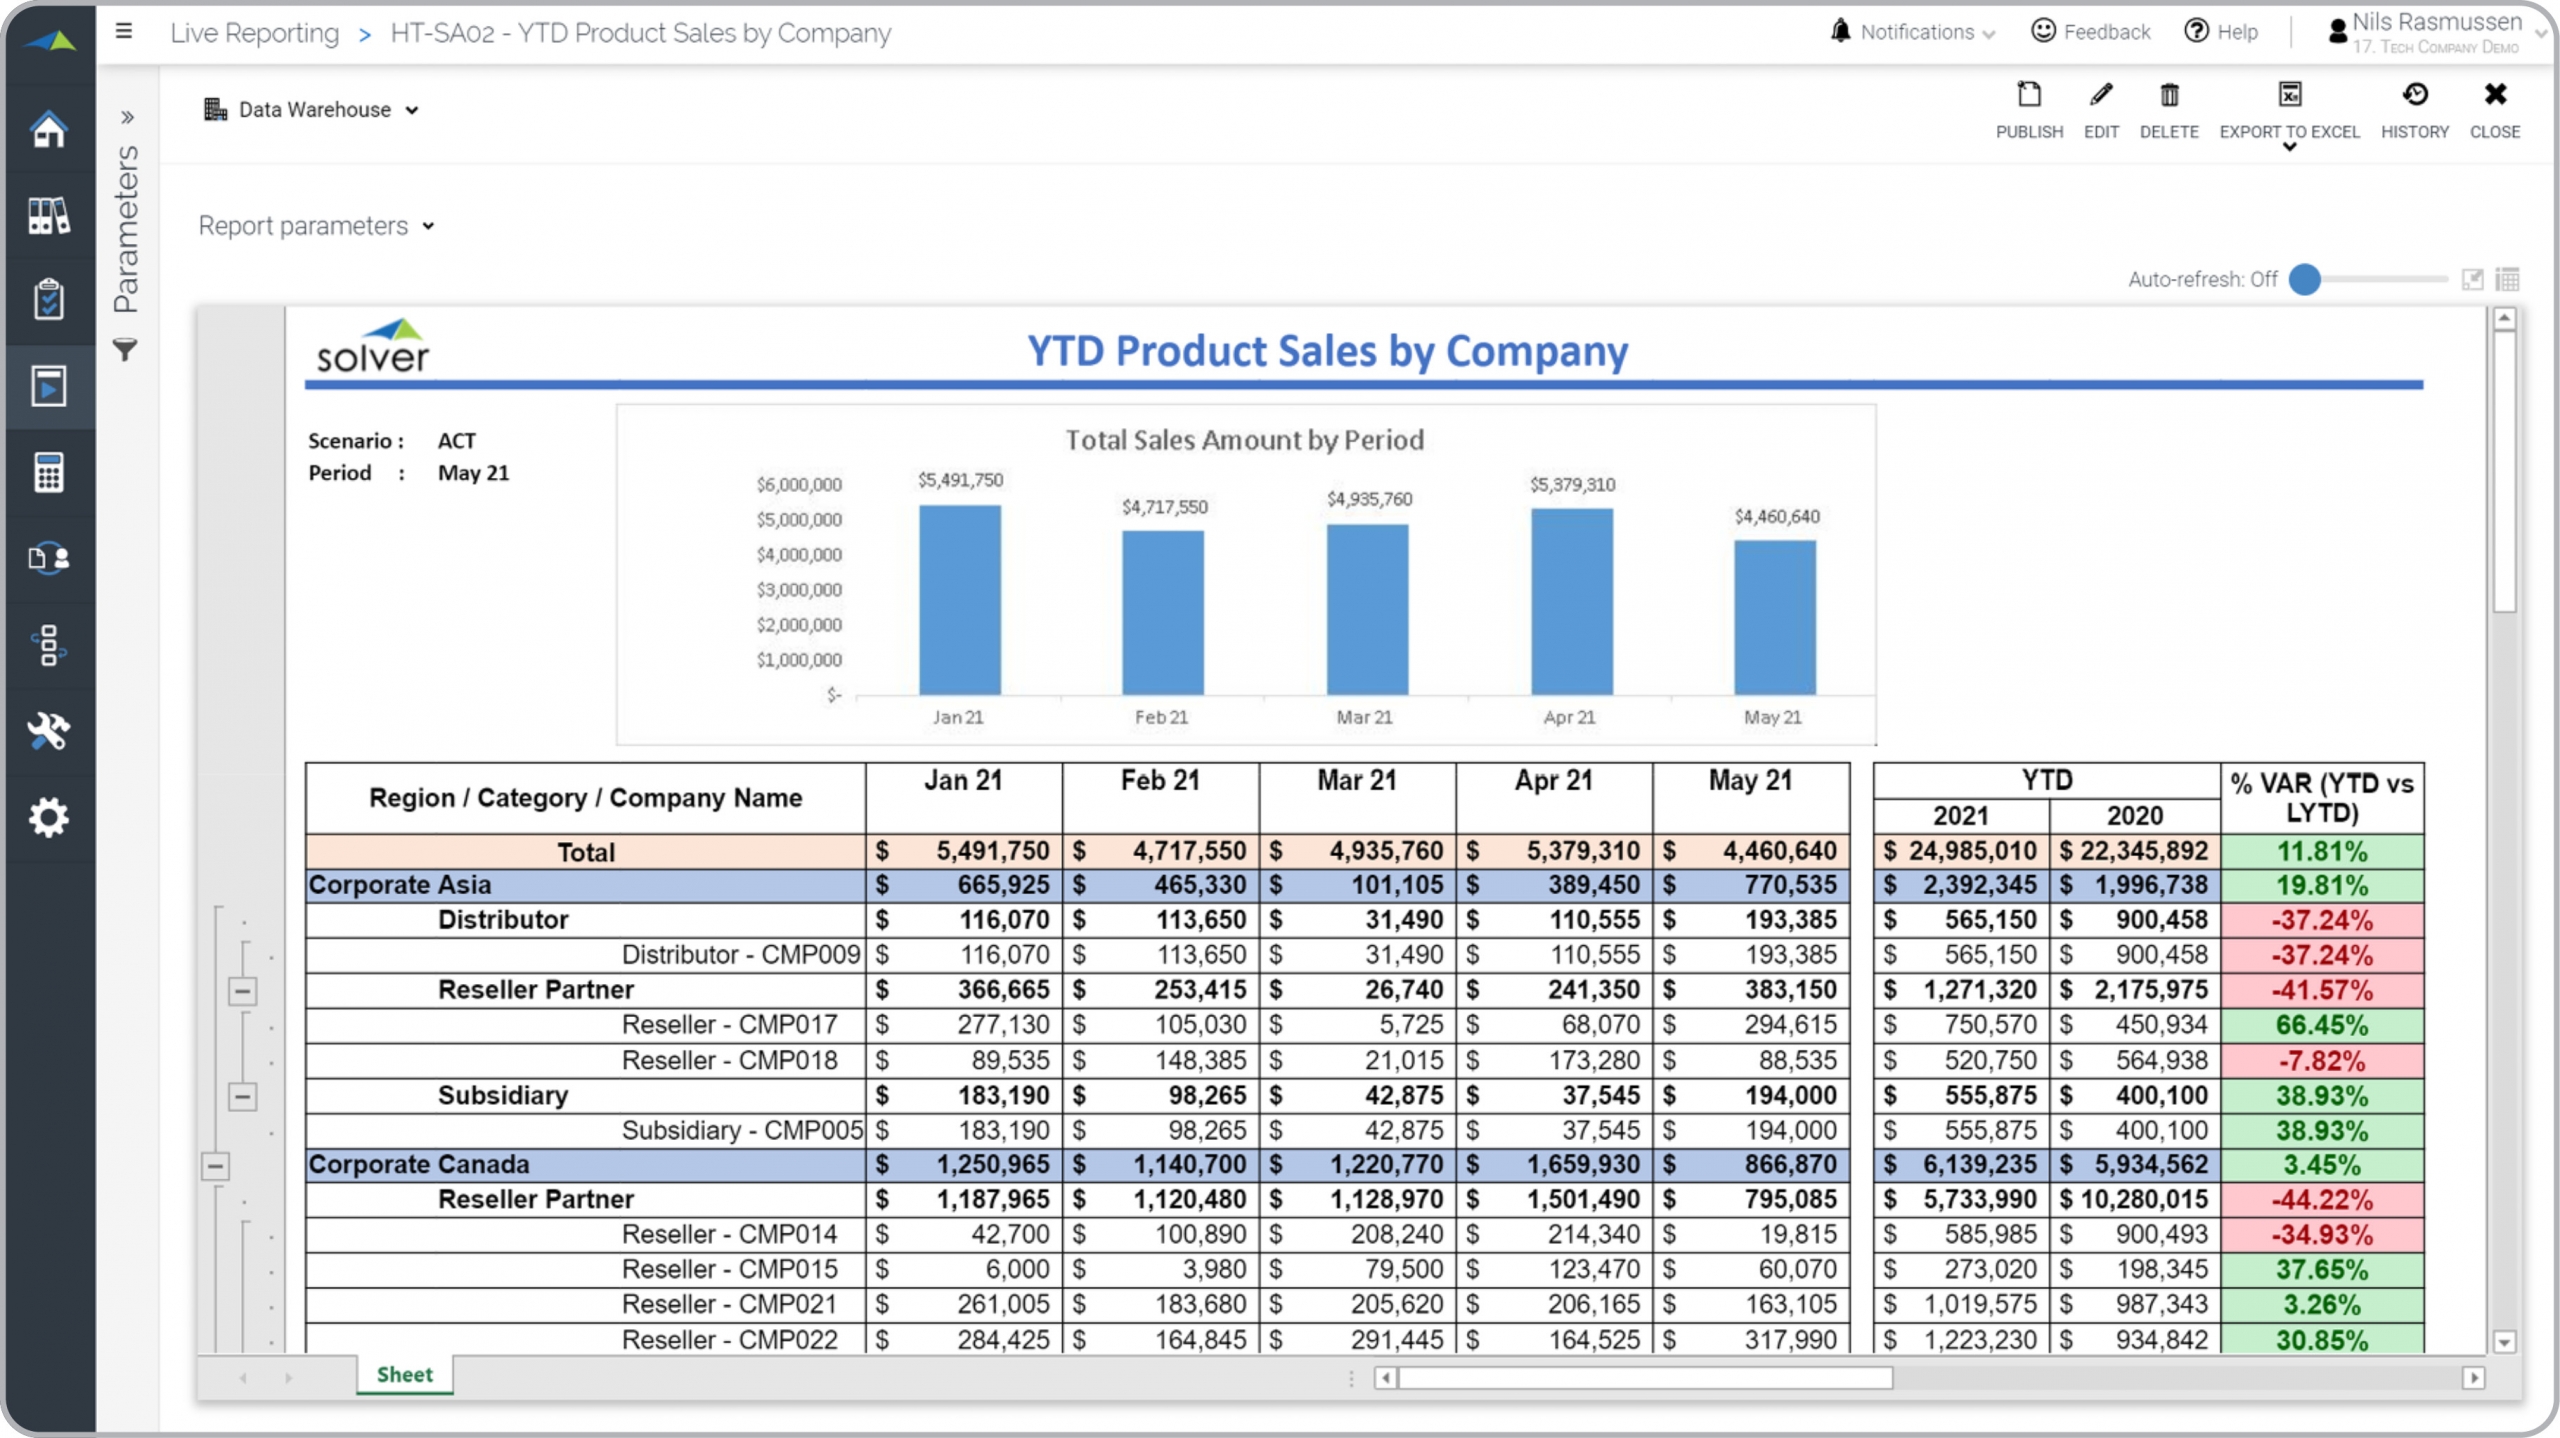
Tech – YTD Sales Trend
Shows monthly and YTD sales by product with reporting of variance vs prior year.
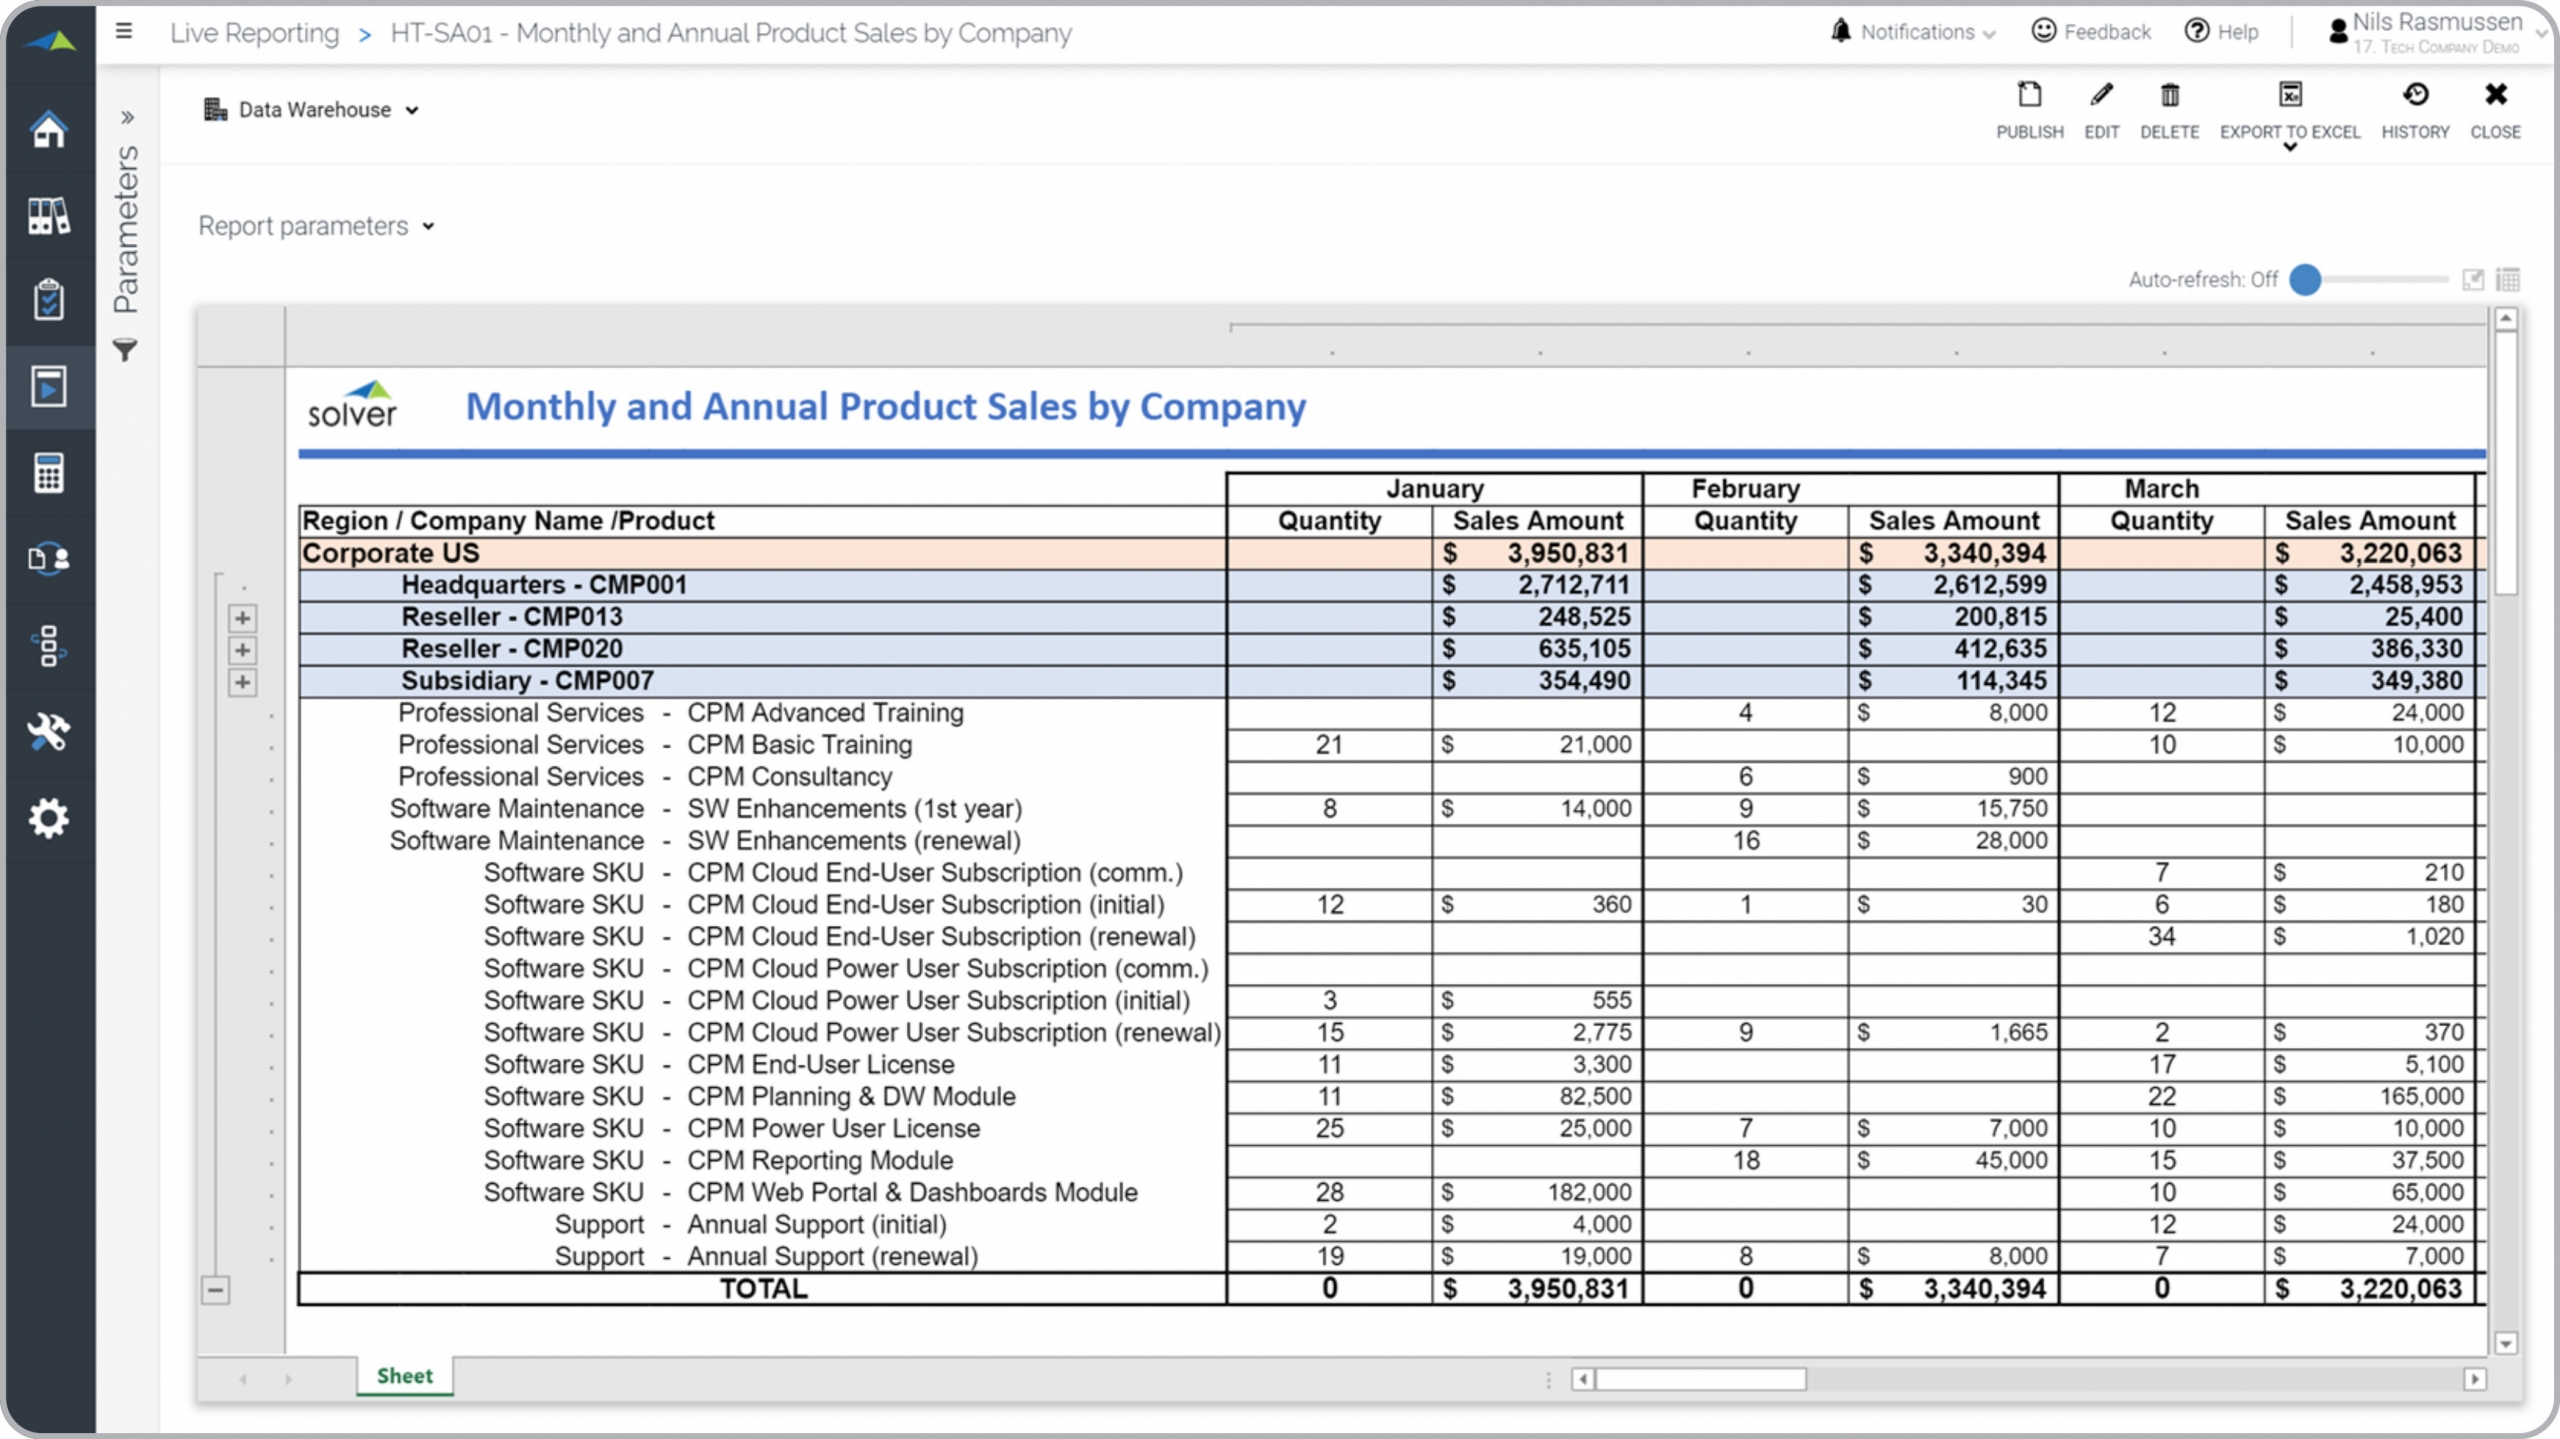
Tech – Monthly Product Sales
Sales report showing monthly sales quantity and amount per company, region and product.
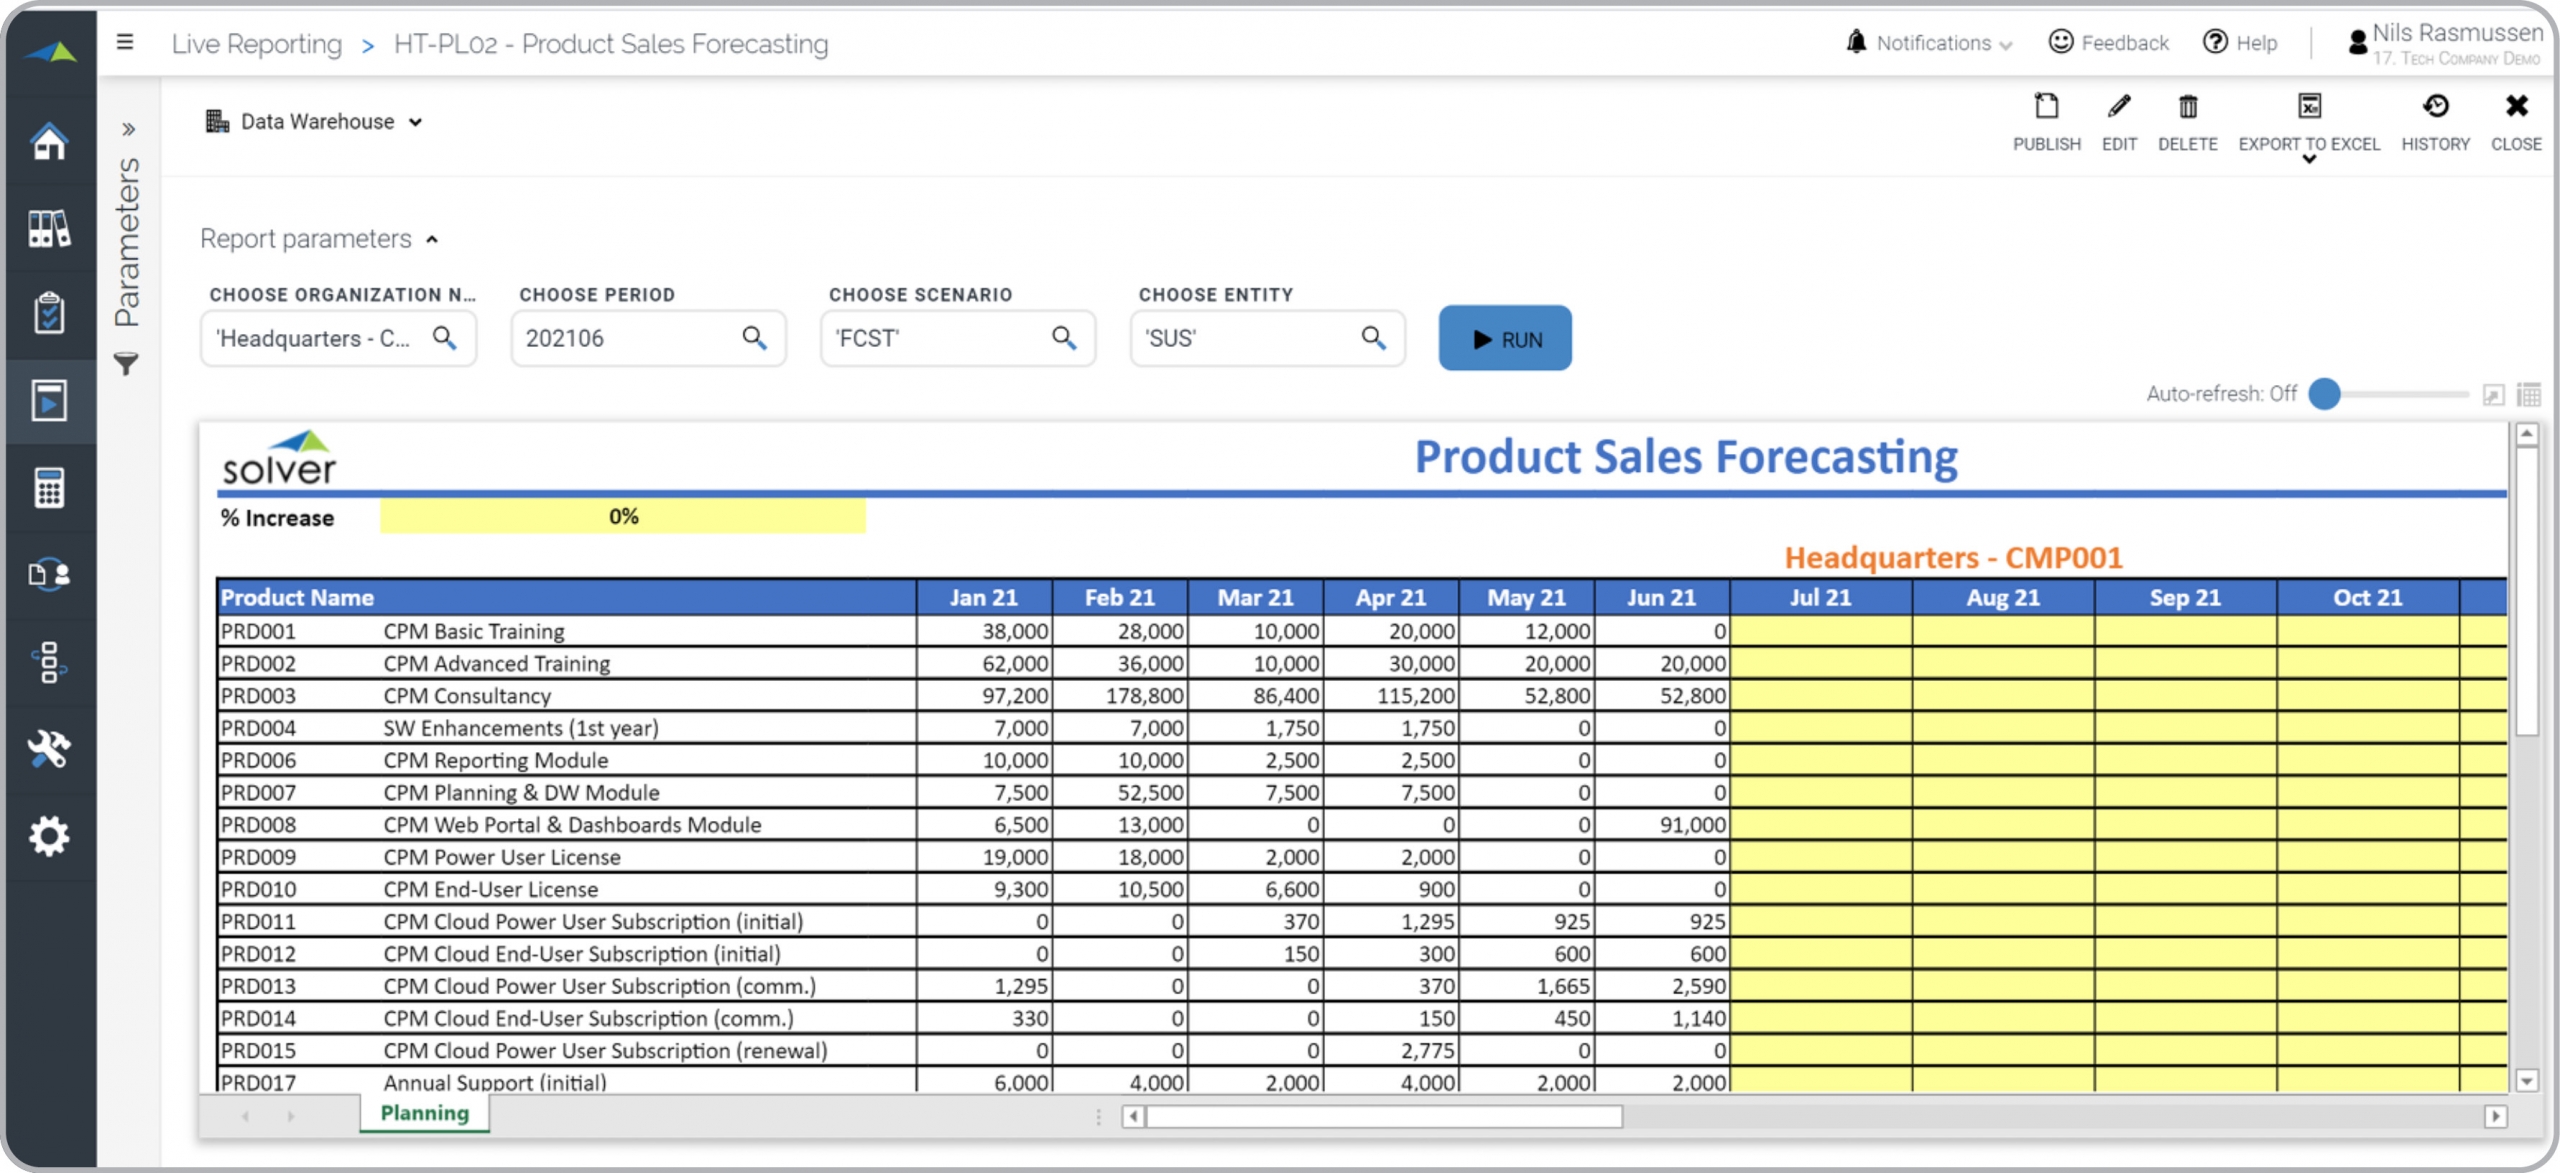
Tech – Sales Forecast
Sales forecast per product showing actual YTD and provides input for remaining months.
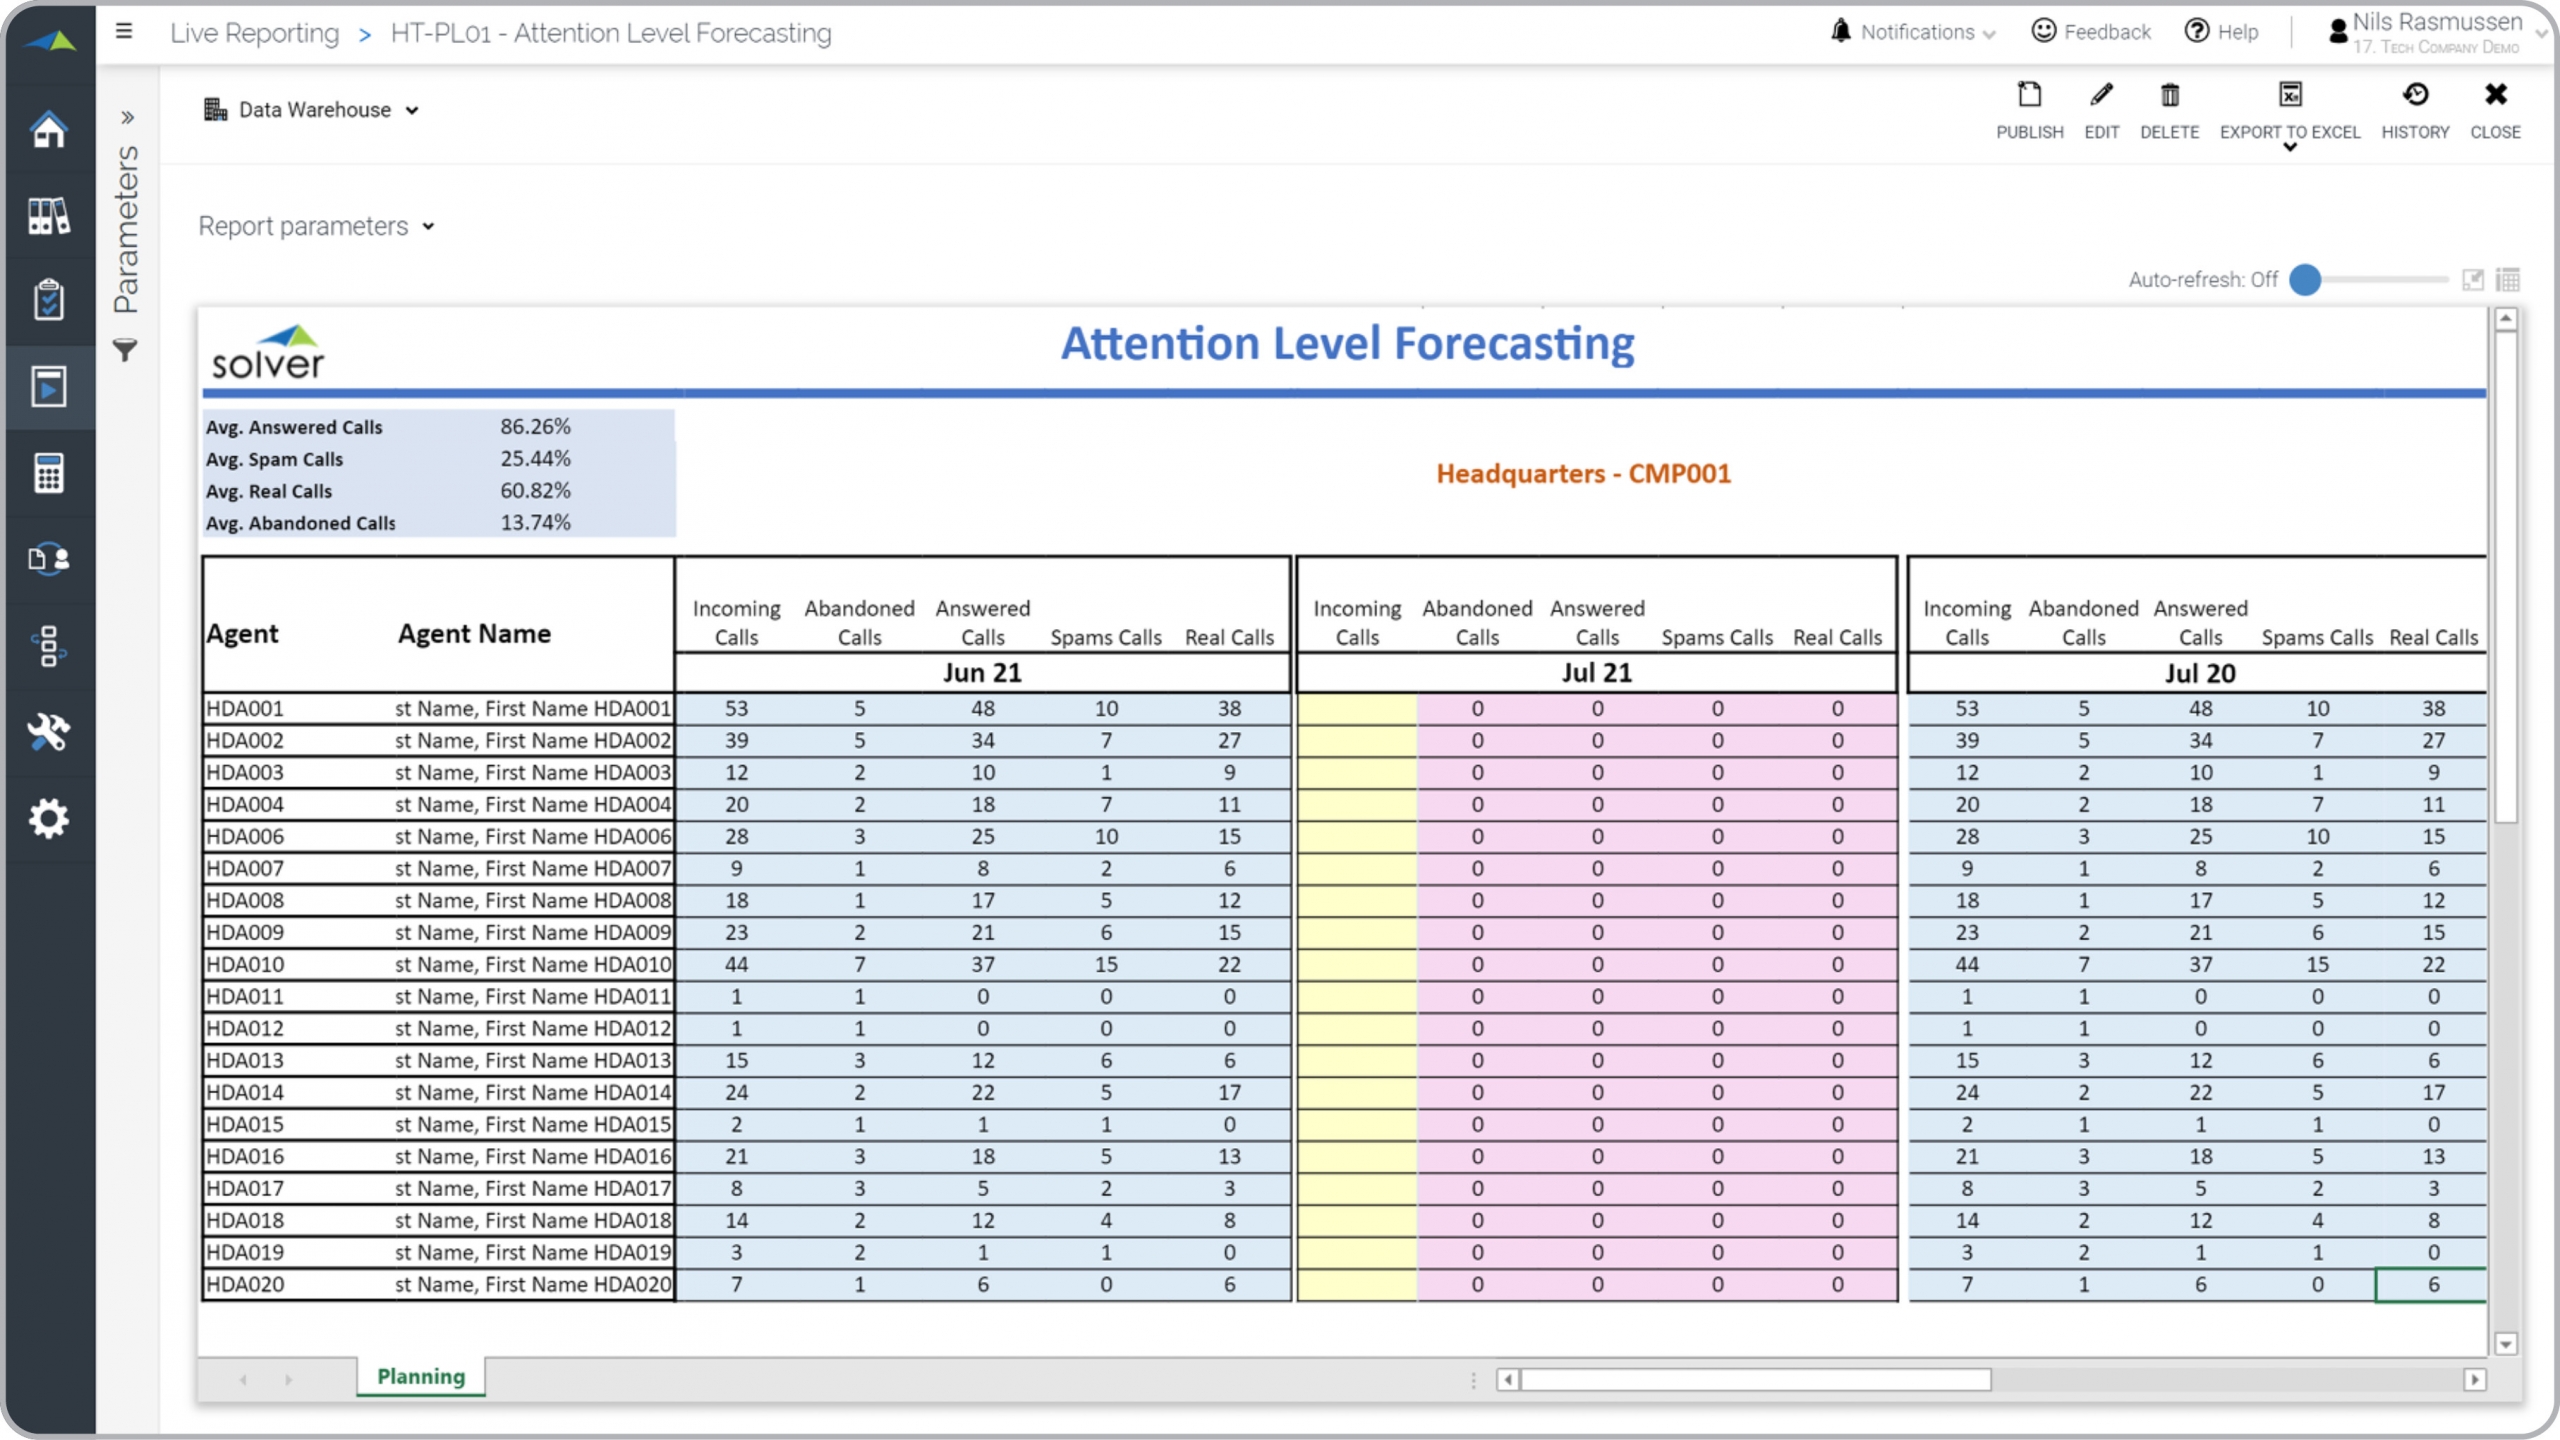
Tech – Help Desk Service Goals
Forecast report that sets productivity goals for per help desk agent.
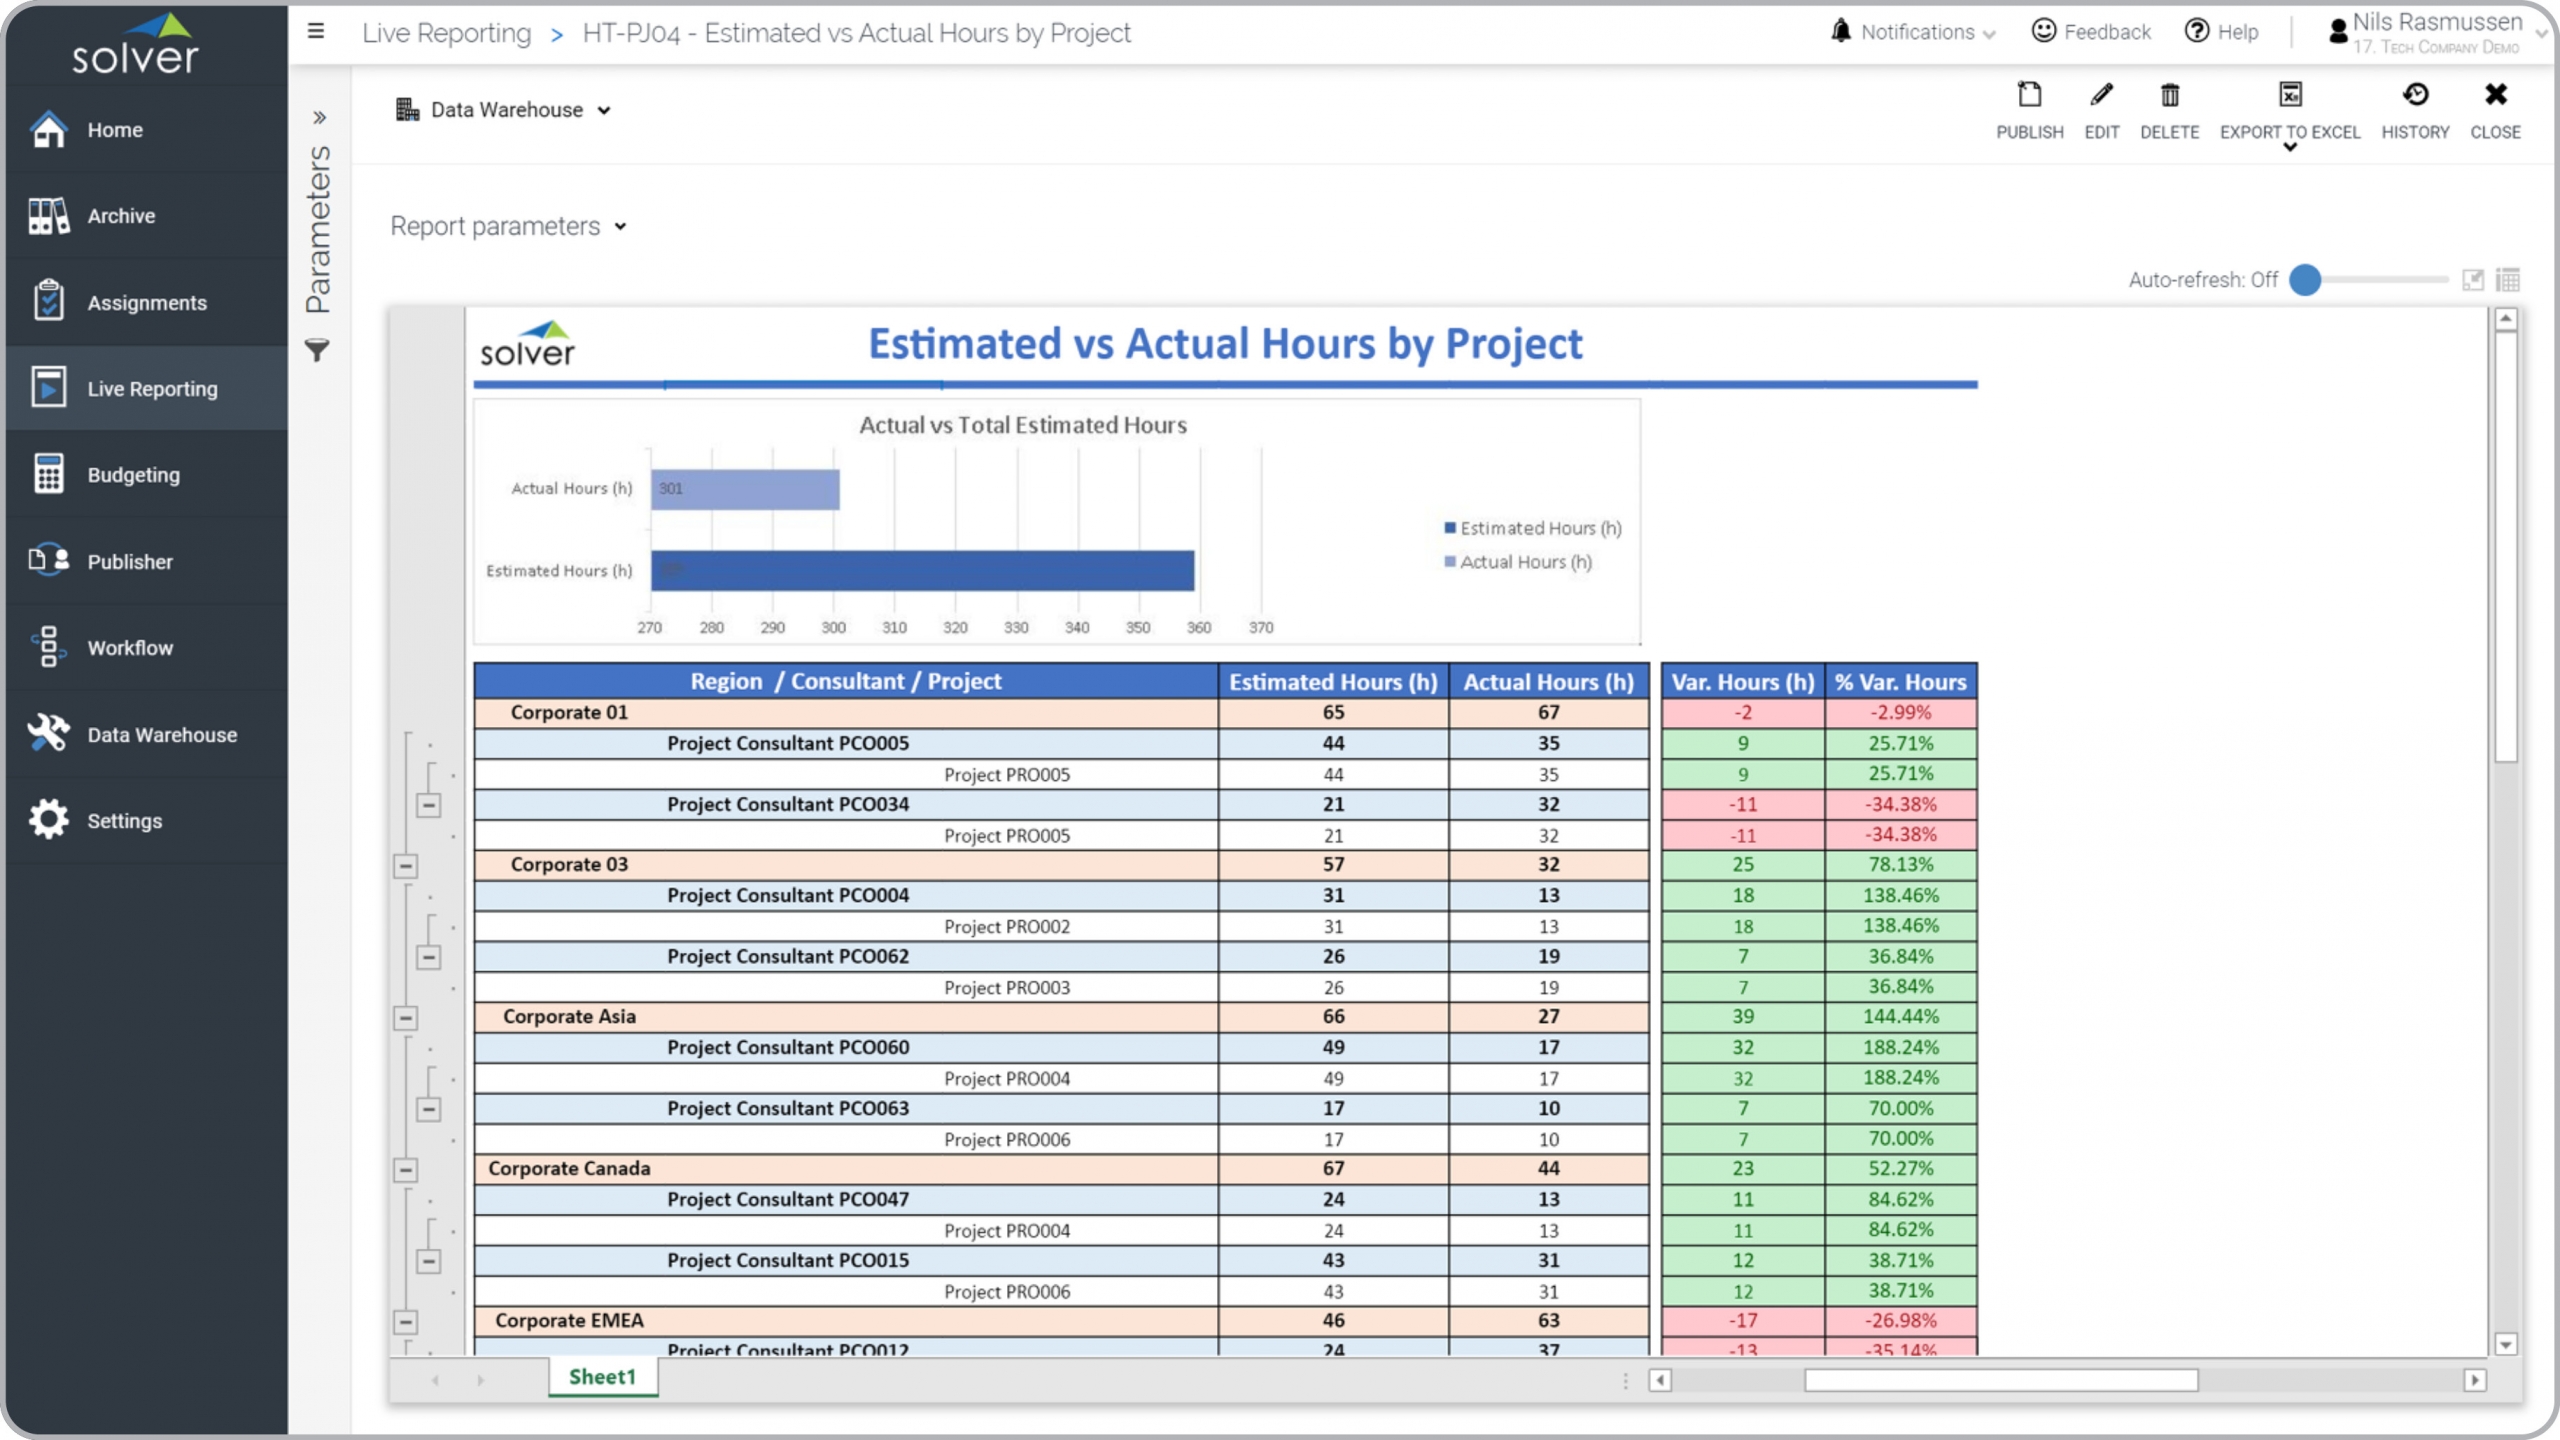
Tech – Project Hours Analysis
Report shows Estimated and Actual hours per project with variance reporting.
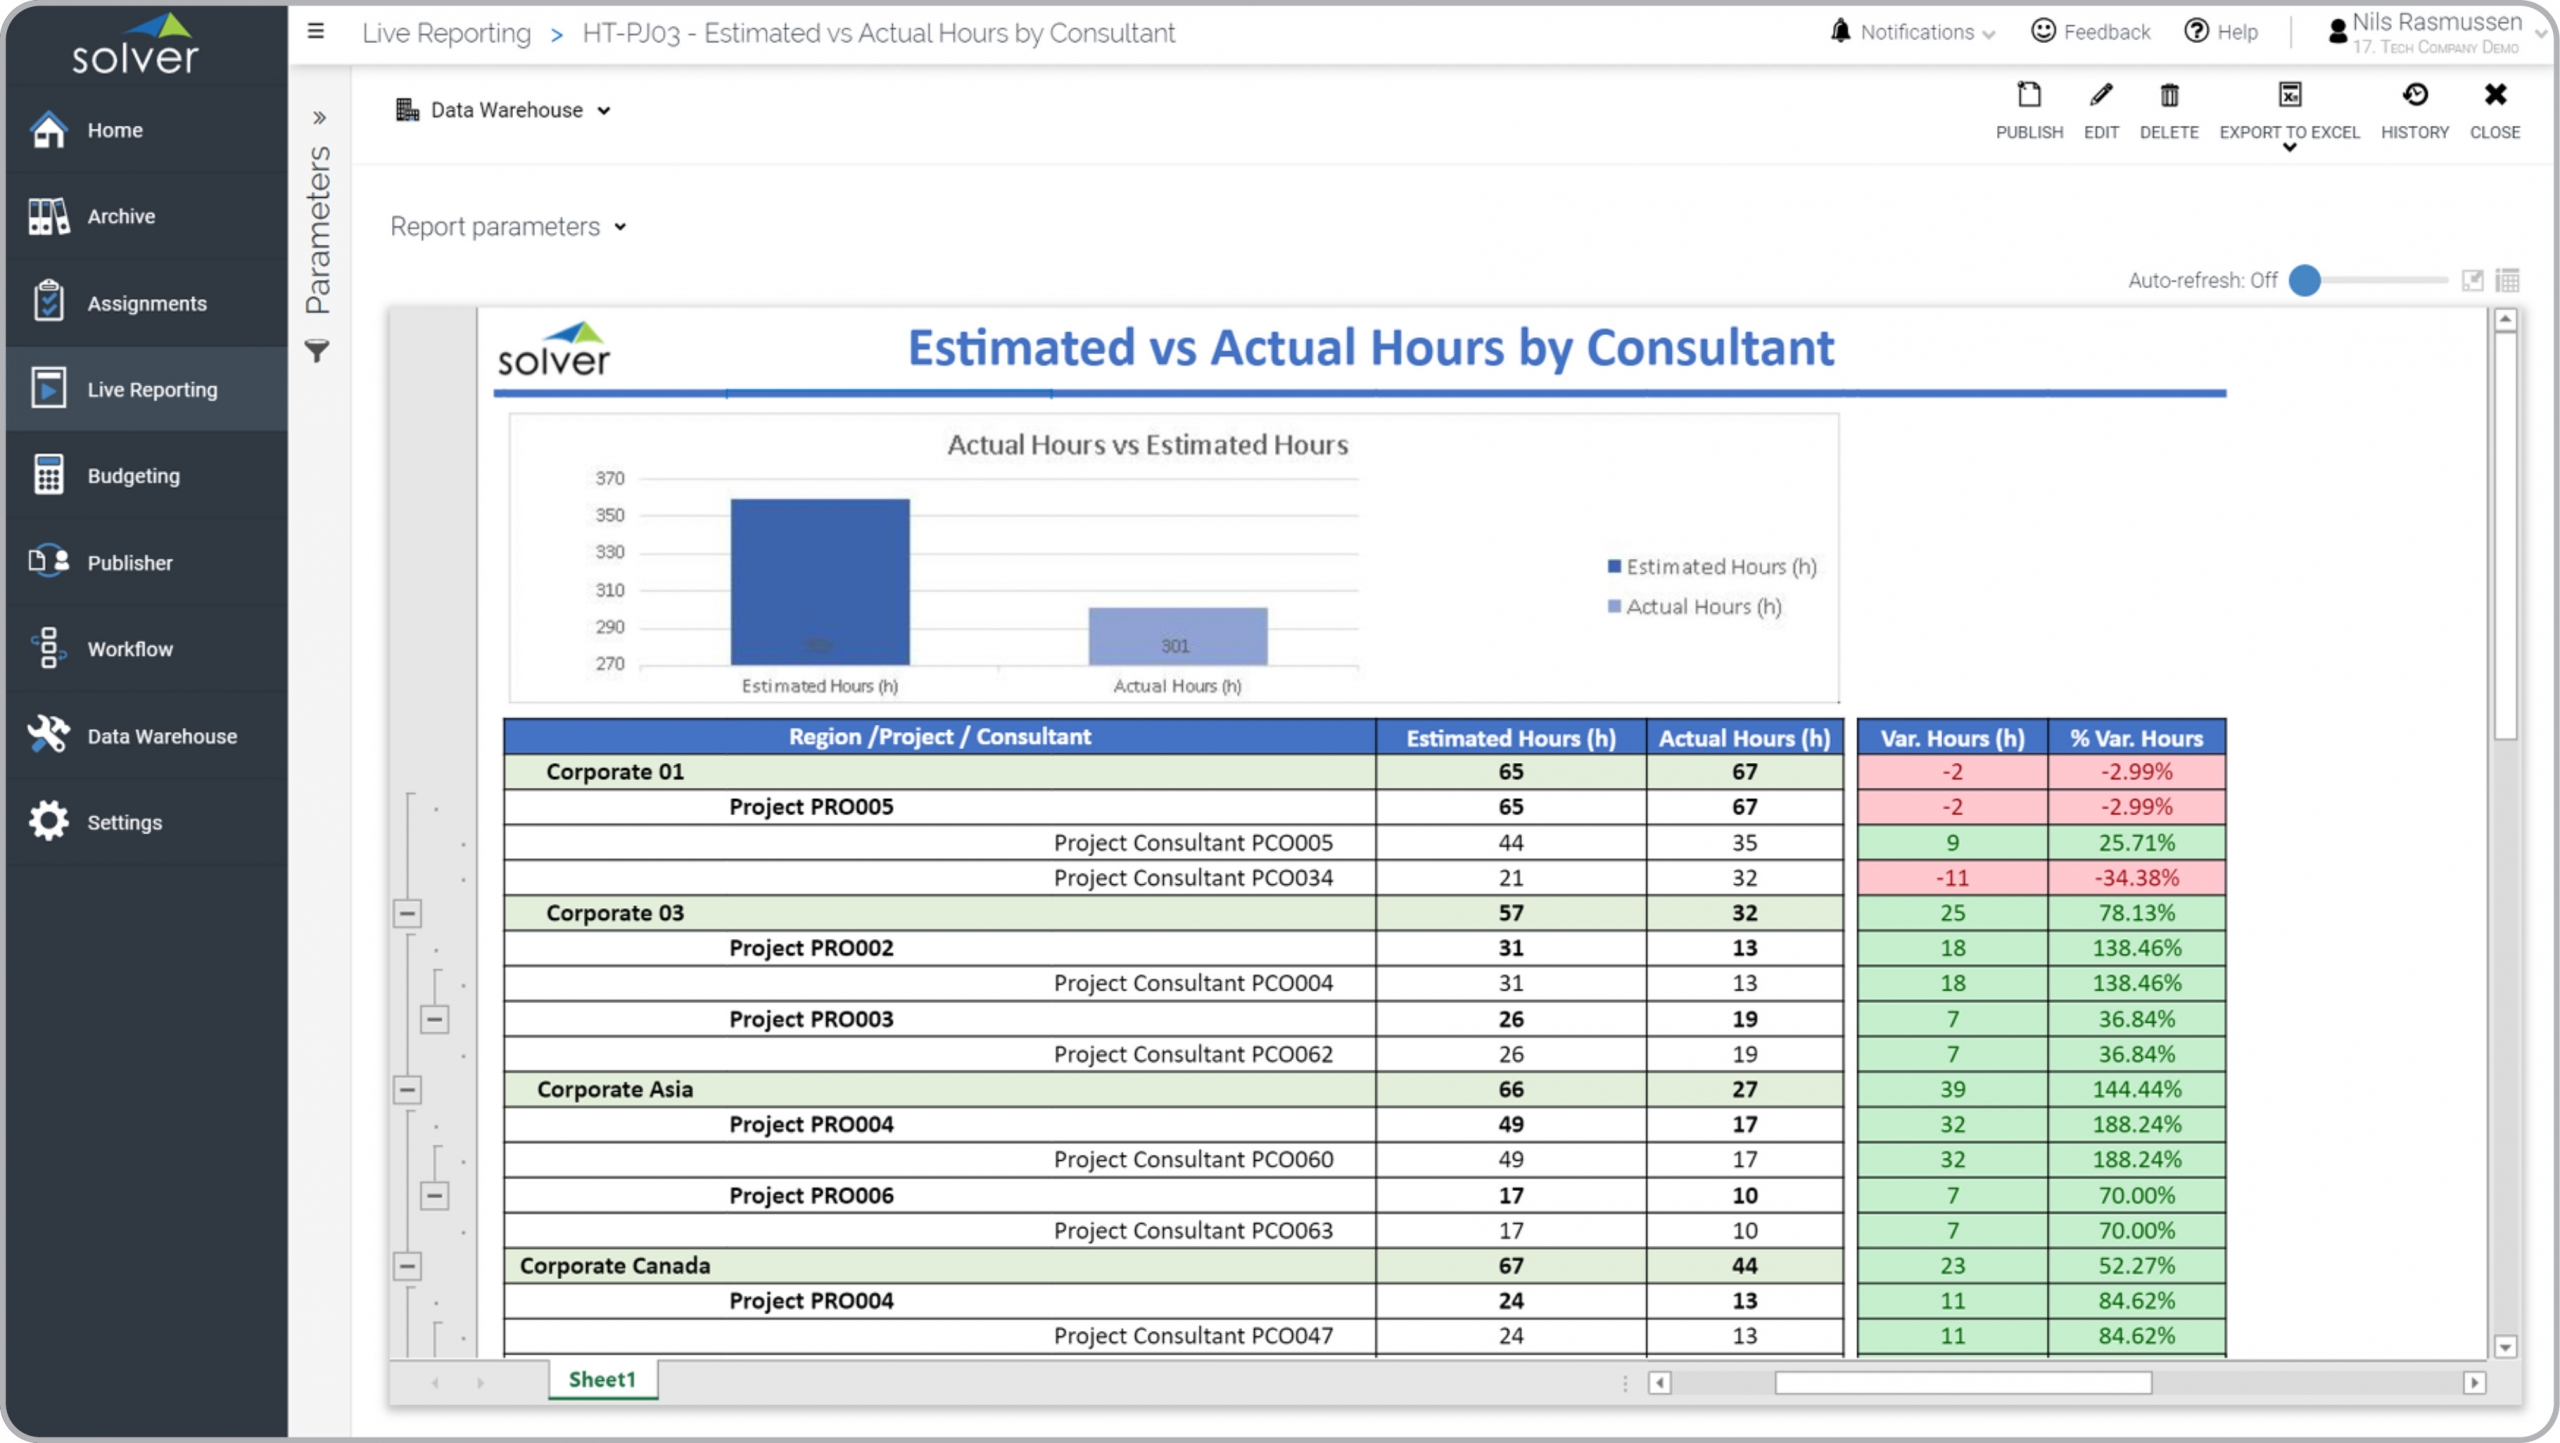
Tech – Consultant Hours Analysis
Estimated and Actual hours per consultant with variance reporting.
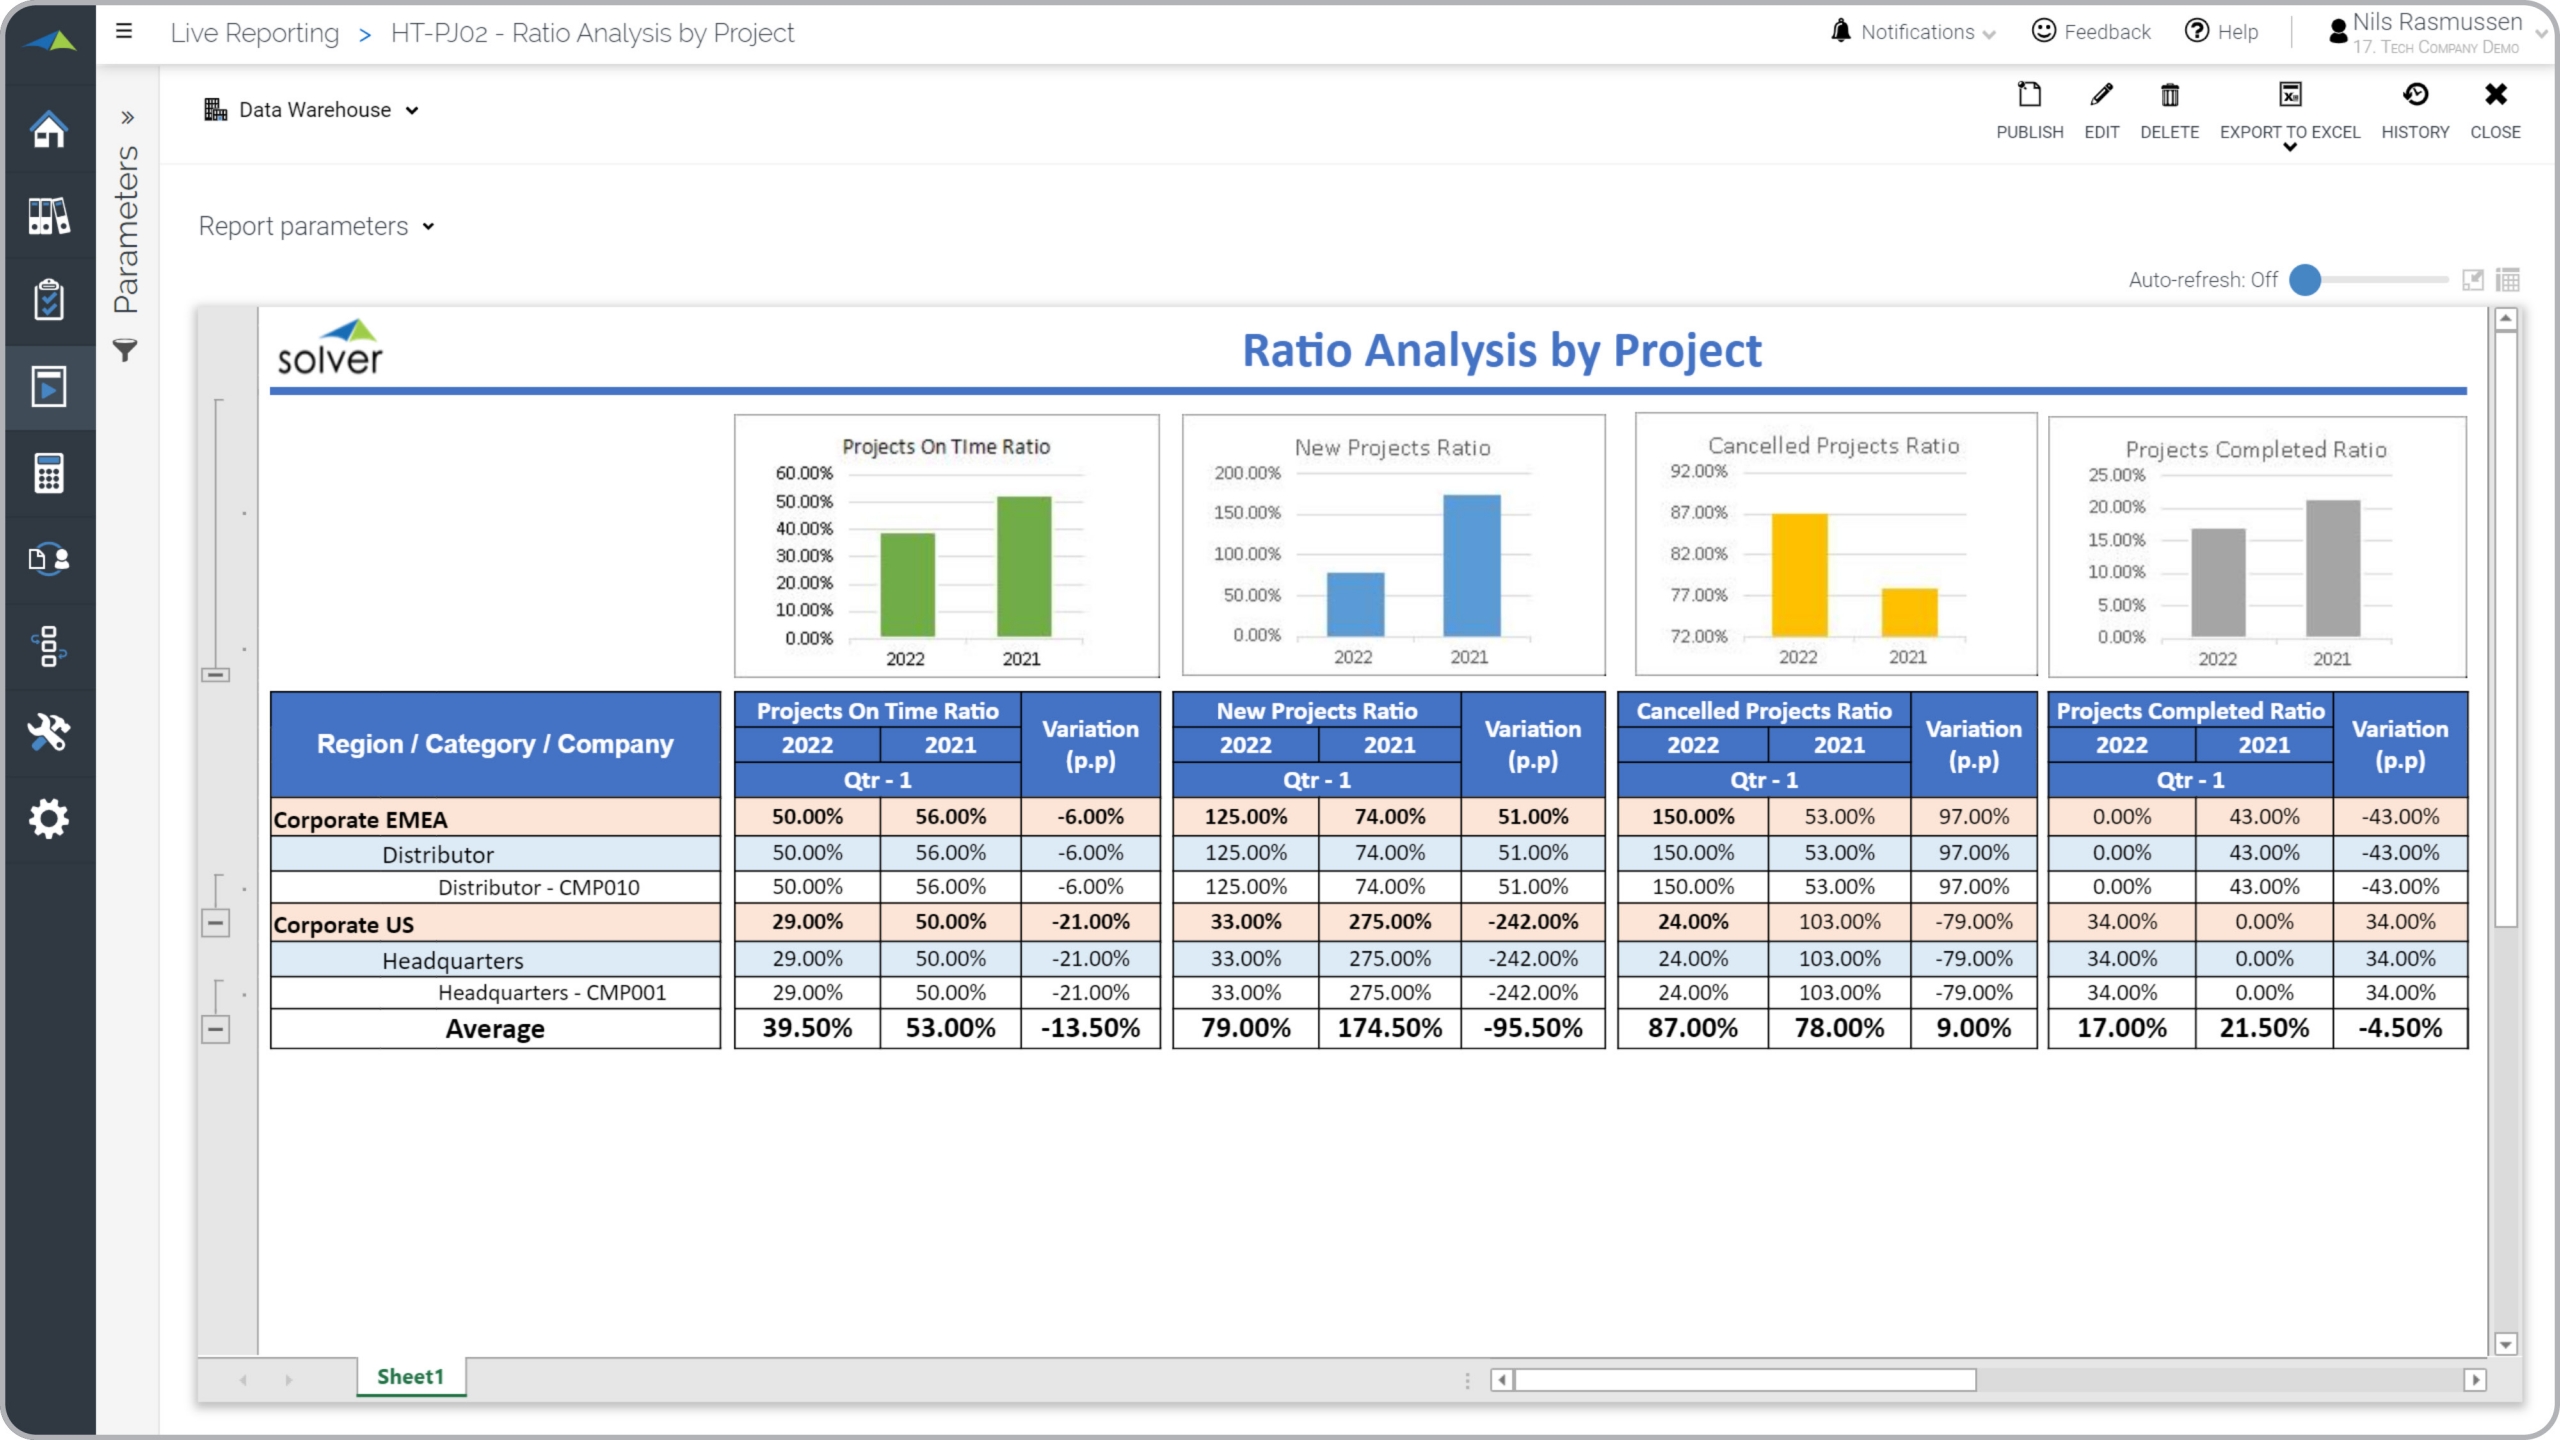
Tech – Project Status Analysis
Report shows current versus PY metrics for new, on-time, cancelled and completed projects.
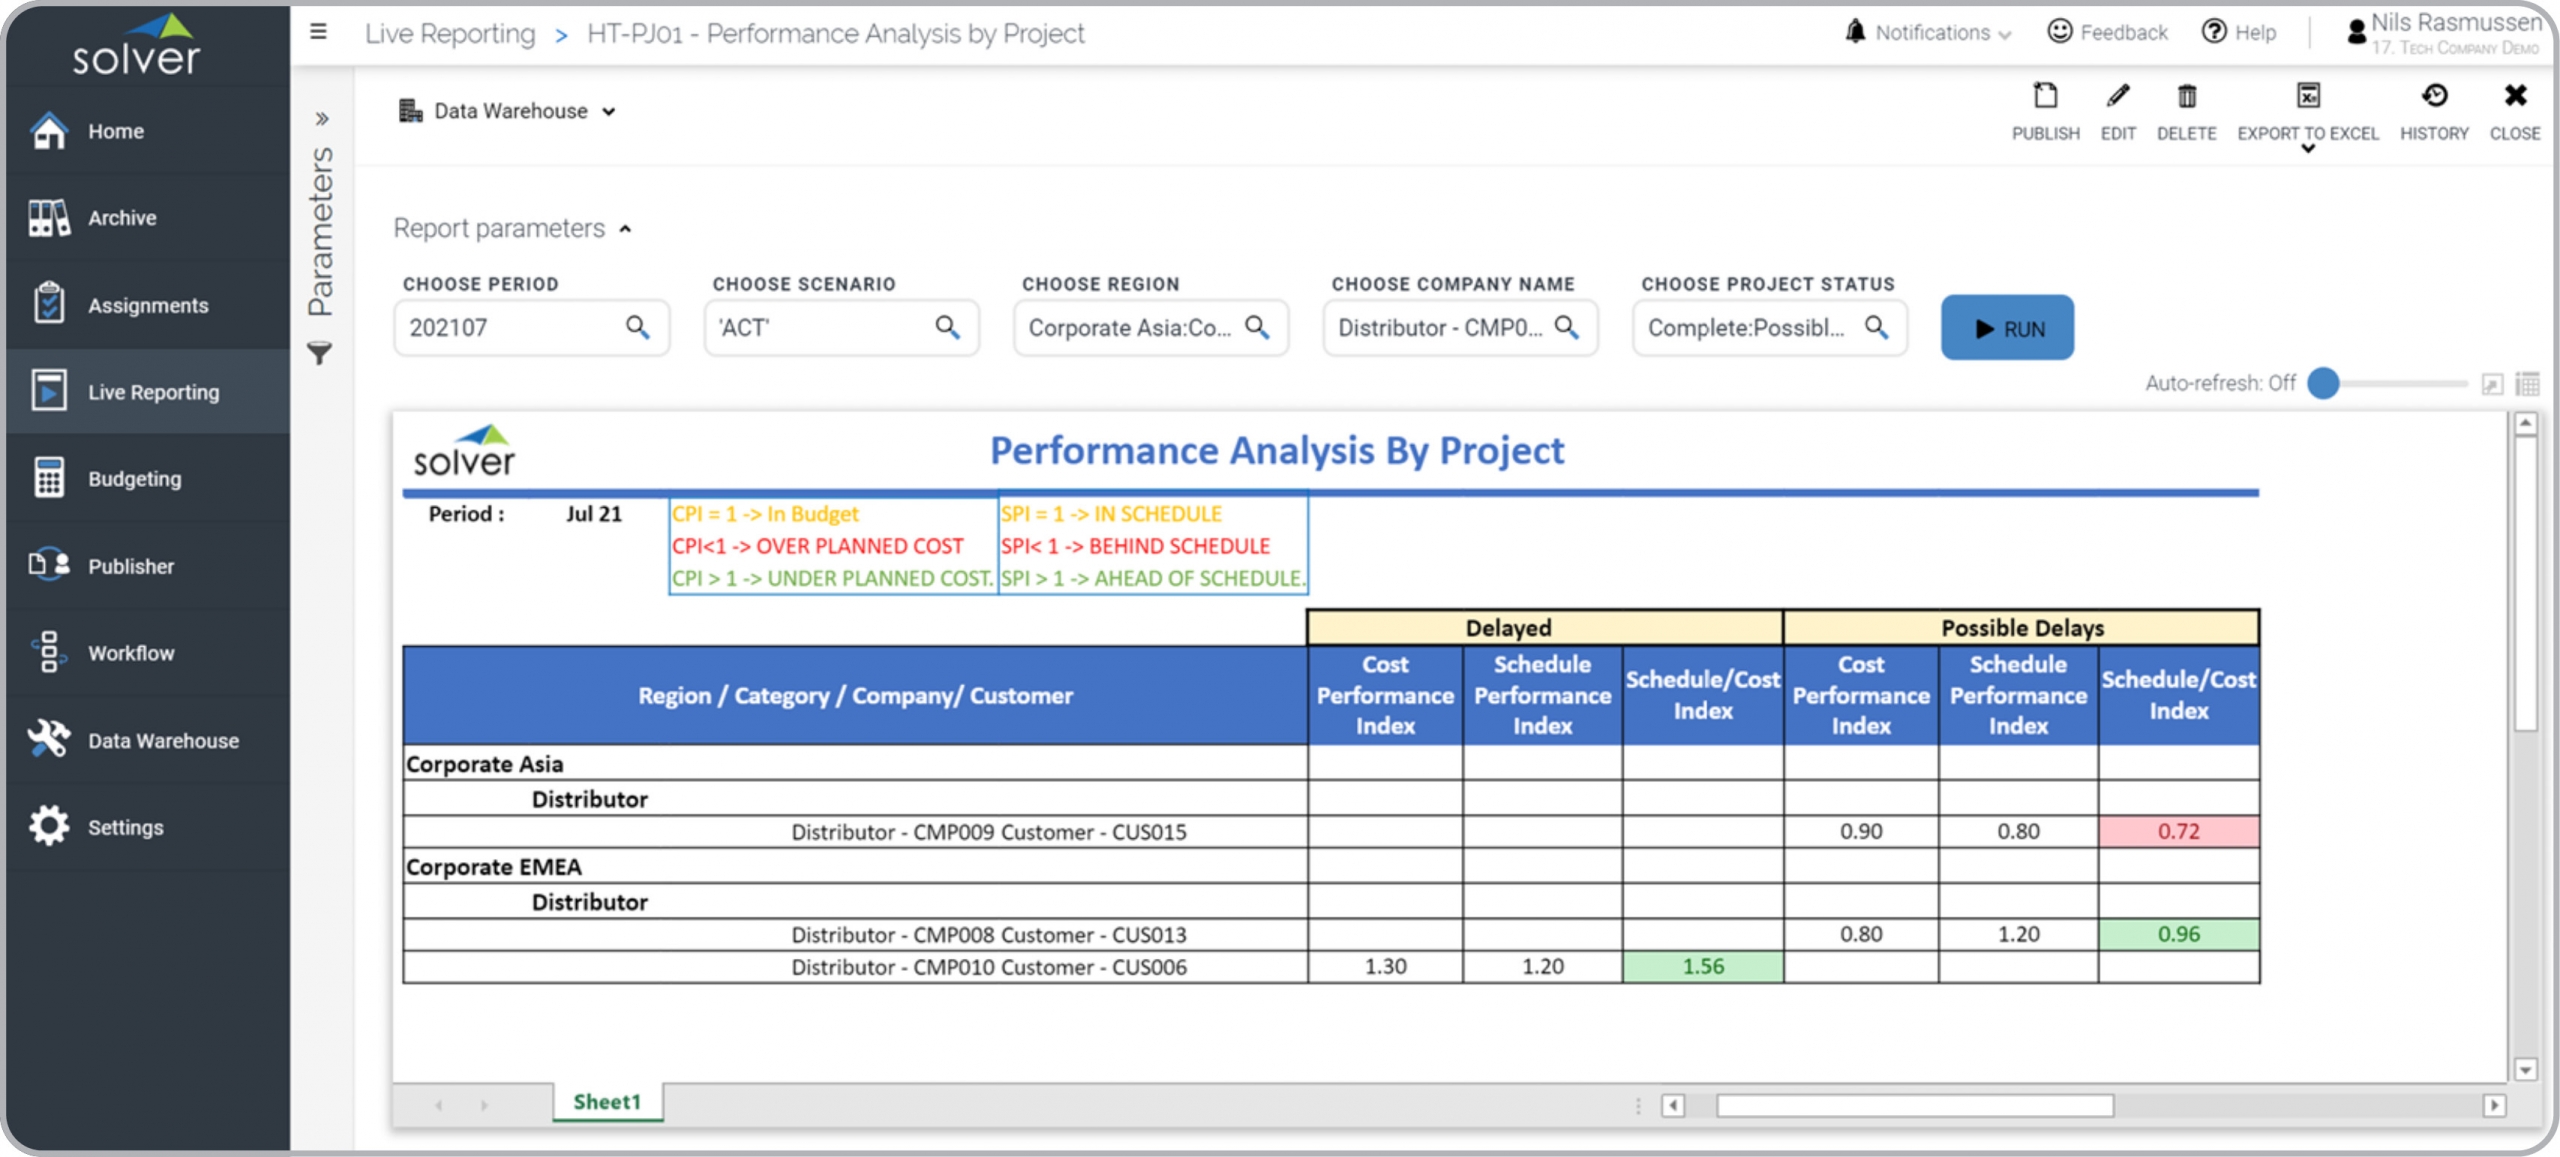
Tech – Project Performance
Scoring of delayed or potentially delayed projects to report risk and support decisions.
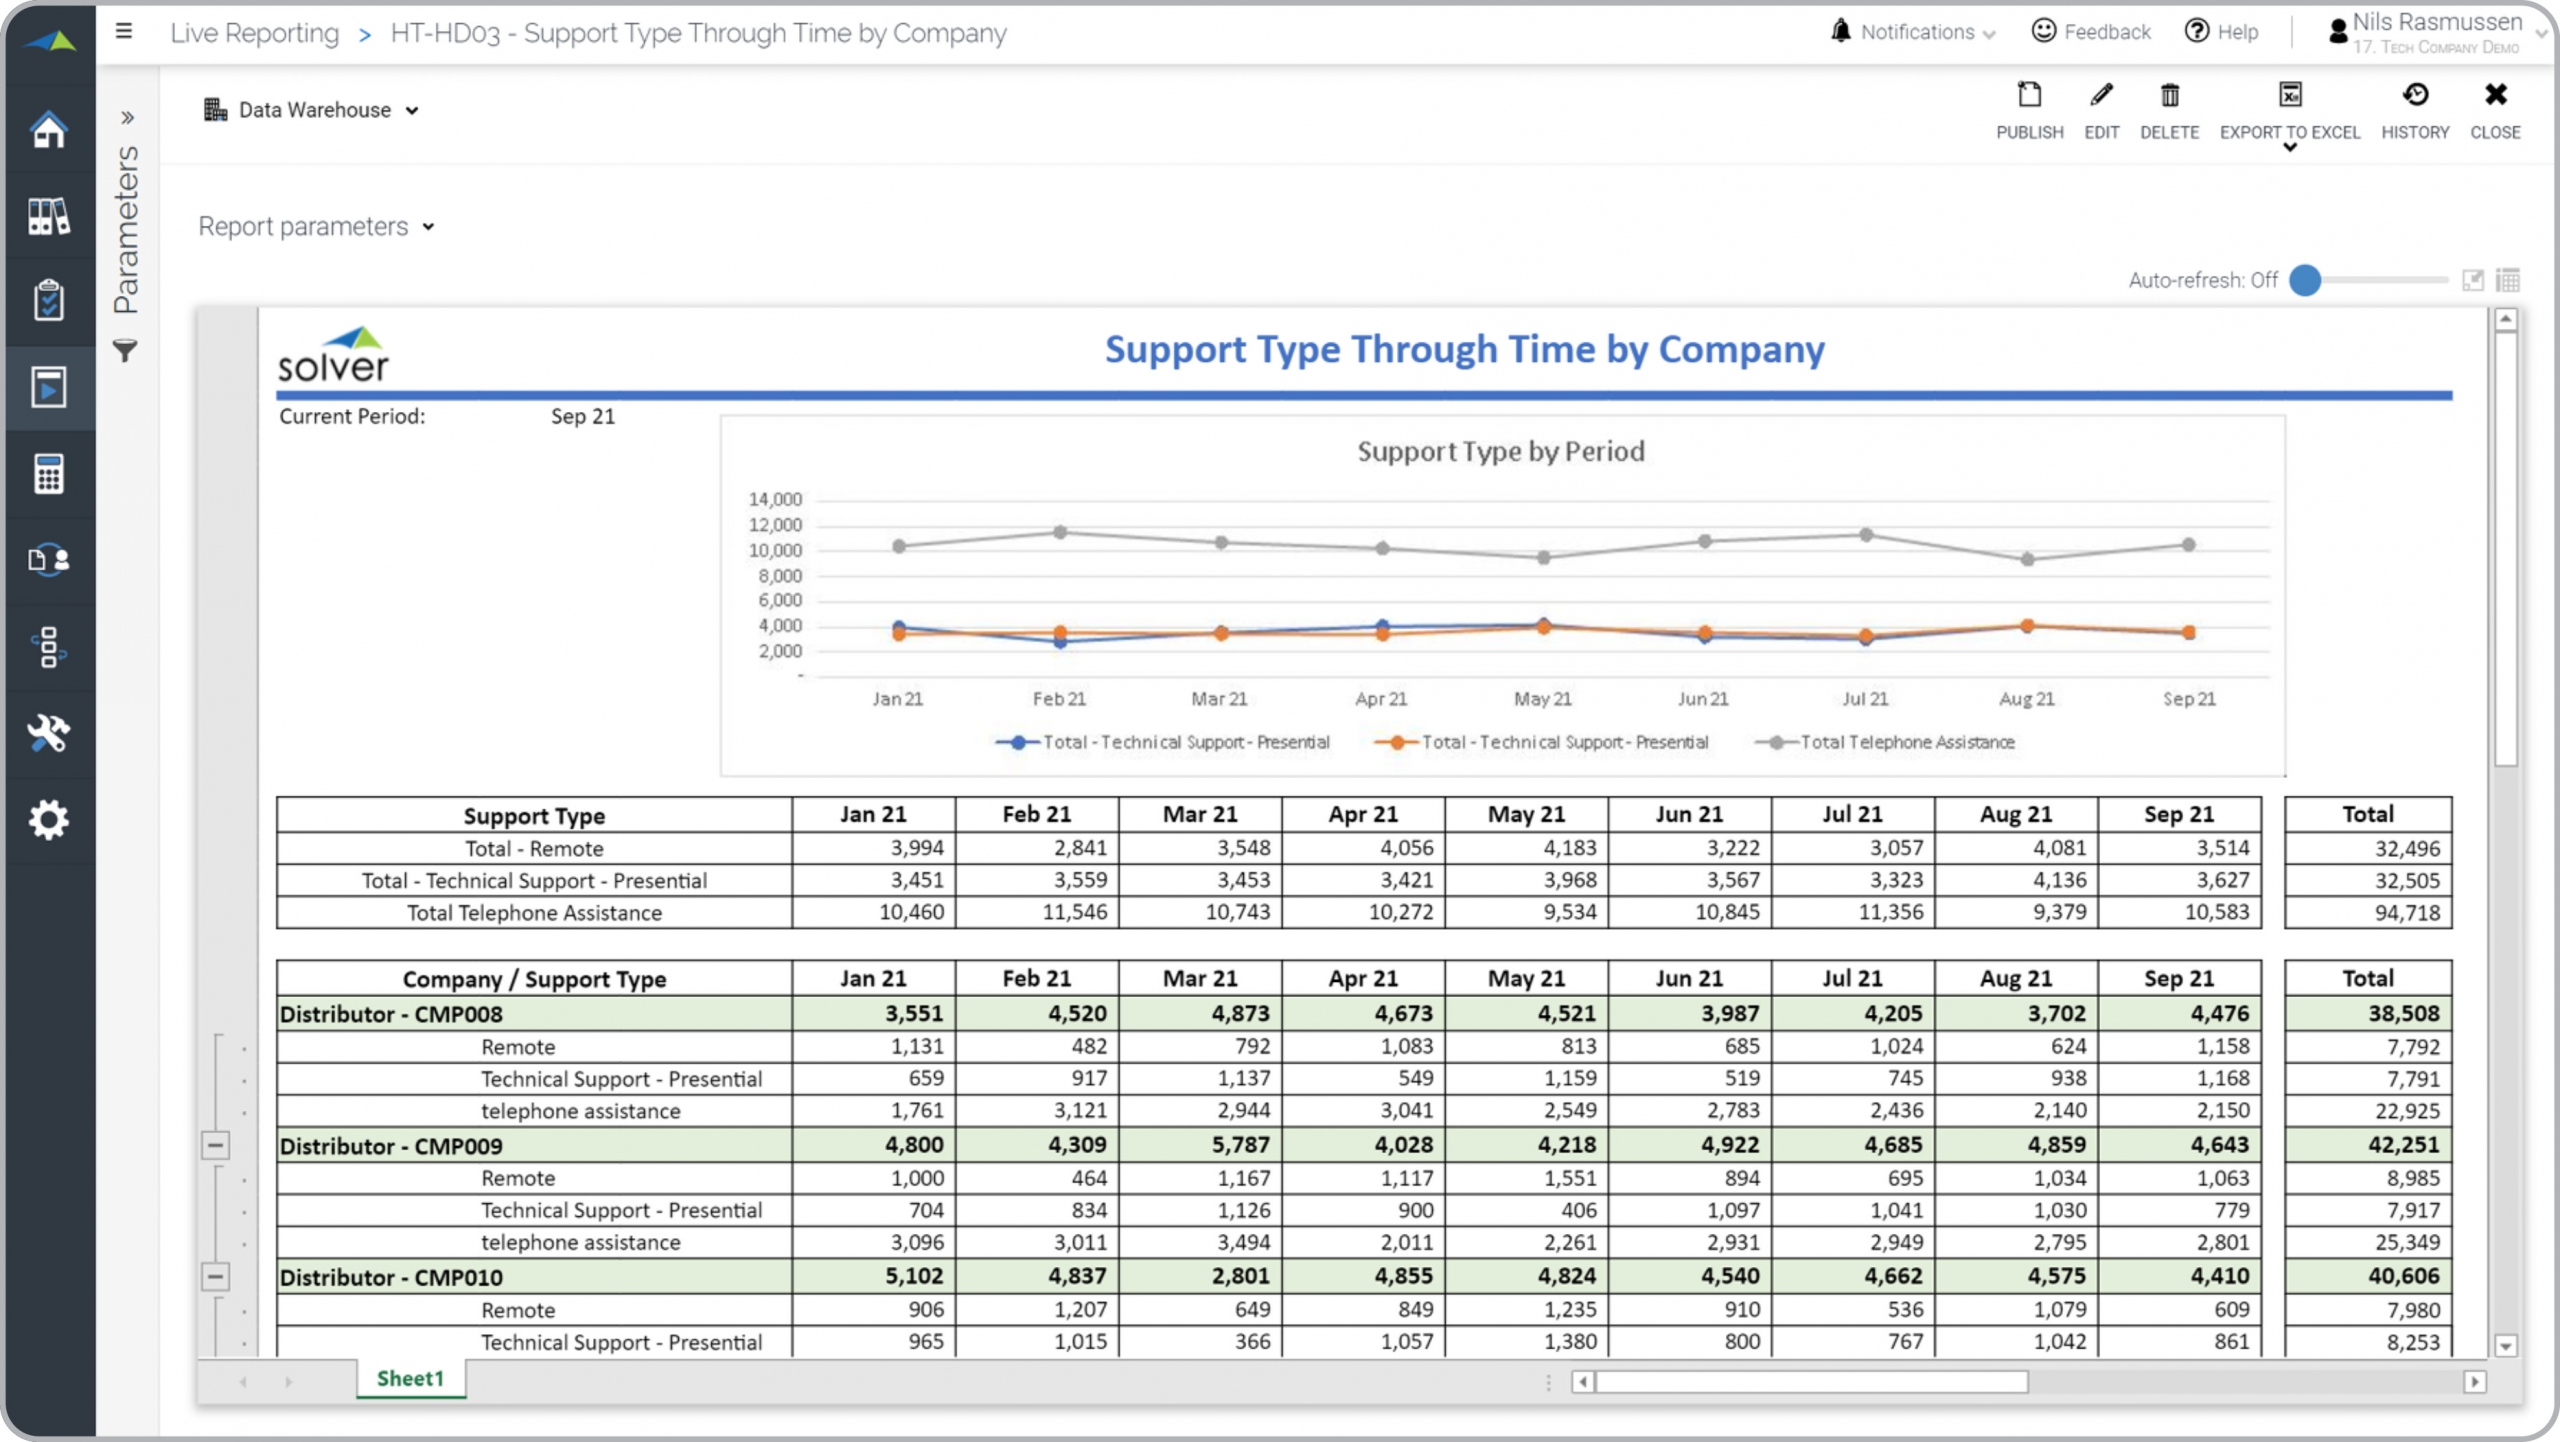
Tech – Help Desk Support Type Trend
Trended report with metrics for types of help desk support by month.
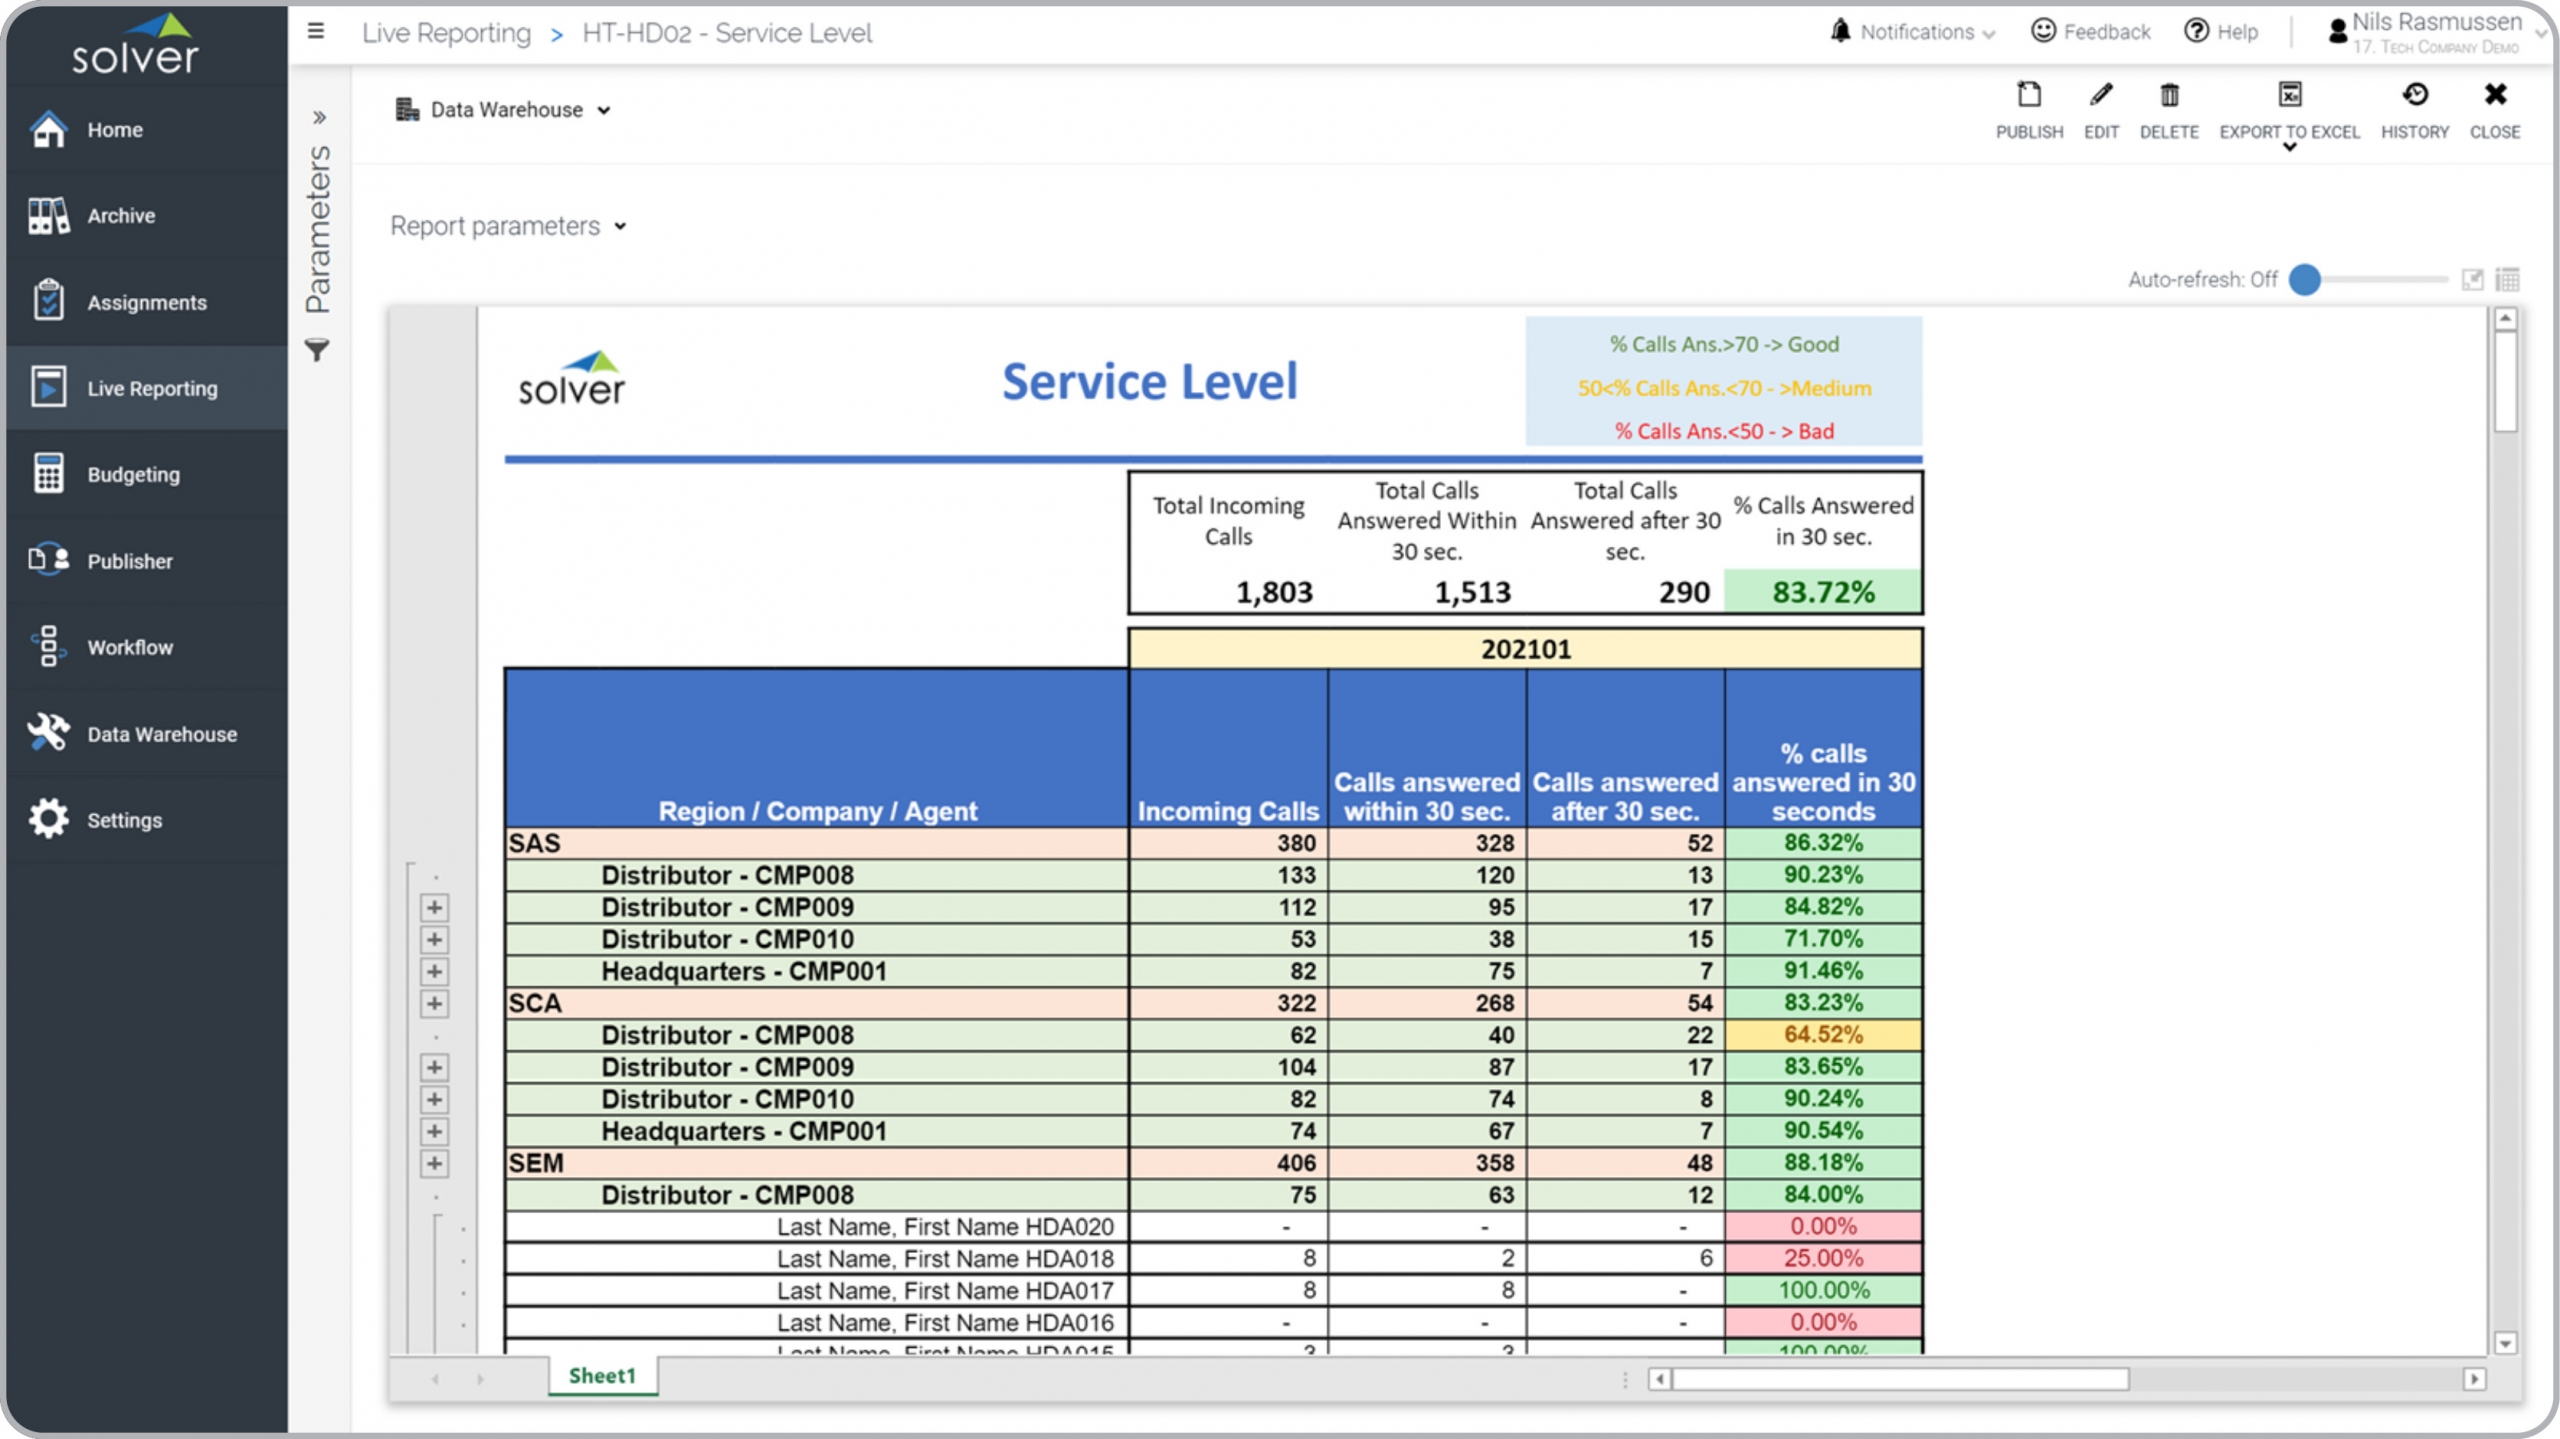
Tech – Help Desk Call Performance
Report shows the speed at which help desk staff answers incoming calls or tickets.
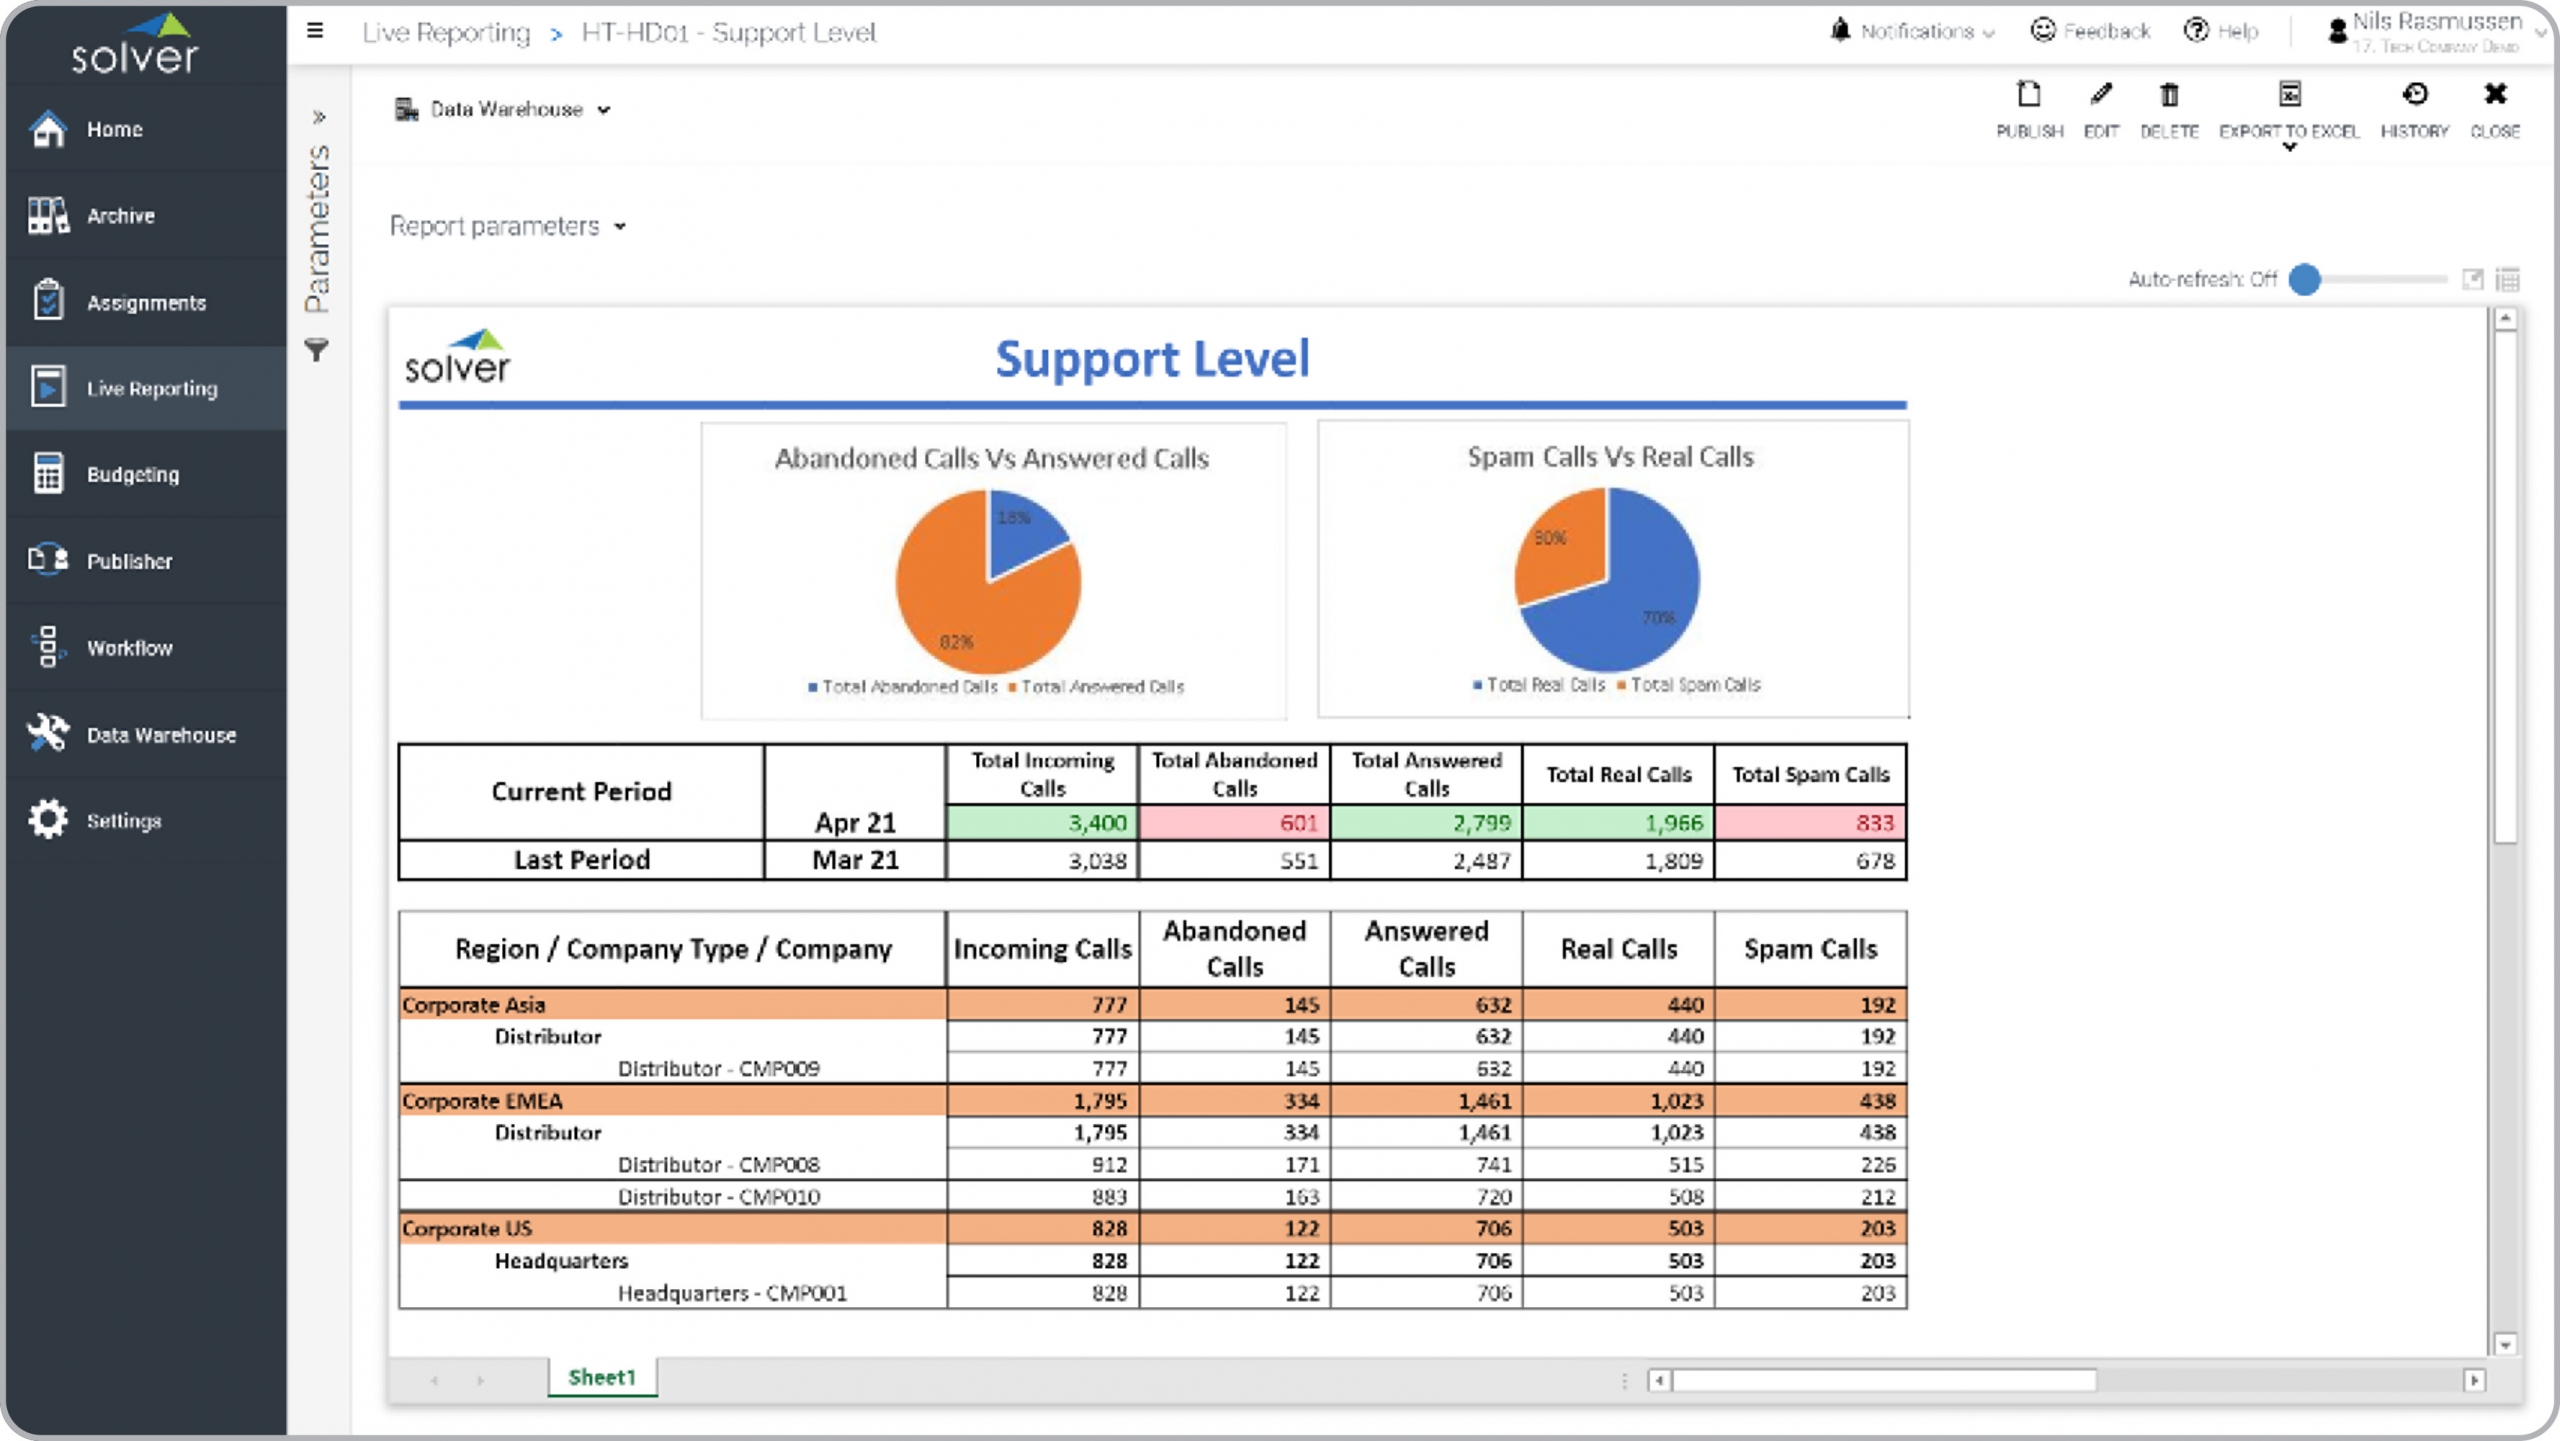
Tech – Help Desk Support Level
This report tracks types of help desk support calls with comparison to prior month.
P&L Estimate
Profit & Loss trend with actual figures YTD and forecast for remaining months.
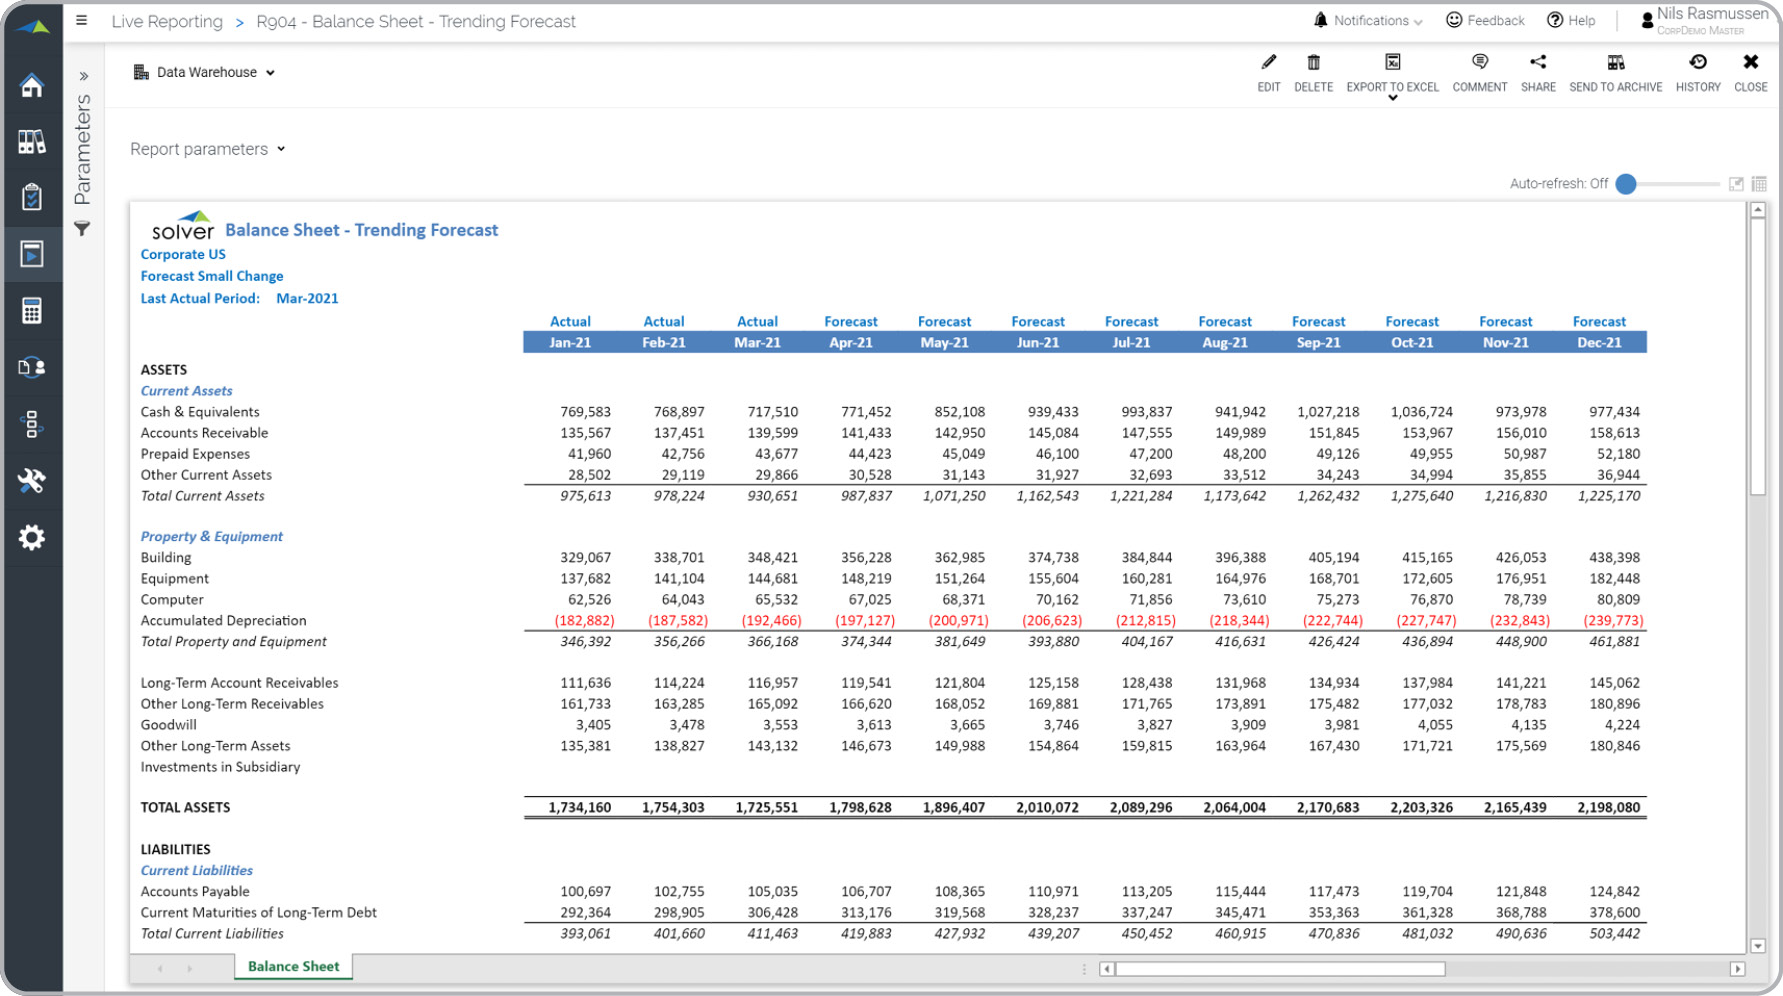
Balance Sheet Estimate
Balance Sheet trend with actual figures YTD and forecast for remaining months.
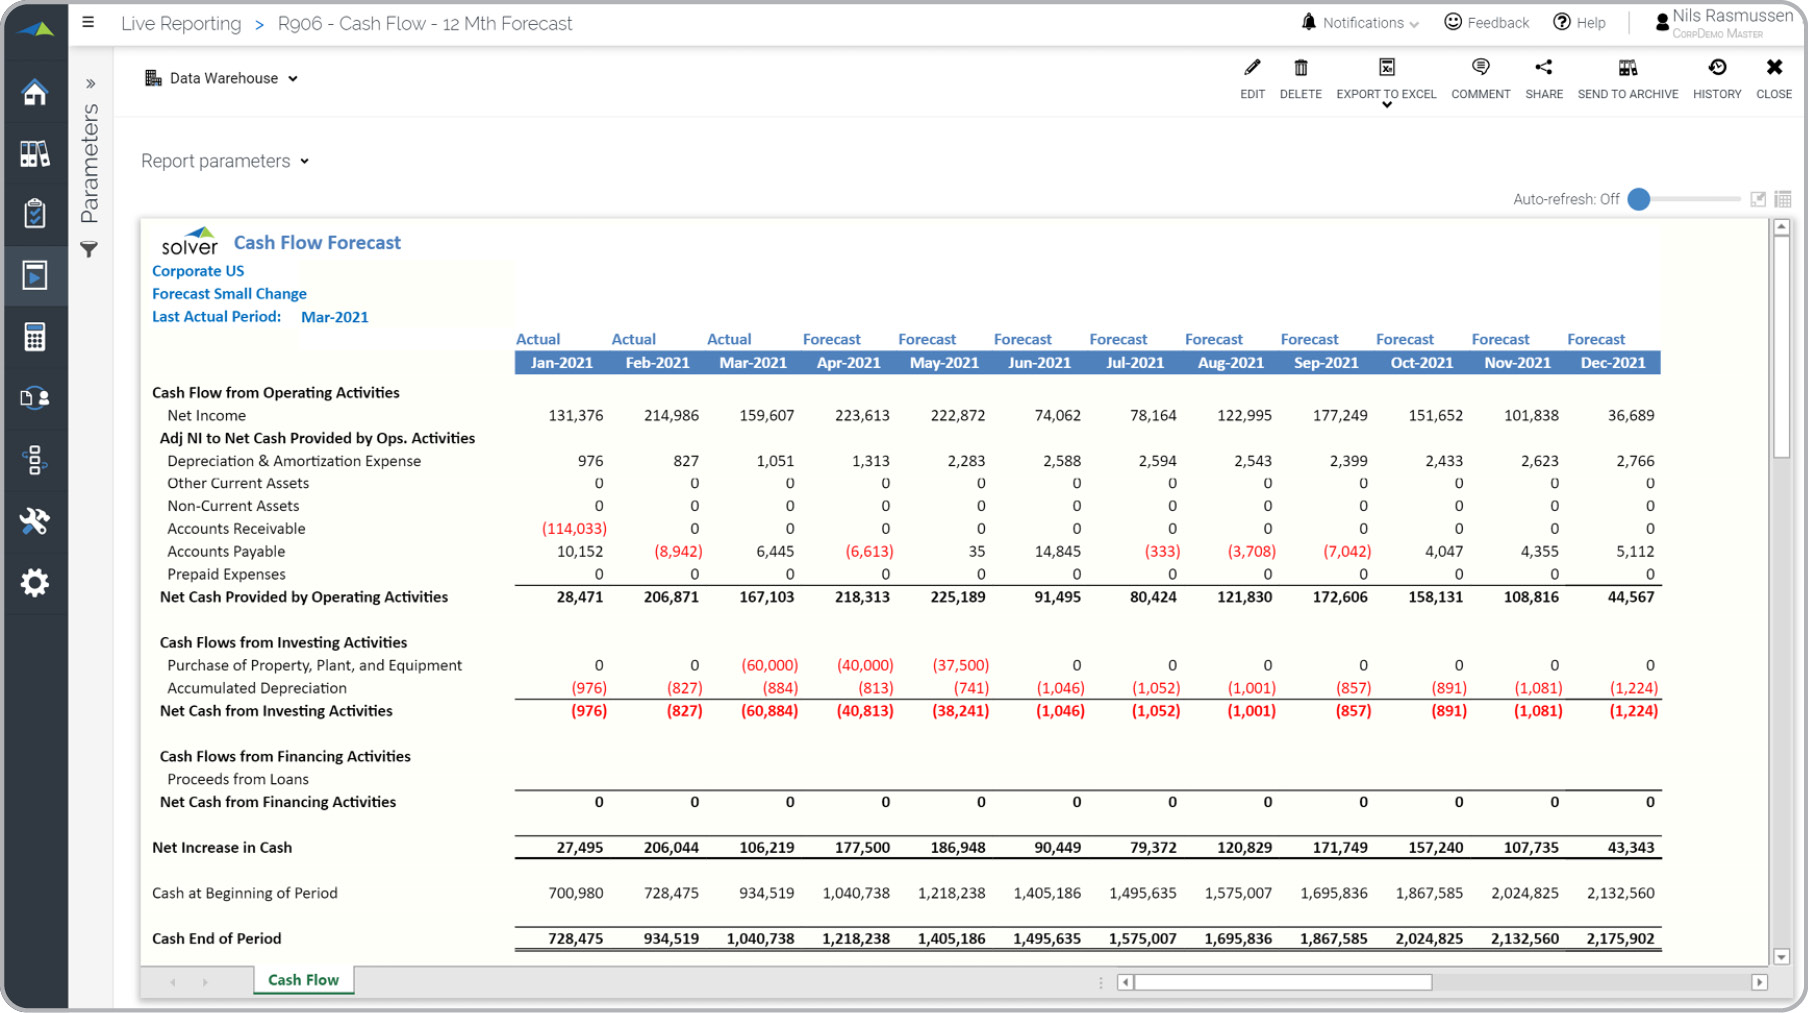
Cash Flow Estimate
Cash Flow trend with actual figures YTD and forecast for remaining months.
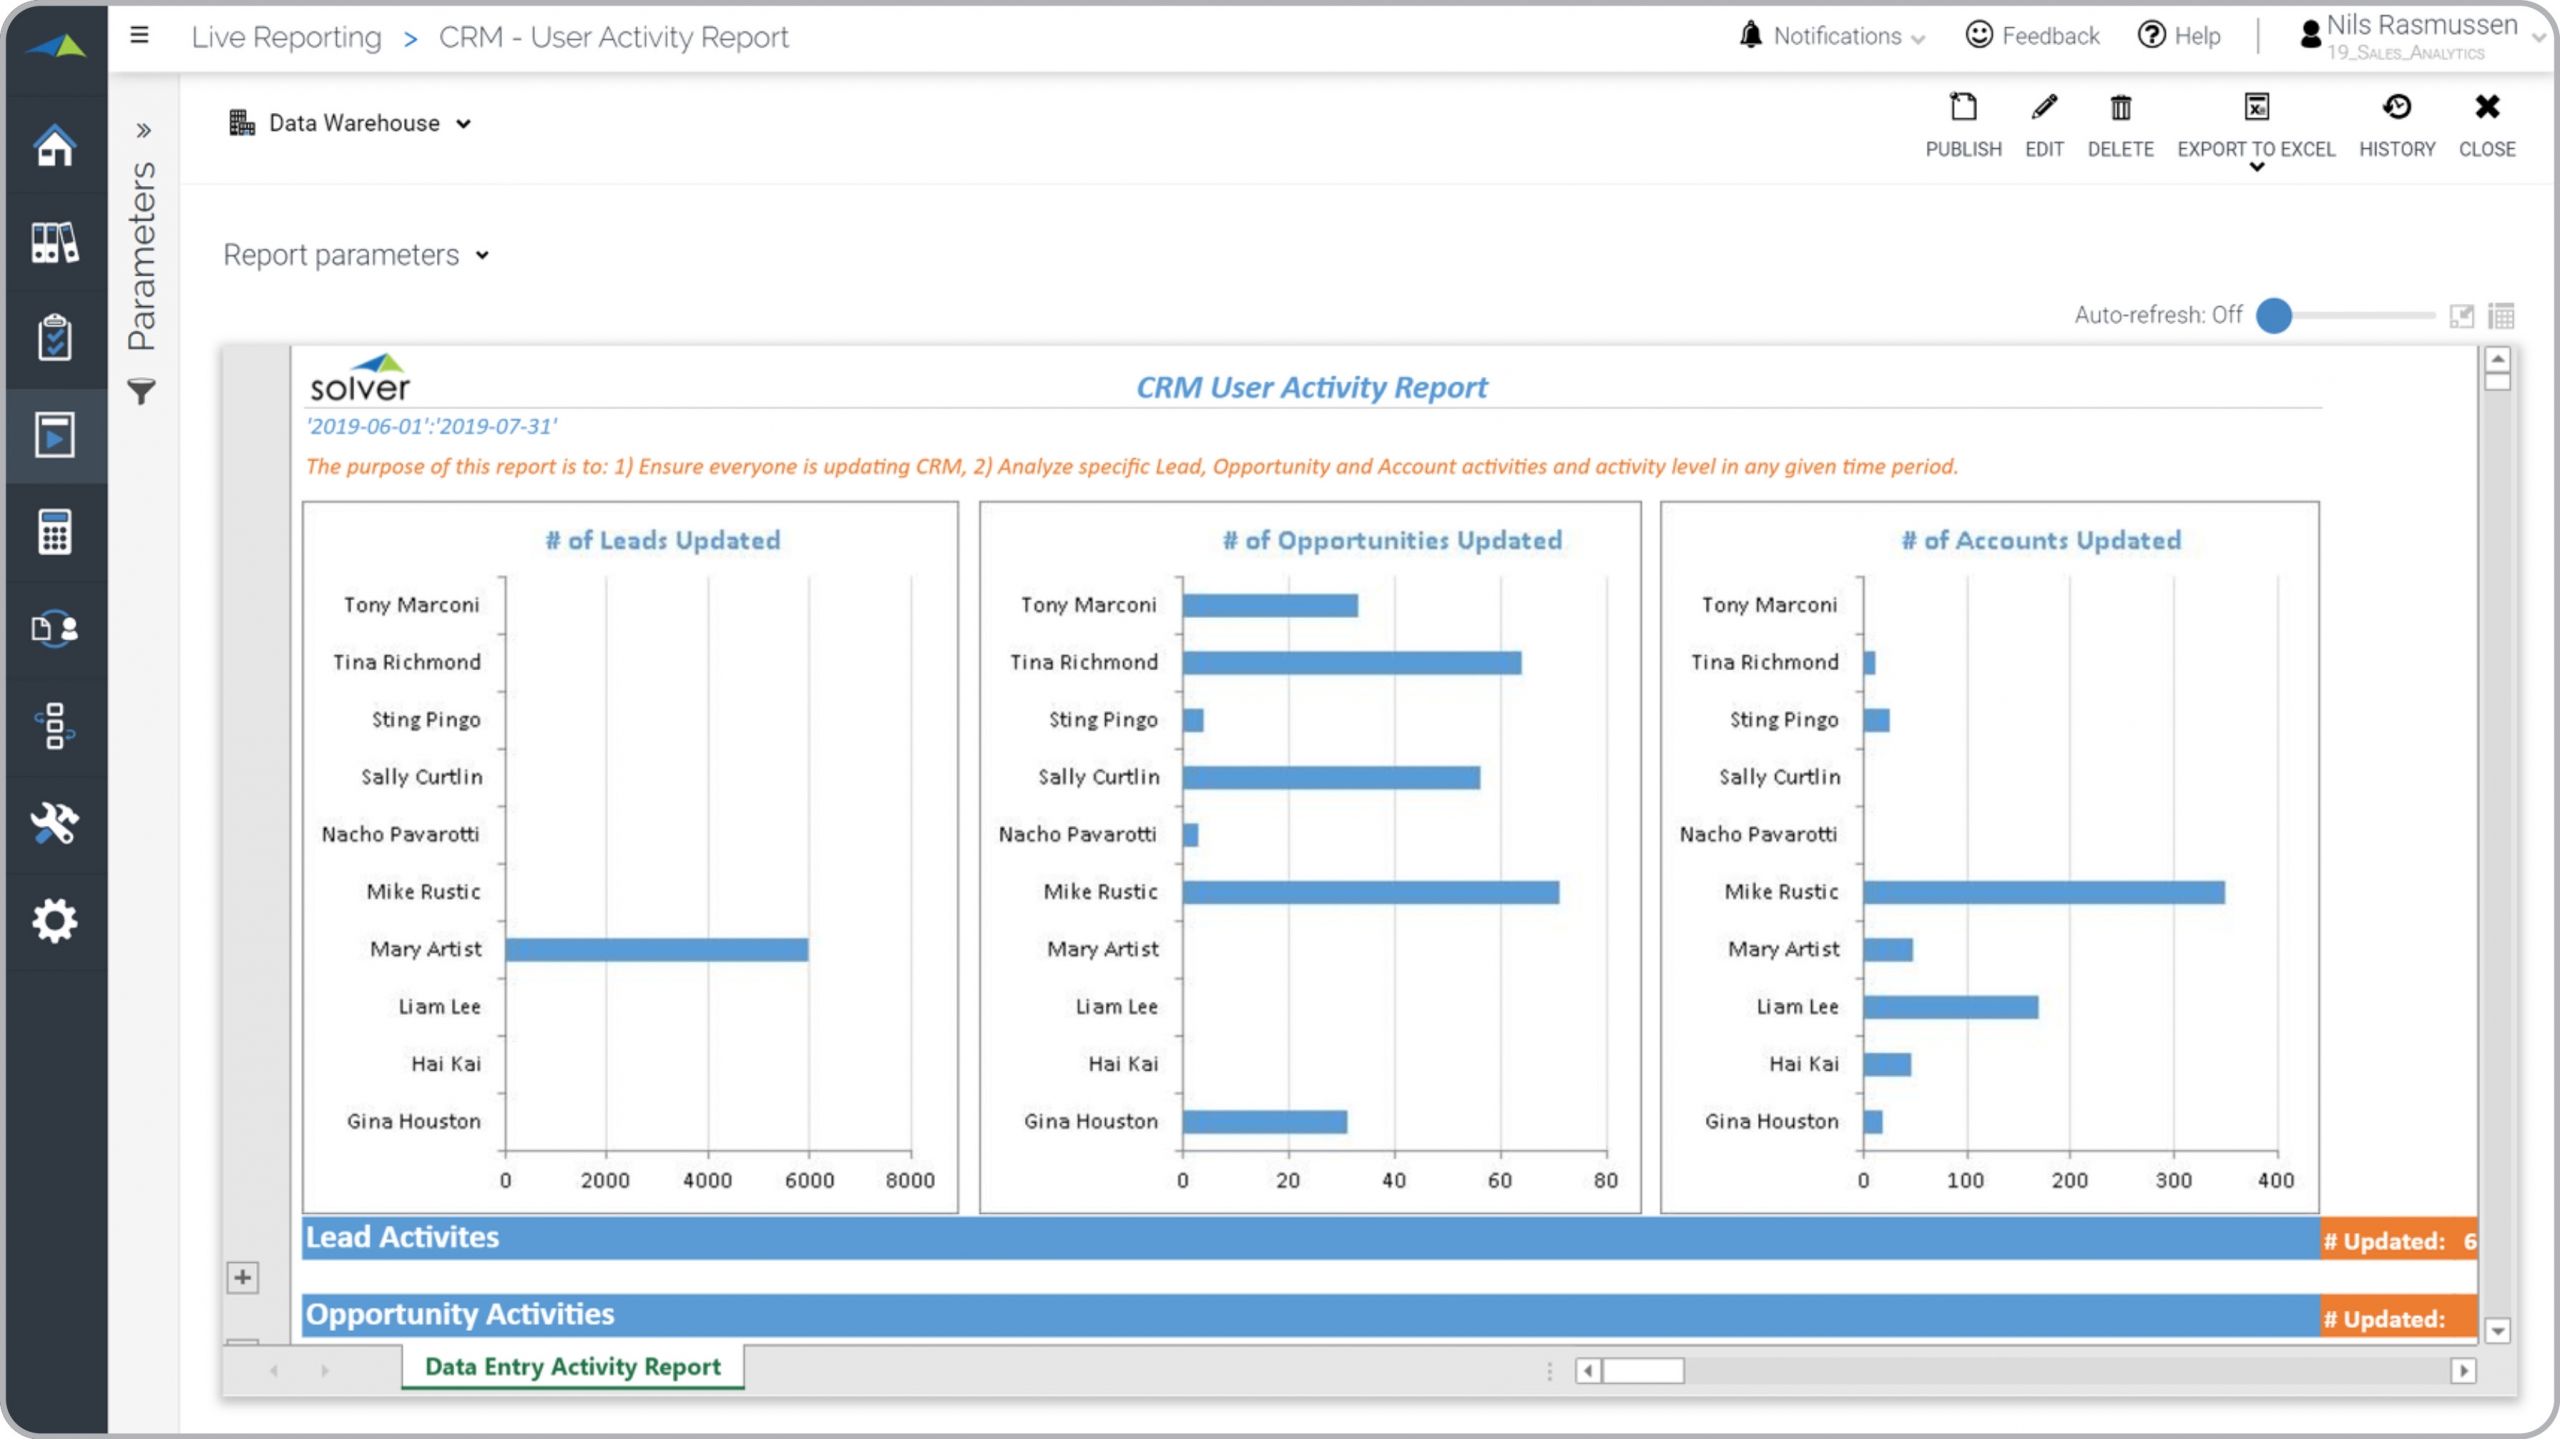
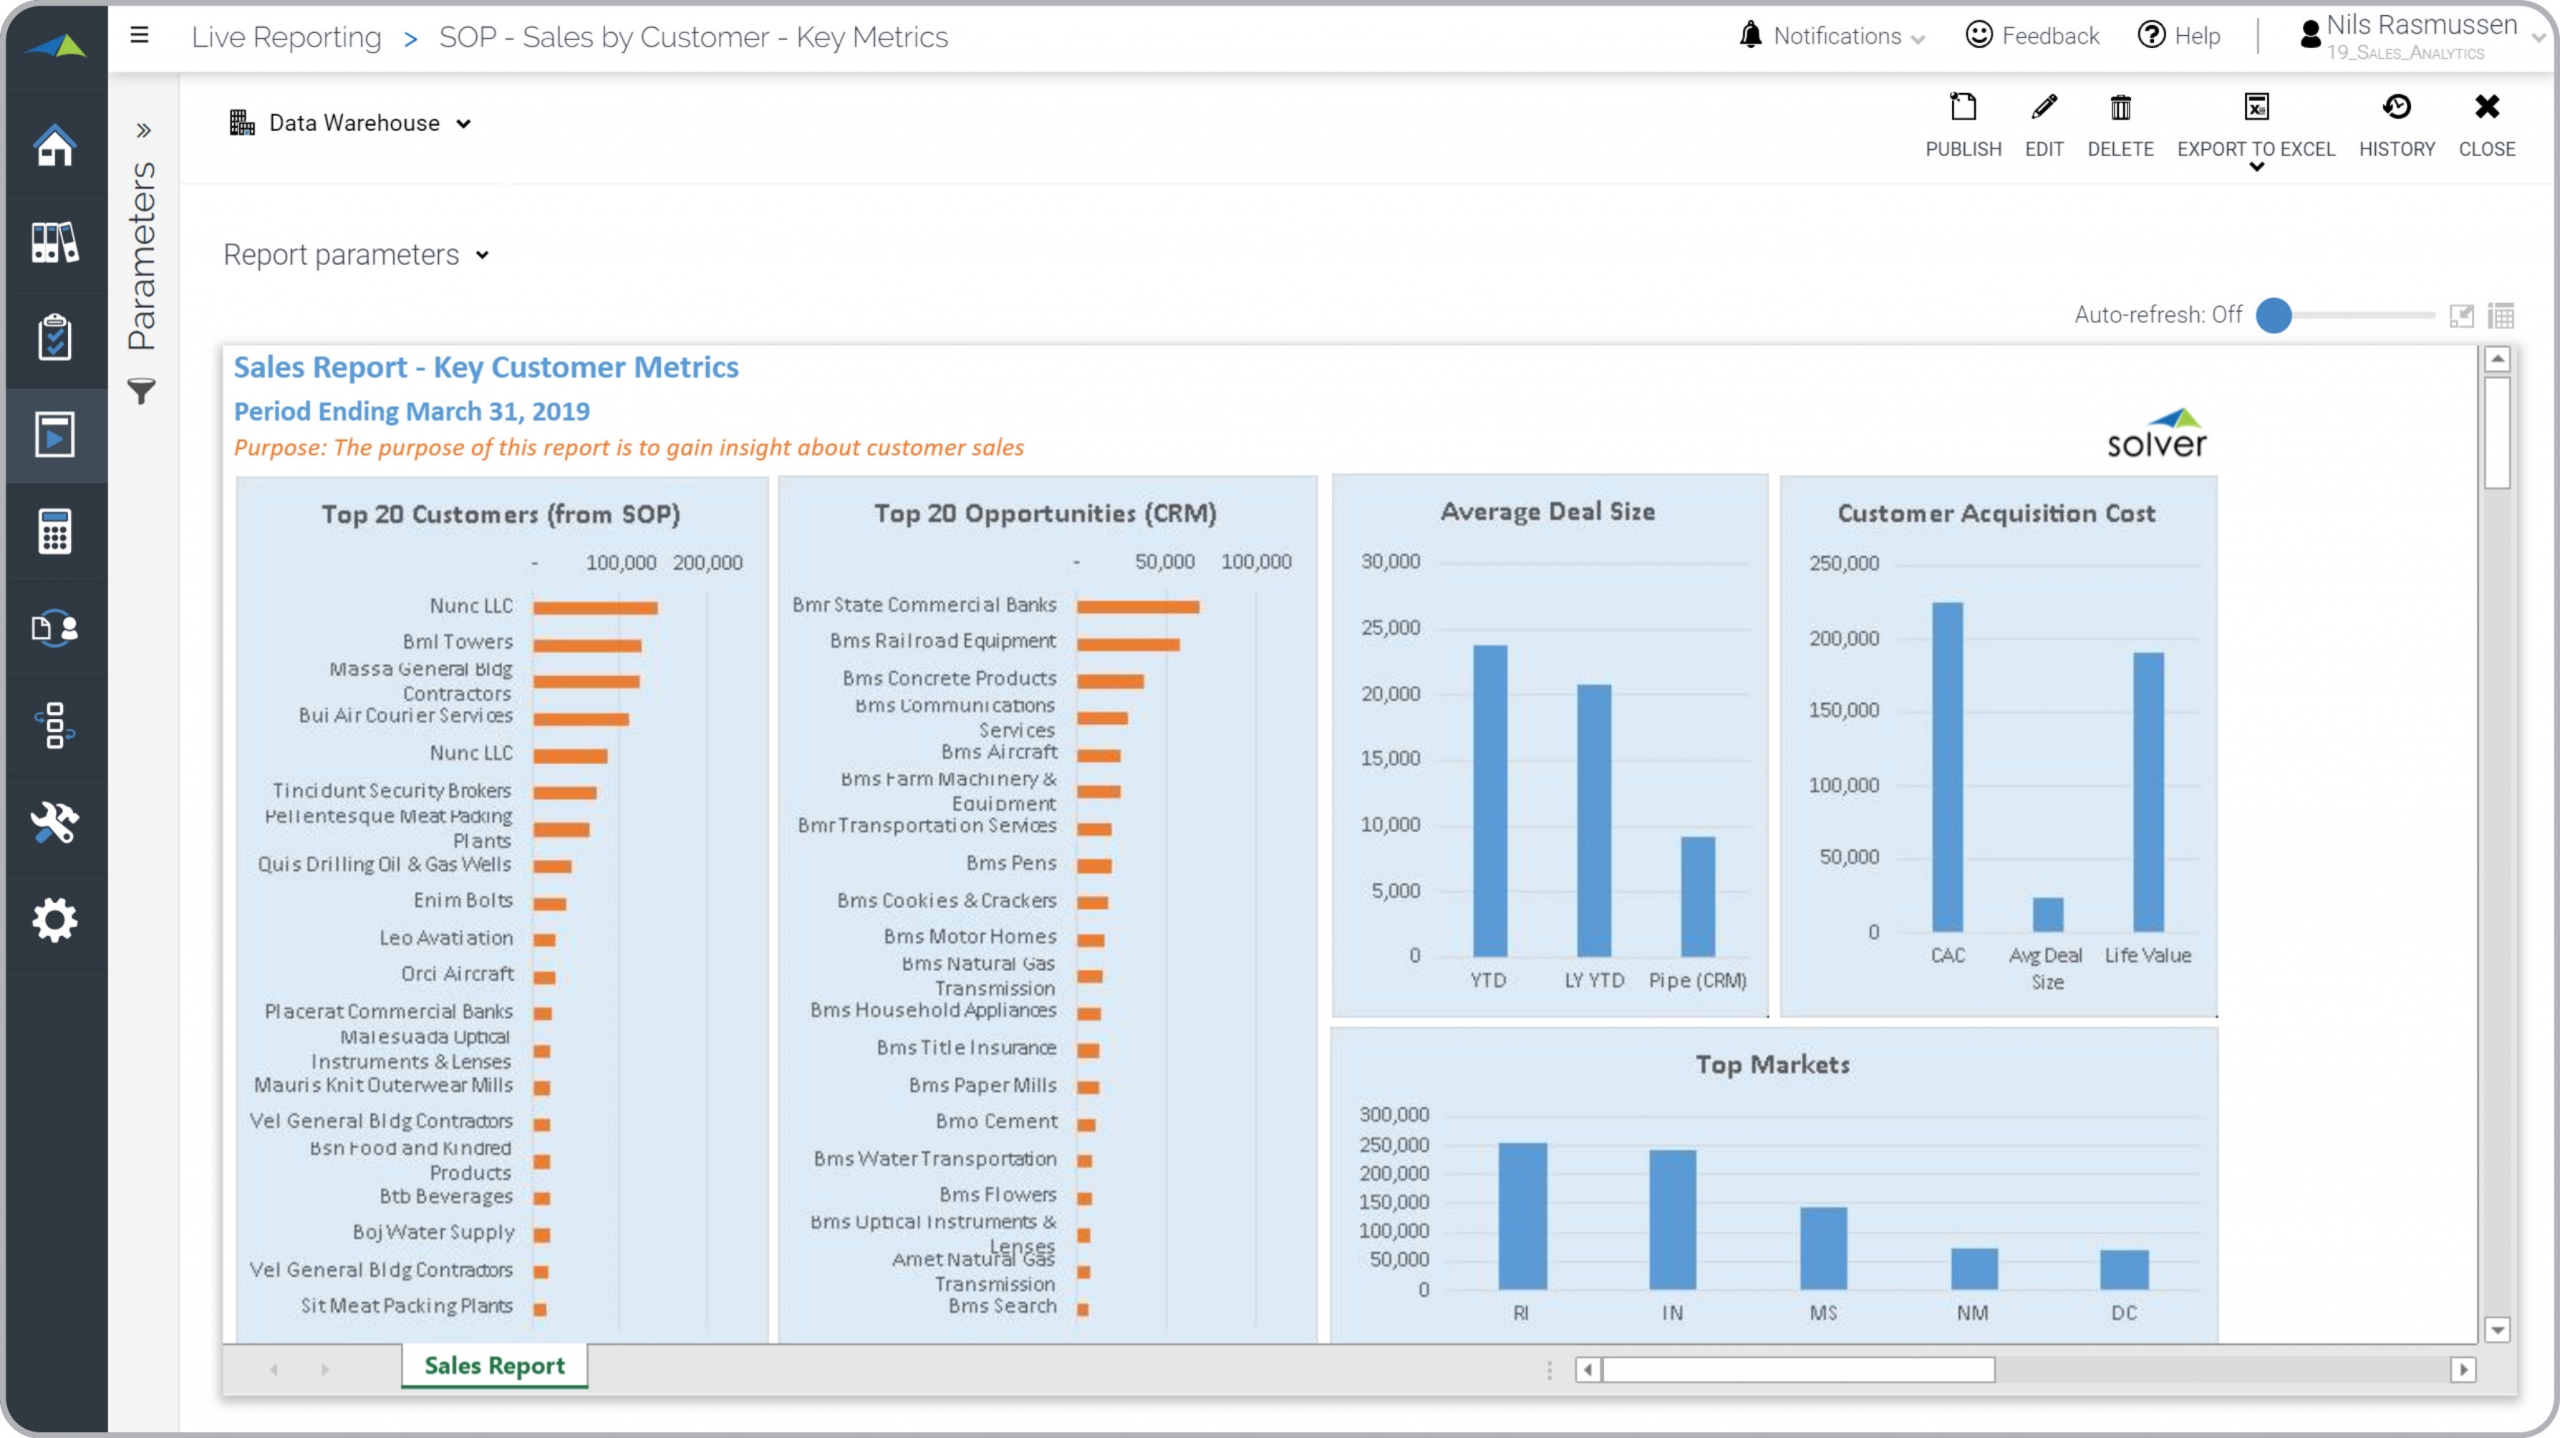
CRM User Activity Report
The purpose of this report is to show to what extent each CRM user is utilizing the system.

CRM Data Quality Report
Finds all key fields not filled out in any part of CRM system. Here for Opportunities.
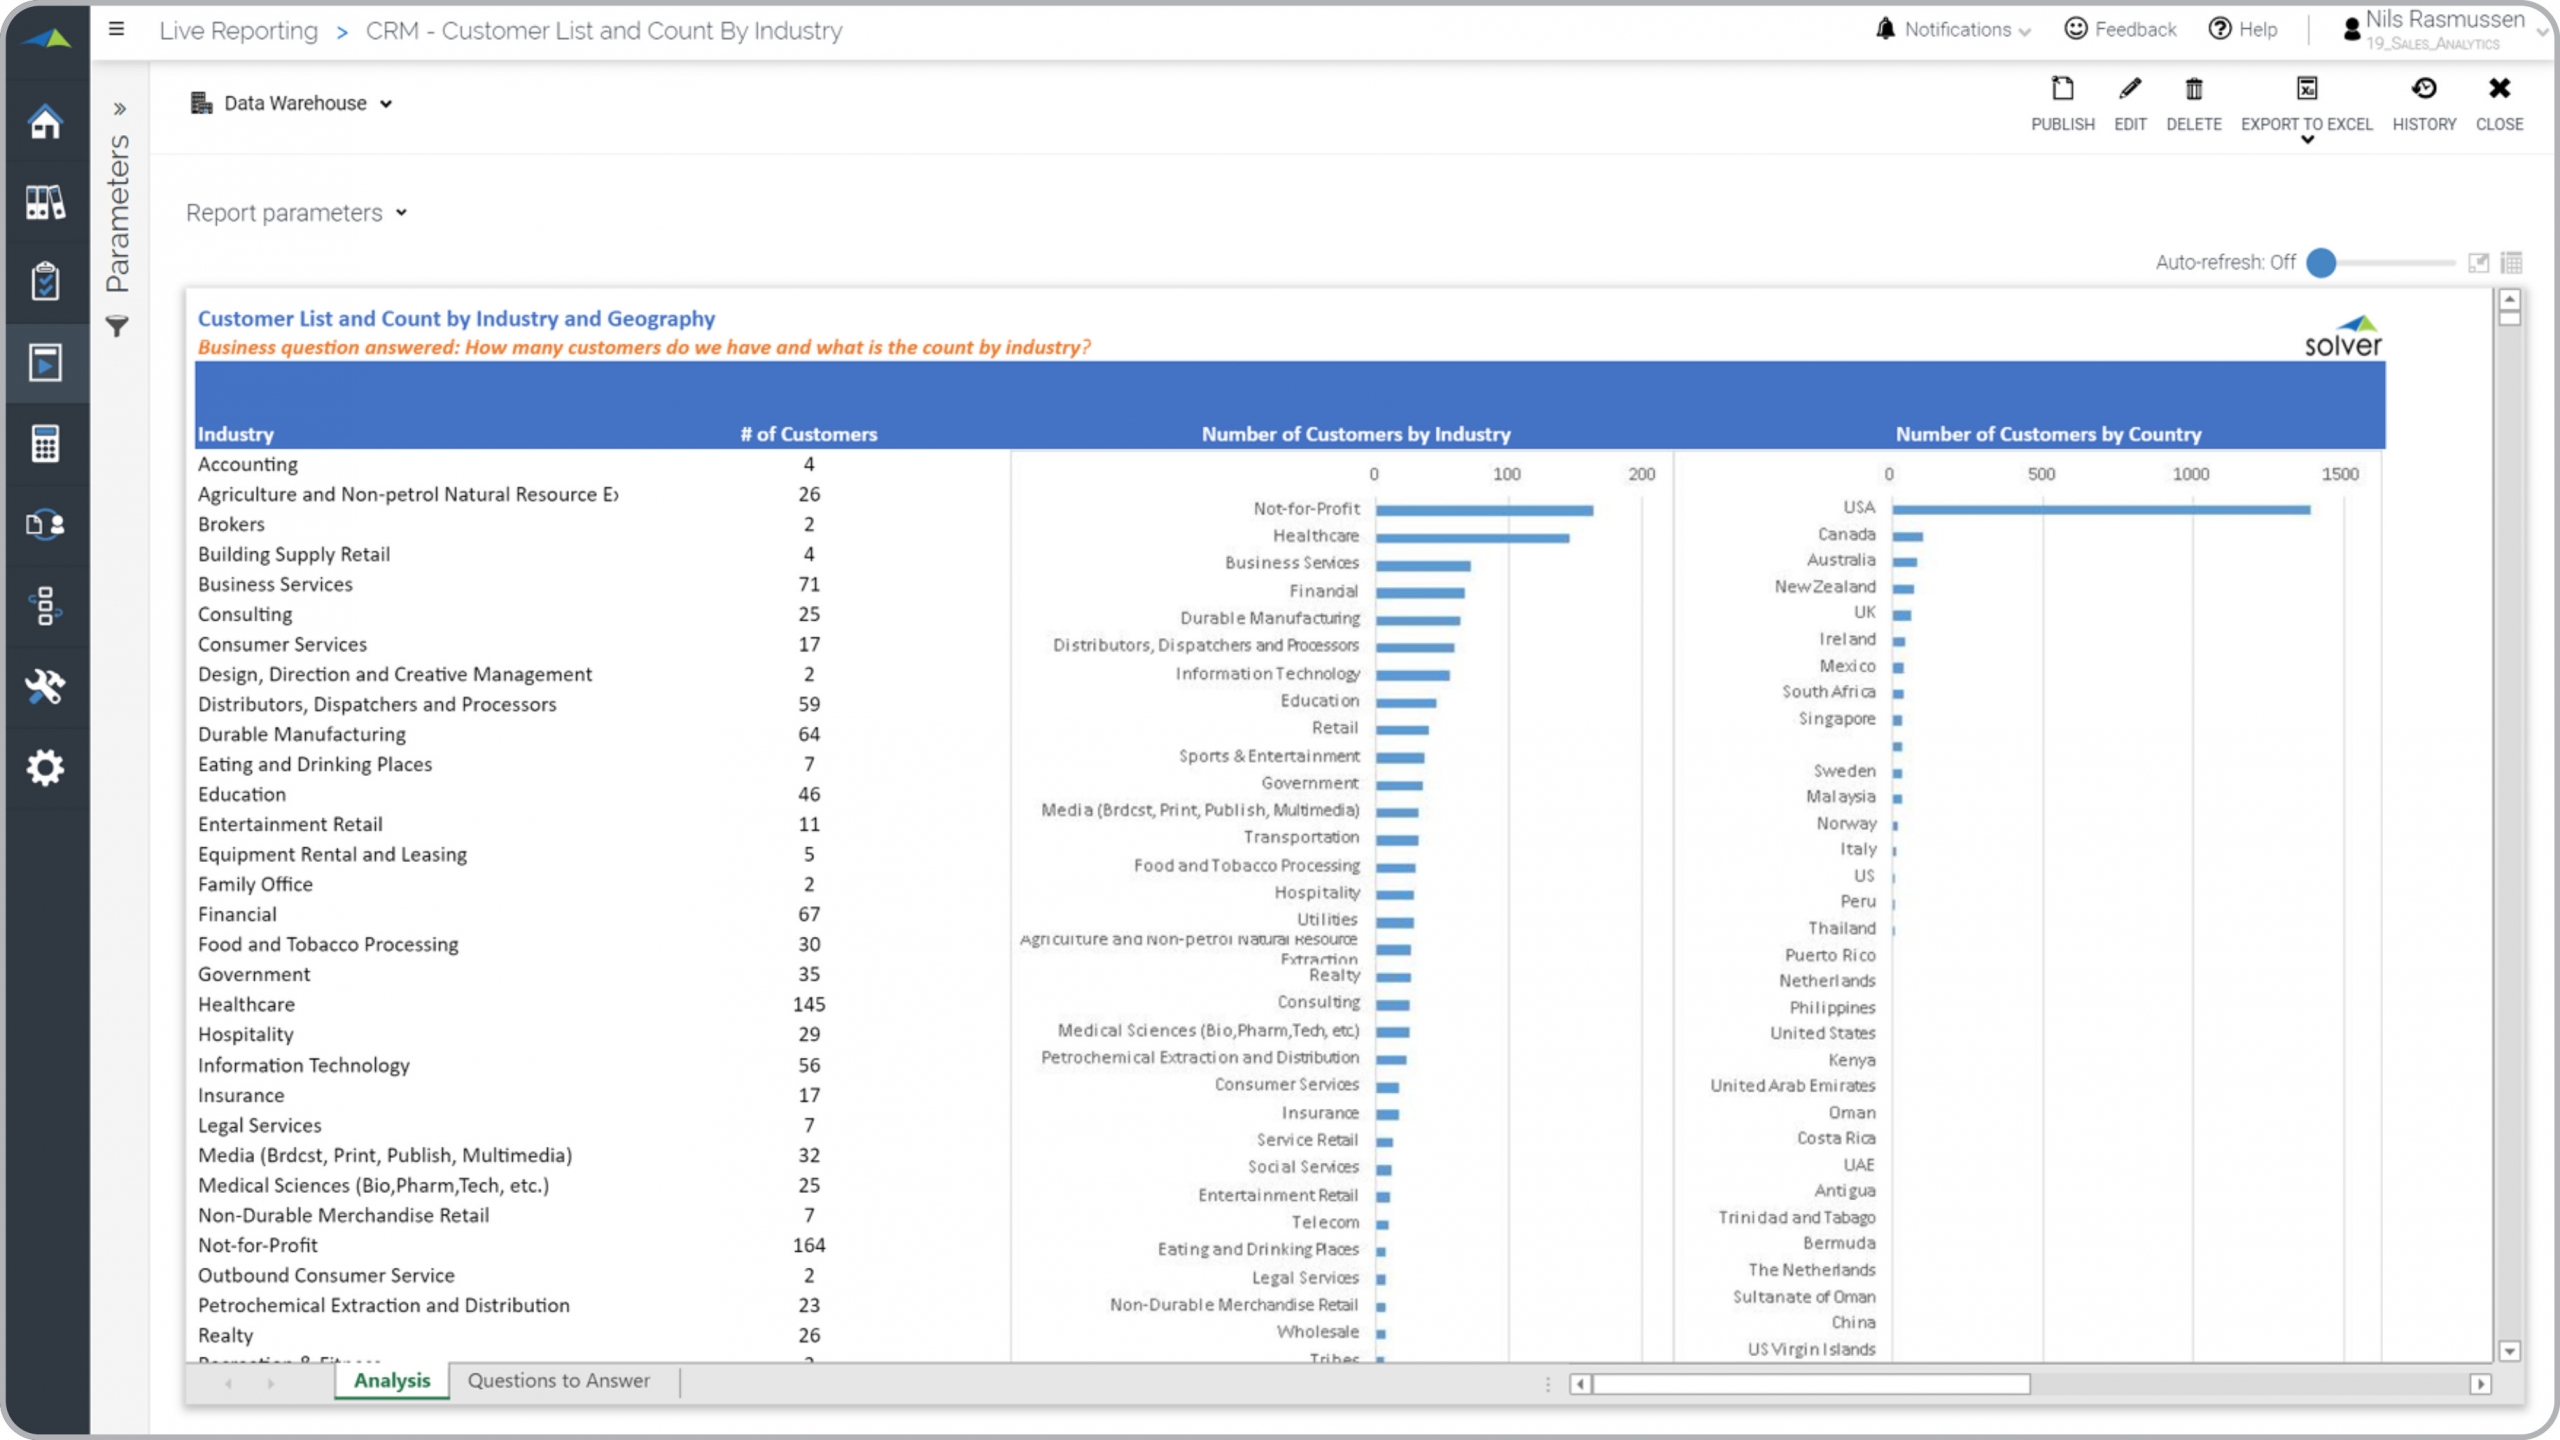
Customer List and Count by Industry
Graphical and transactional report with customer count by industry and country.
Sales Trend by Sales Person
Shows sales quantity trend by sales person with YTD sales for current and prior year.
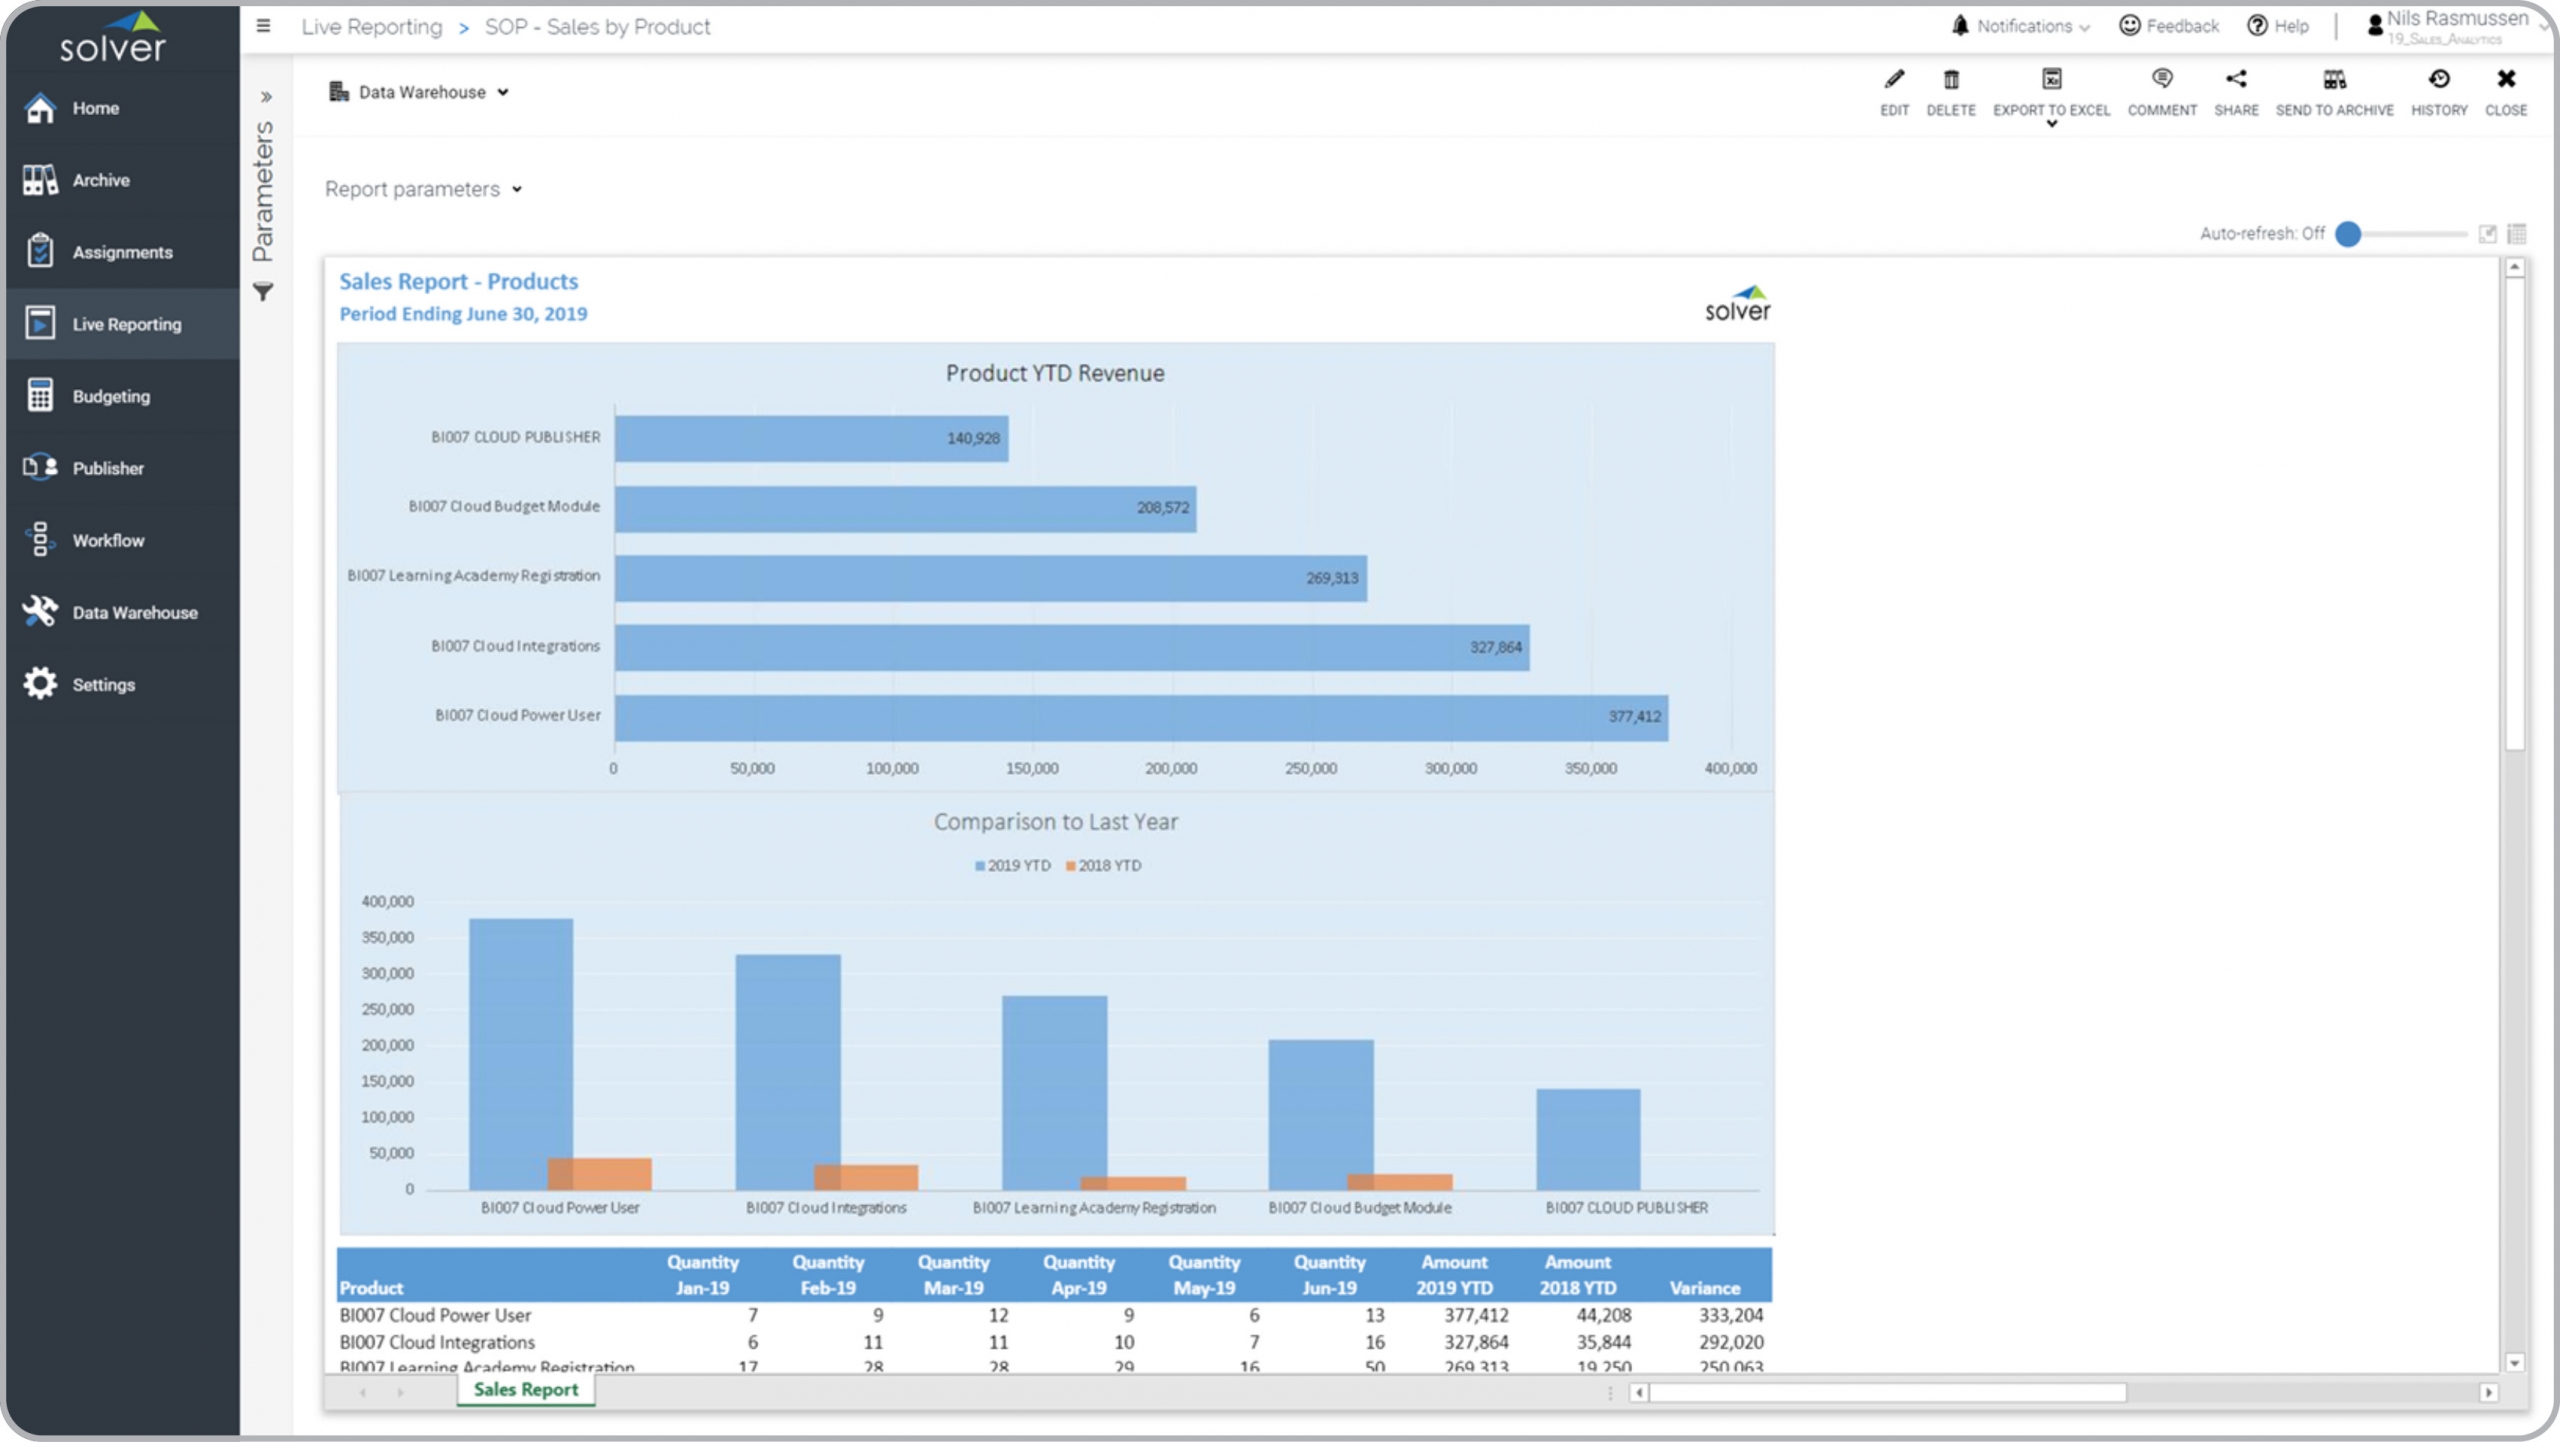
Sales Trend by Product
Shows sales quantity trend by product with YTD sales for current and prior year.
Pipeline and Sales Combo Report
Combines pipeline estimates with actual sales and key metrics for deal size and sales cost.
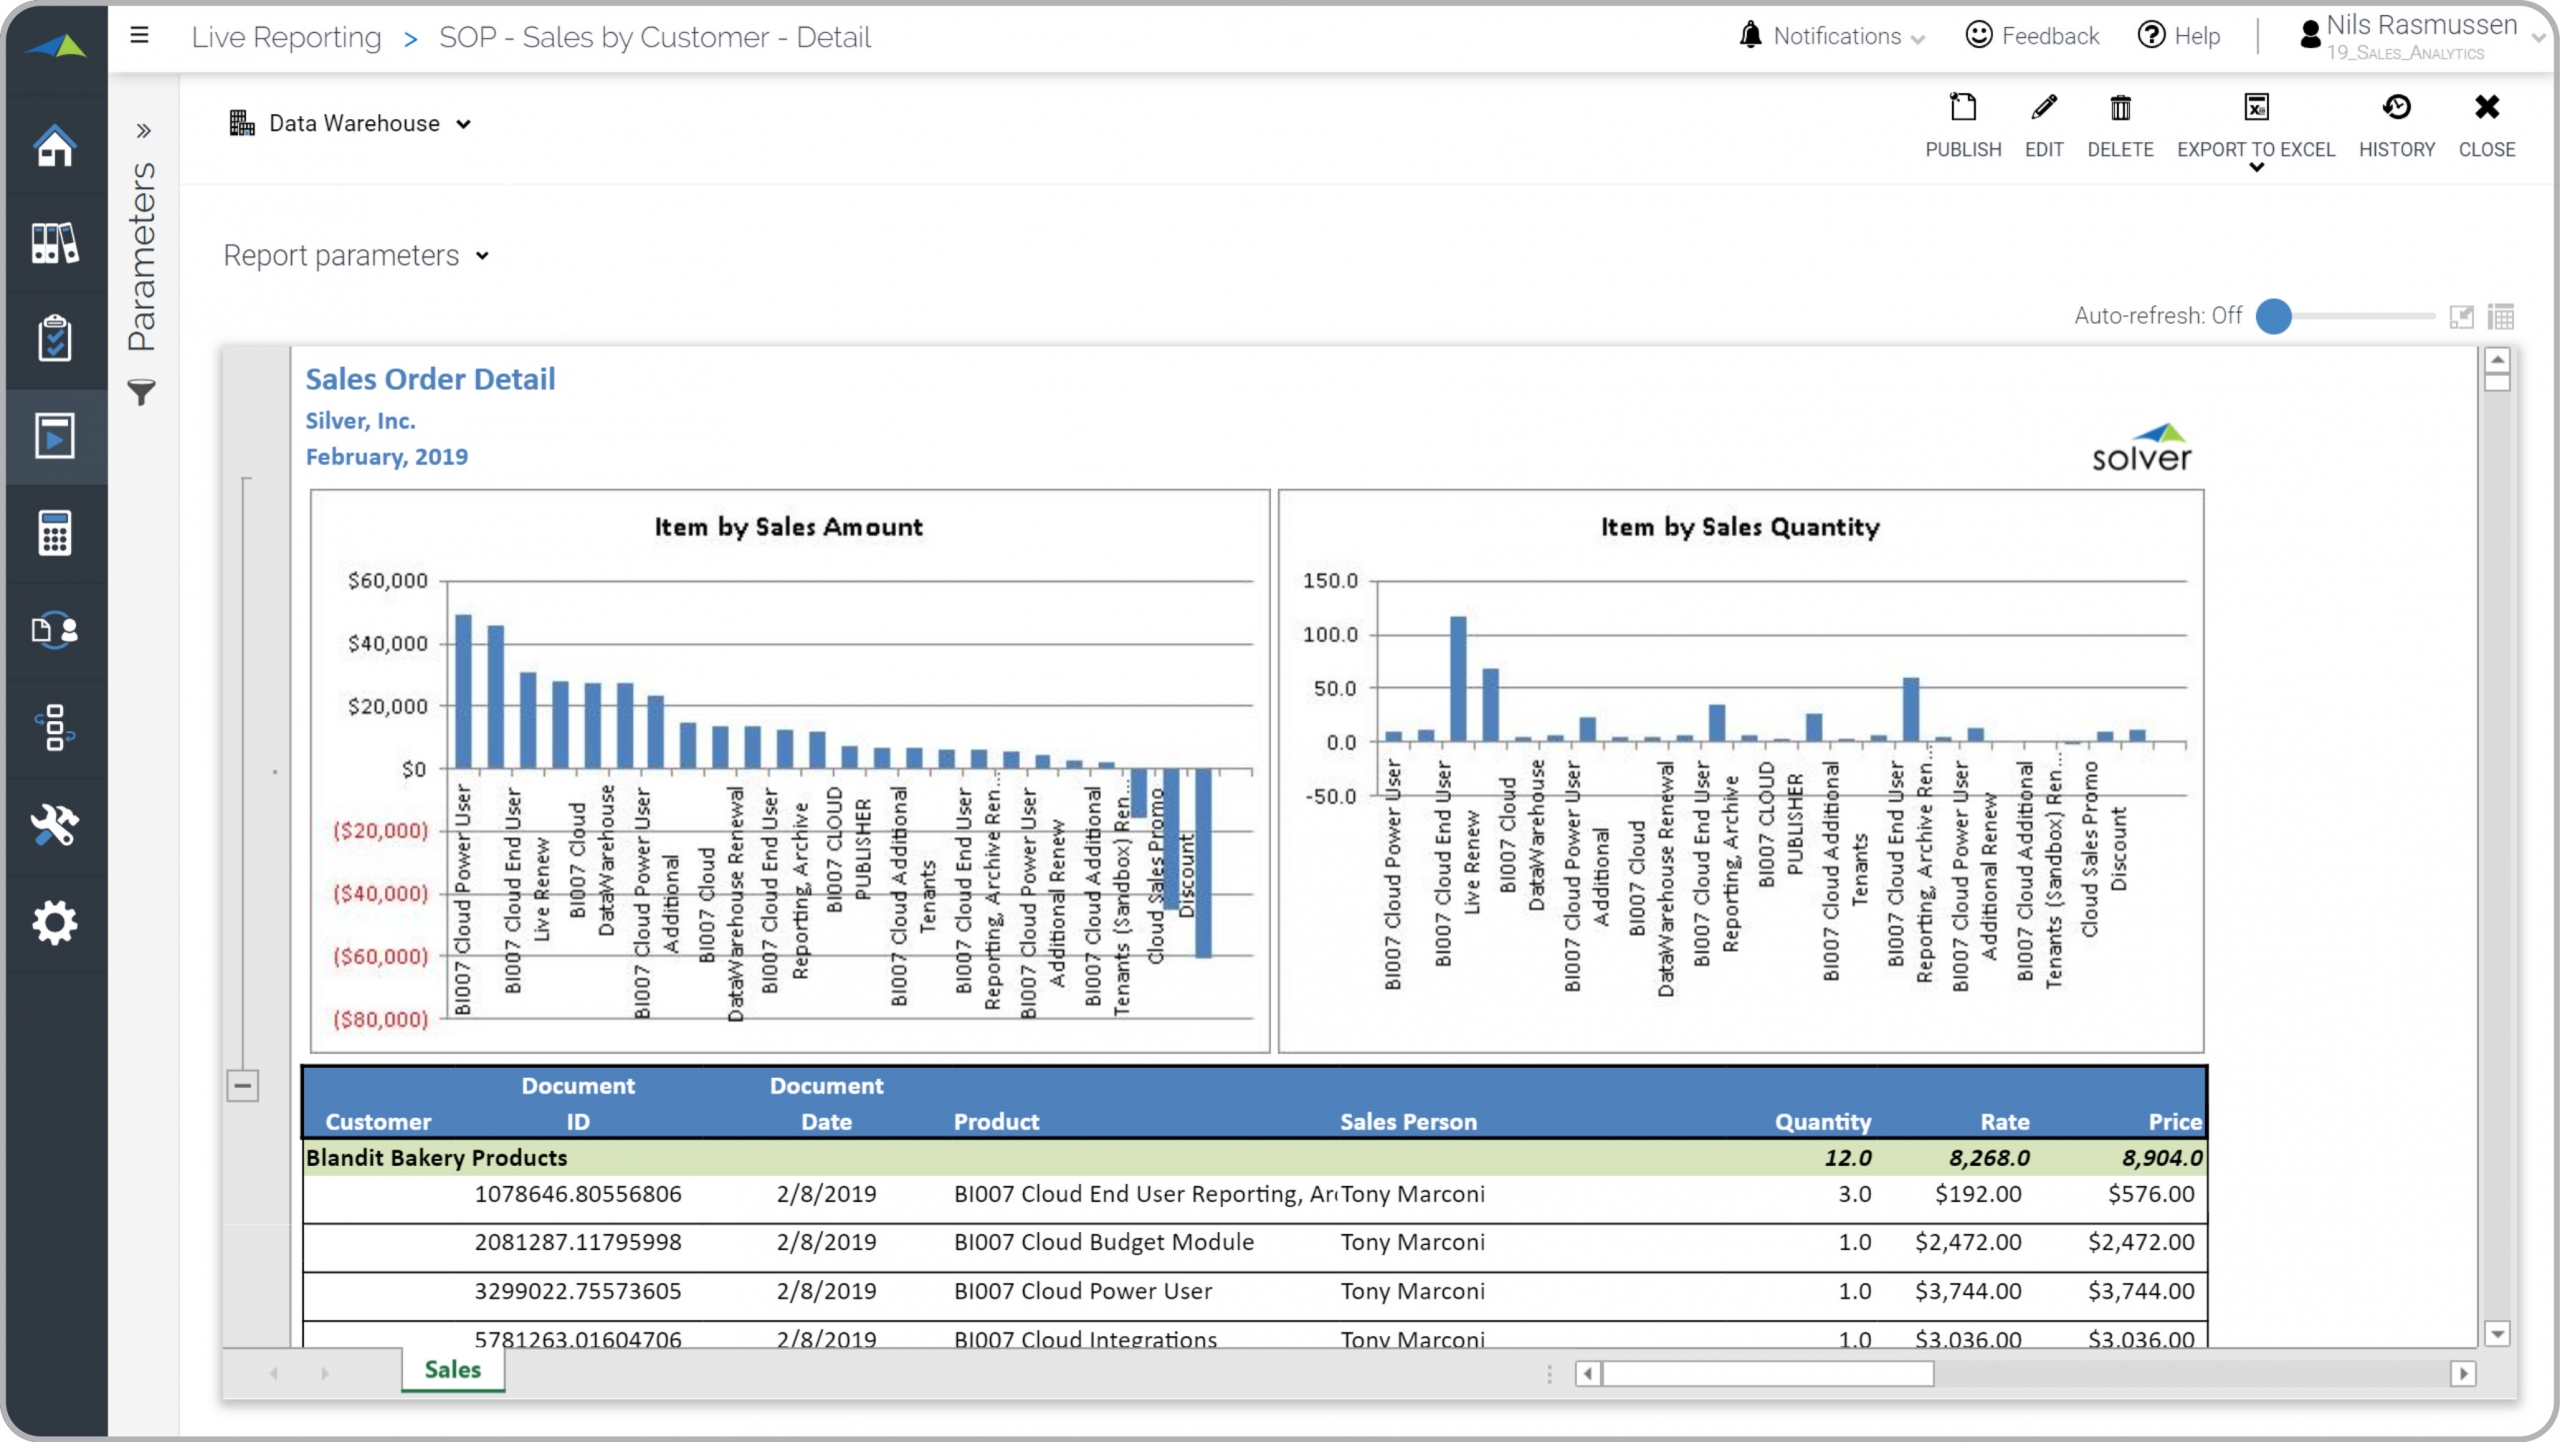
Sales Order Detail Report
Shows sales transactions by customer, sales person and product.
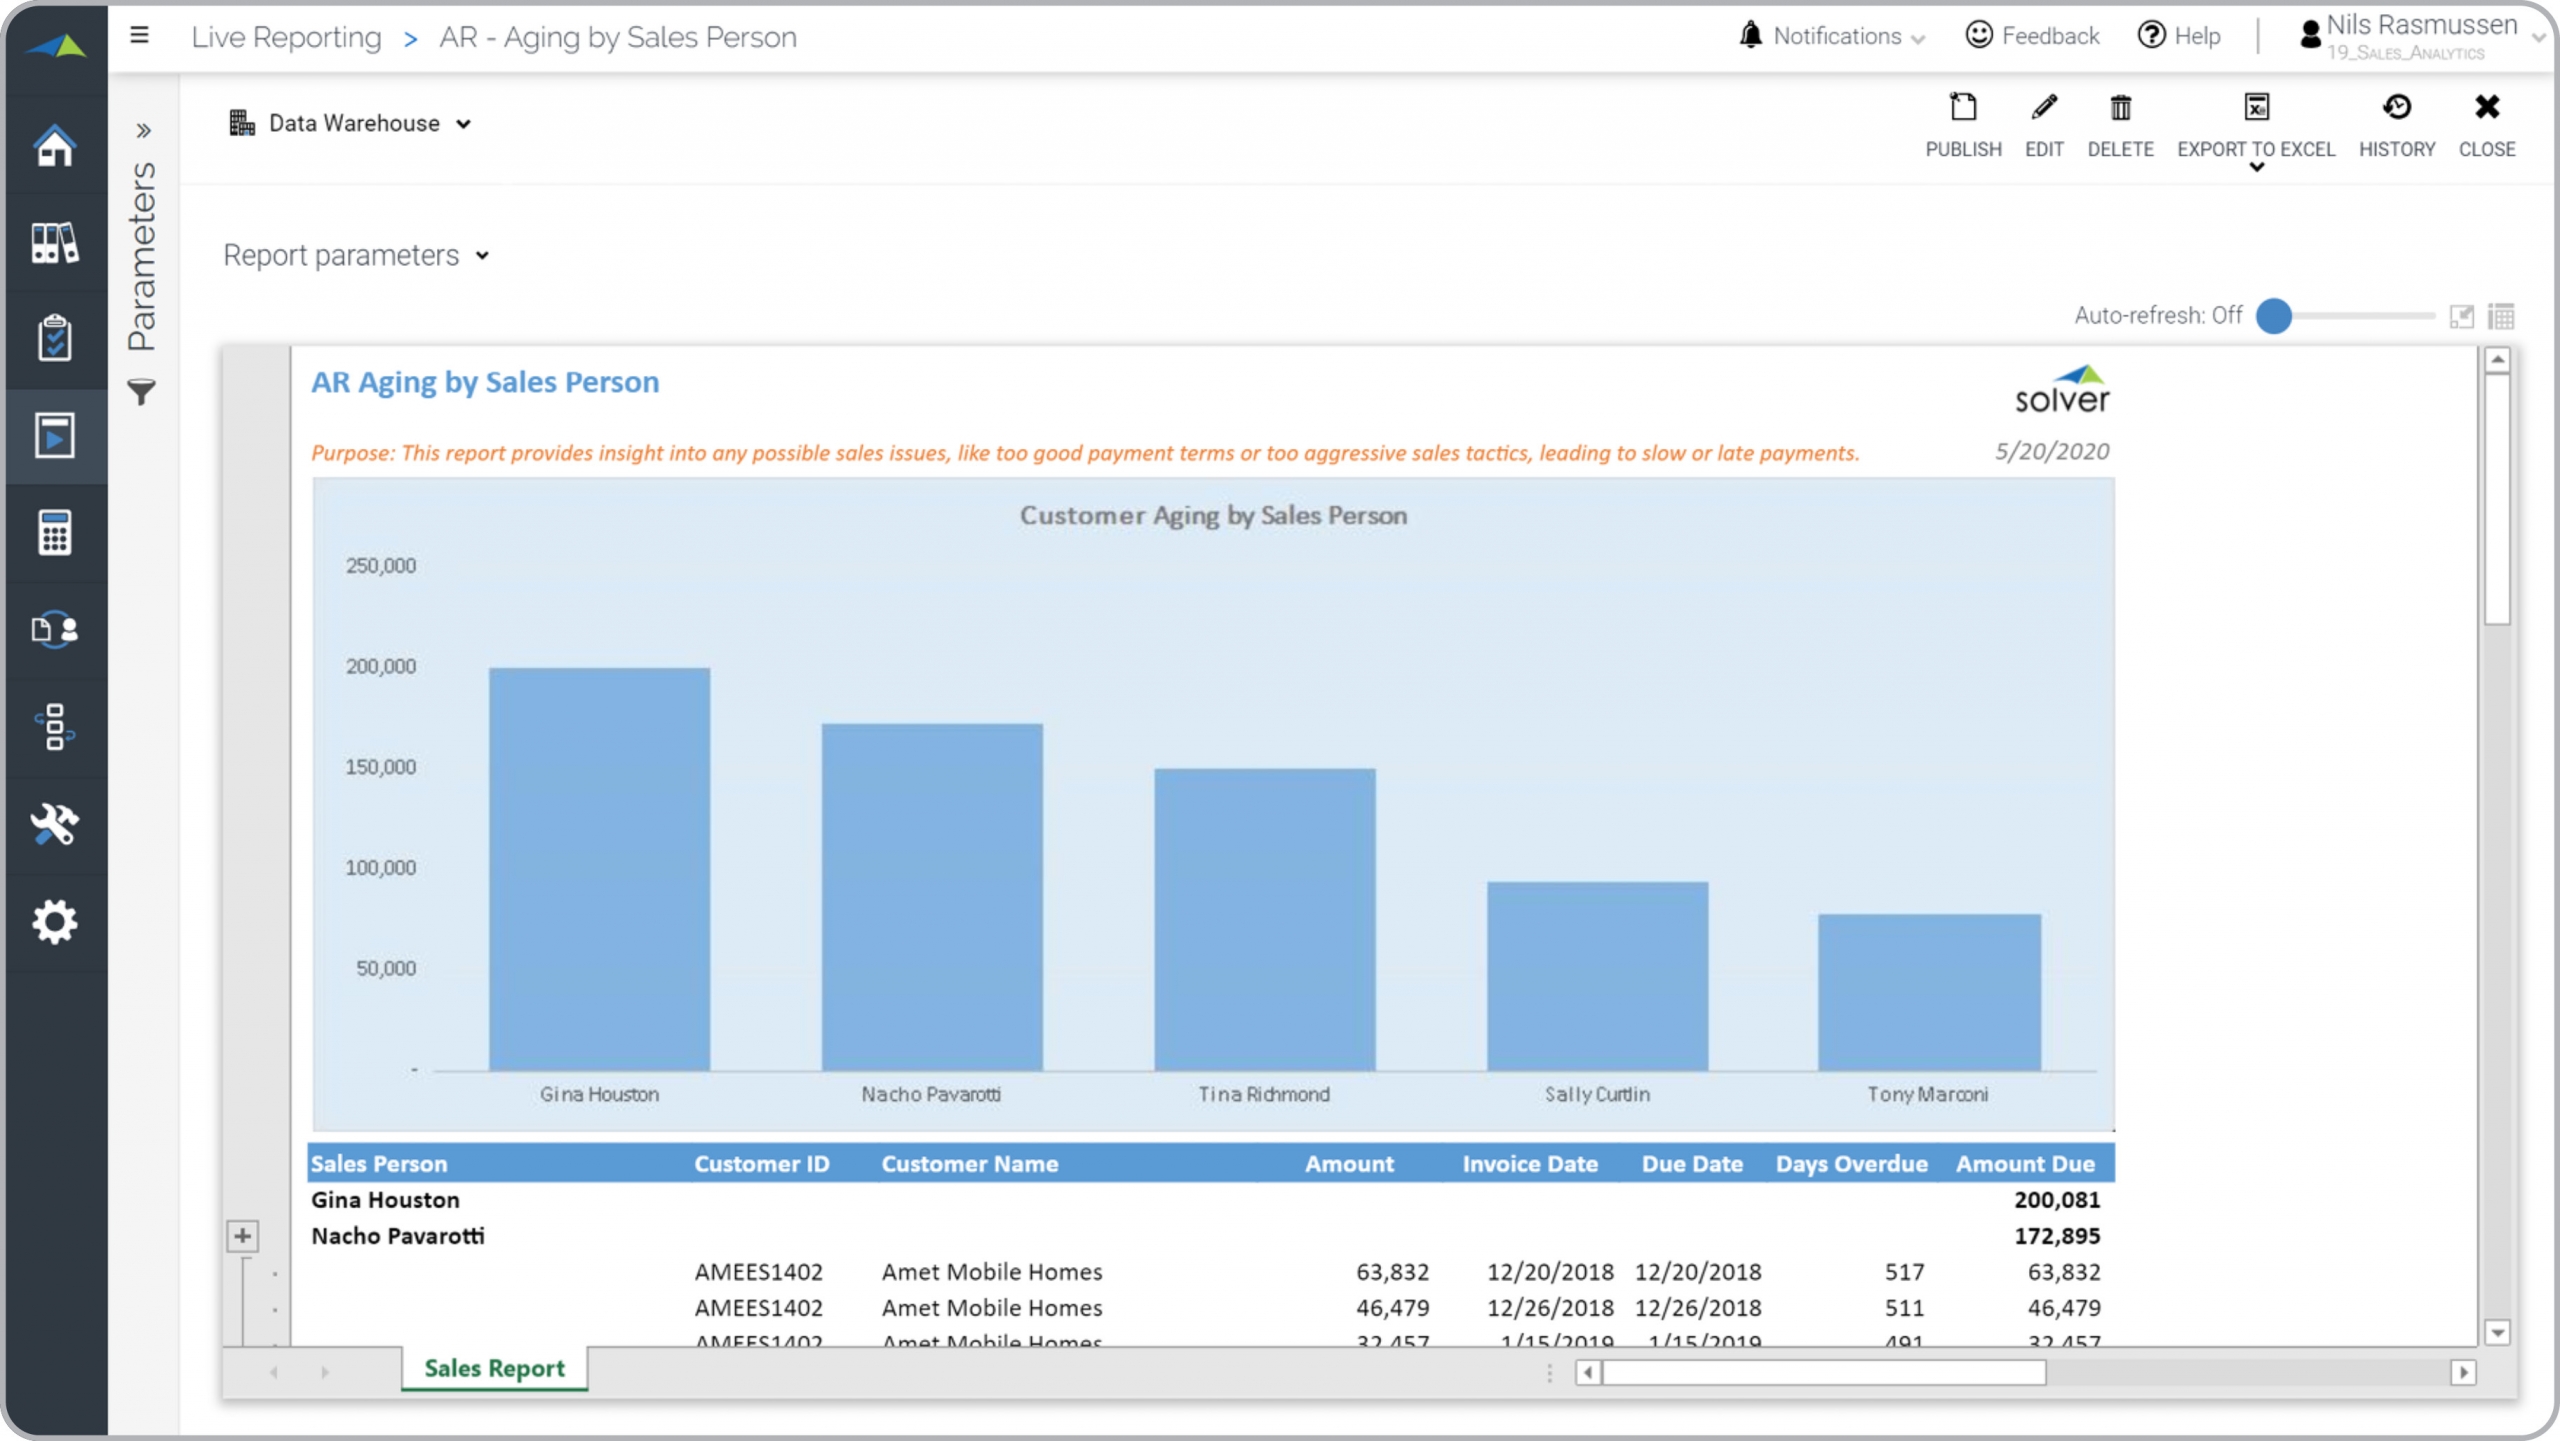
Customer Aging by Sales Person
The purpose of this report is to show if there is an anomaly in the AR aging by sales person.
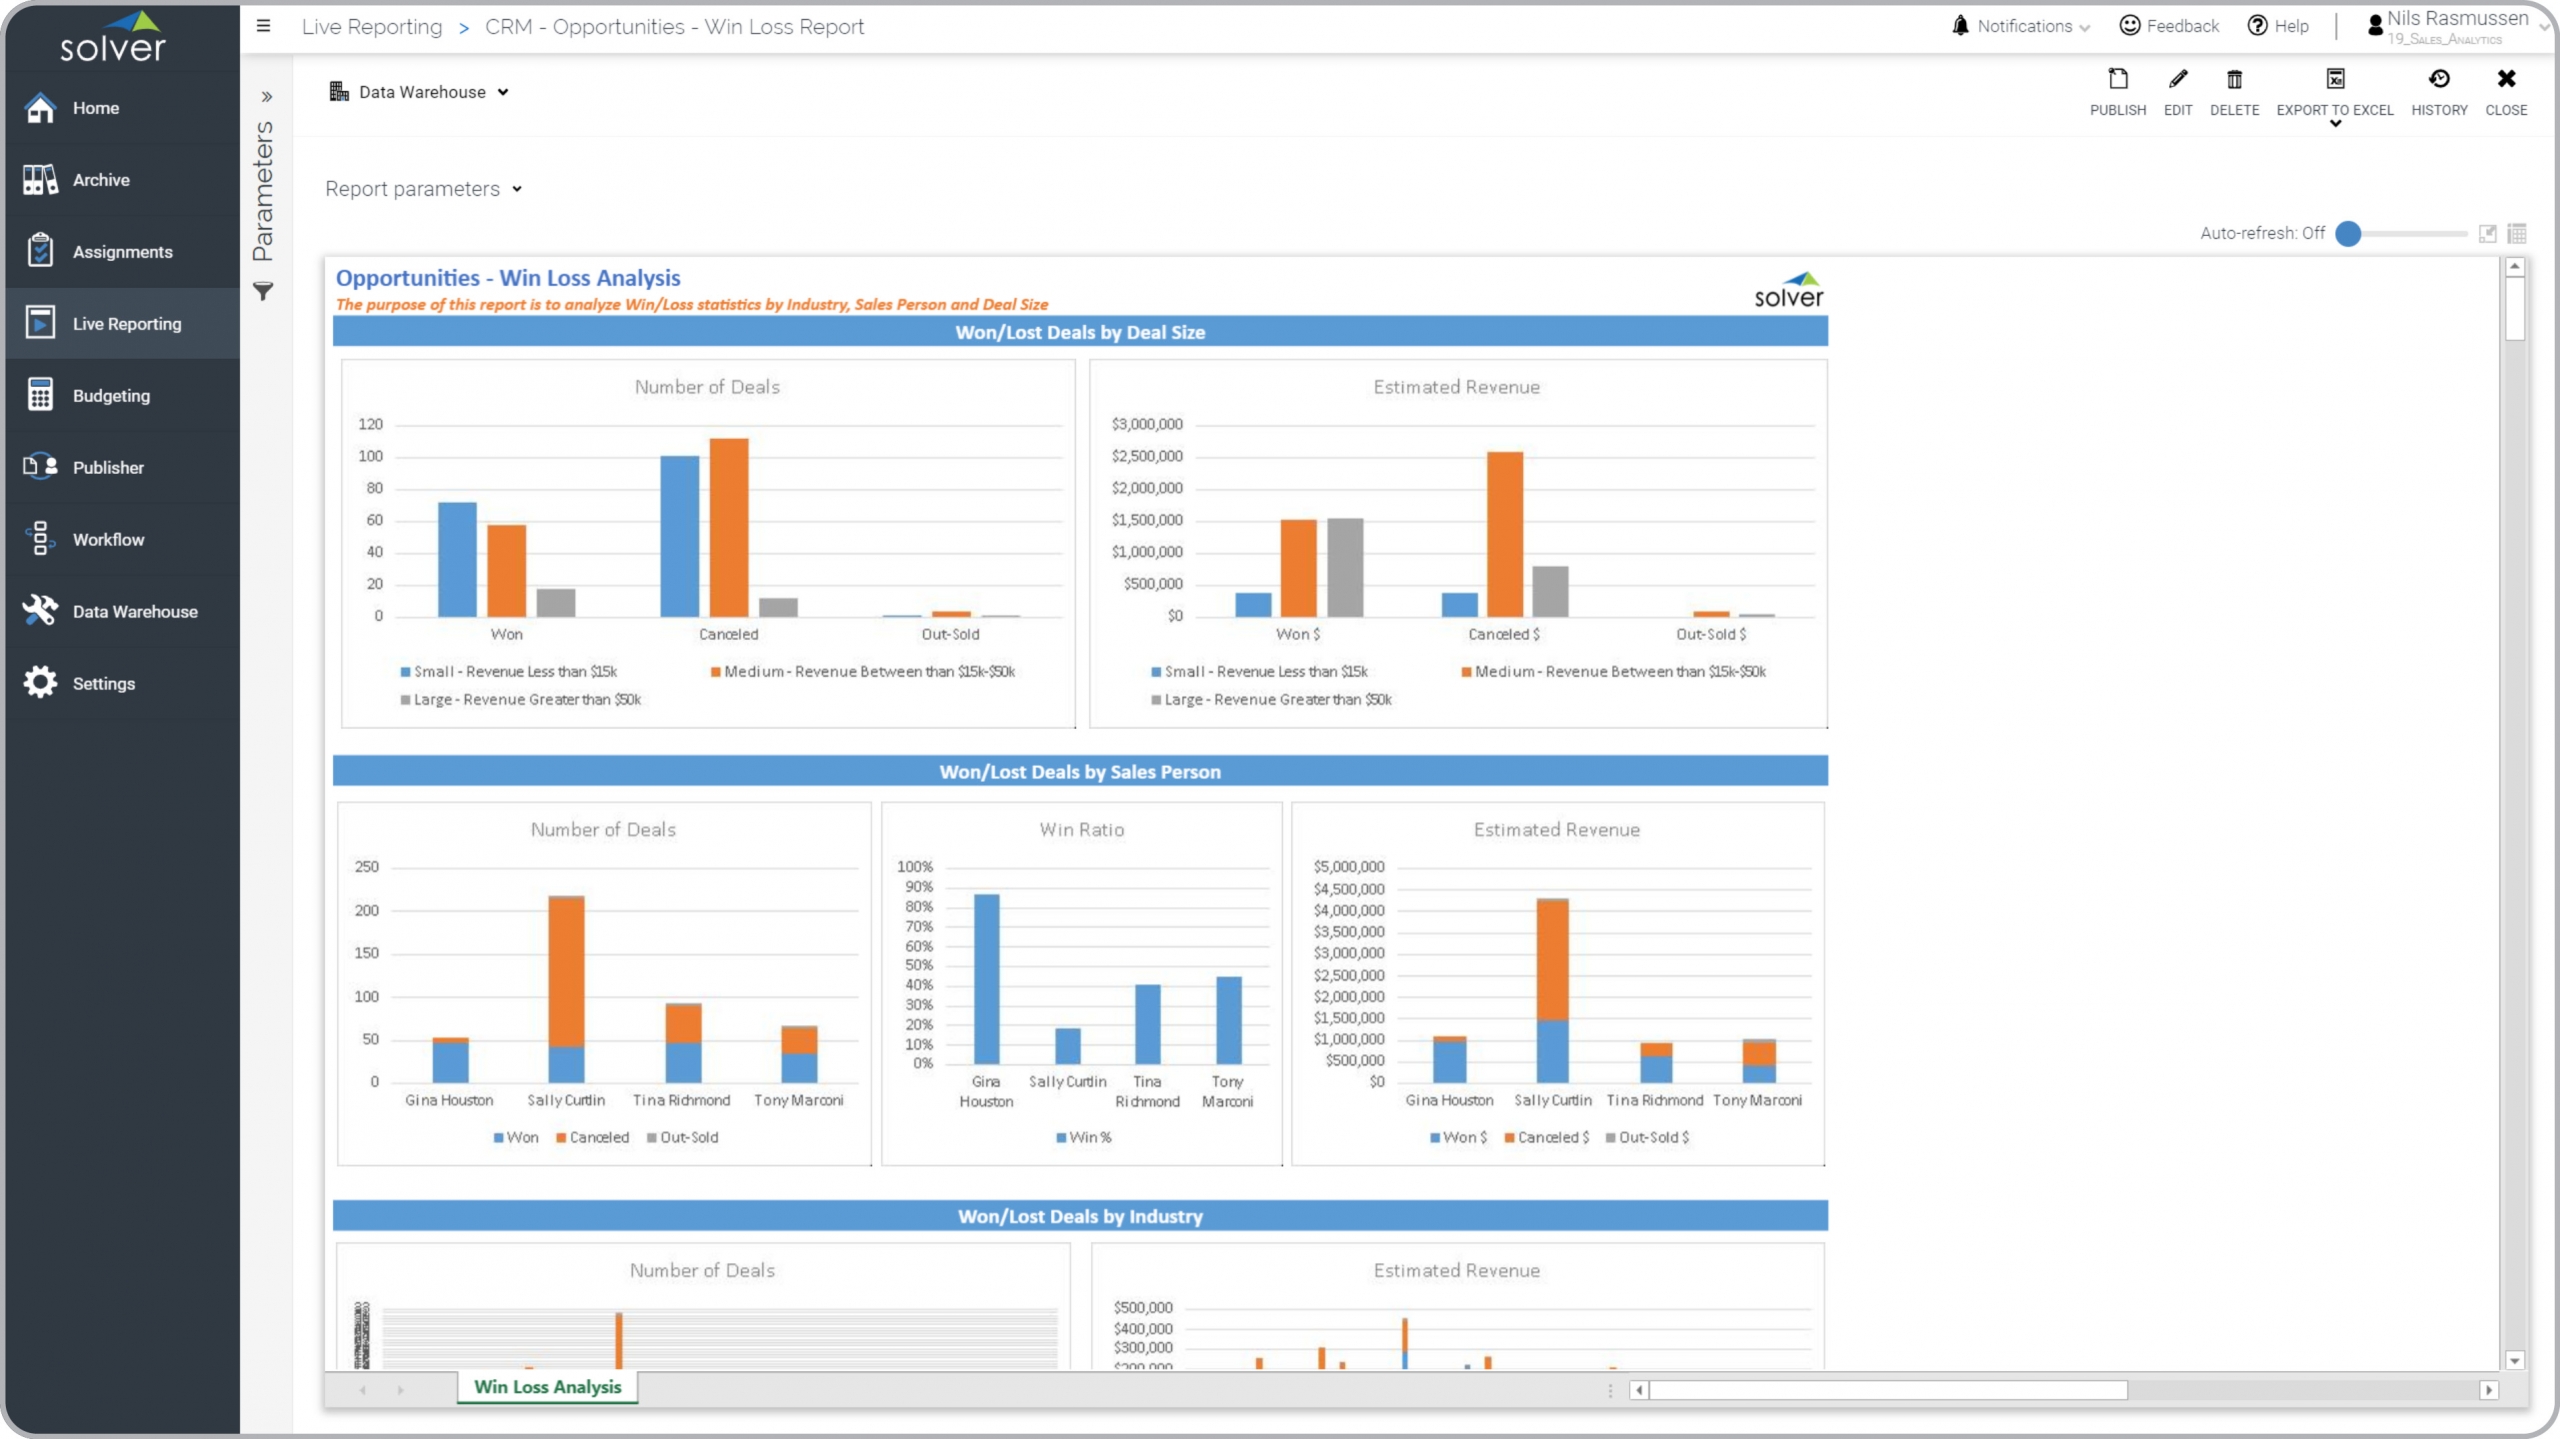
Win Loss Analysis Report
The report shows win loss metrics by person, deal size and industry.
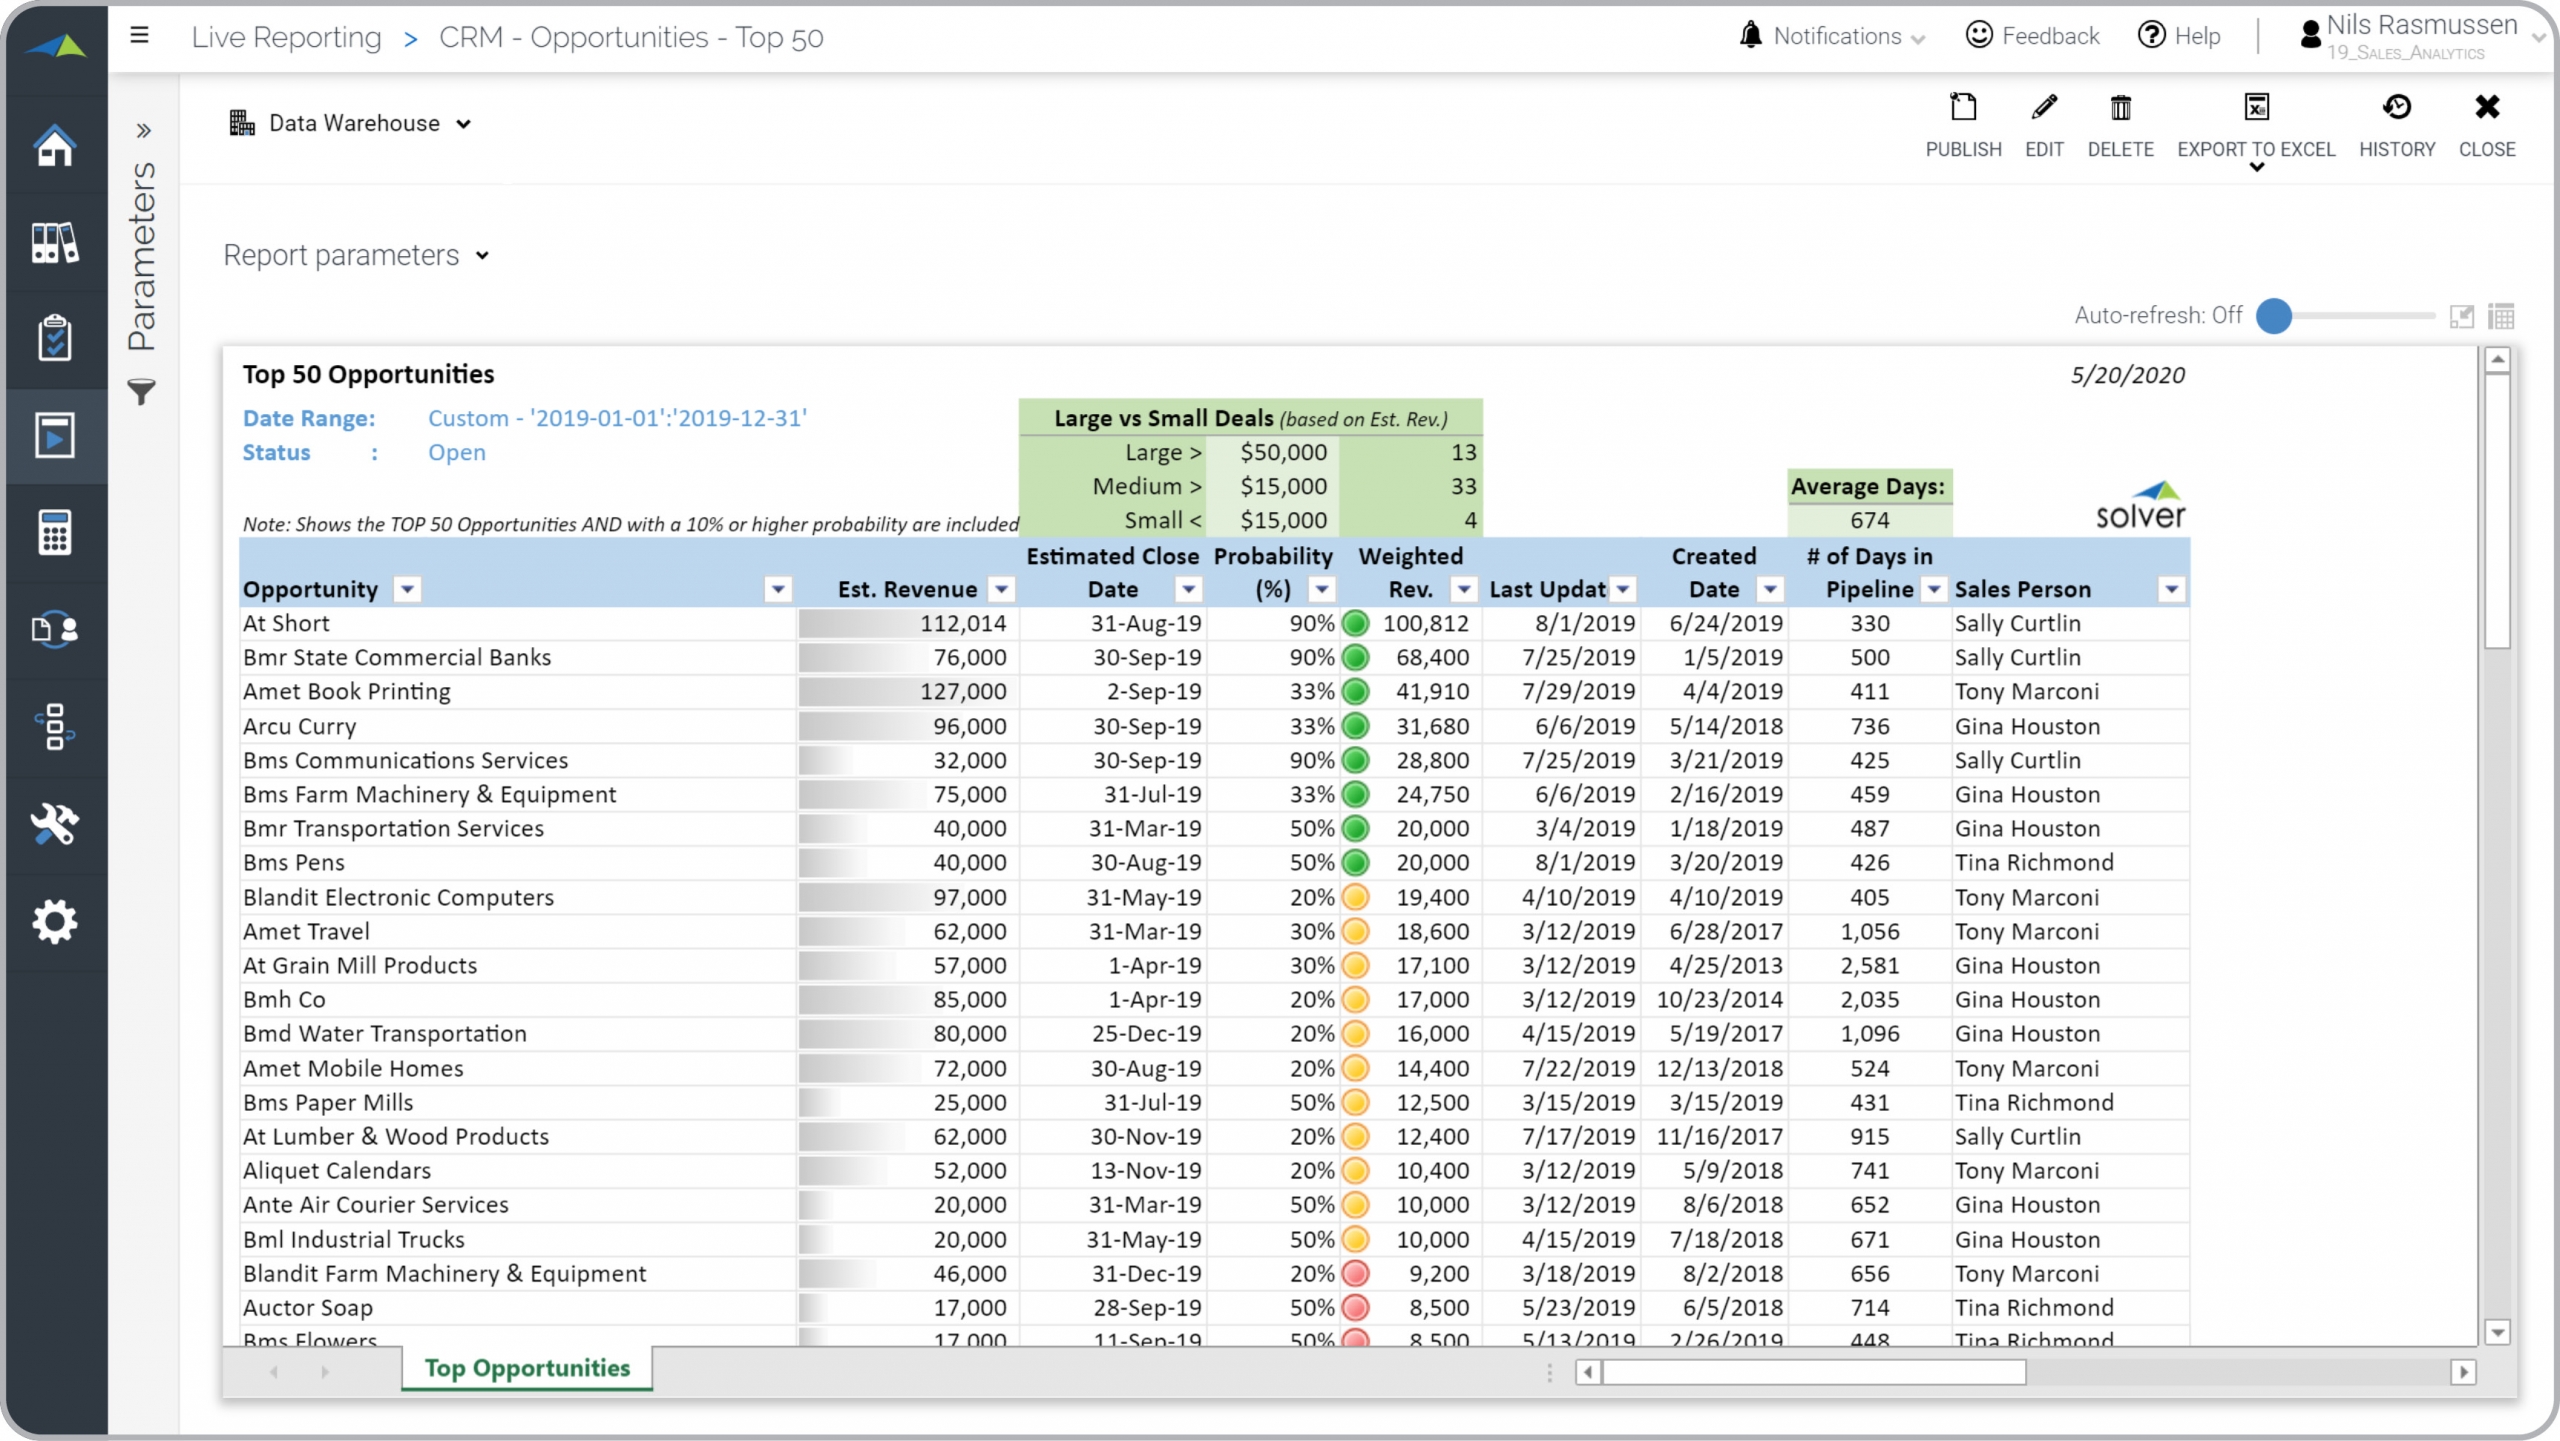
Top 50 Opportunities Report
This reports shows the top 50 opportunities ranked by weighted revenue.
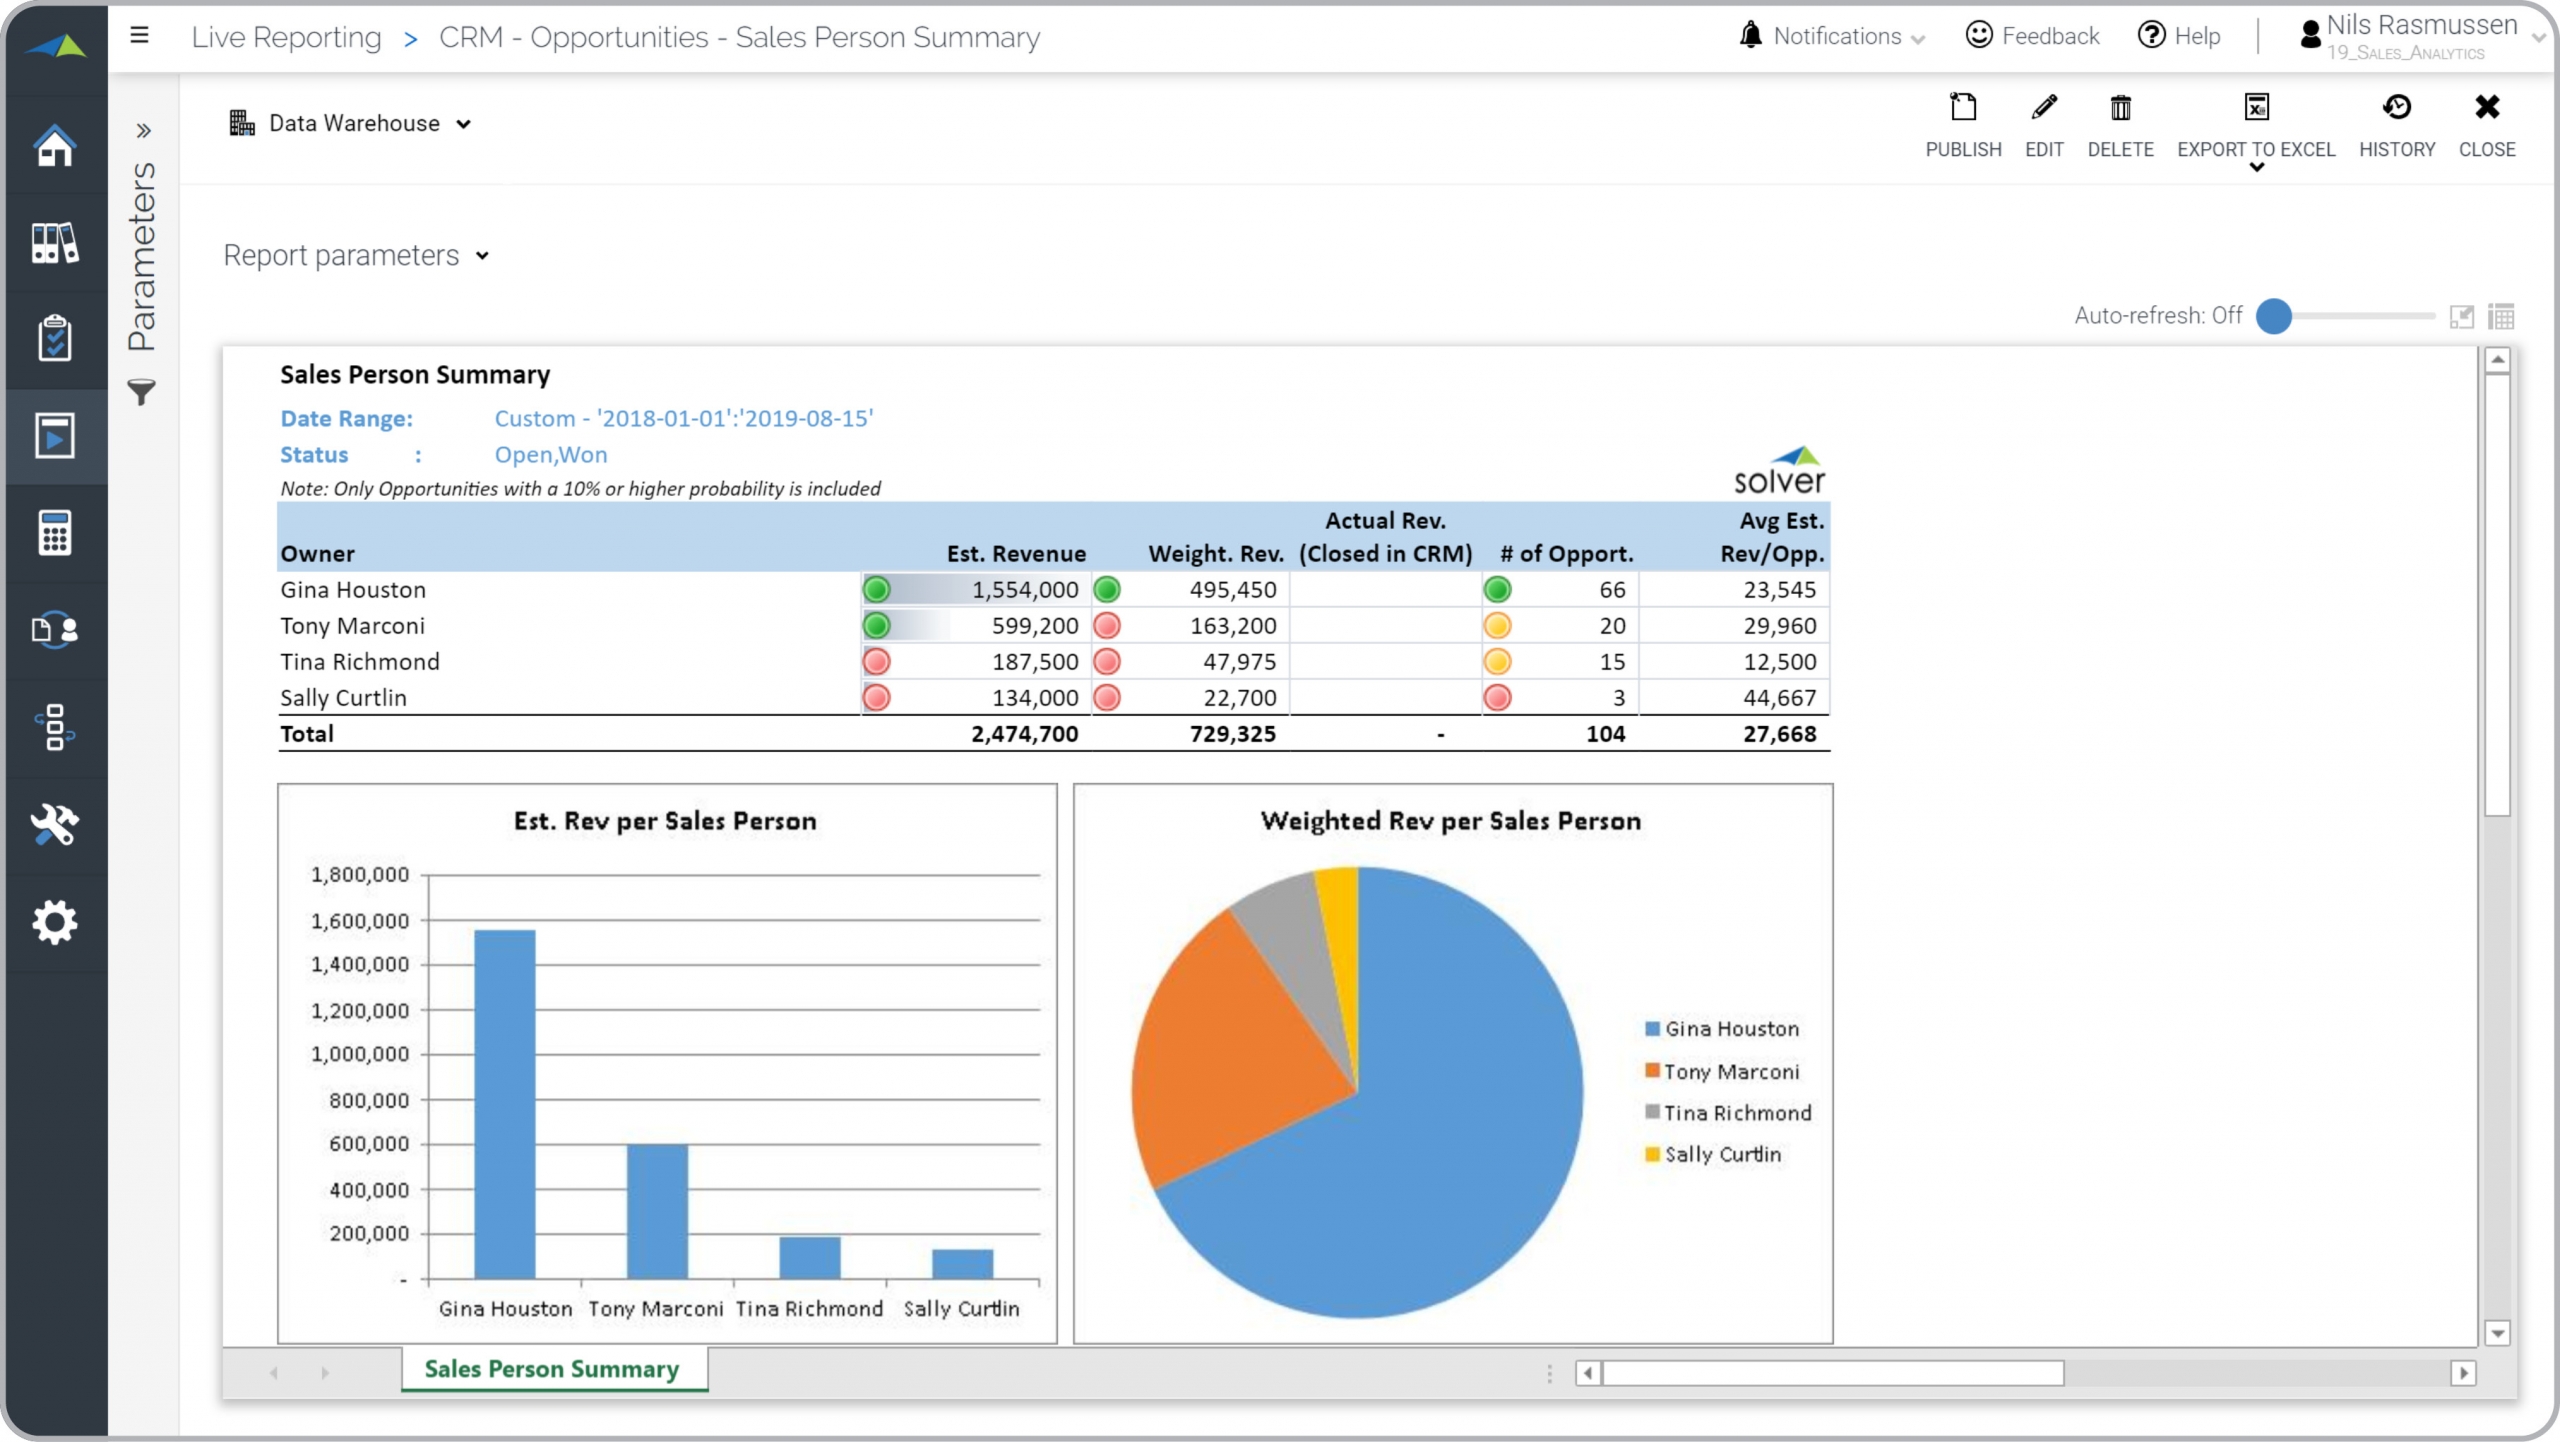
Sales Person Estimated Revenue
Summary report ranking sales people based on estimated revenue from their pipeline.
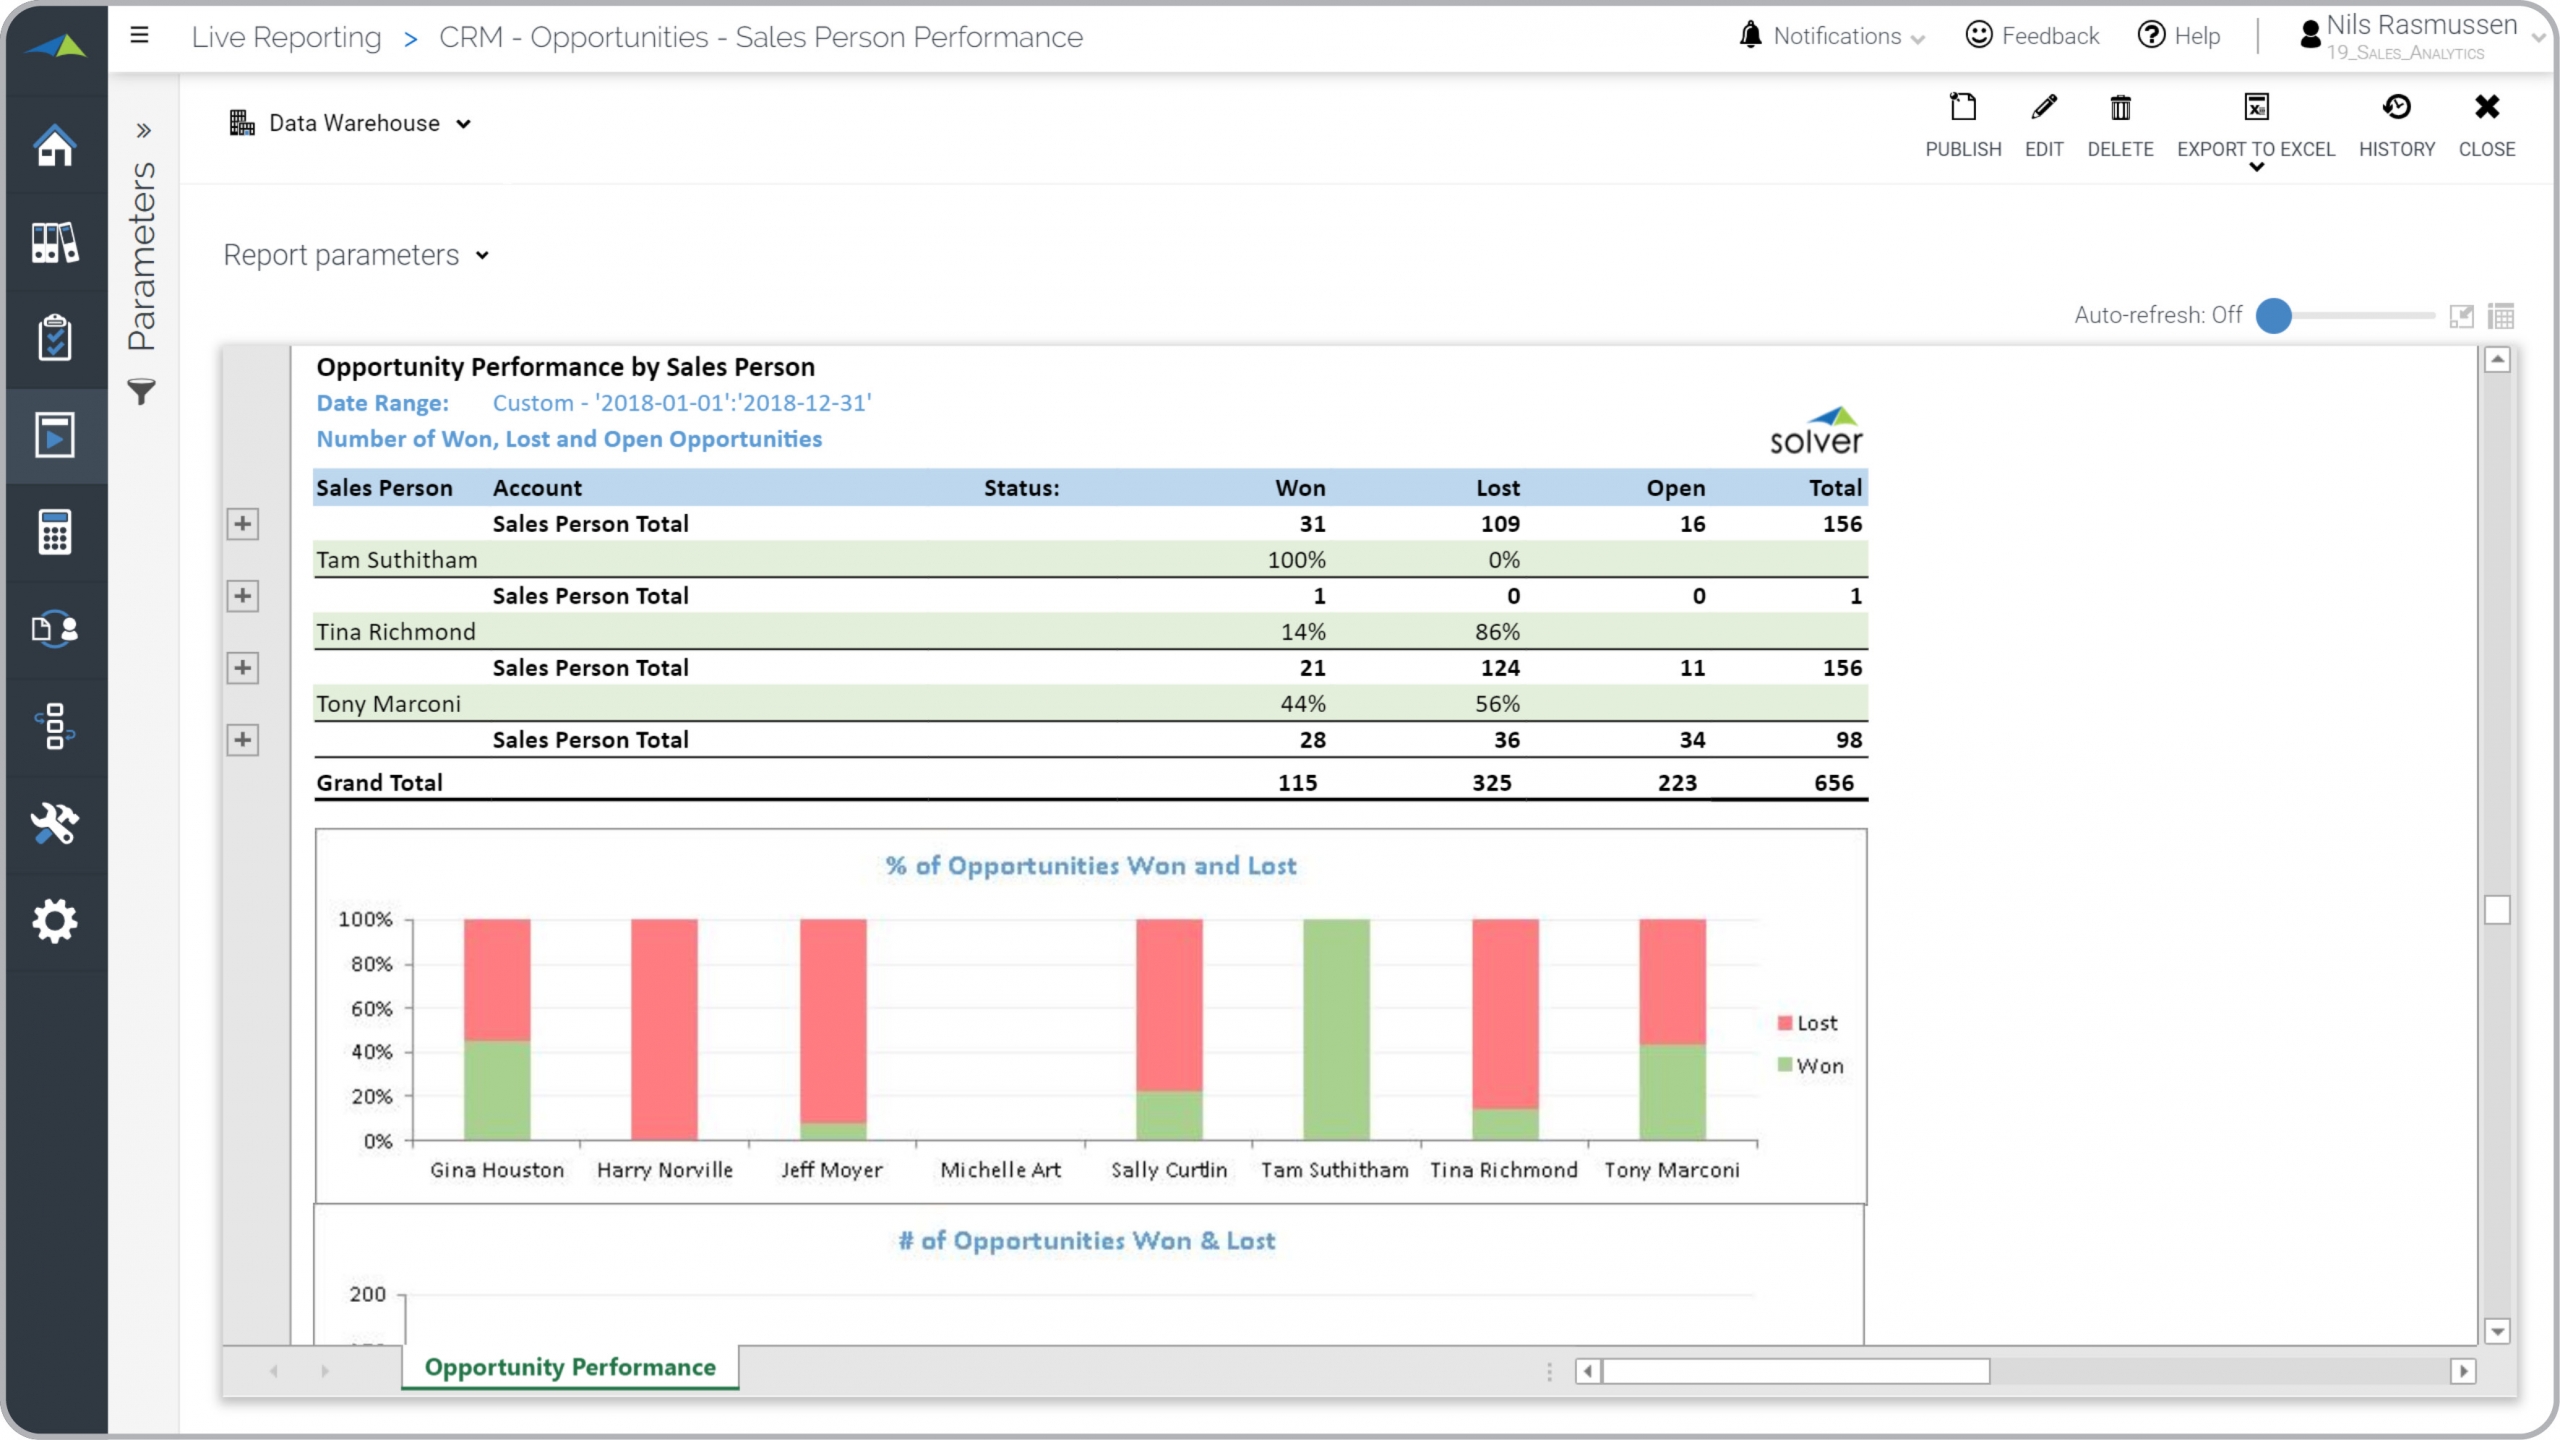
Opportunity Win Loss Analysis
CRM Opportunity performance by Sales person with Win Loss analysis.
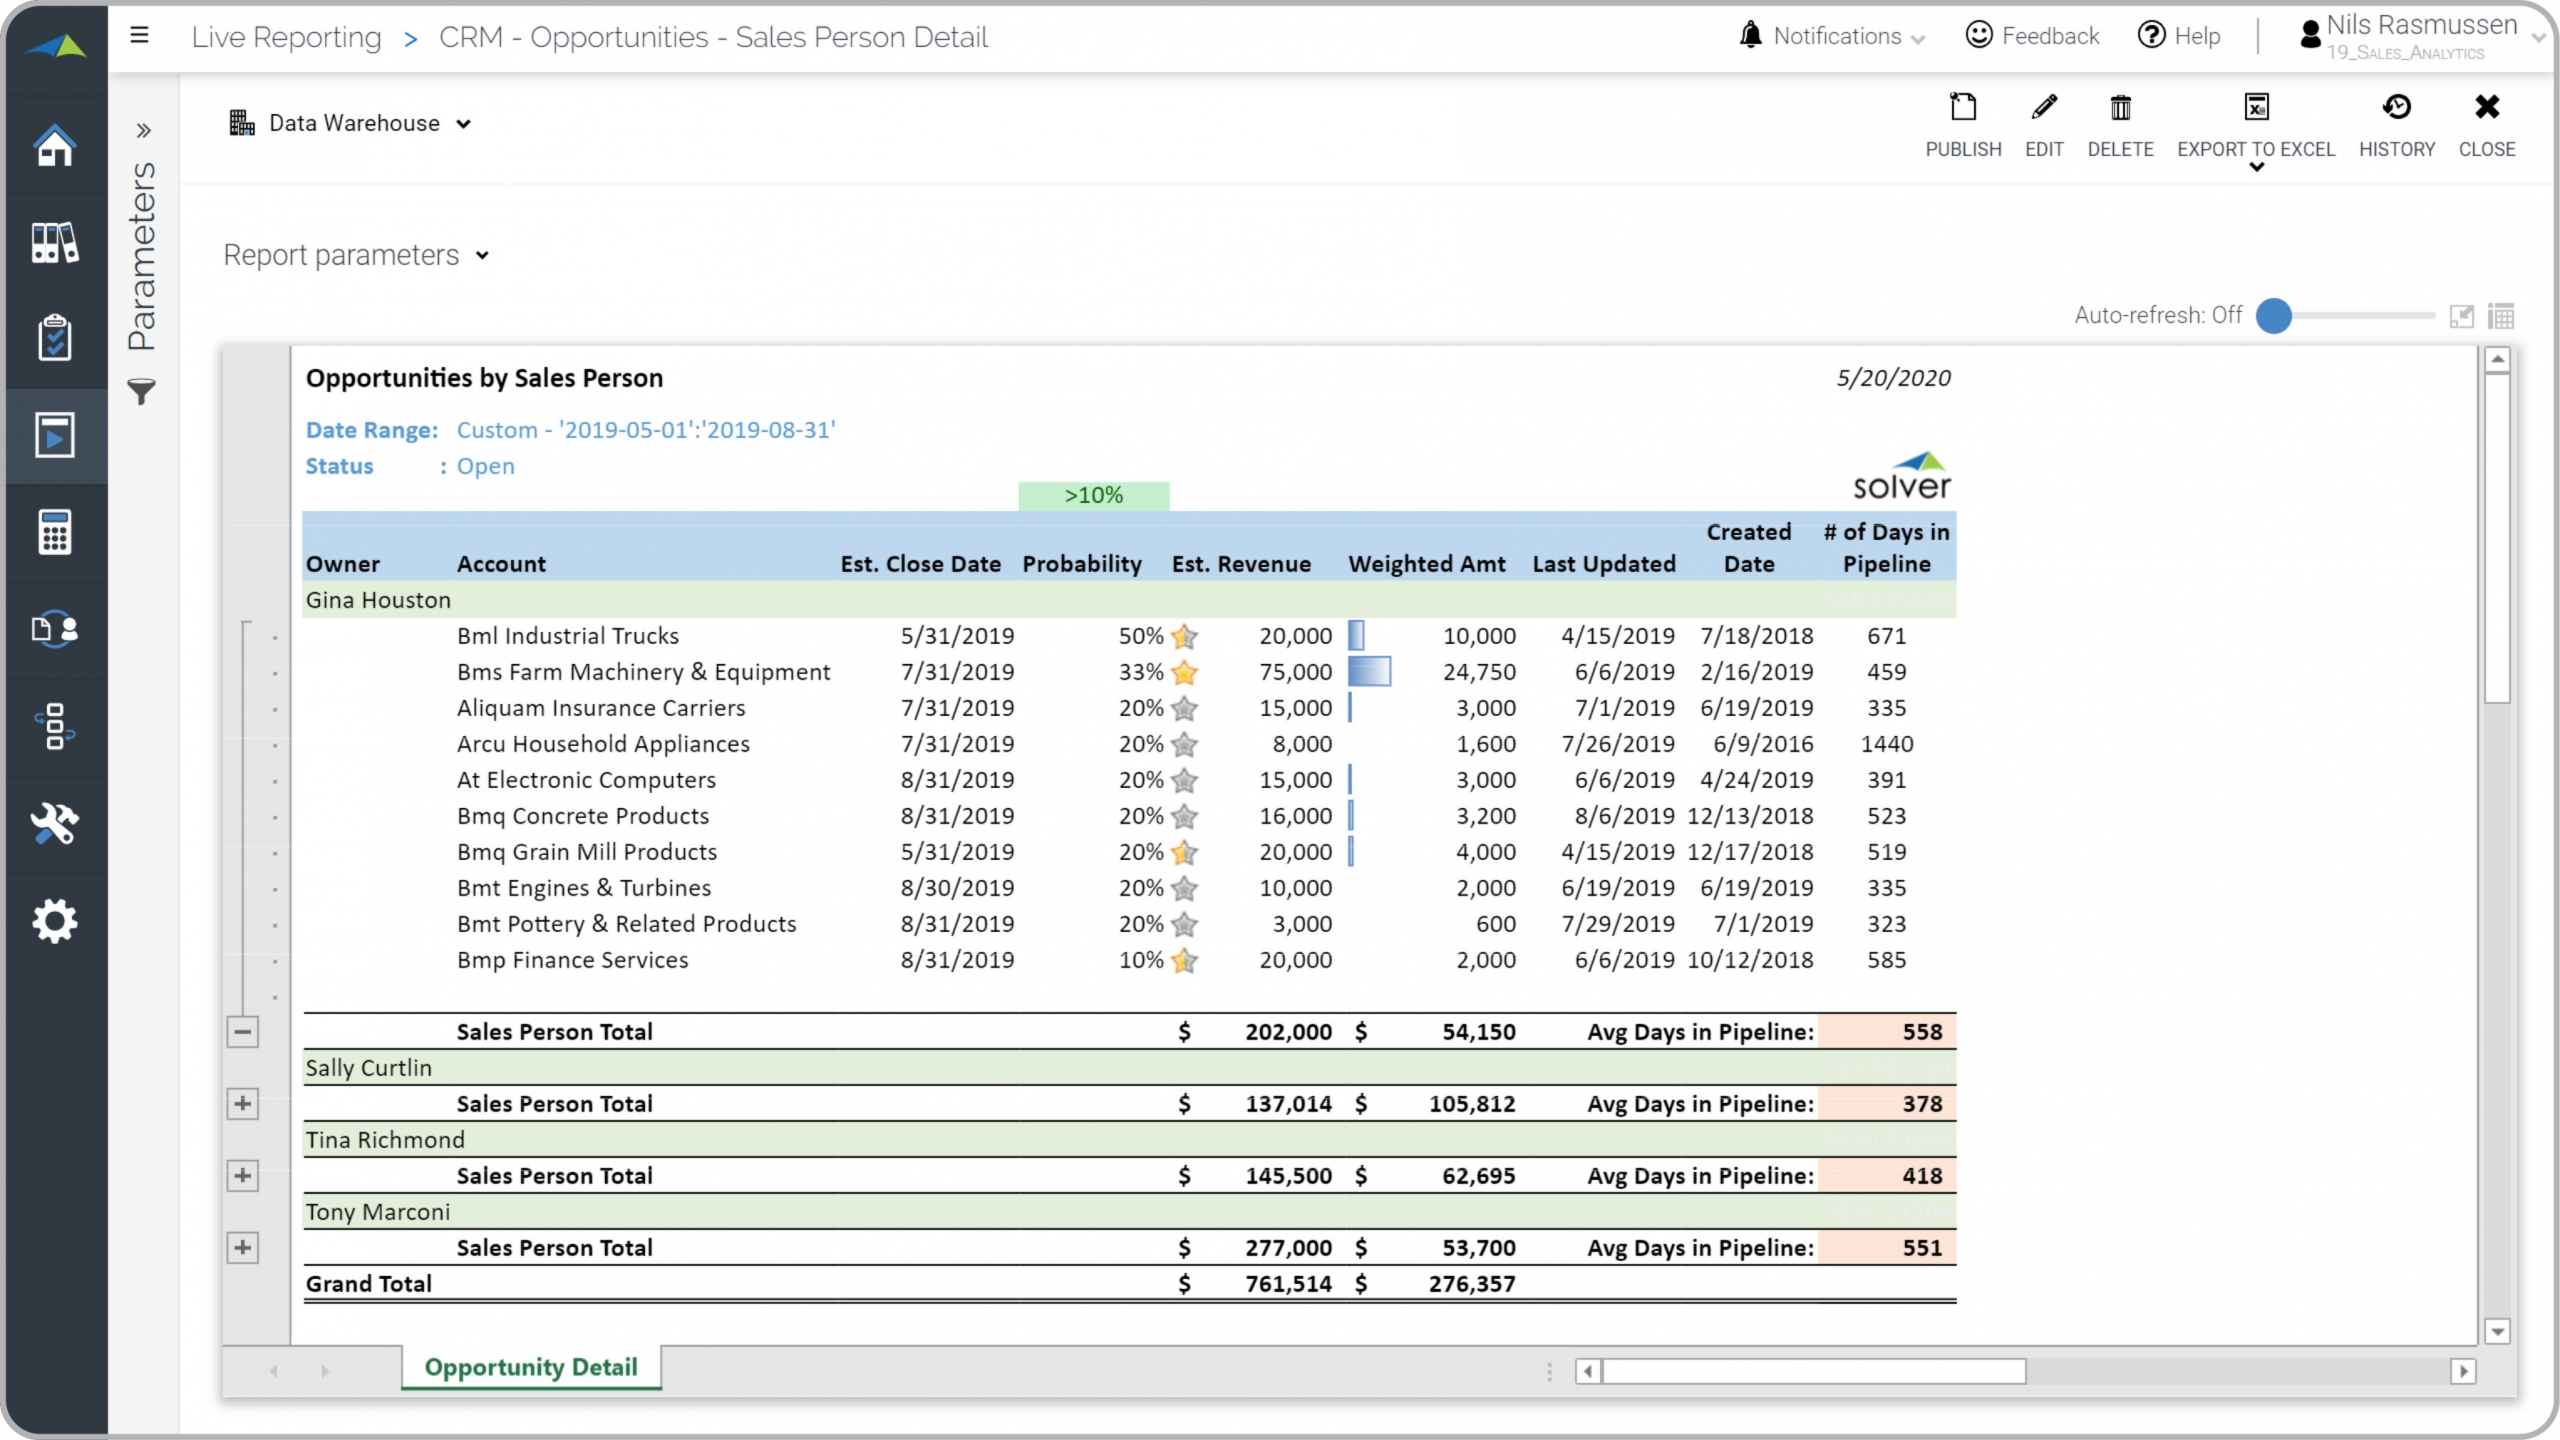
Opportunities by Sales Person
Detailed CRM opportunity information and summary showing performance by sales person.
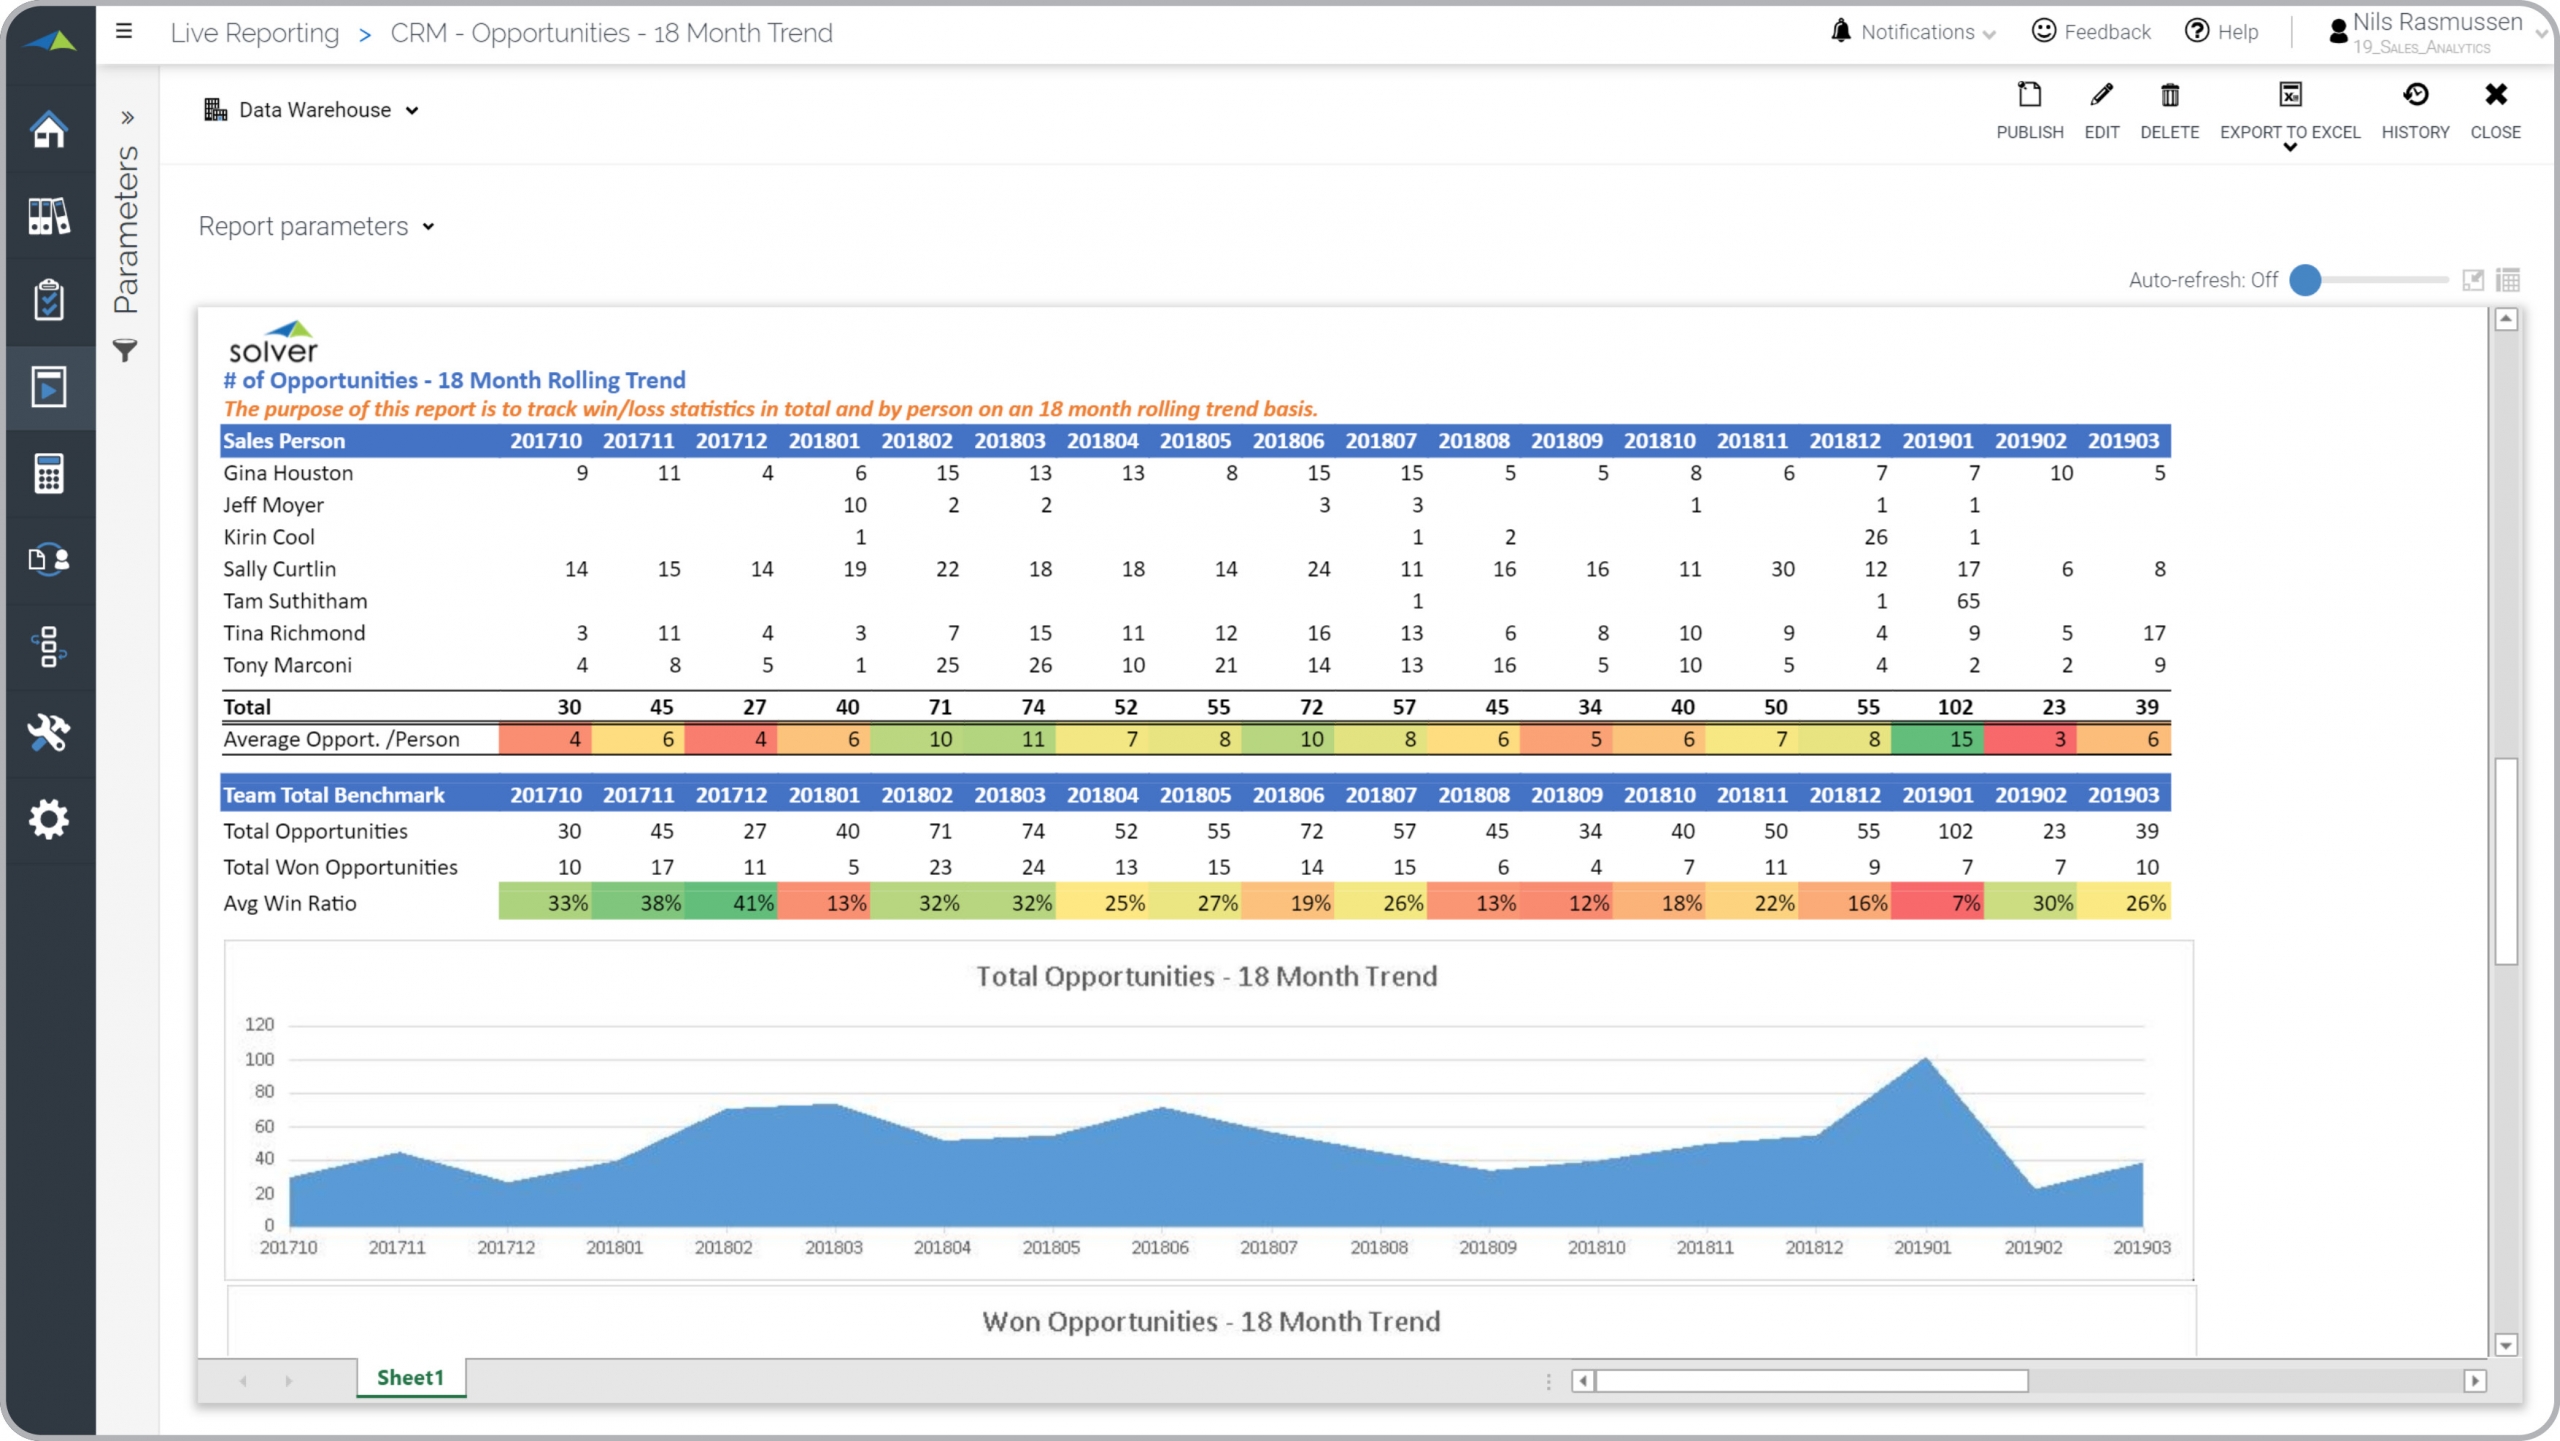
Opportunity Count Trend
Shows opportunity count and Win Loss metrics per sales person and in total.
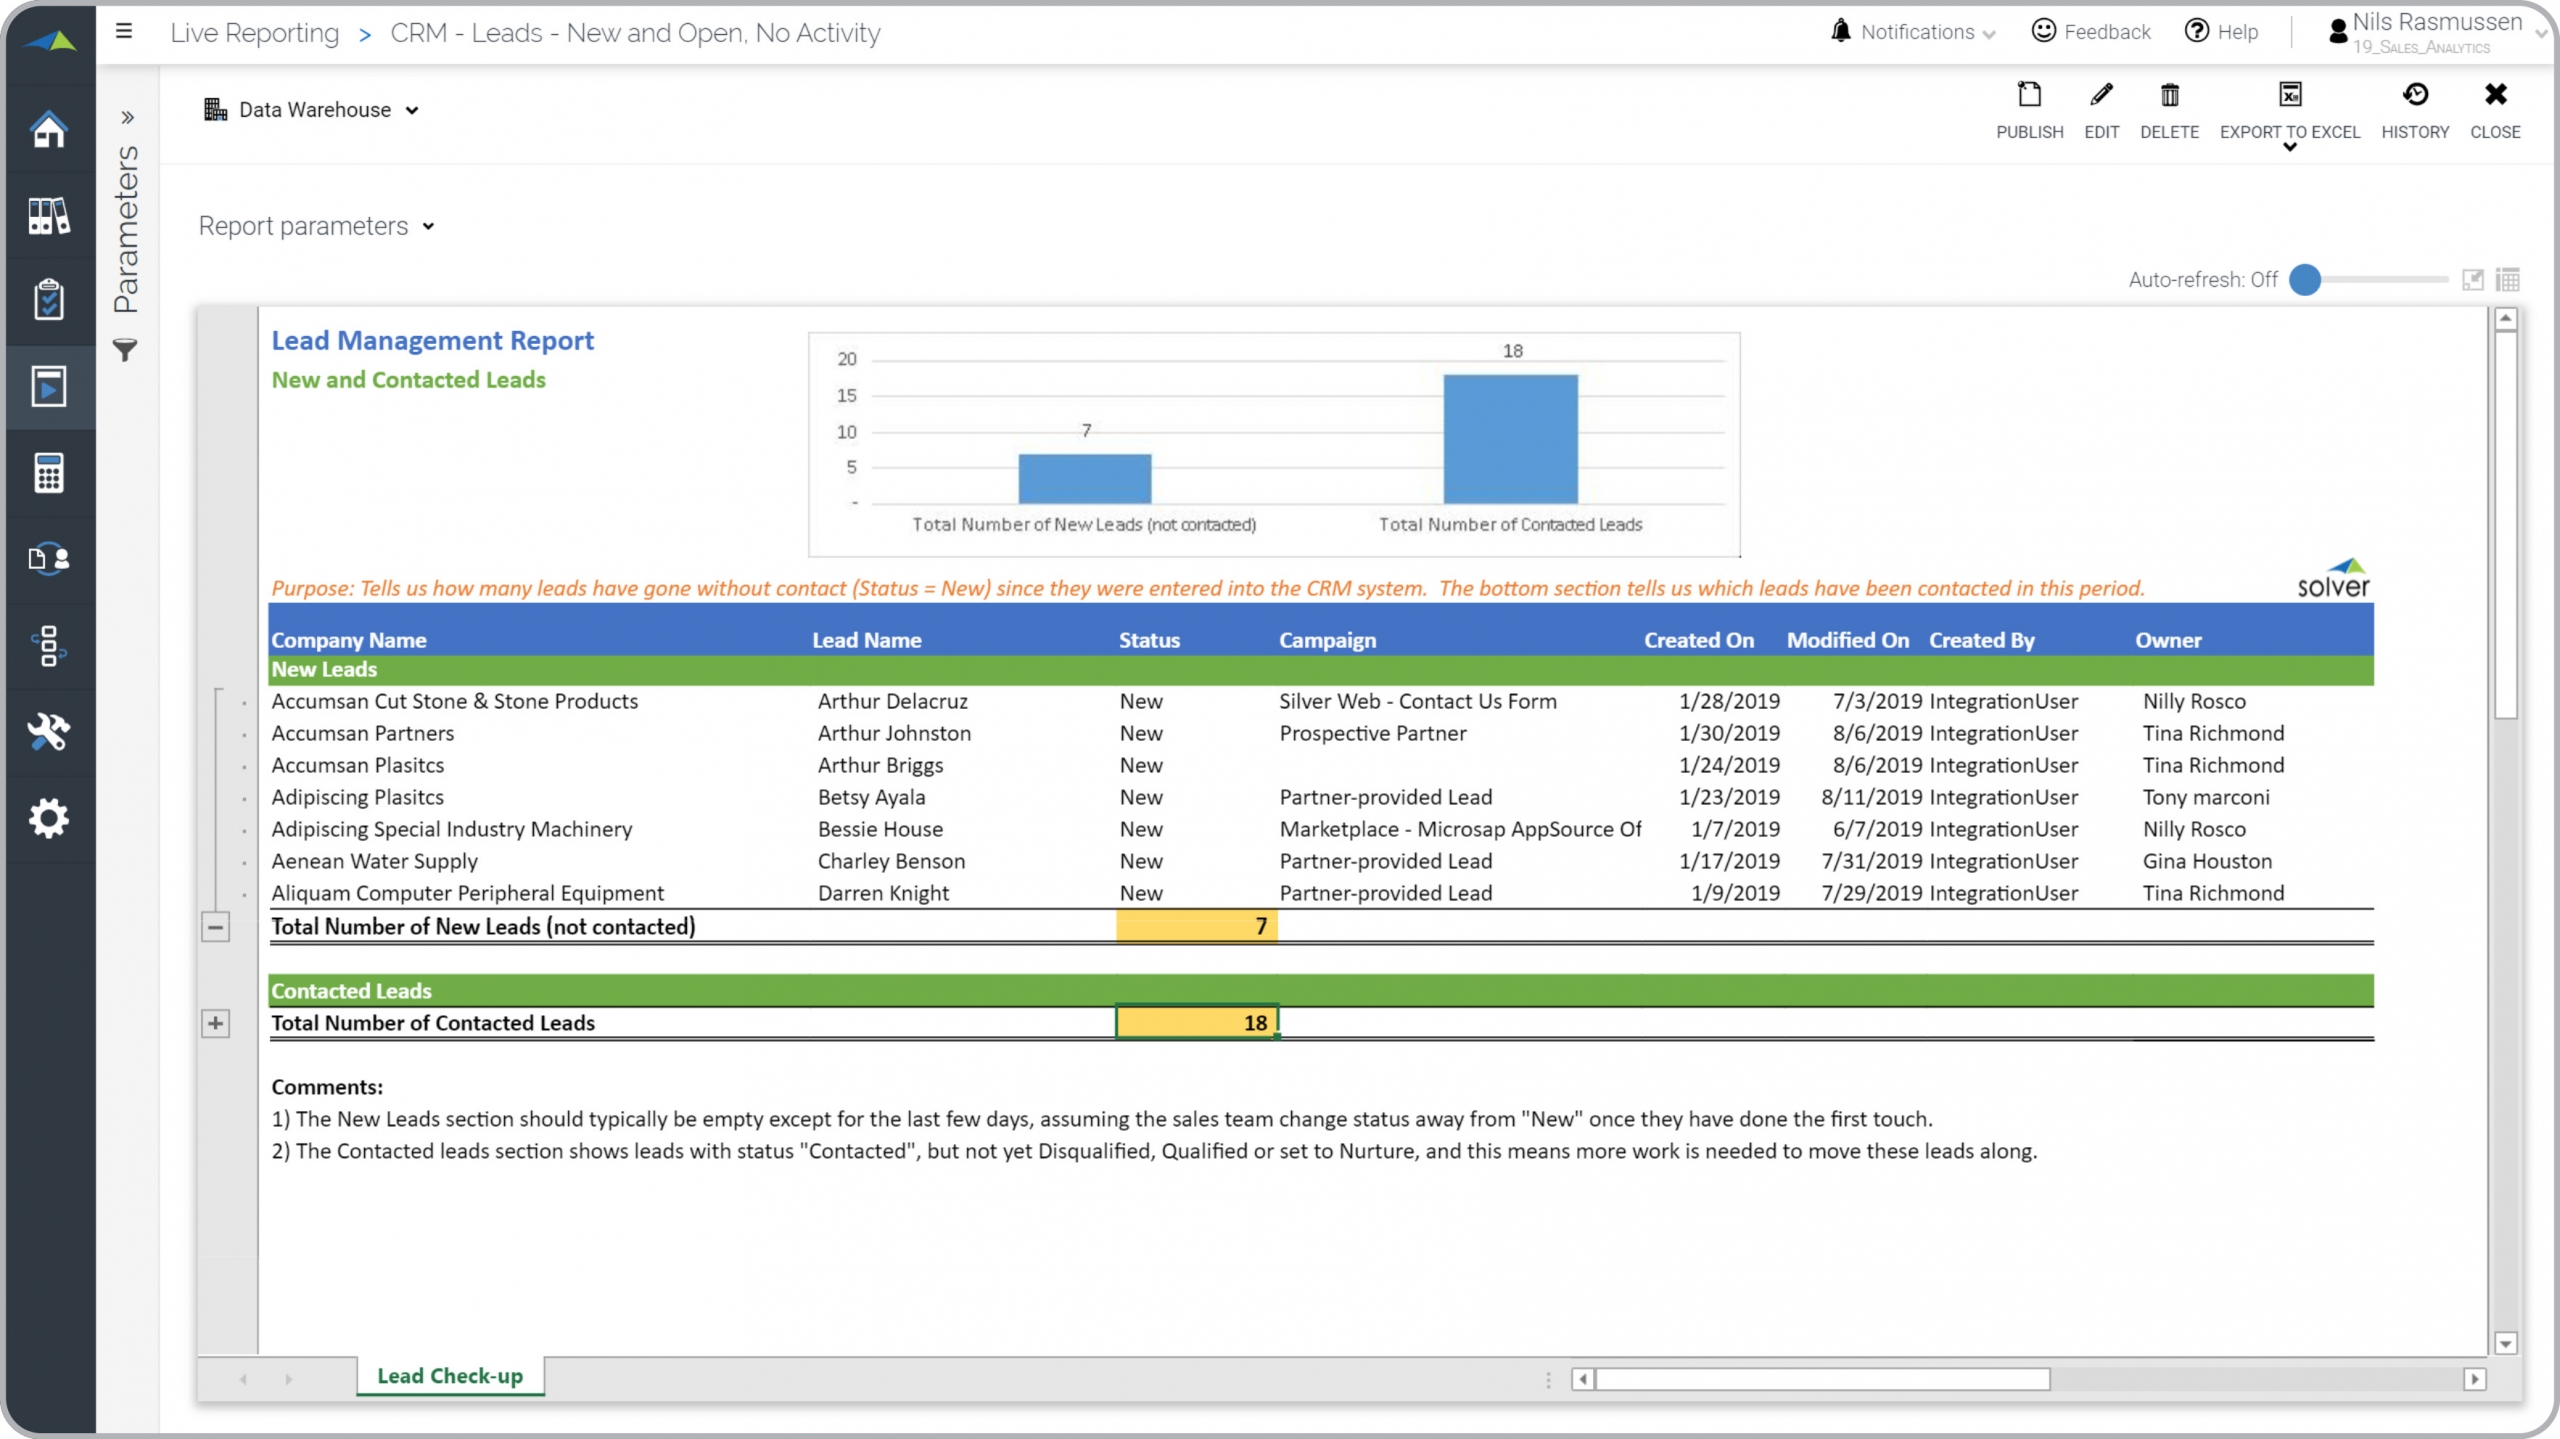
Lead Management Report
Tracks the status and count on New and Contacted CRM leads.
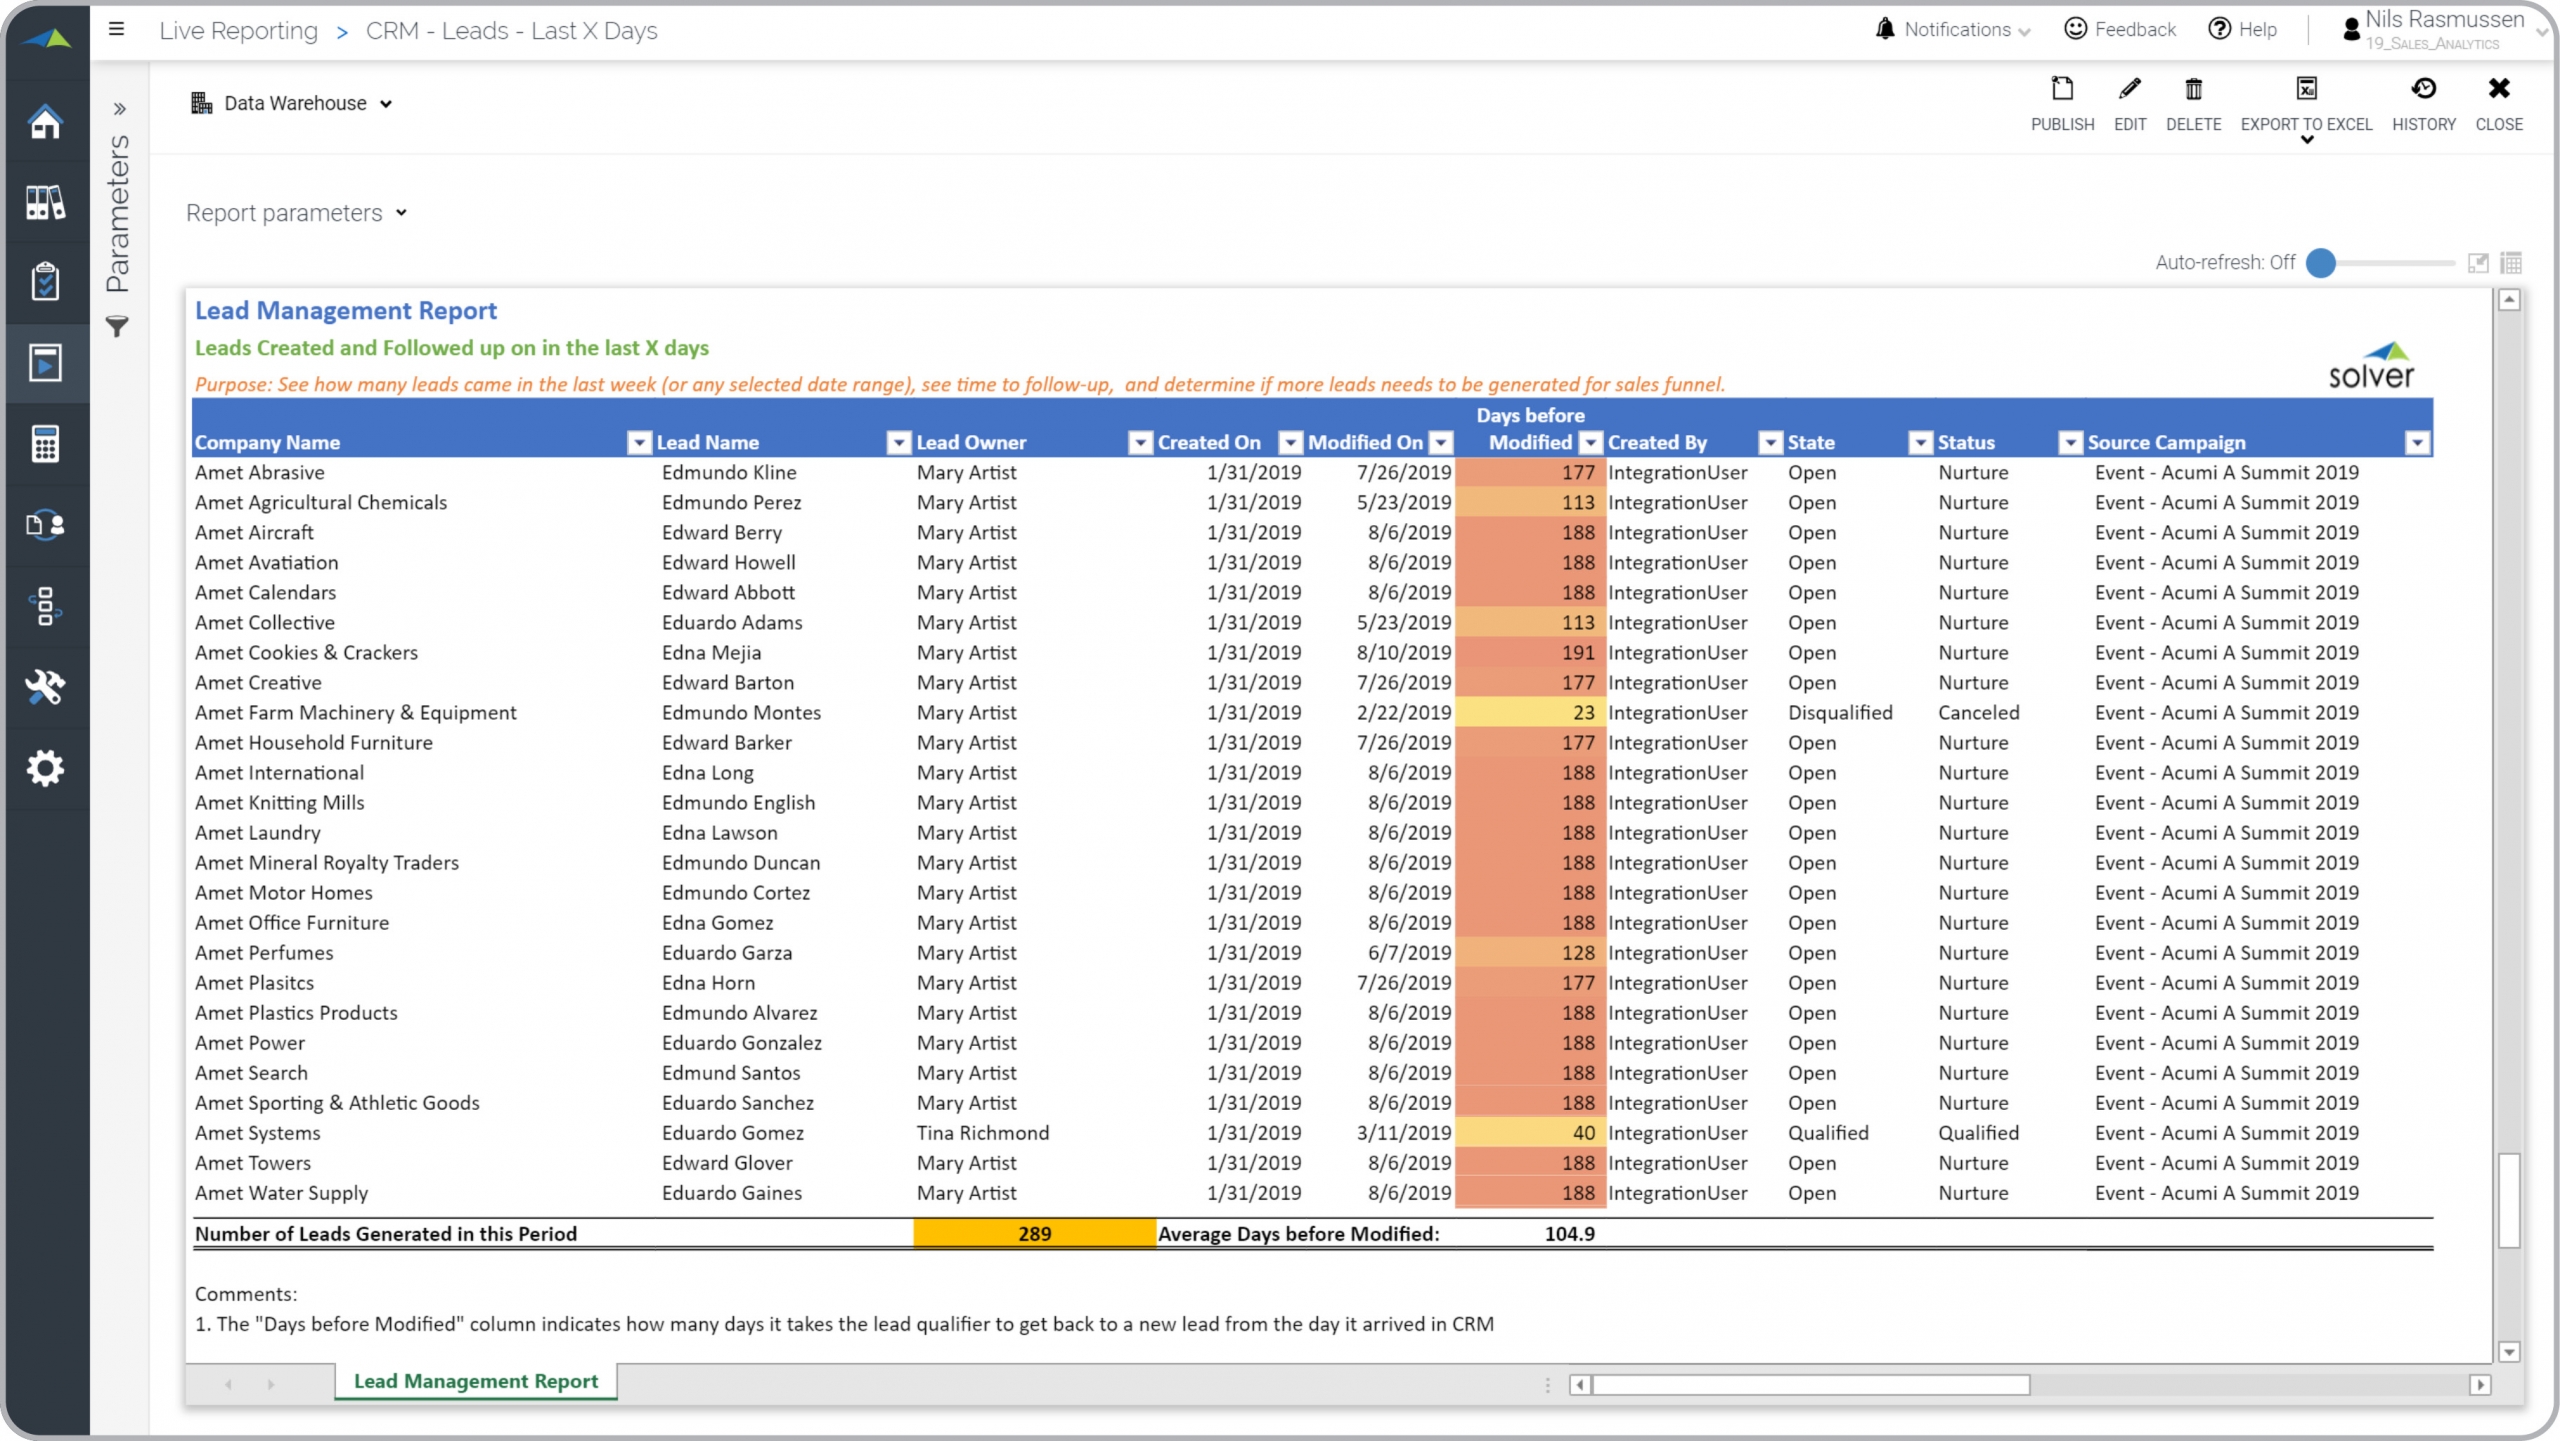
Lead Follow-up Tracking Report
Tracks the sales team's ability to follow up on CRM leads for a given period.
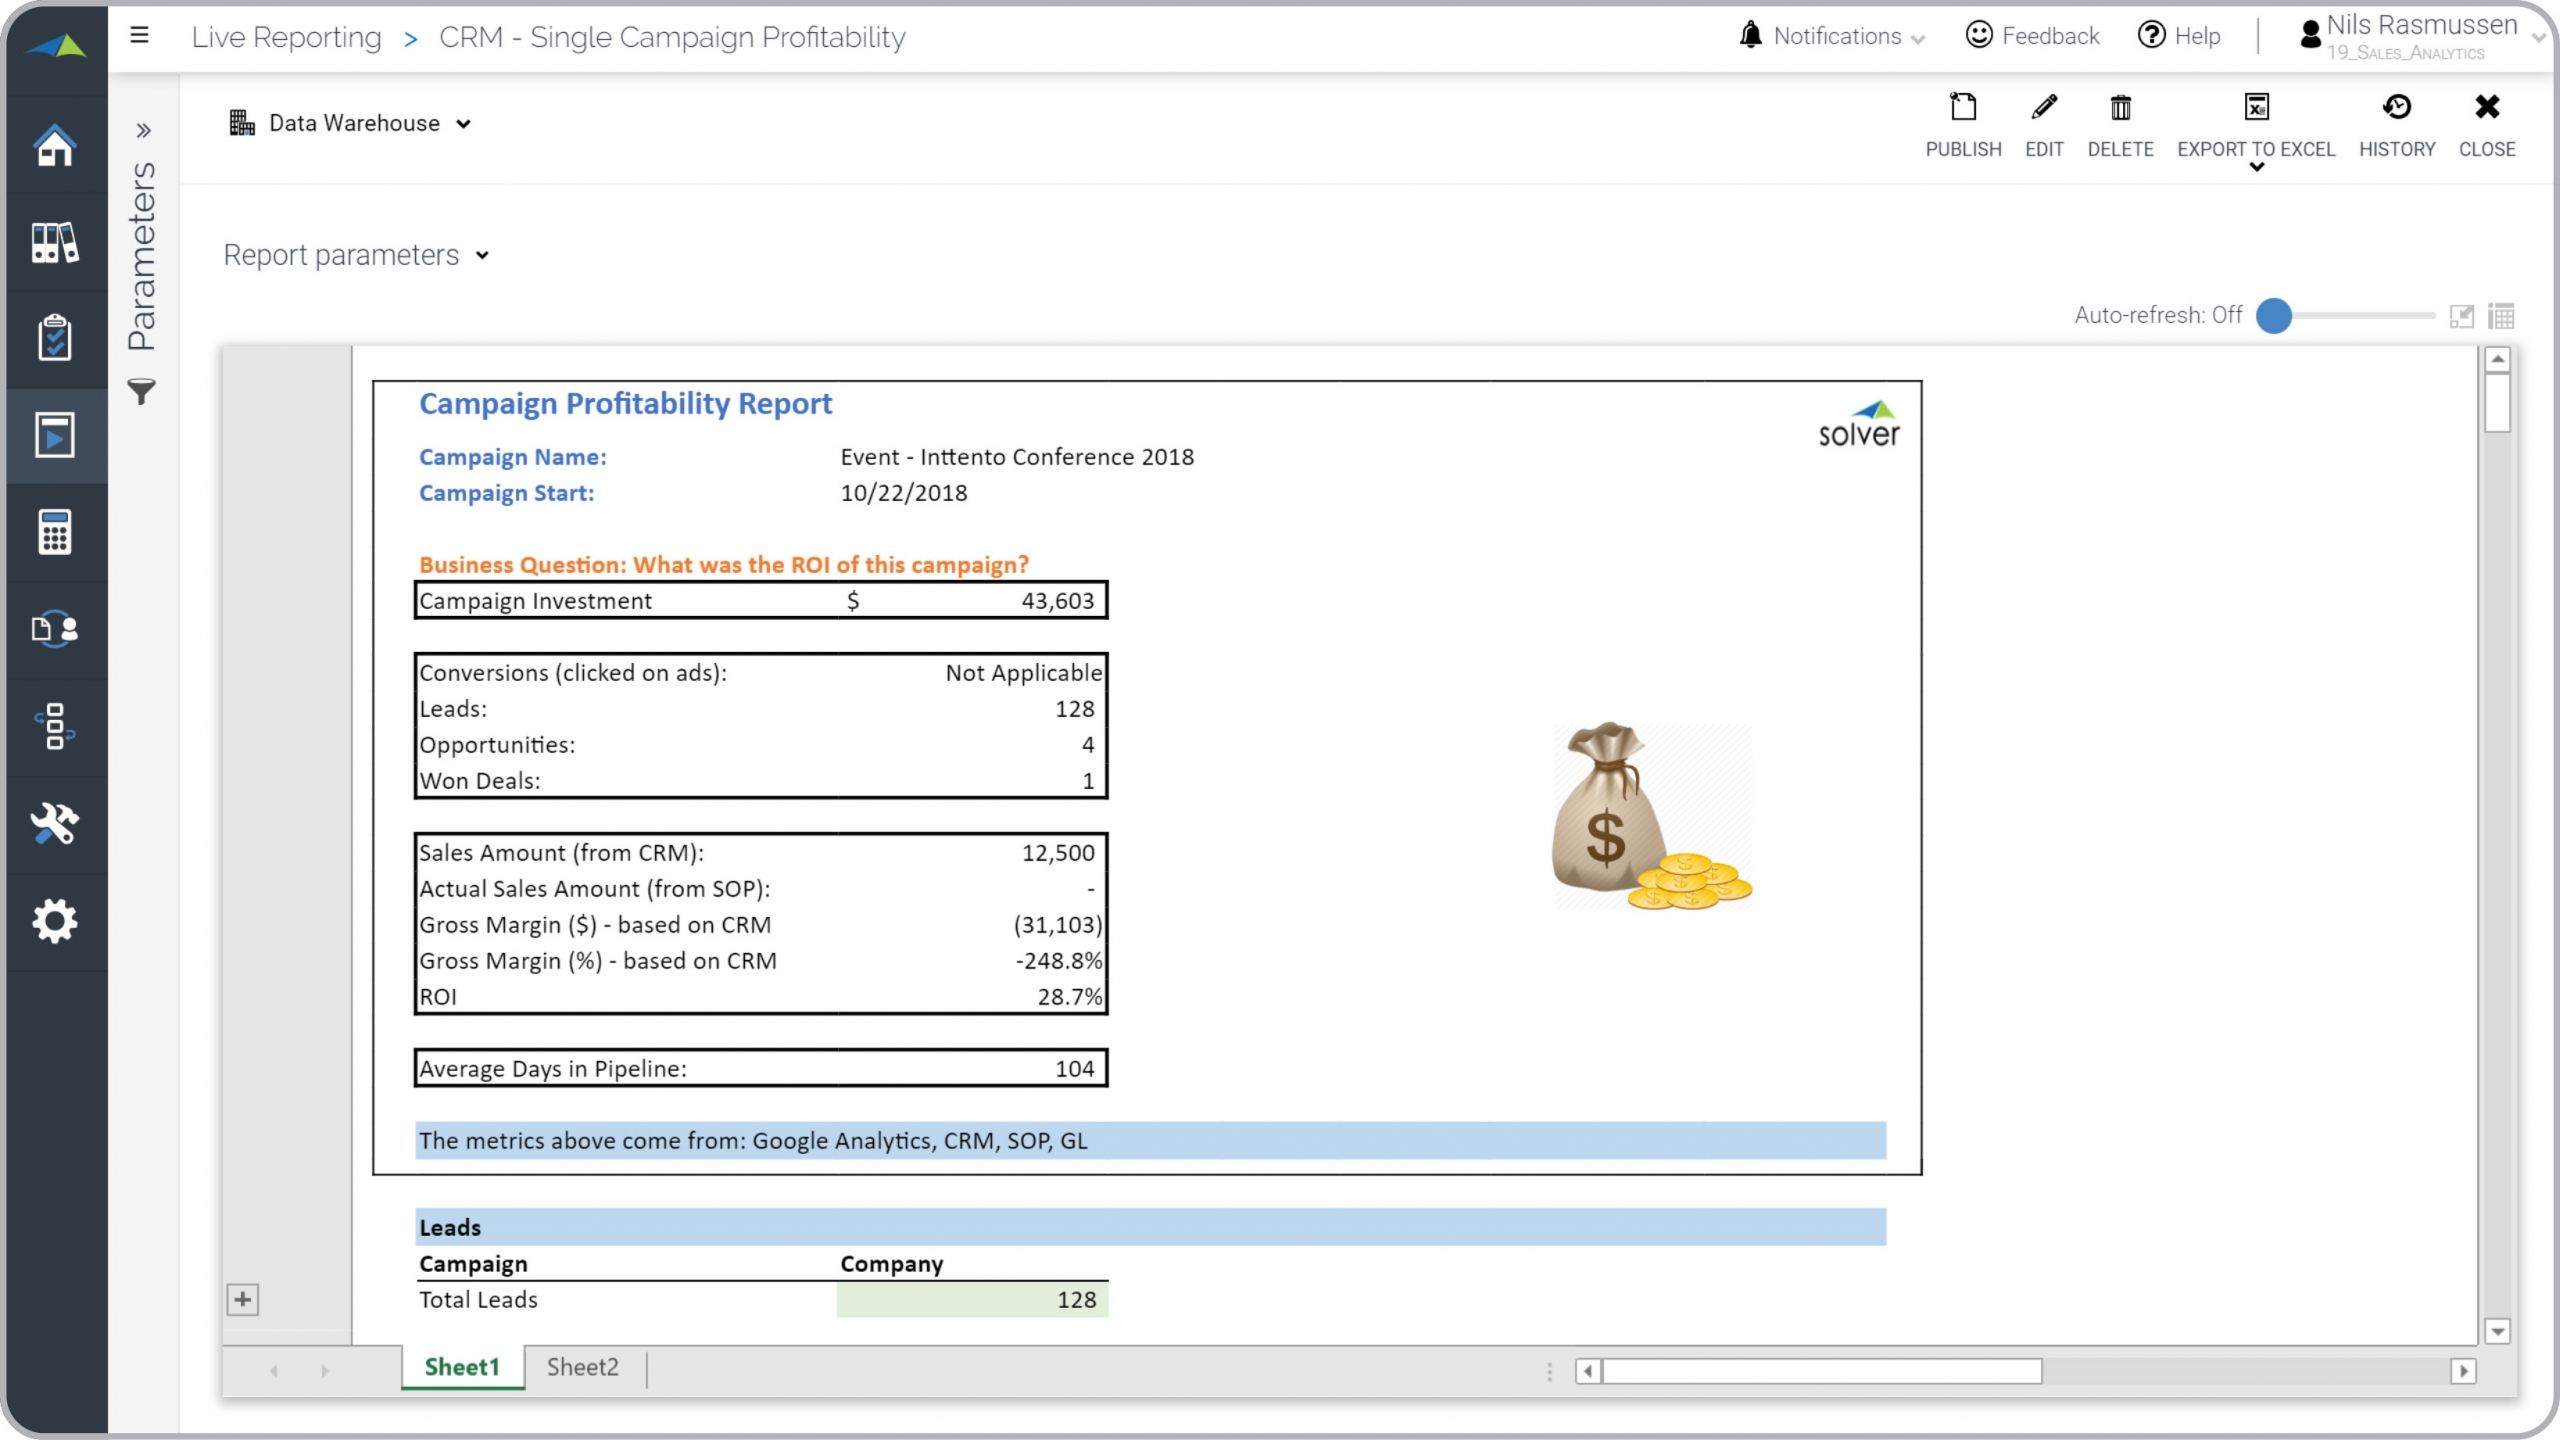
Campaign Profitability Report
Looks at the ROI of a single marketing campaign by combining CRM and ERP data.
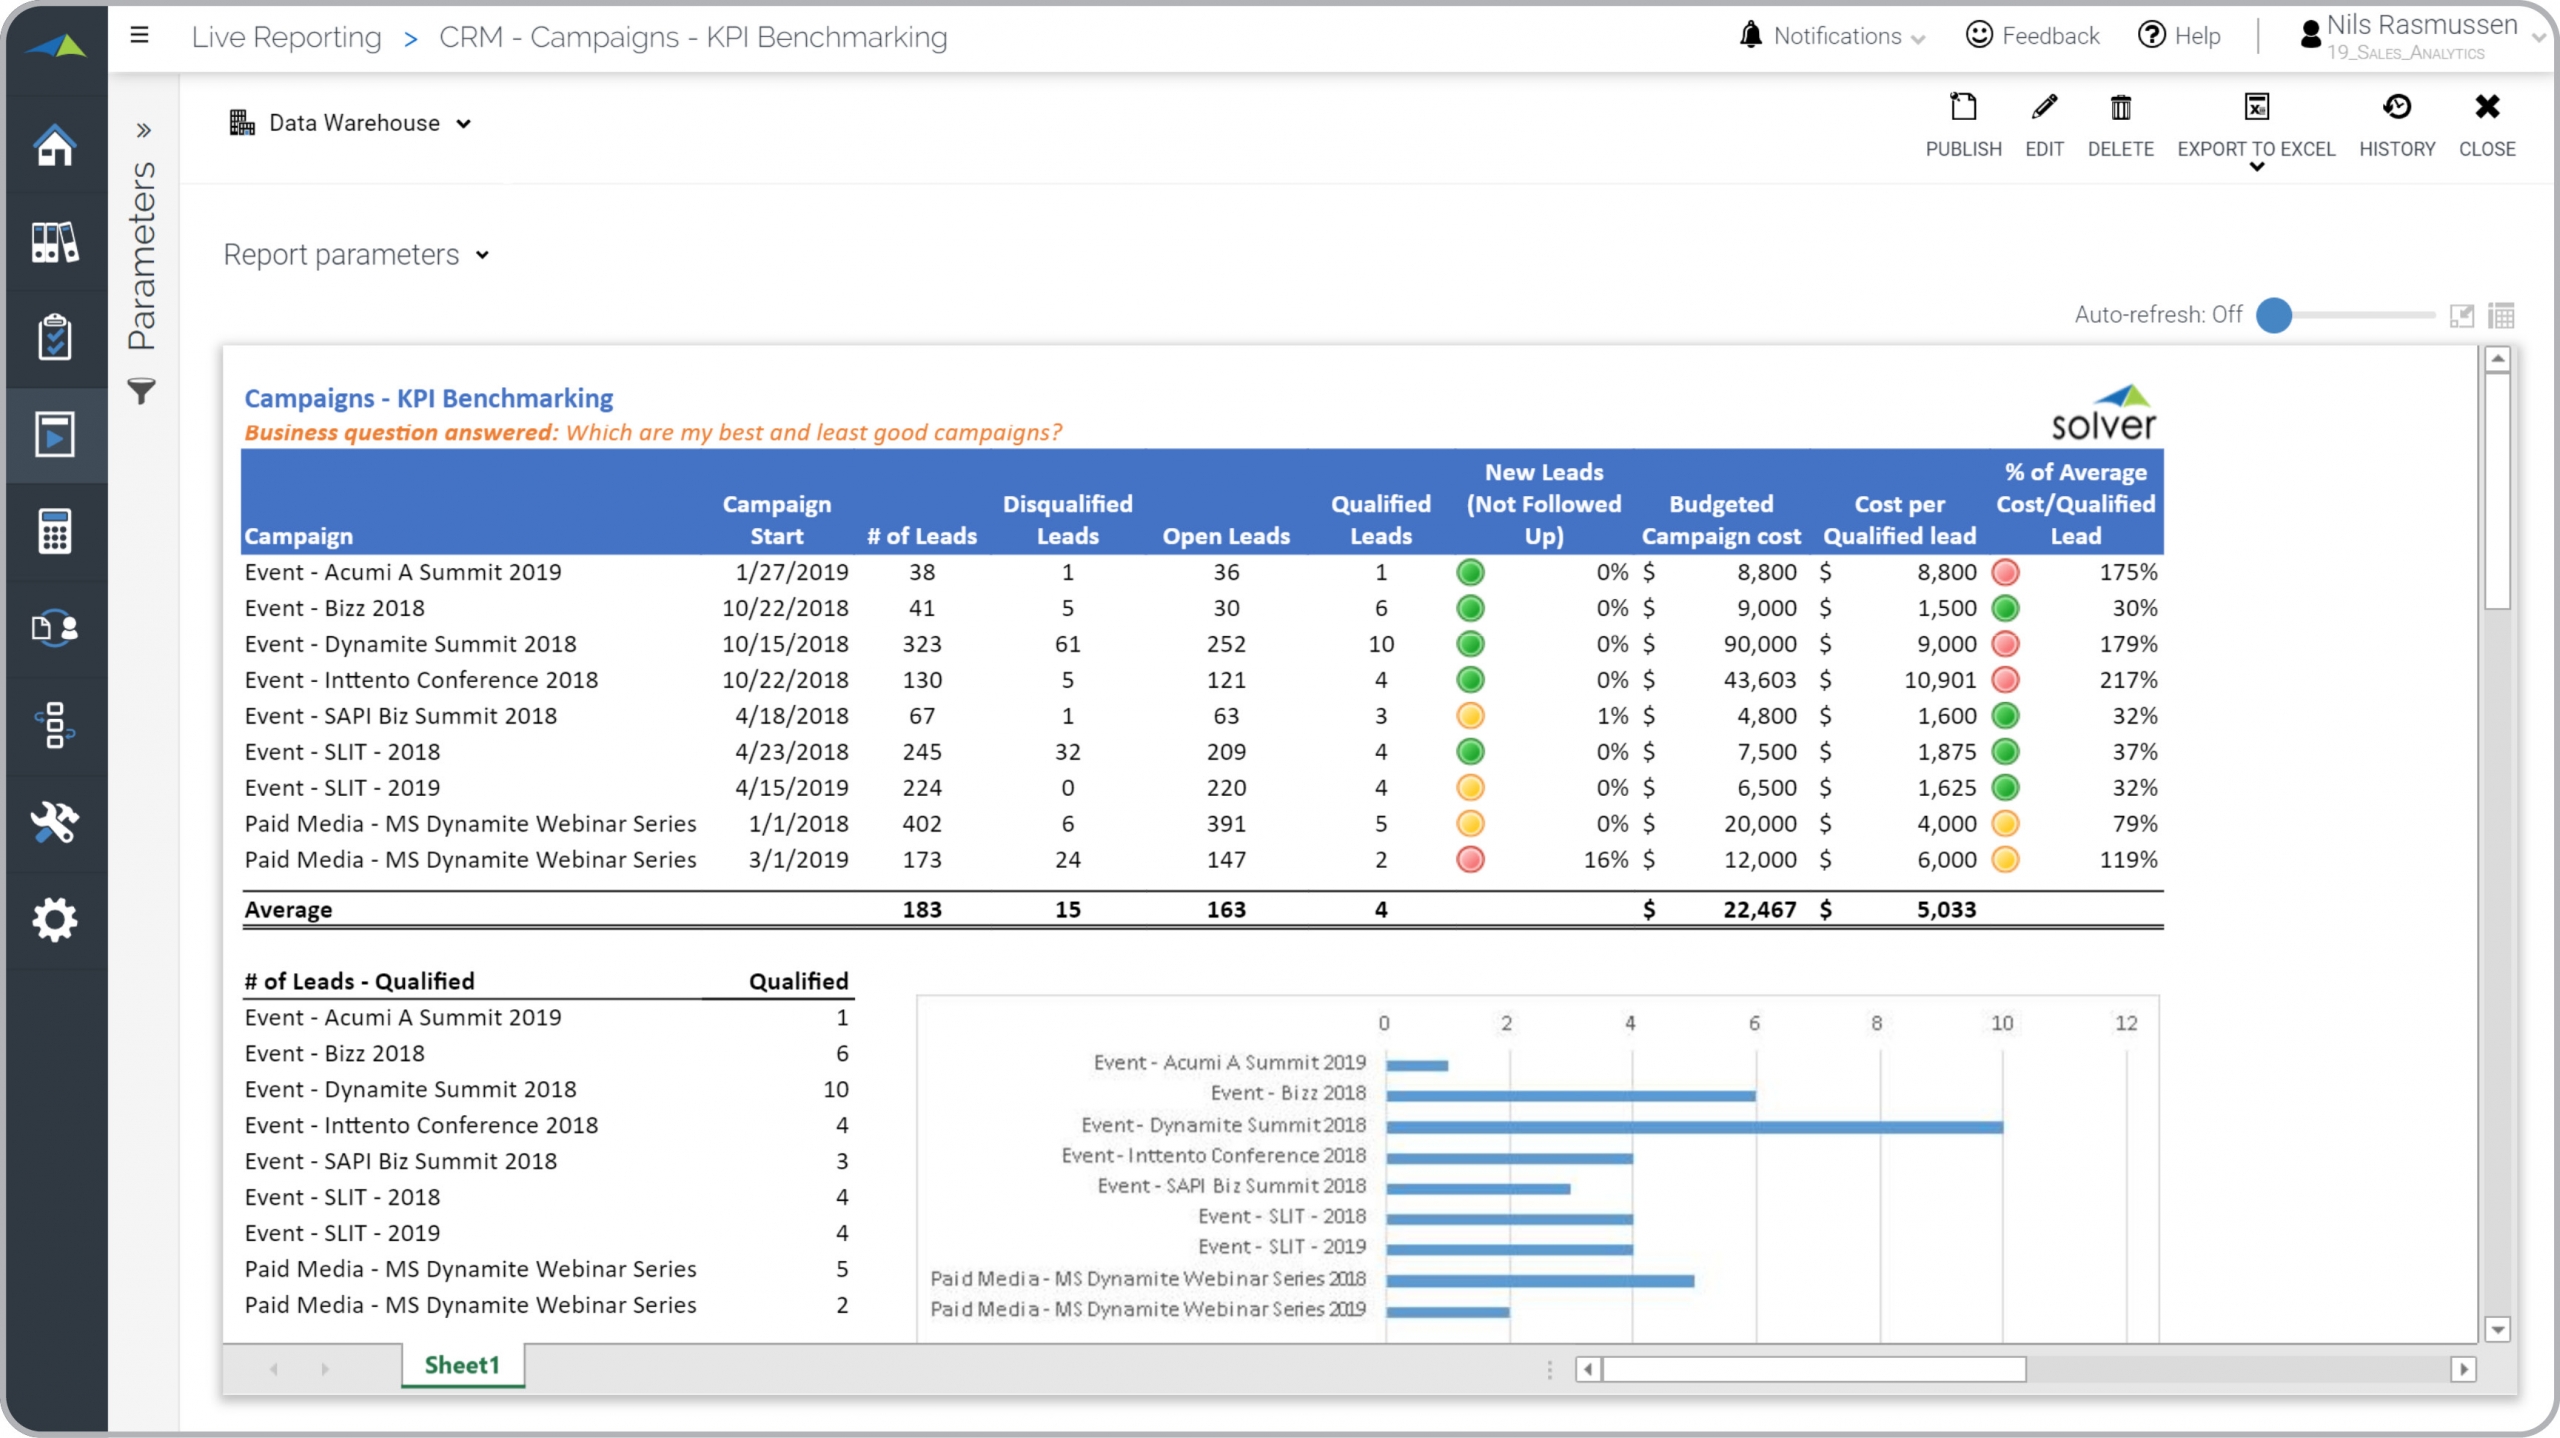
Campaign Benchmarking
Compares leads, cost and other KPI per marketing campaign to analyze which to keep/drop.
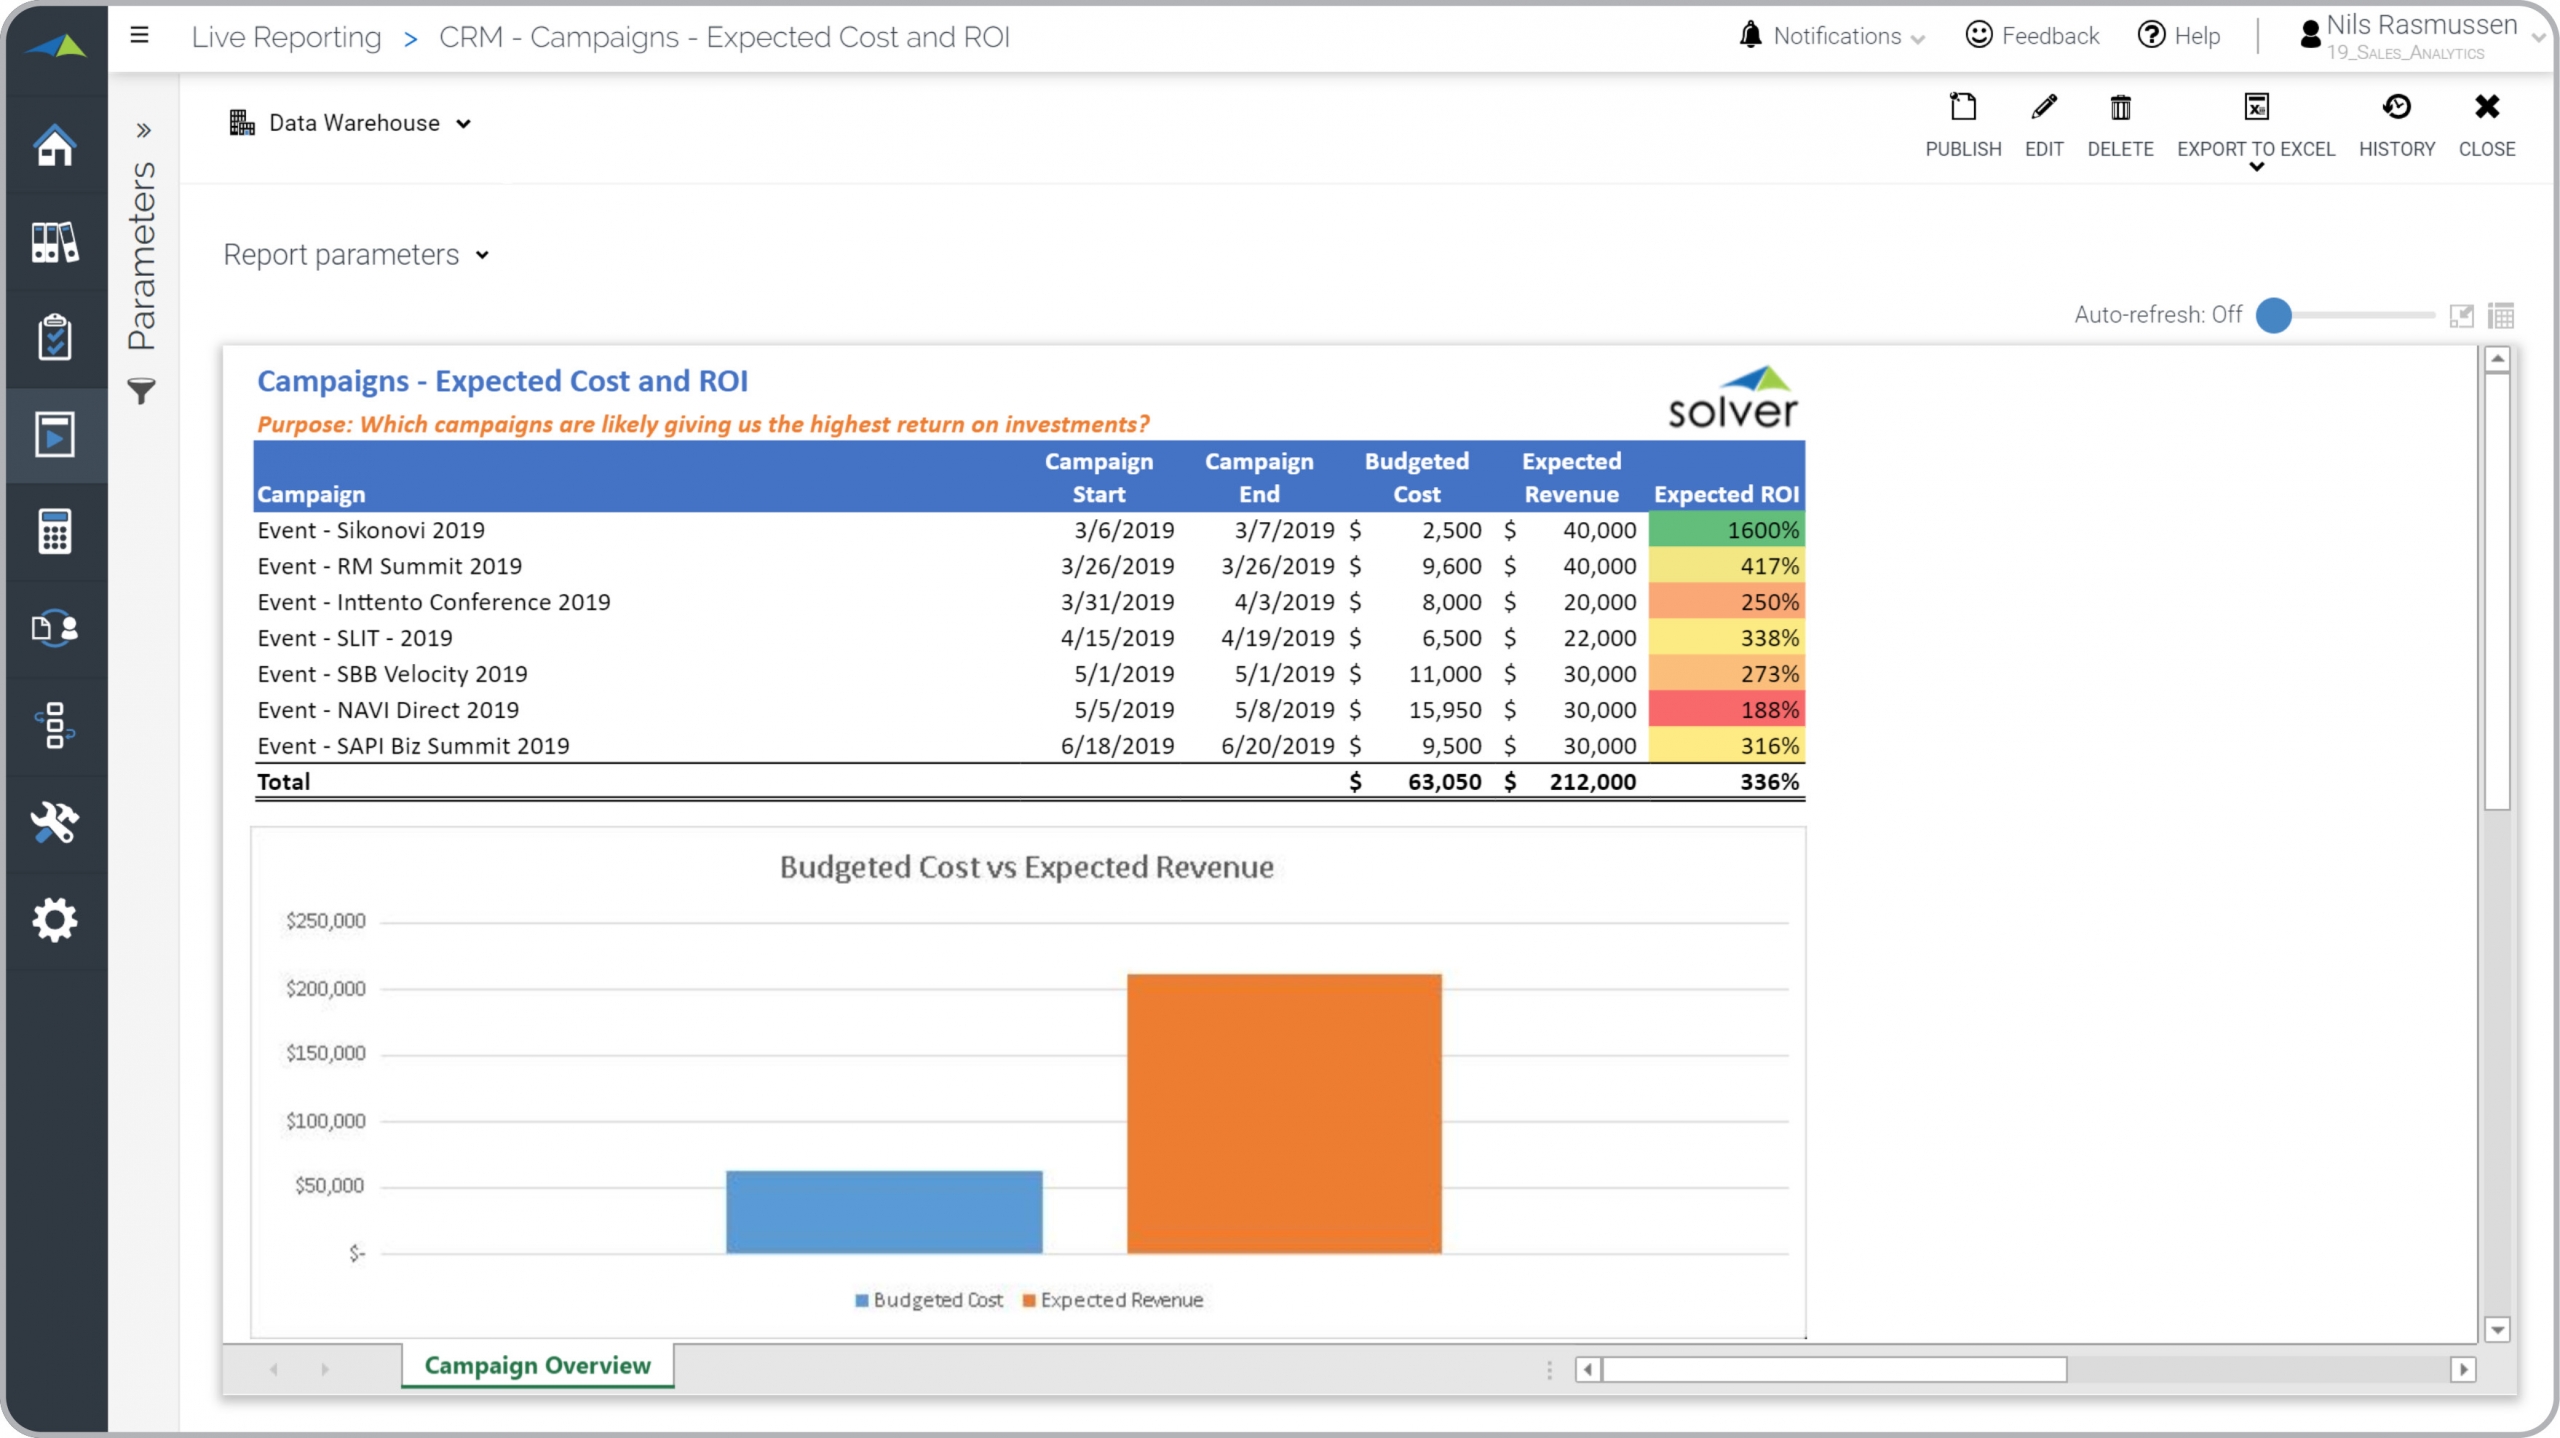
Campaign Budgets and ROI
Analyze future CRM marketing campaigns to review budgeted cost, revenues and ROI.
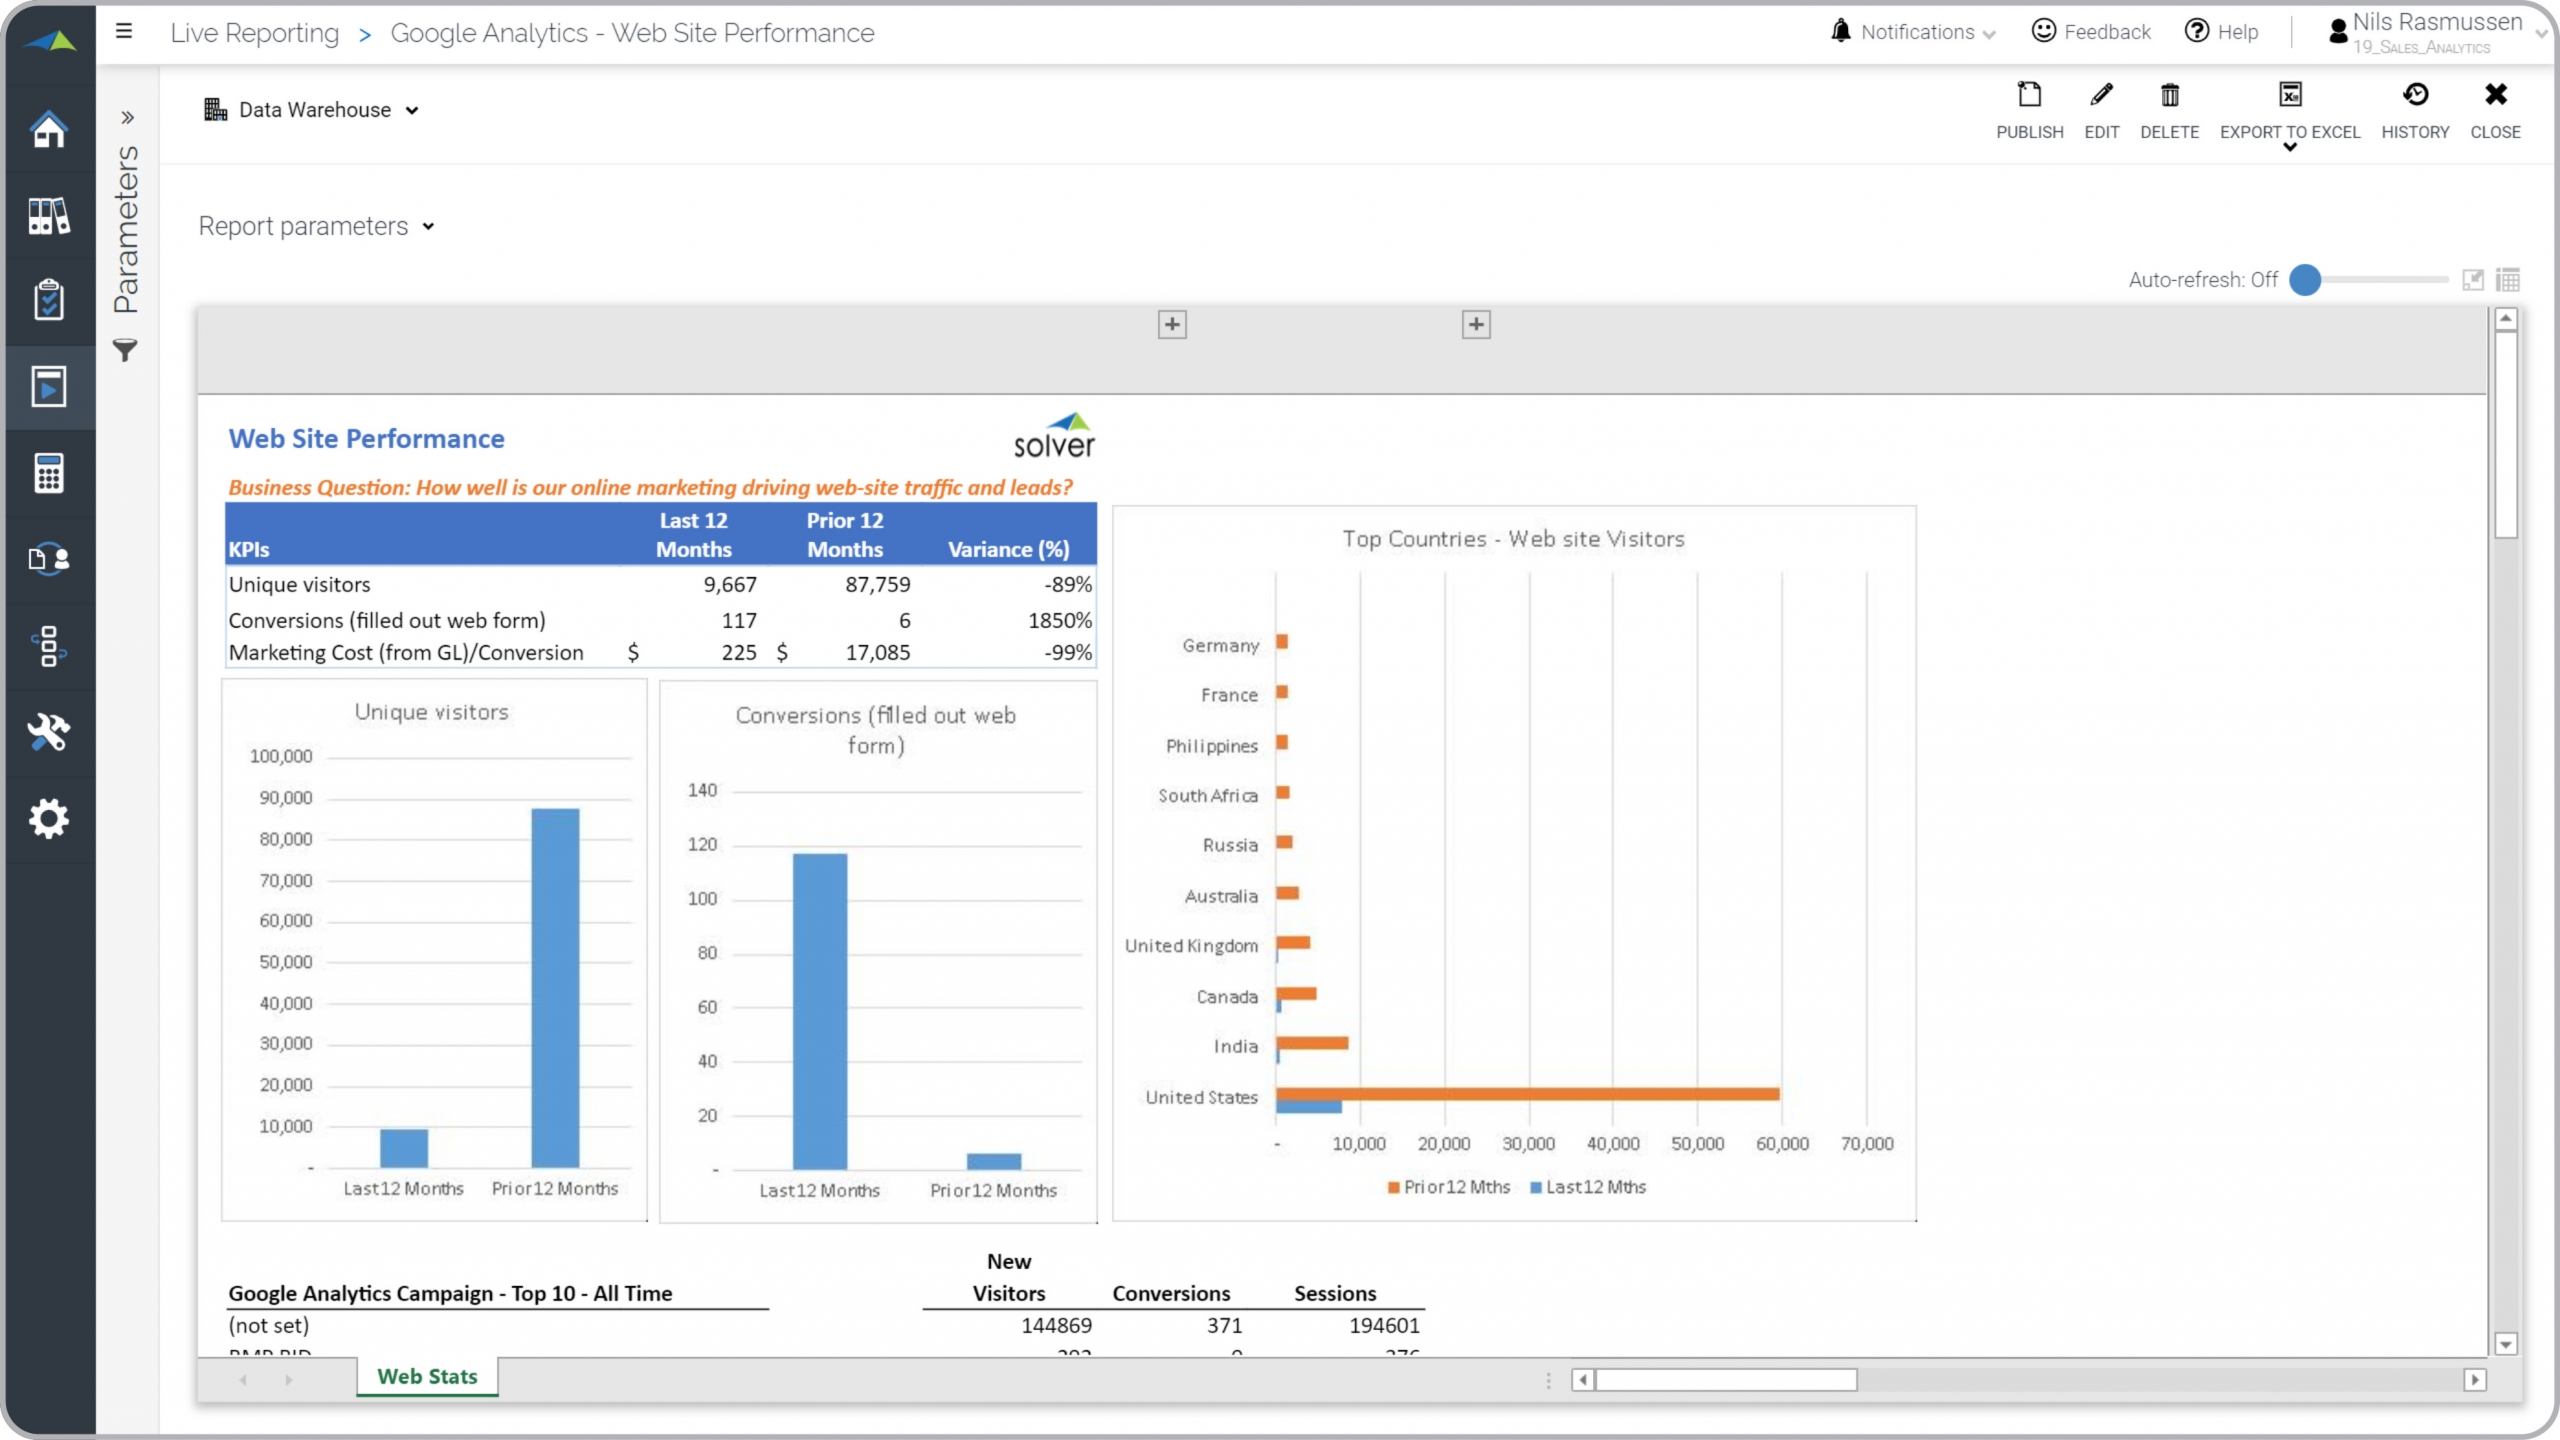
Web Site Analytics Report
This report combines web-site search engine (SEO) performance with marketing expenses.

Benchmark Comparison Report
Compare your own KPI performance versus up to 10 other organizations and the average.
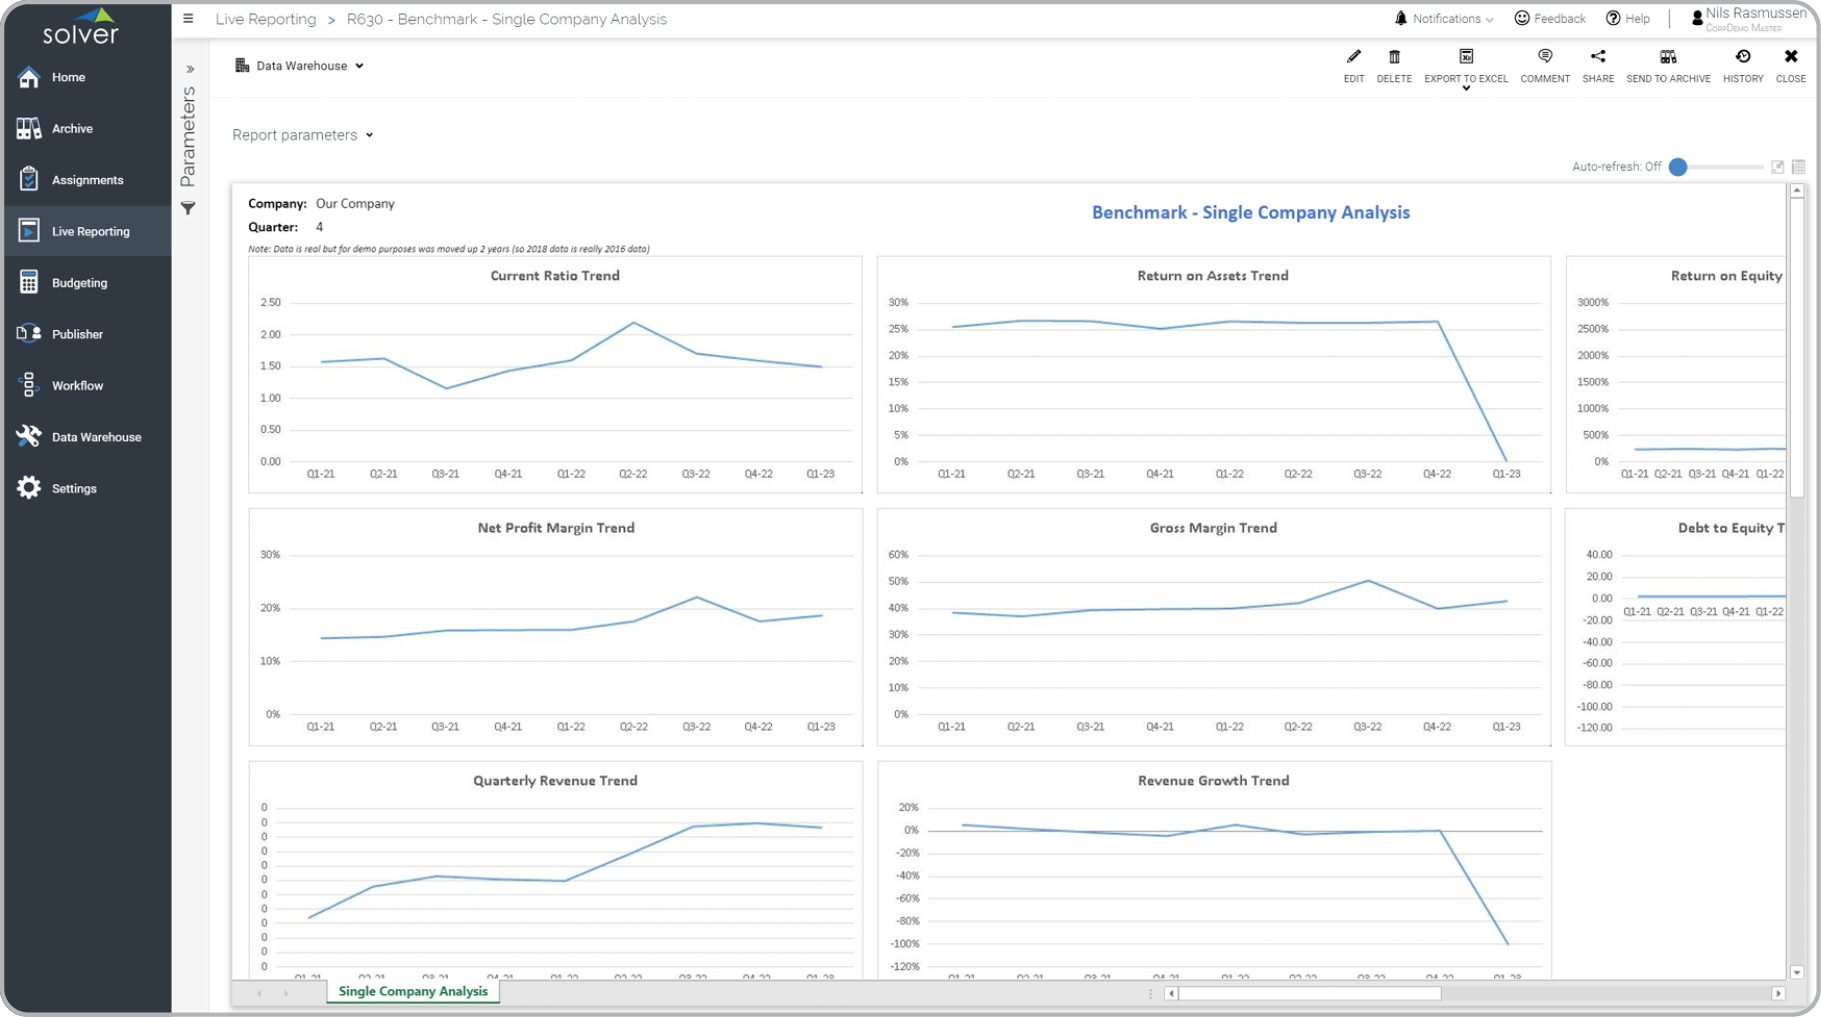
Benchmark Report
Analyzes quarterly trend of company you benchmark against.
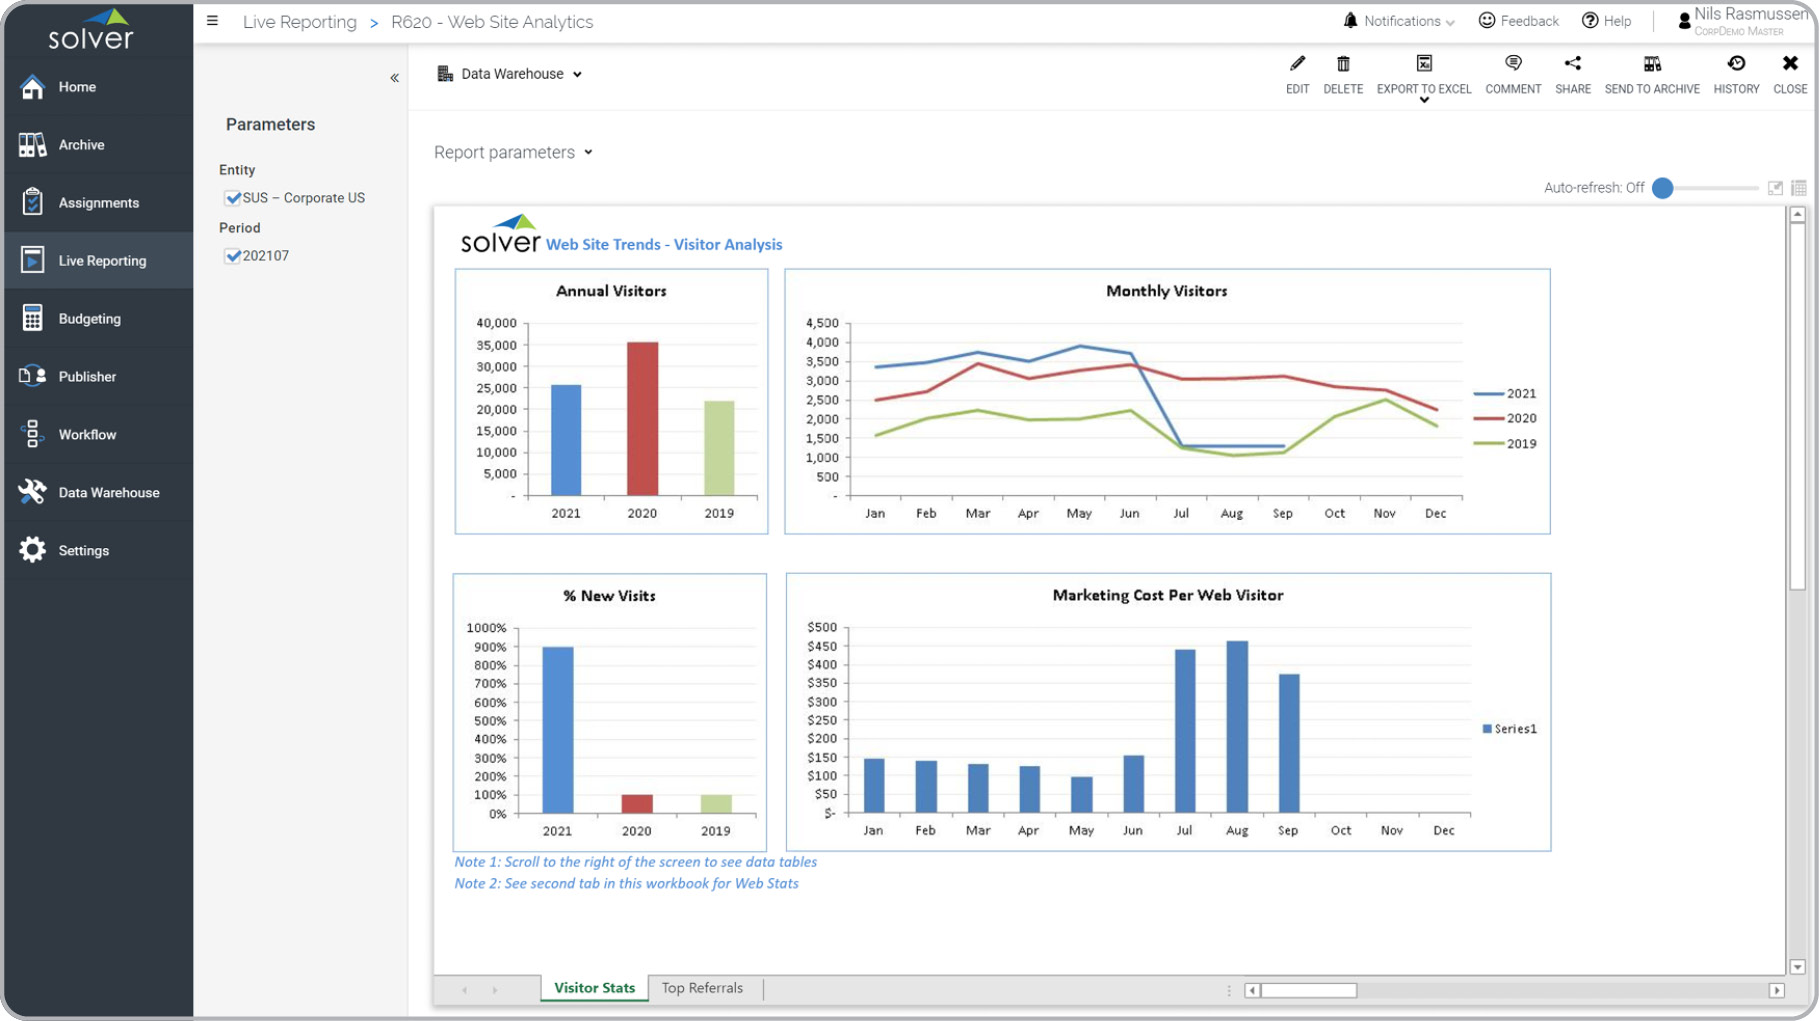
Web Site Analytics
Management report showing success of web site and average marketing cost per visitor.
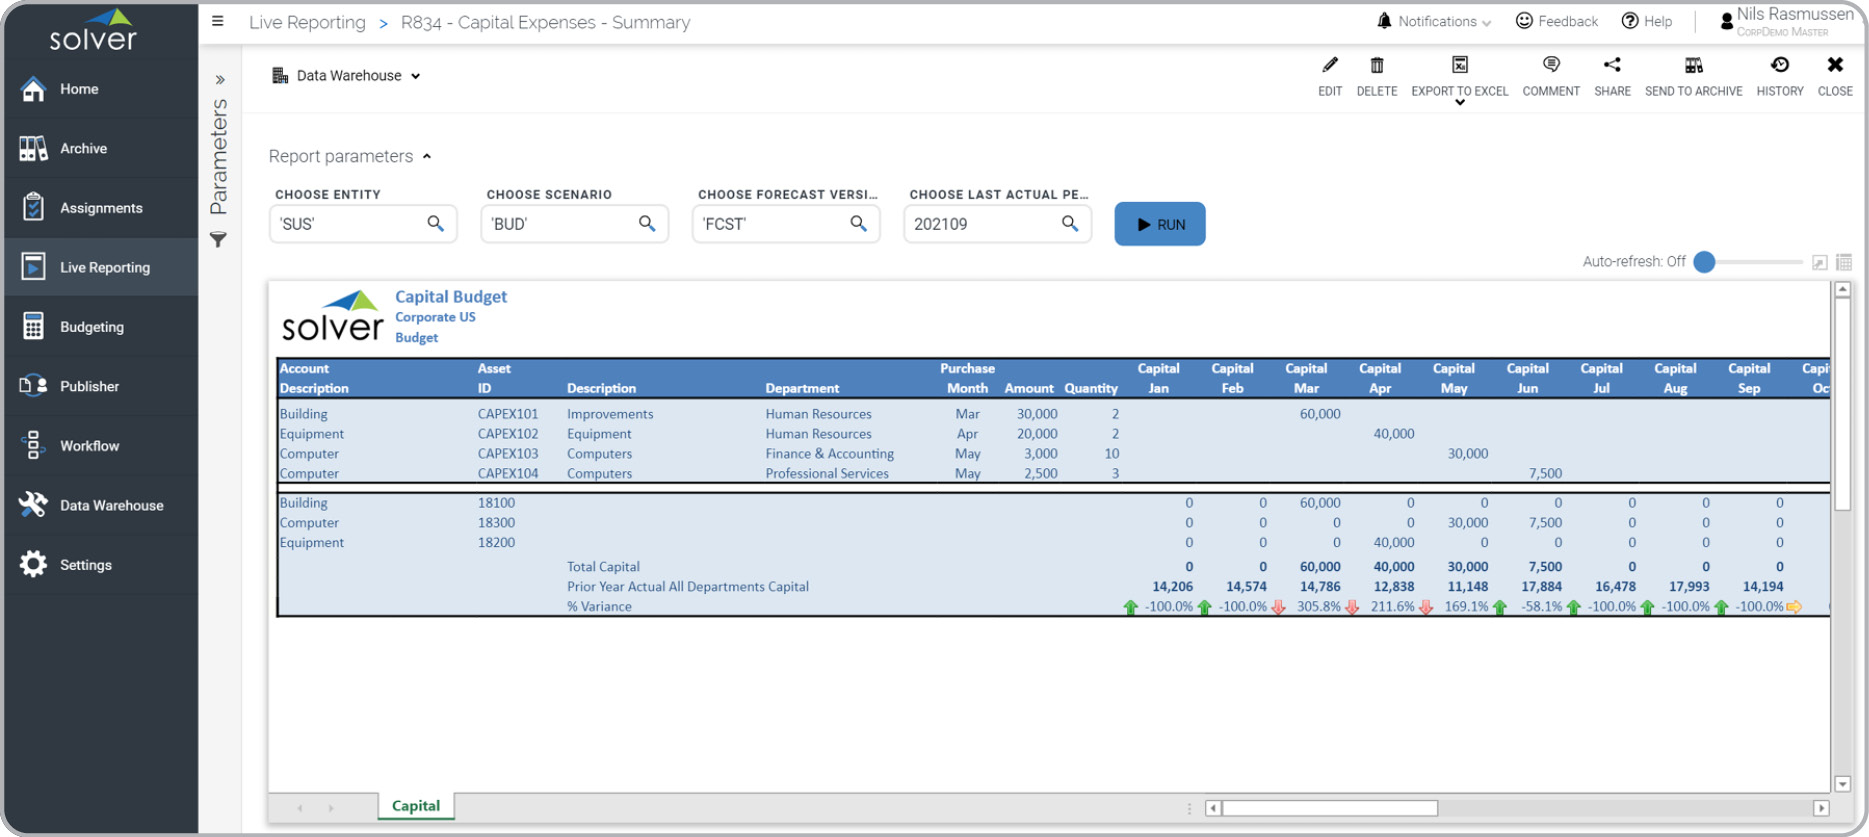
Capital Expenses Report
Summary of asset purchases by GL account and department w/comparison to prior year.
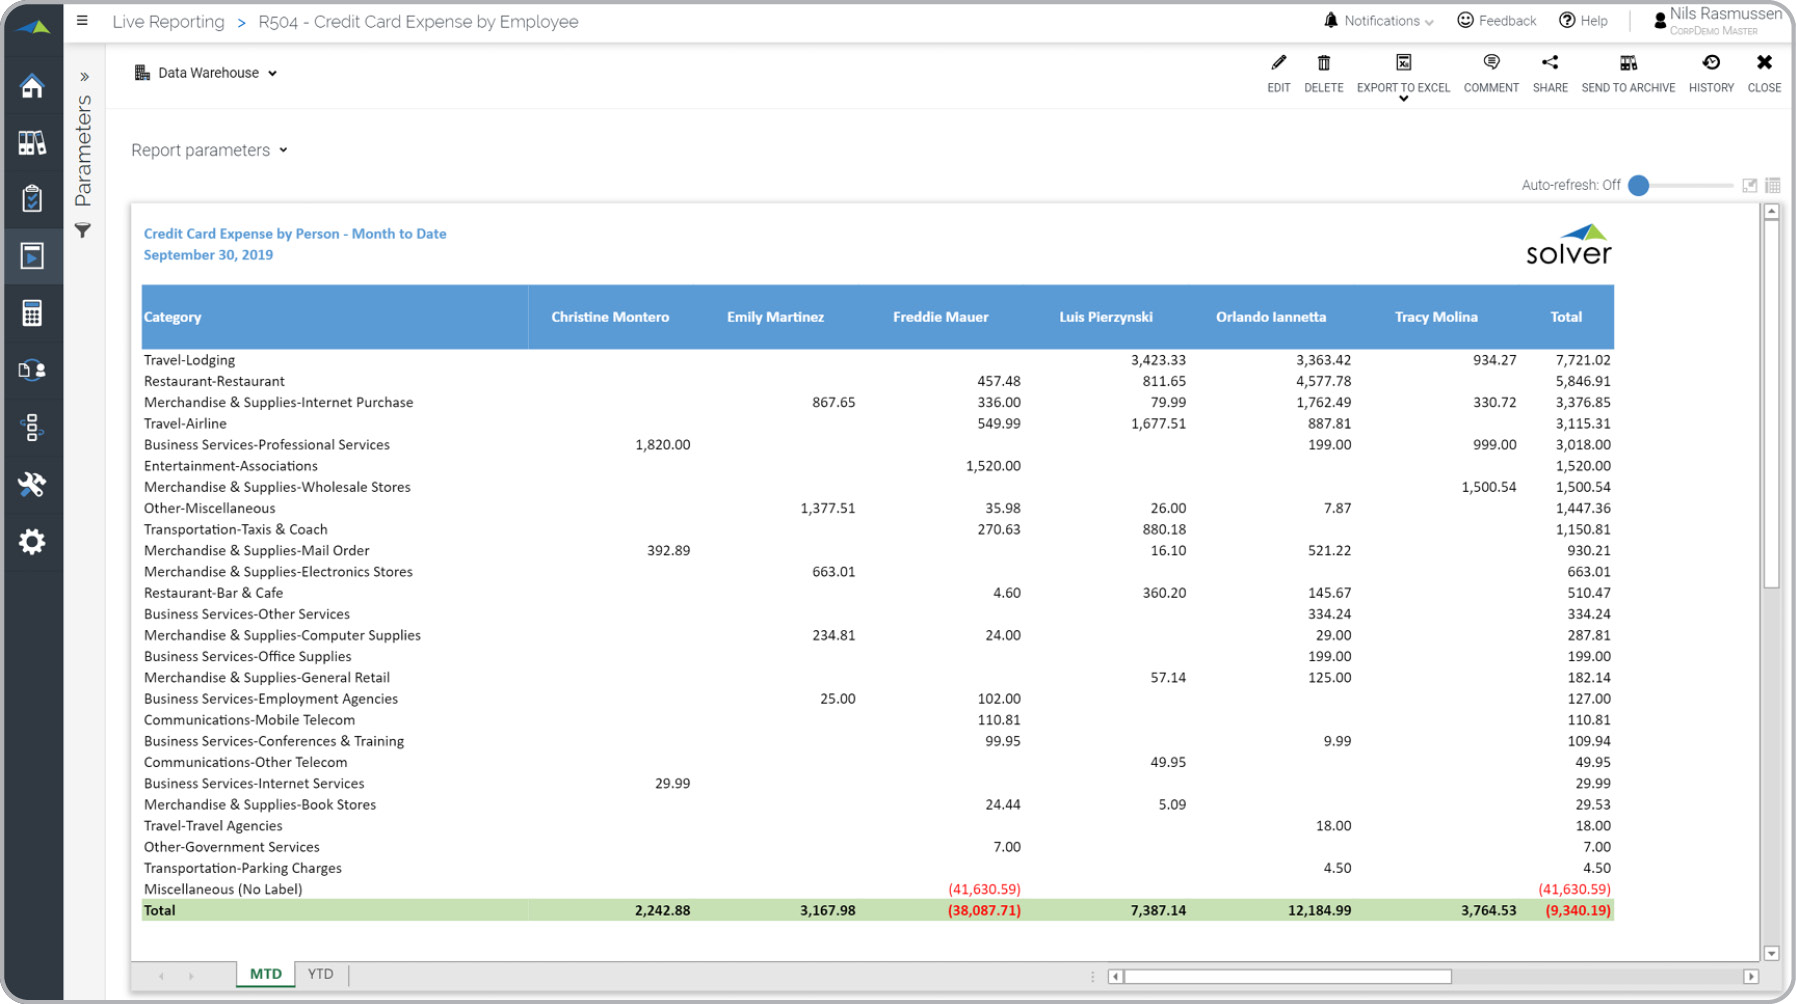
Credit Card Expense by Employee
This report provides a ranked list of expenses by category and employee comparison.
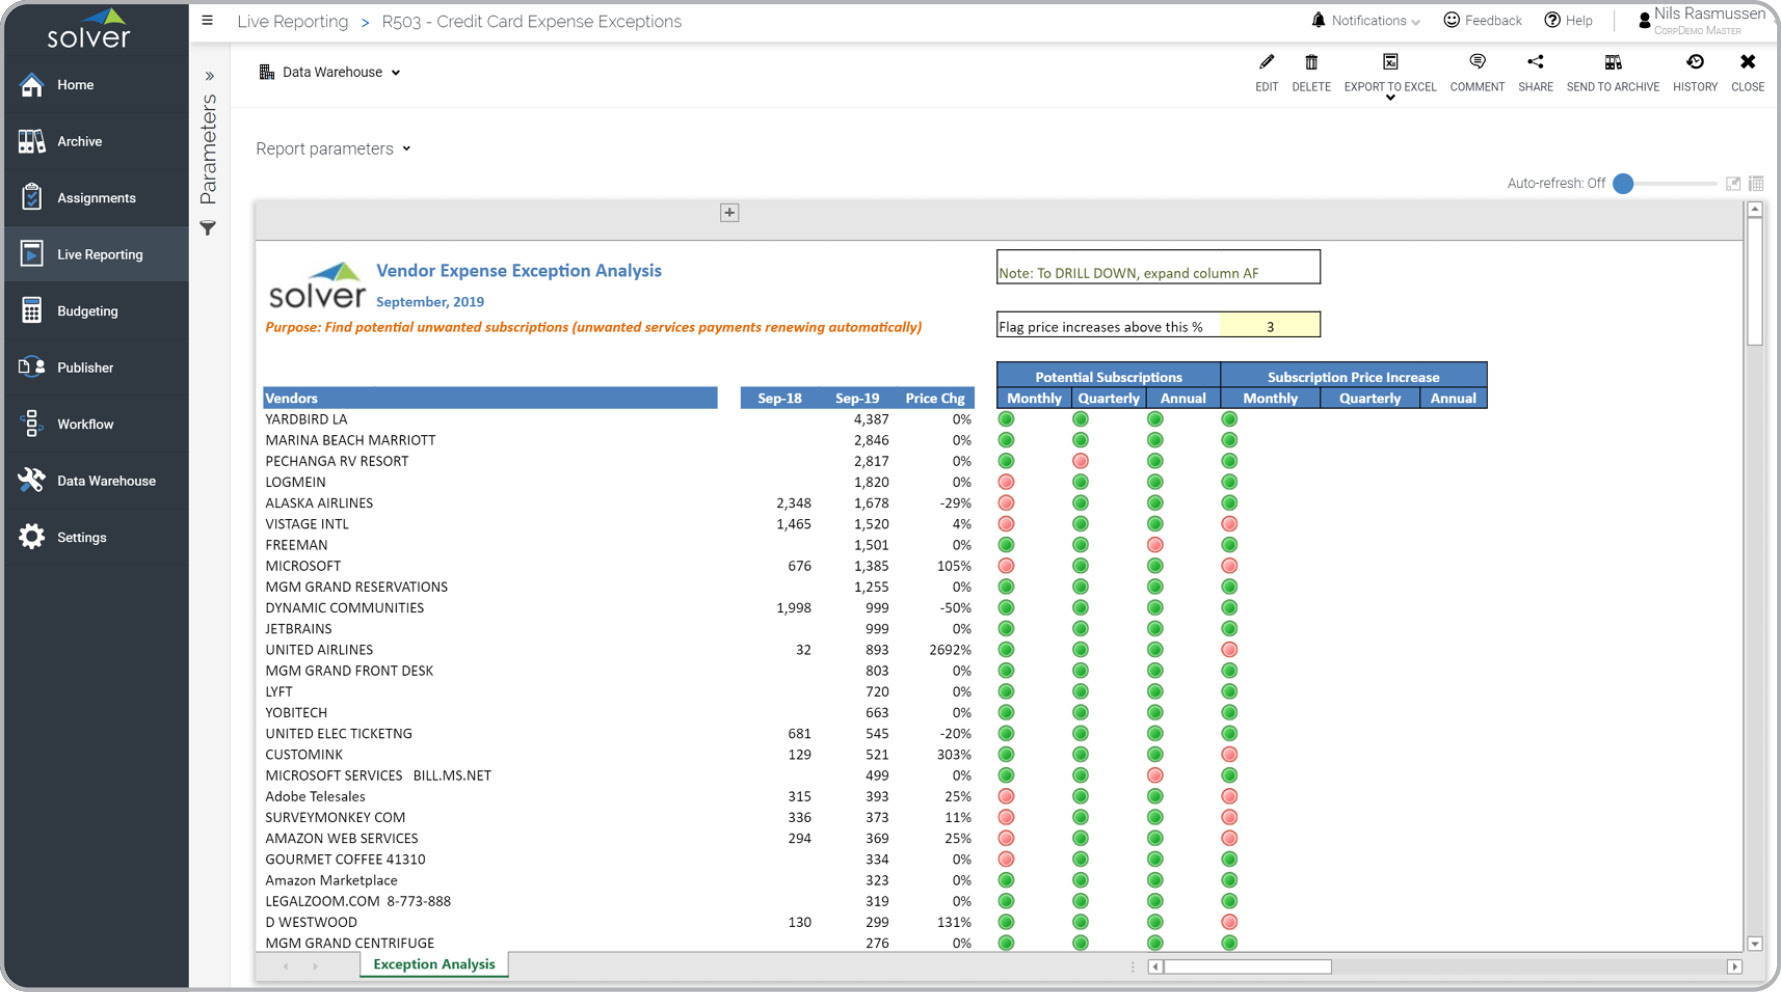
Credit Card Exception Analysis
This report will help find unintended subscriptions, detects price increases and possible fraud.
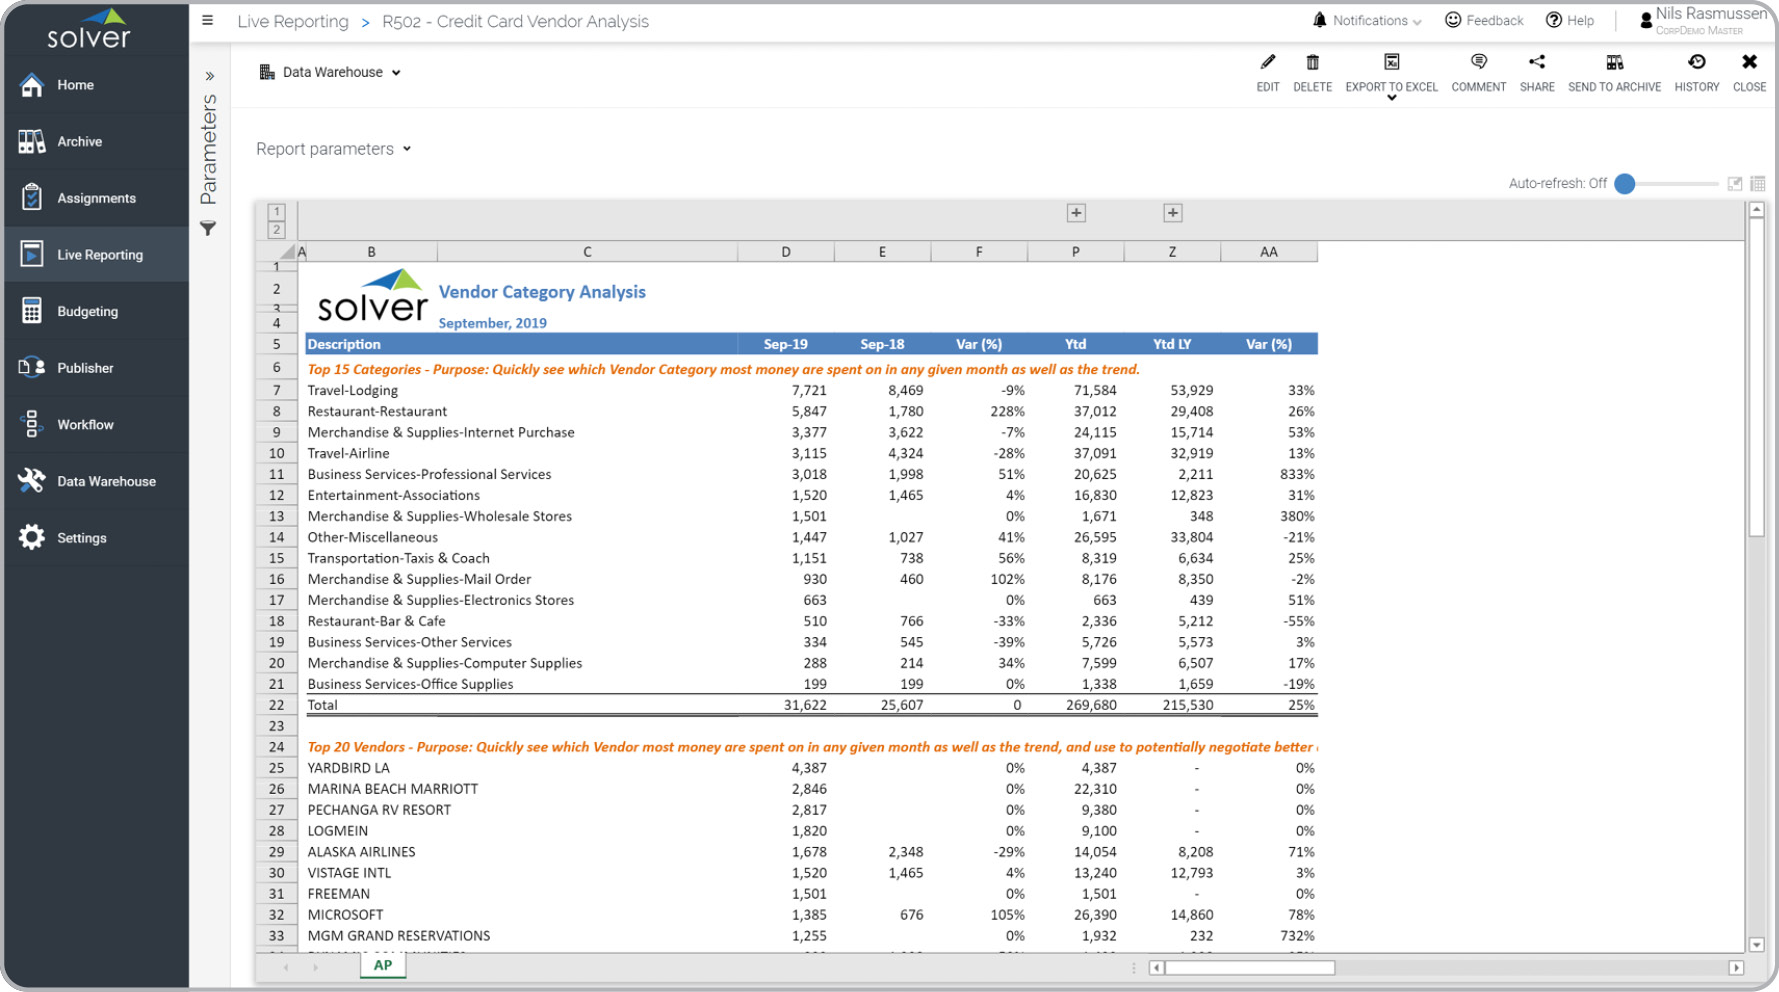
Credit Card Expense Analysis
Report compared year-over-year spending by vendor and category to simplify decisions.
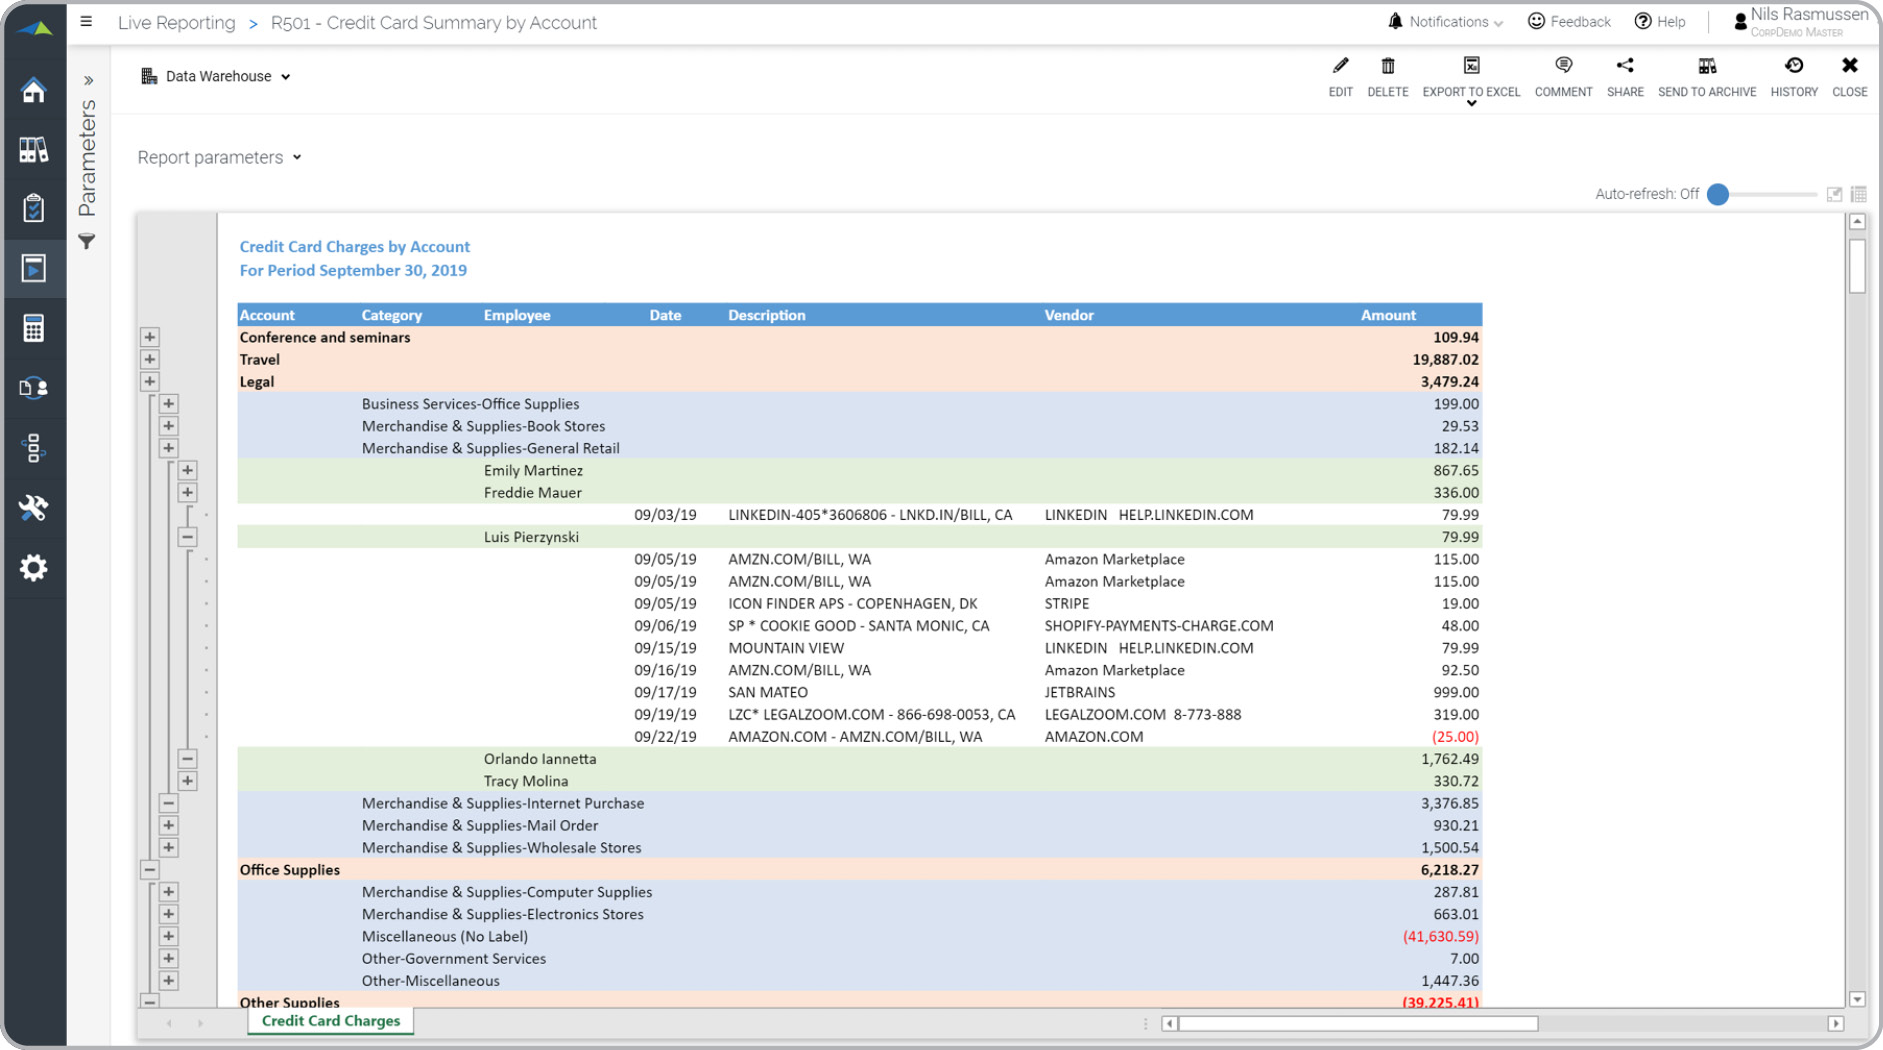
Credit Card Summary by Category
Report for analyzing corporate credit card spending by category and employee.
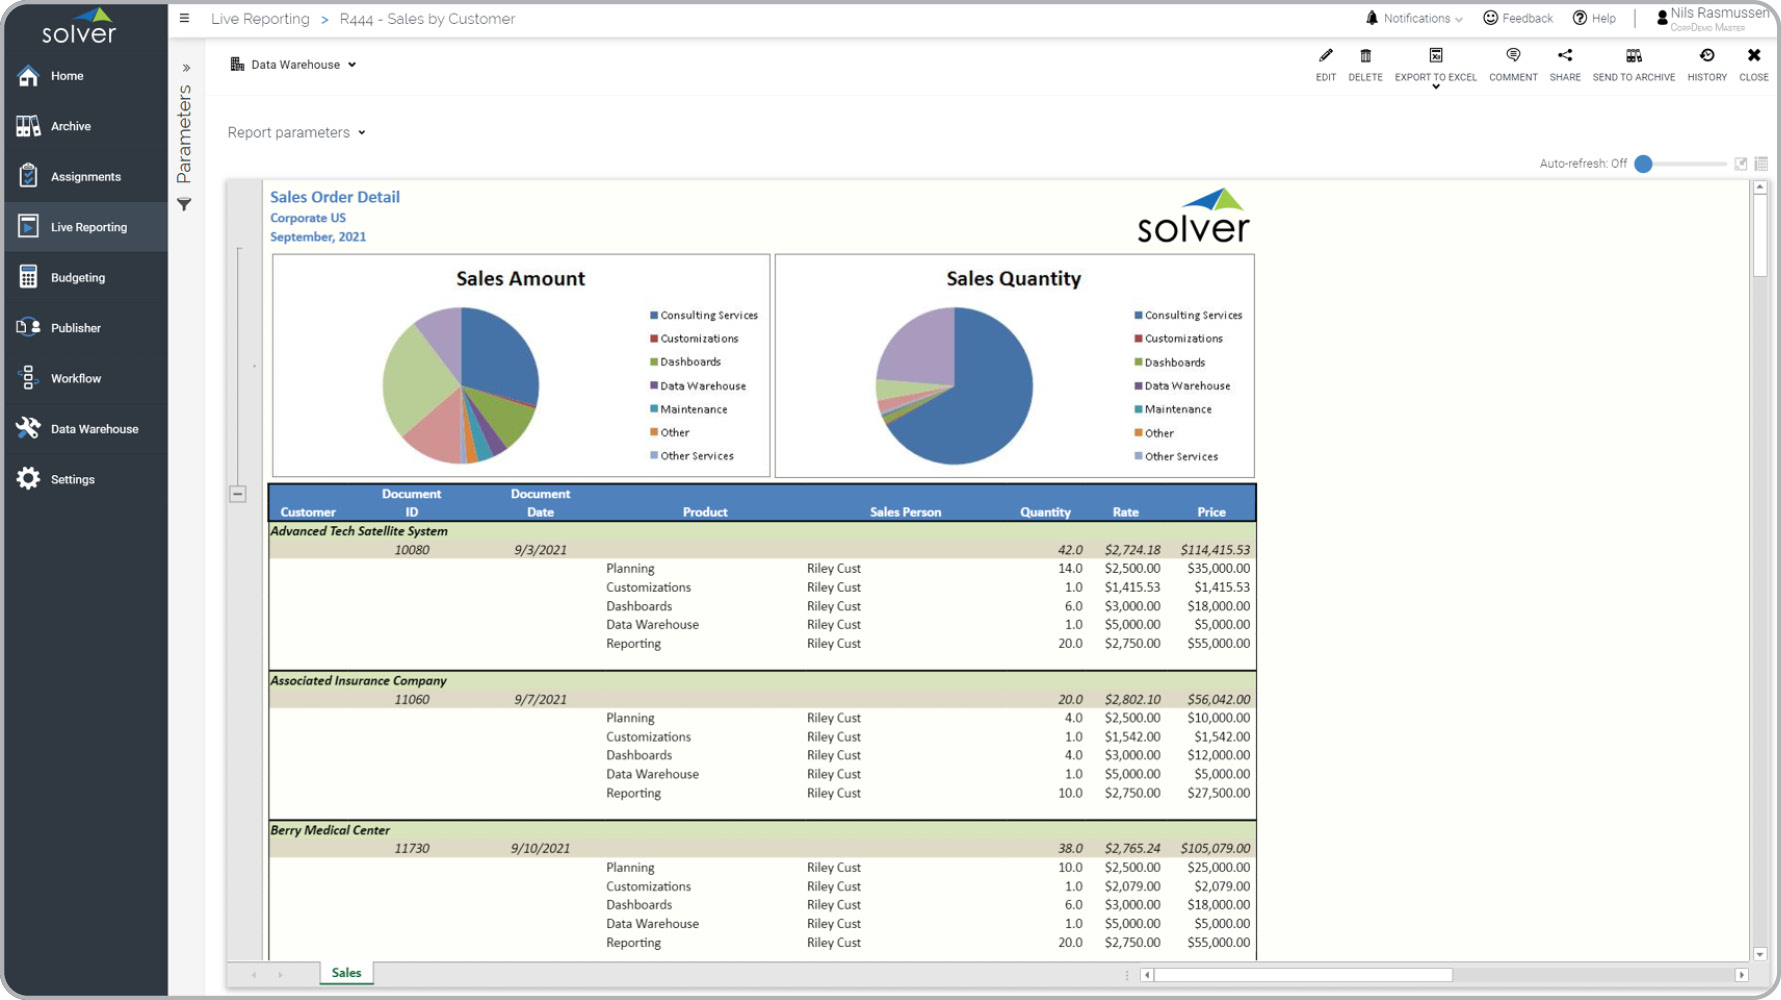
Sales by Customer
Sales by customer with detailed transactions showing sales person, price and quantity.
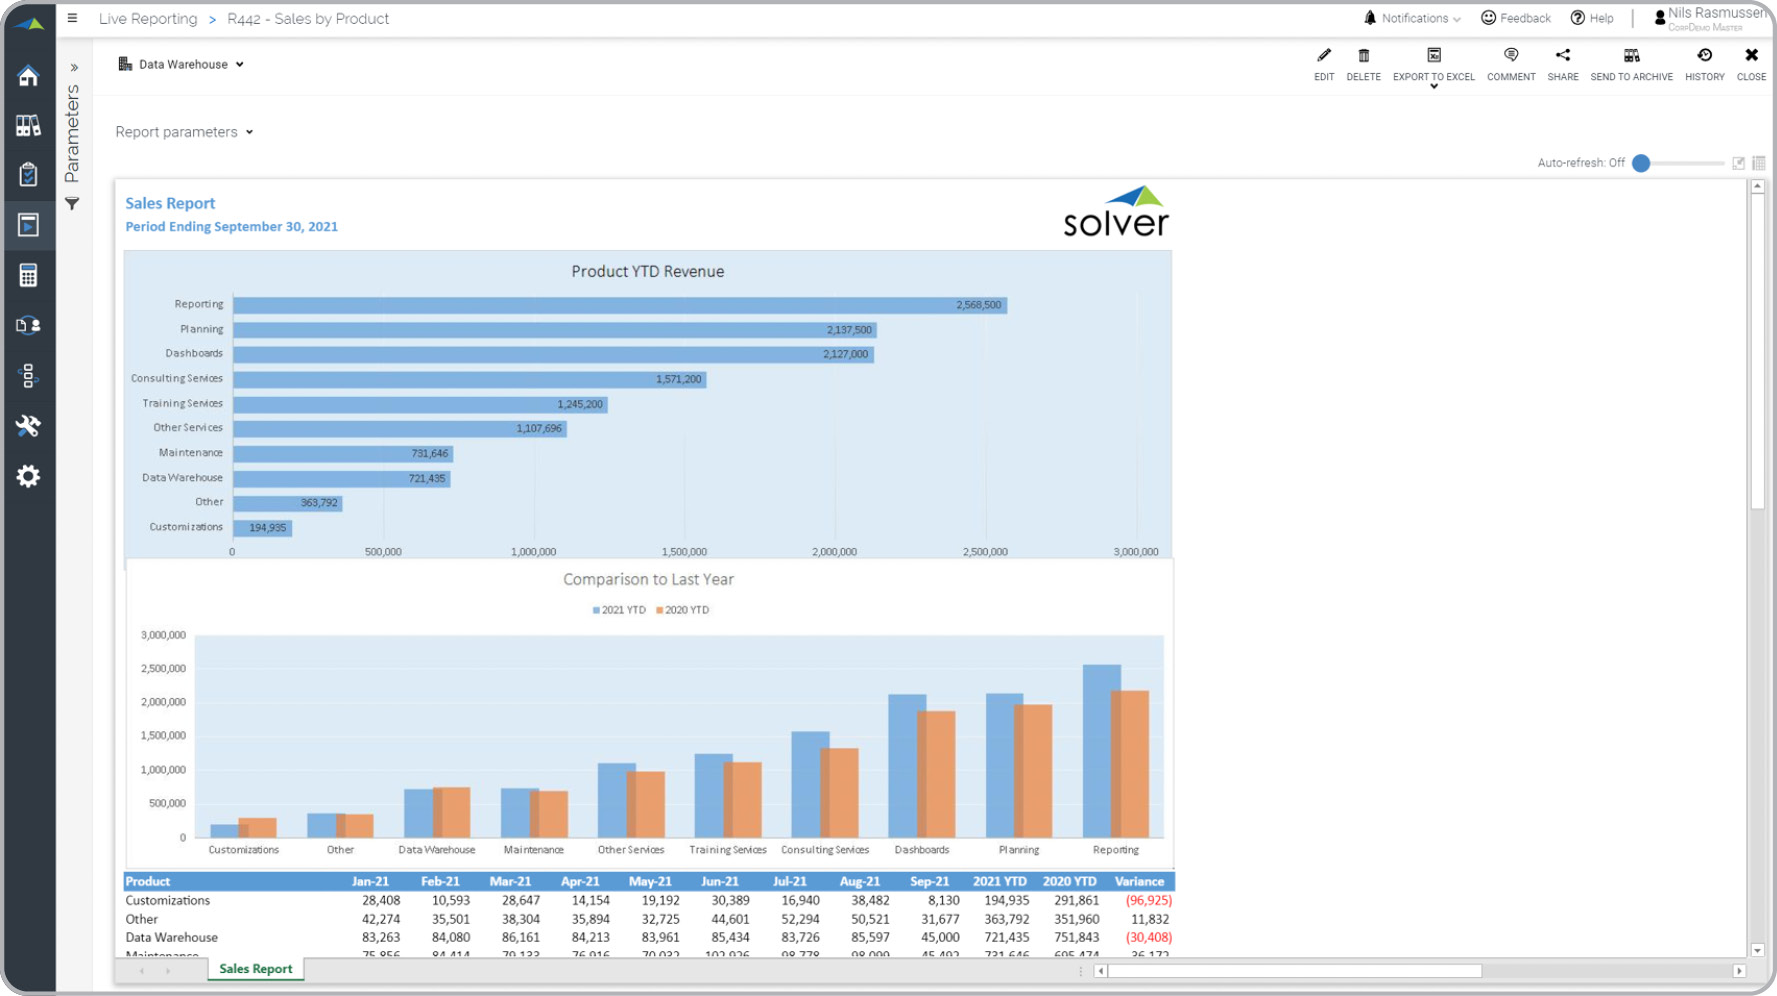
Sales Rank by Product
Graph and numbers combined to show sales trend and ranking by product.
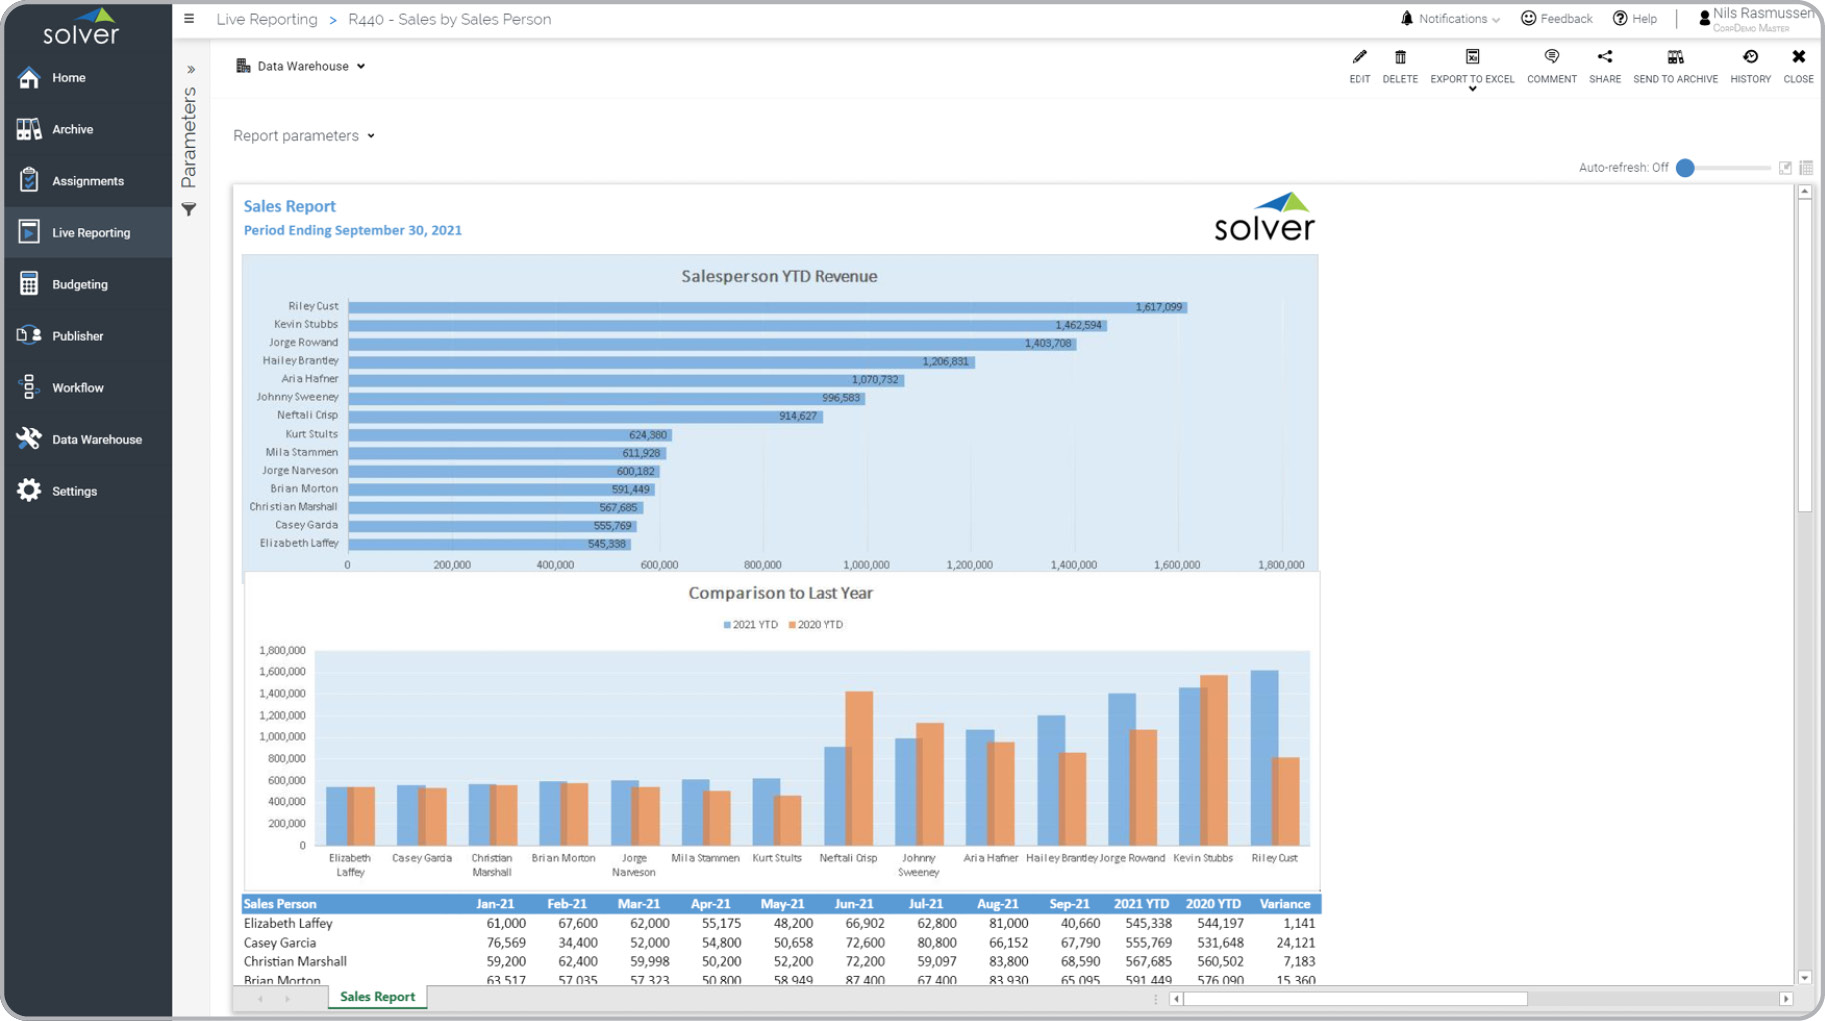
Sales Rank by Sales Person
Graph and numbers combined to show sales trend and ranking by sales person.
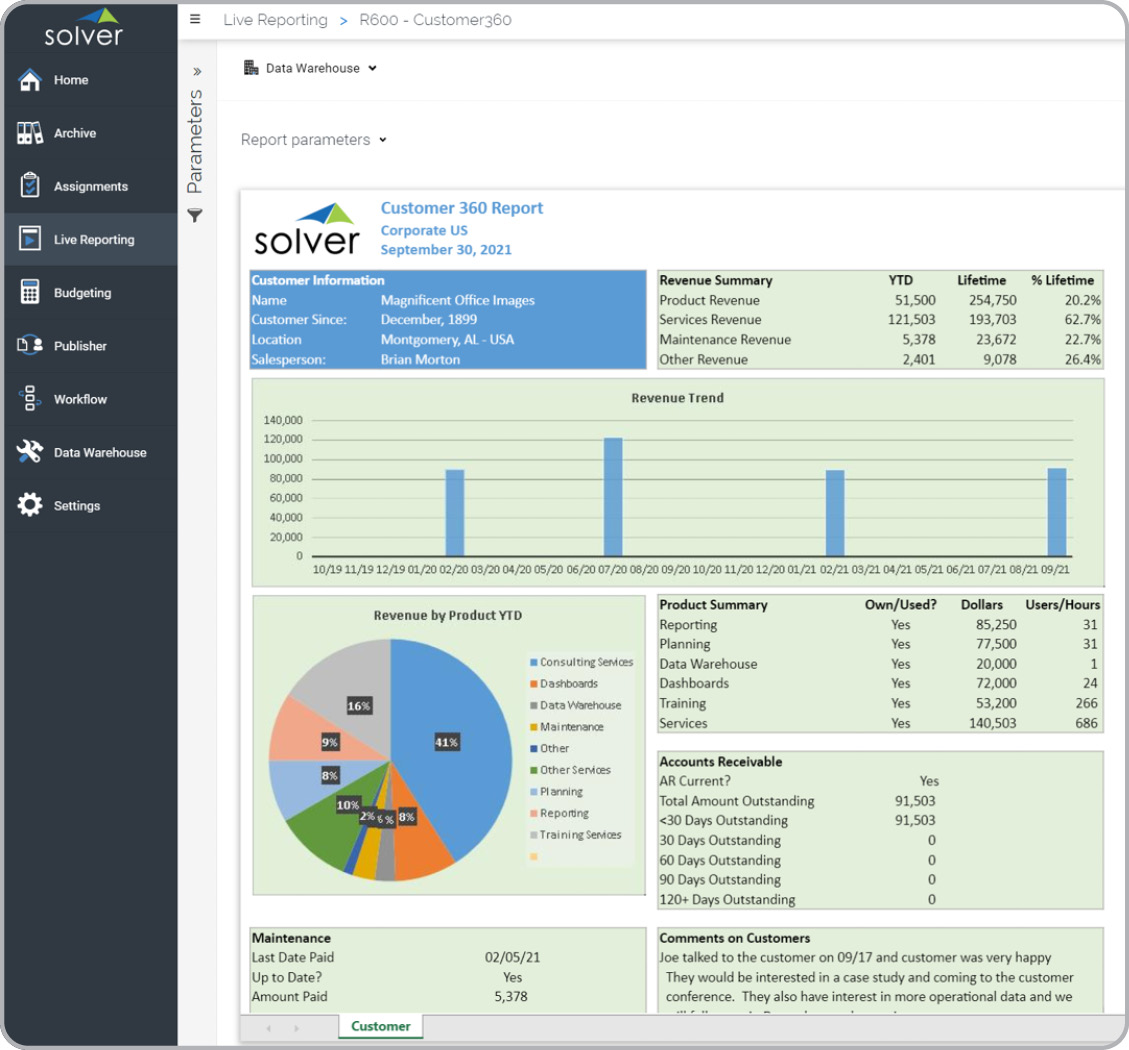
Customer360 Report
Single 360 degree view of all customer activity including revenues and expenses.
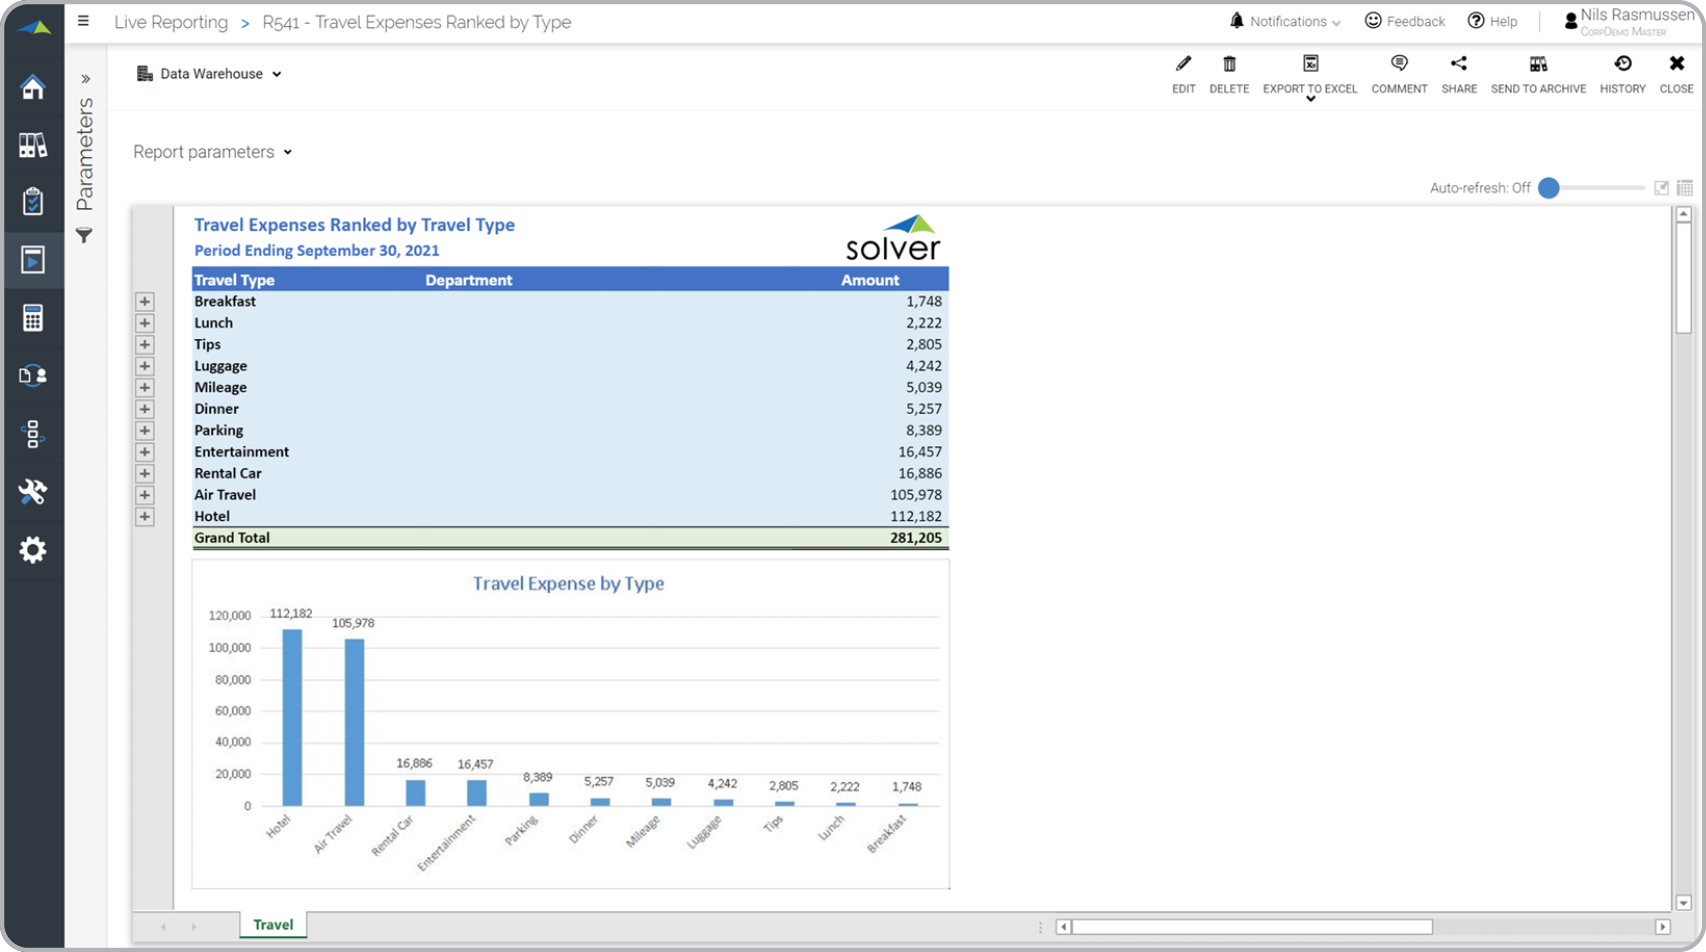
Travel Expenses by Category
Travel and Entertainment report to analyze expenses by category.
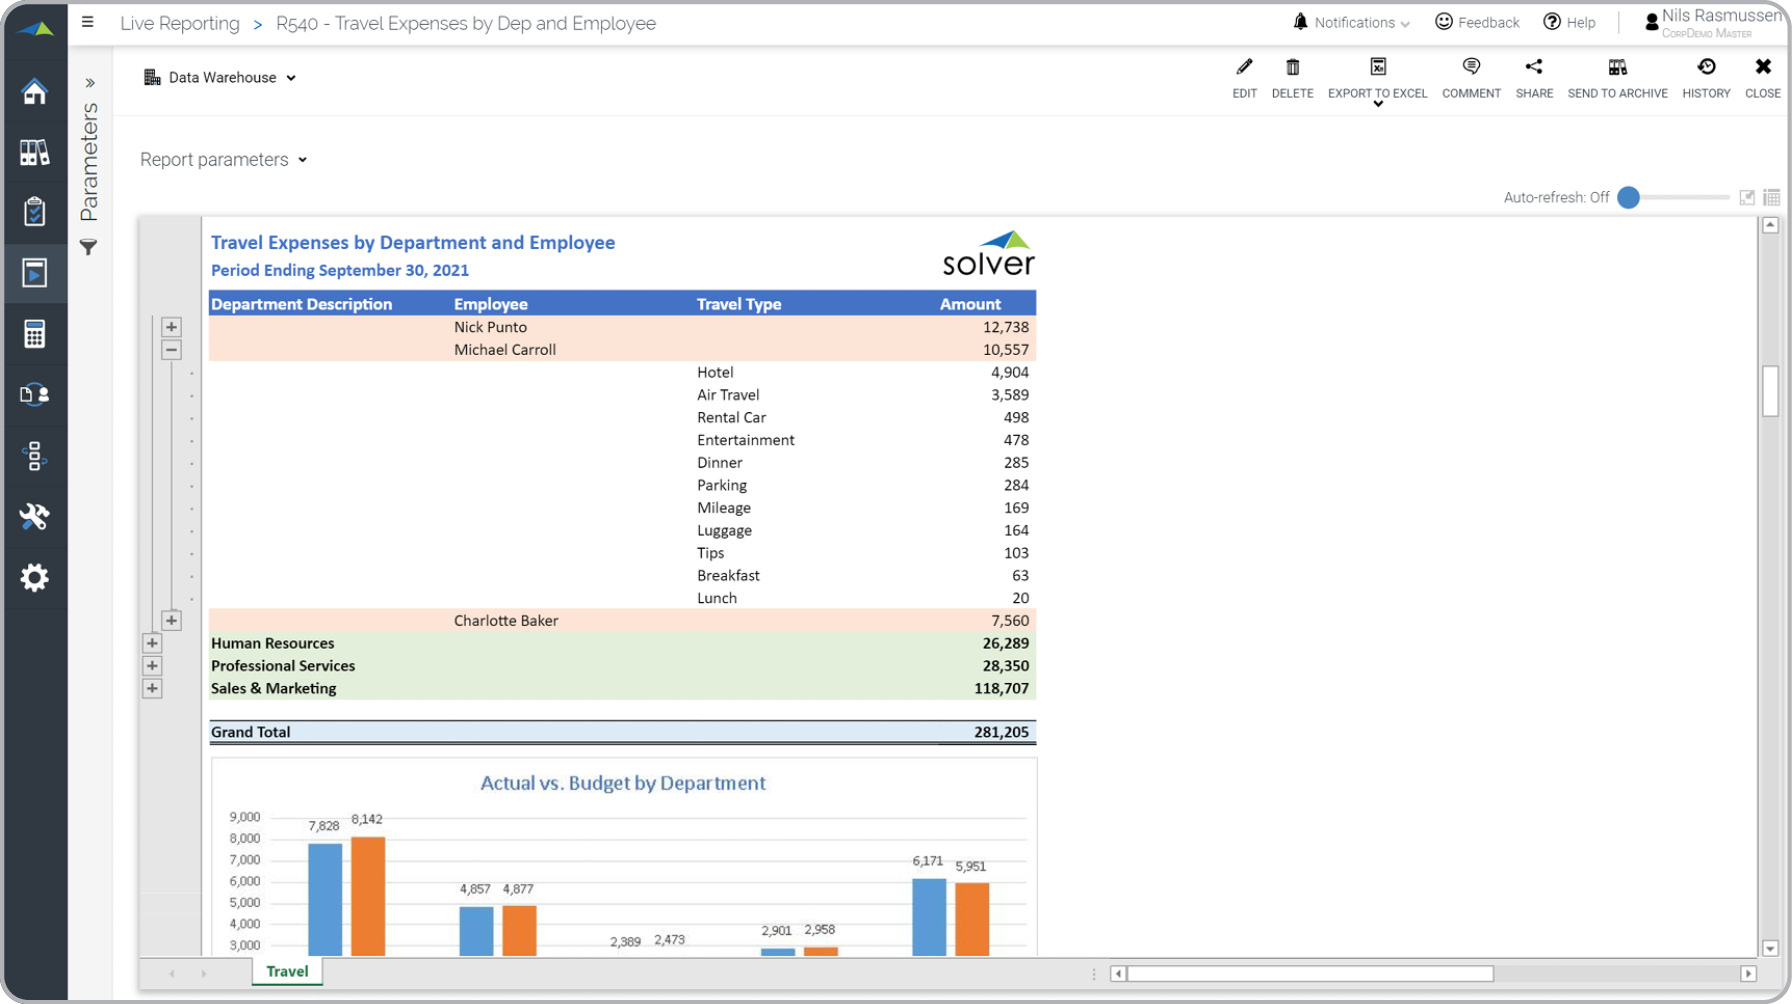
Travel Expenses by Department
T&E detail by department and employee comparing actual to budgeted expenses.
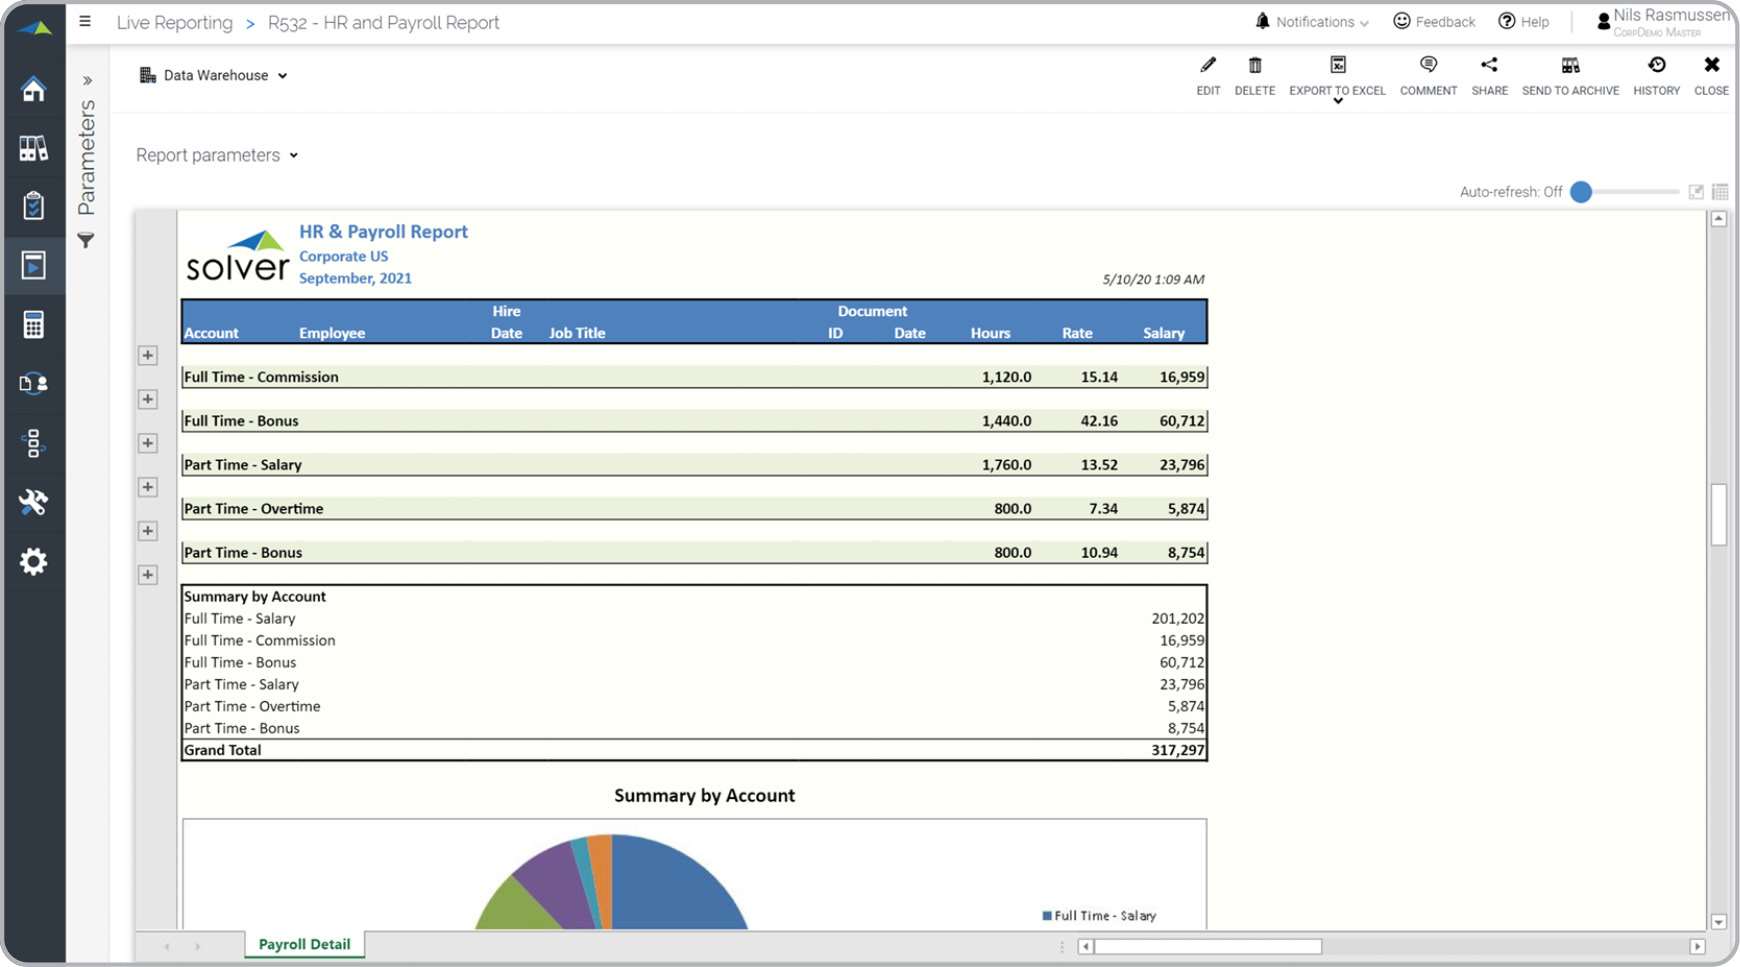
HR and Payroll Report
Shows detailed compensation by employee and rolled up by GL account.
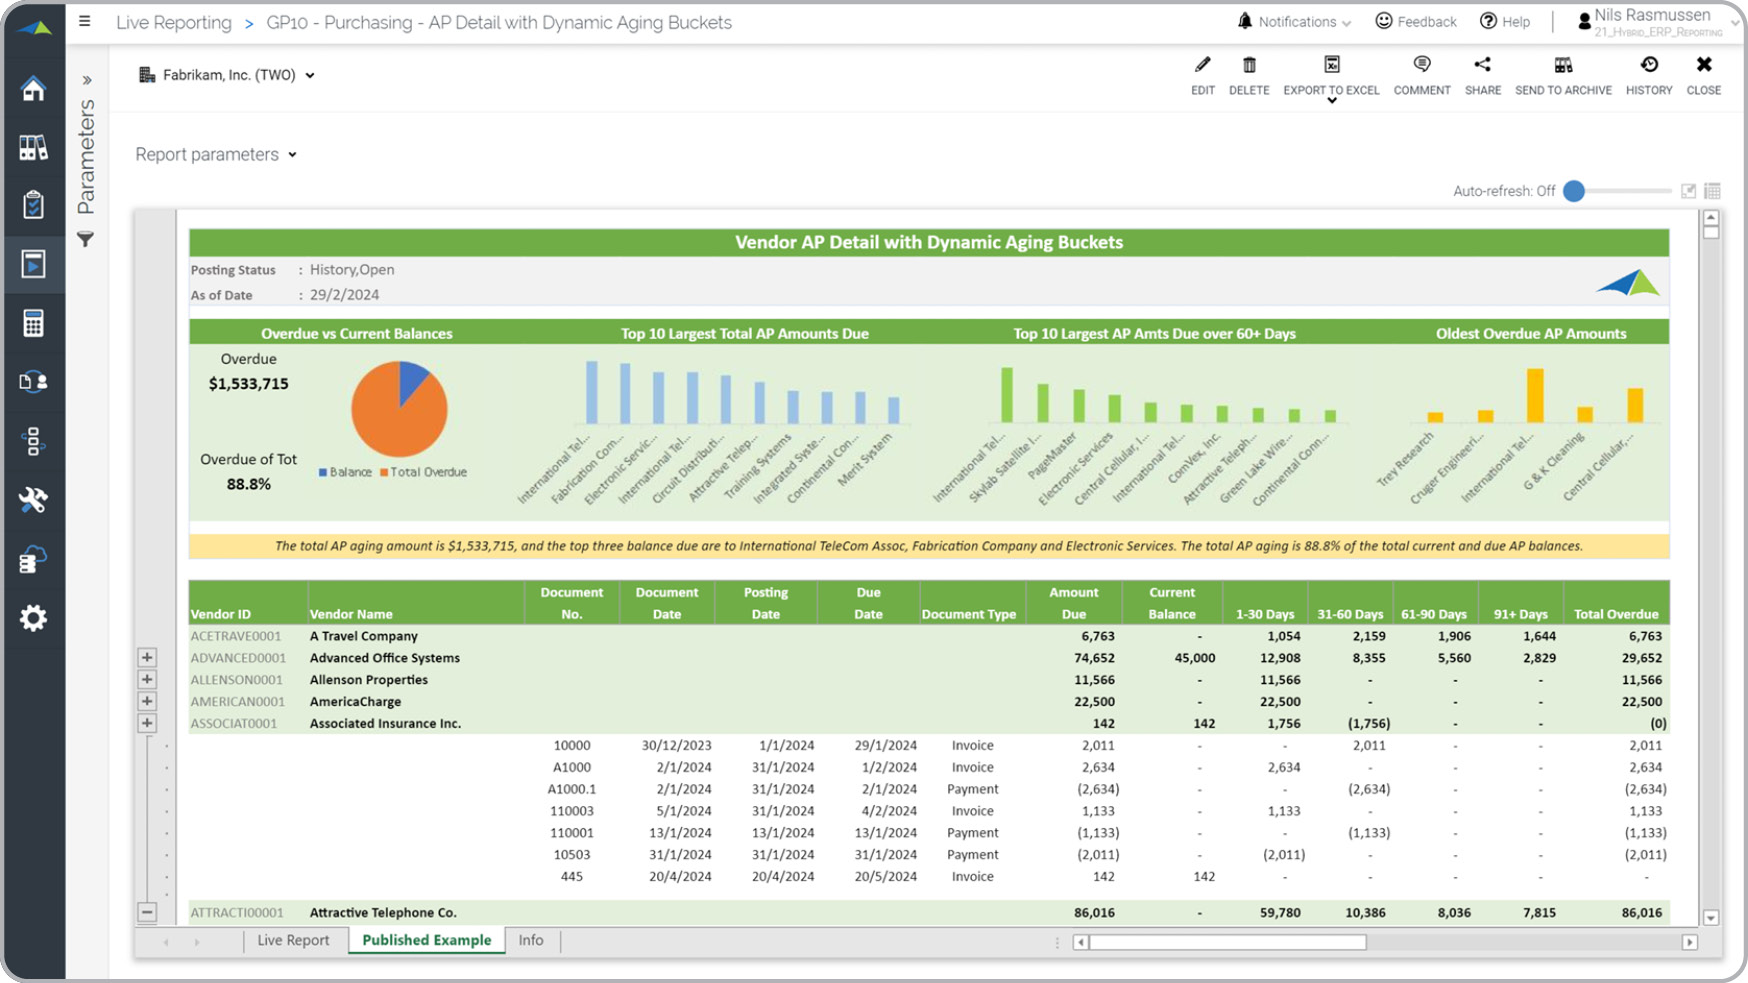
AP Report with Dynamic Aging
Automatically groups Vendor Payables (AP) into aging buckets. Charts adds analytics.
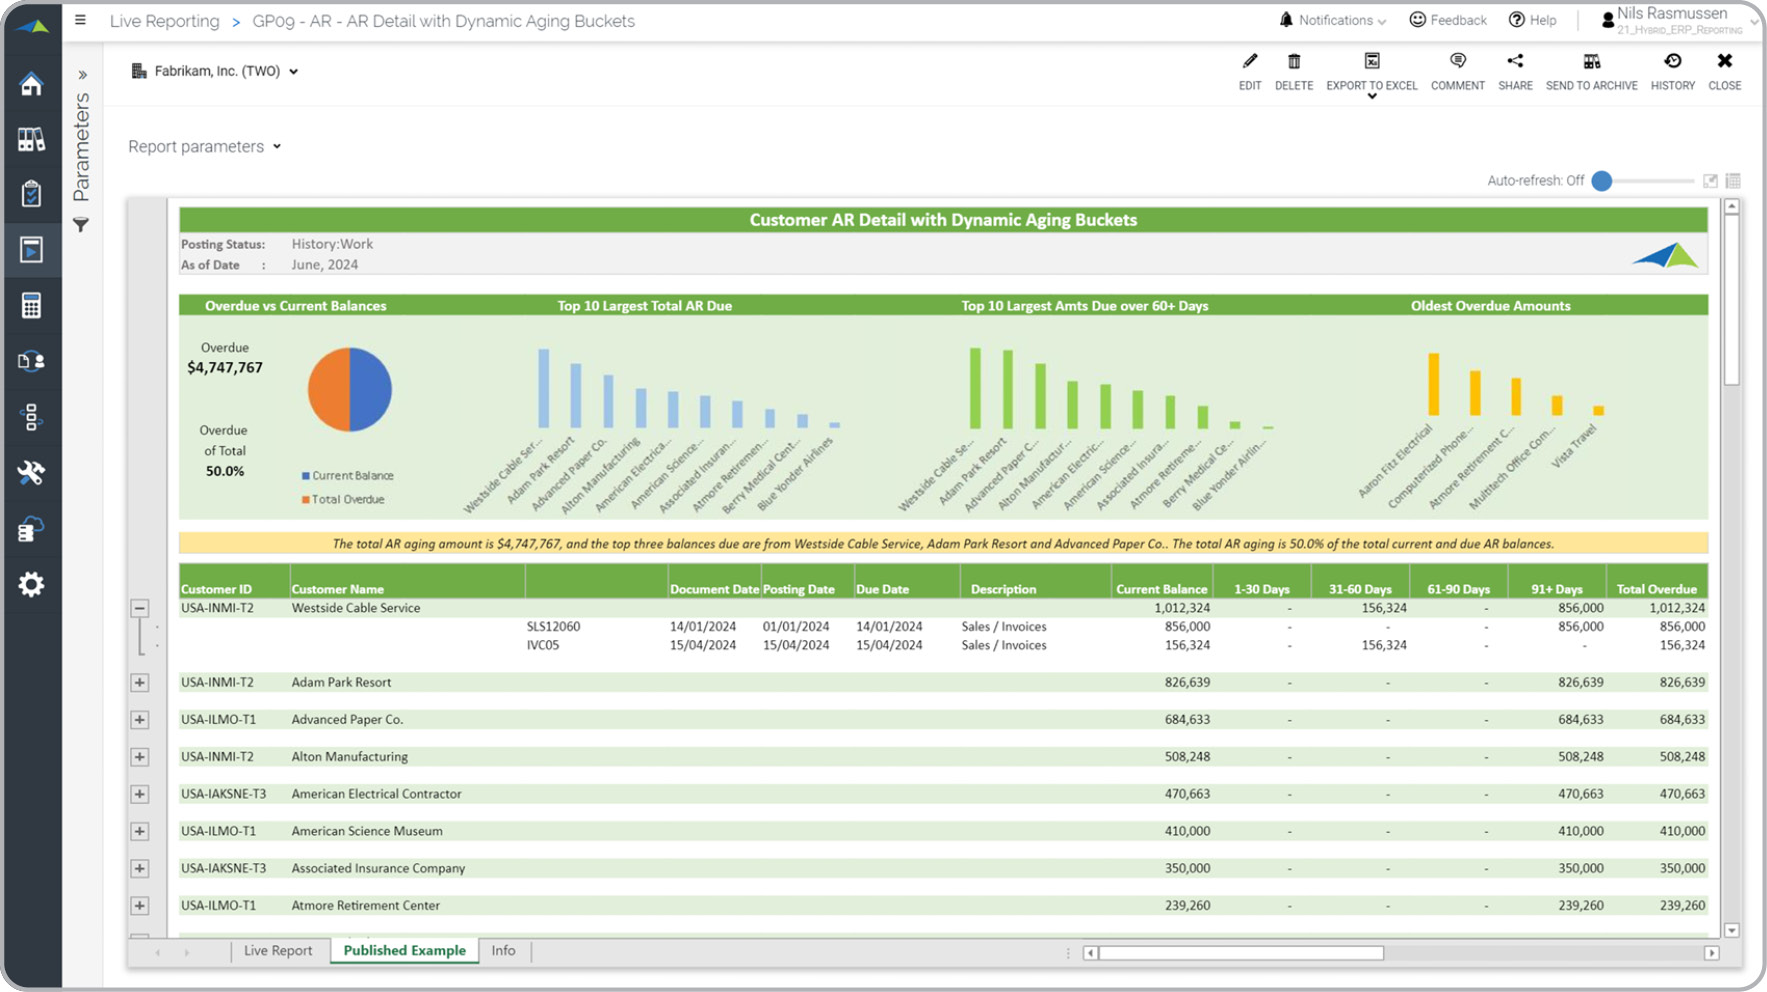
AR Report with Dynamic Aging
Automatically groups AR balances into aging buckets based on dates. Charts adds analytics.
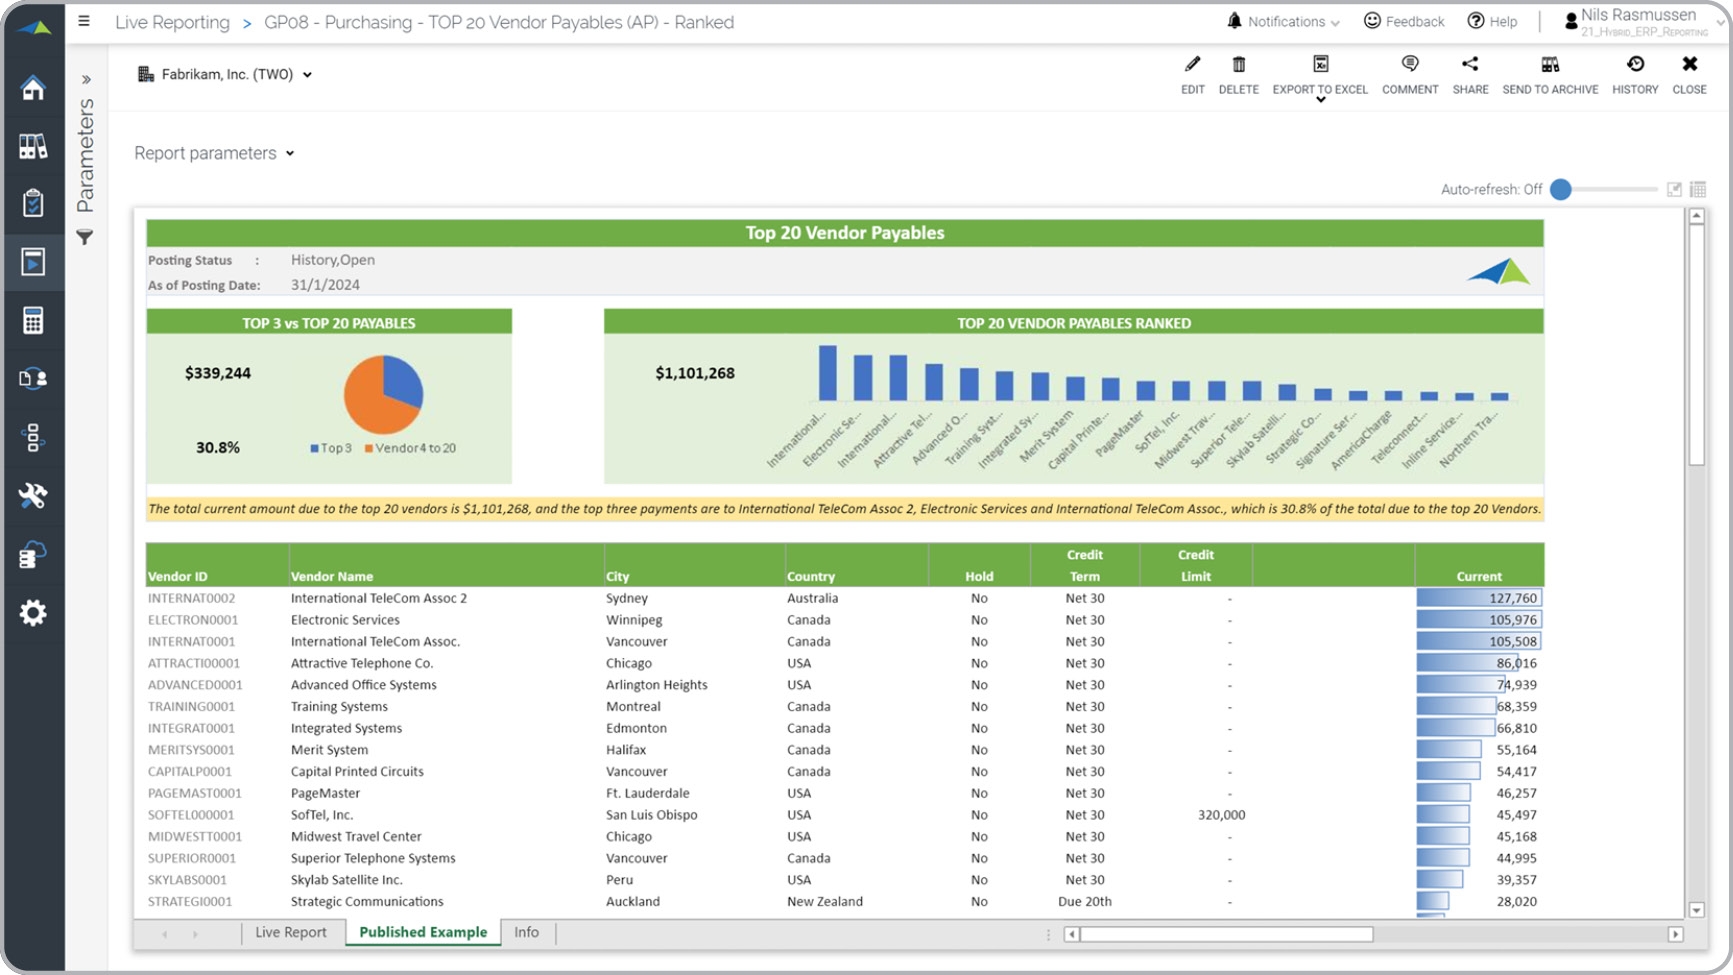
Top 20 Vendor Payables Report
Accounts Payable (AP) report ranking the top 20 vendors based on balance owed to them.
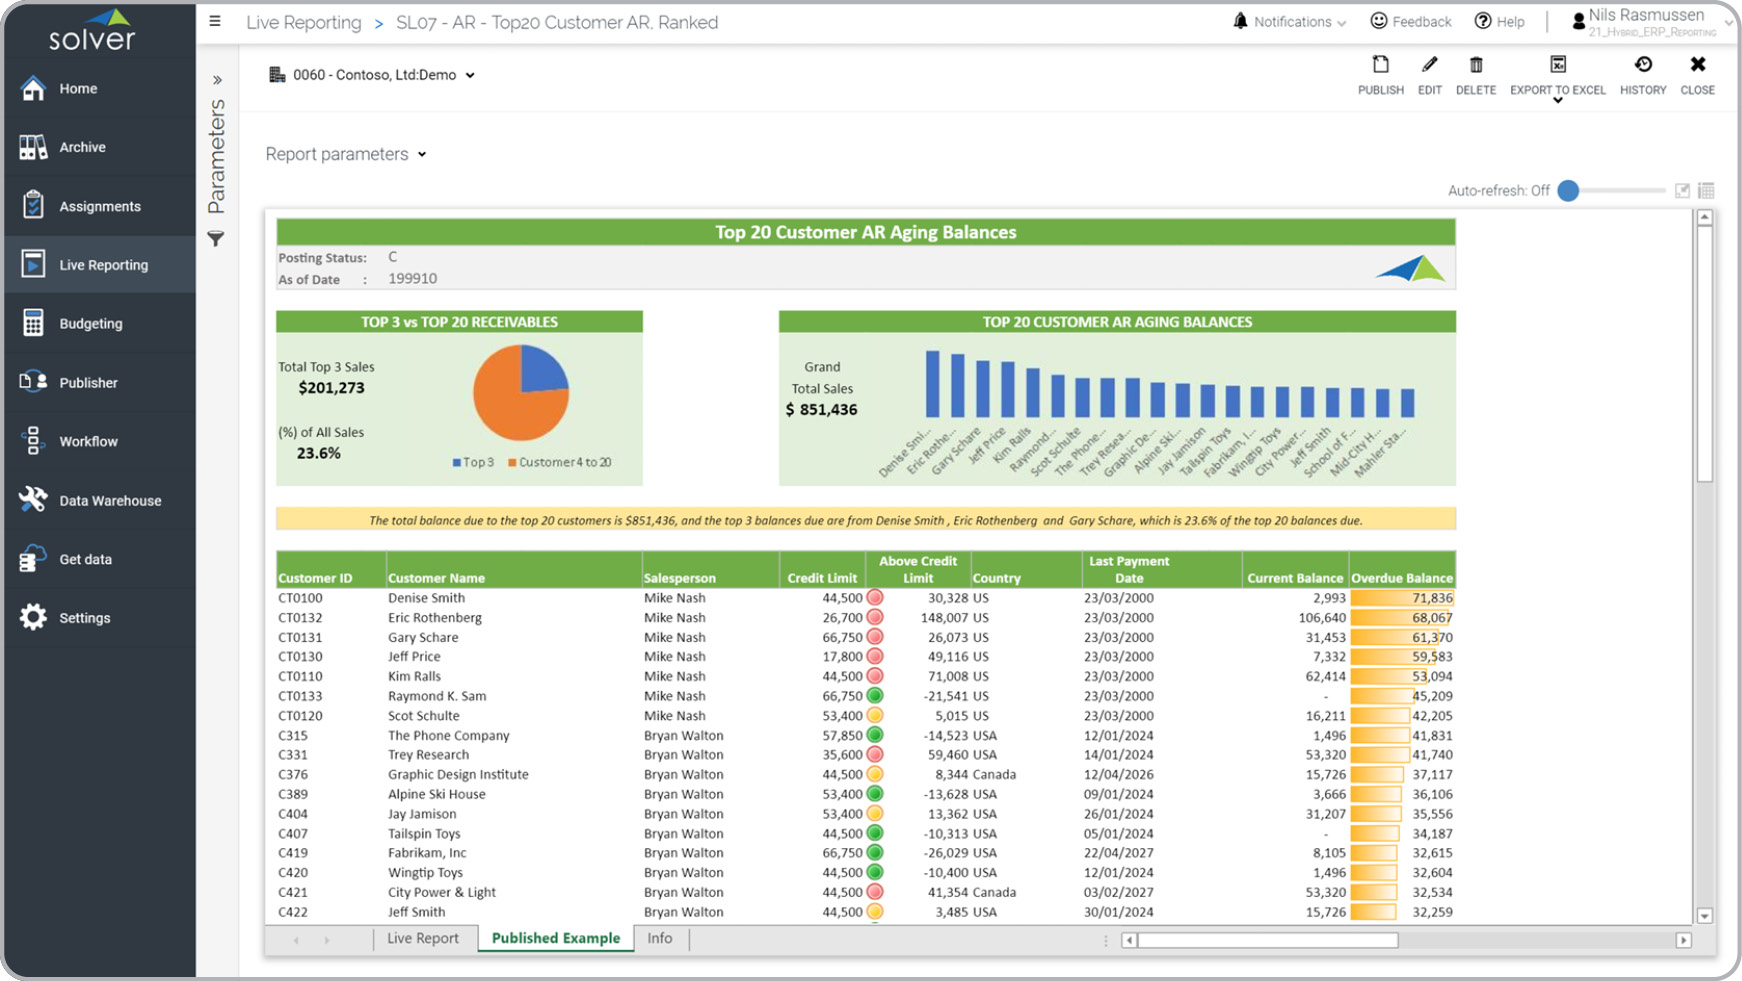
Top 20 Customer AR Aging Report
Accounts Receivable (AR) aging report ranking the top 20 customers based on their balance.
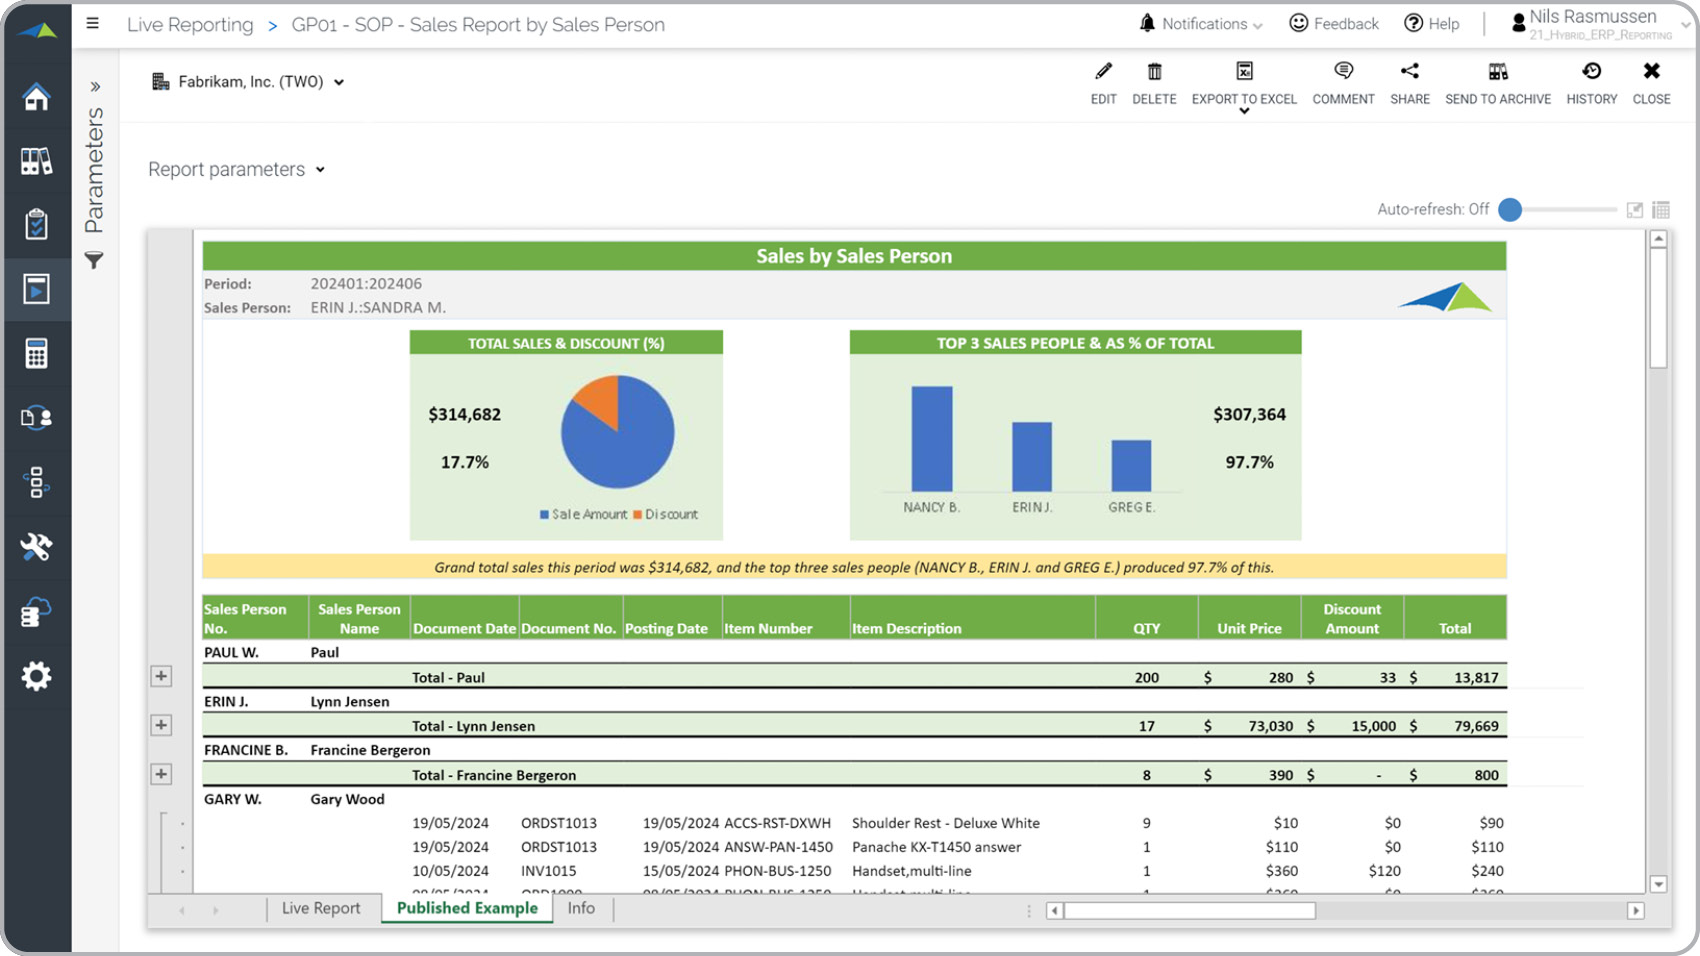
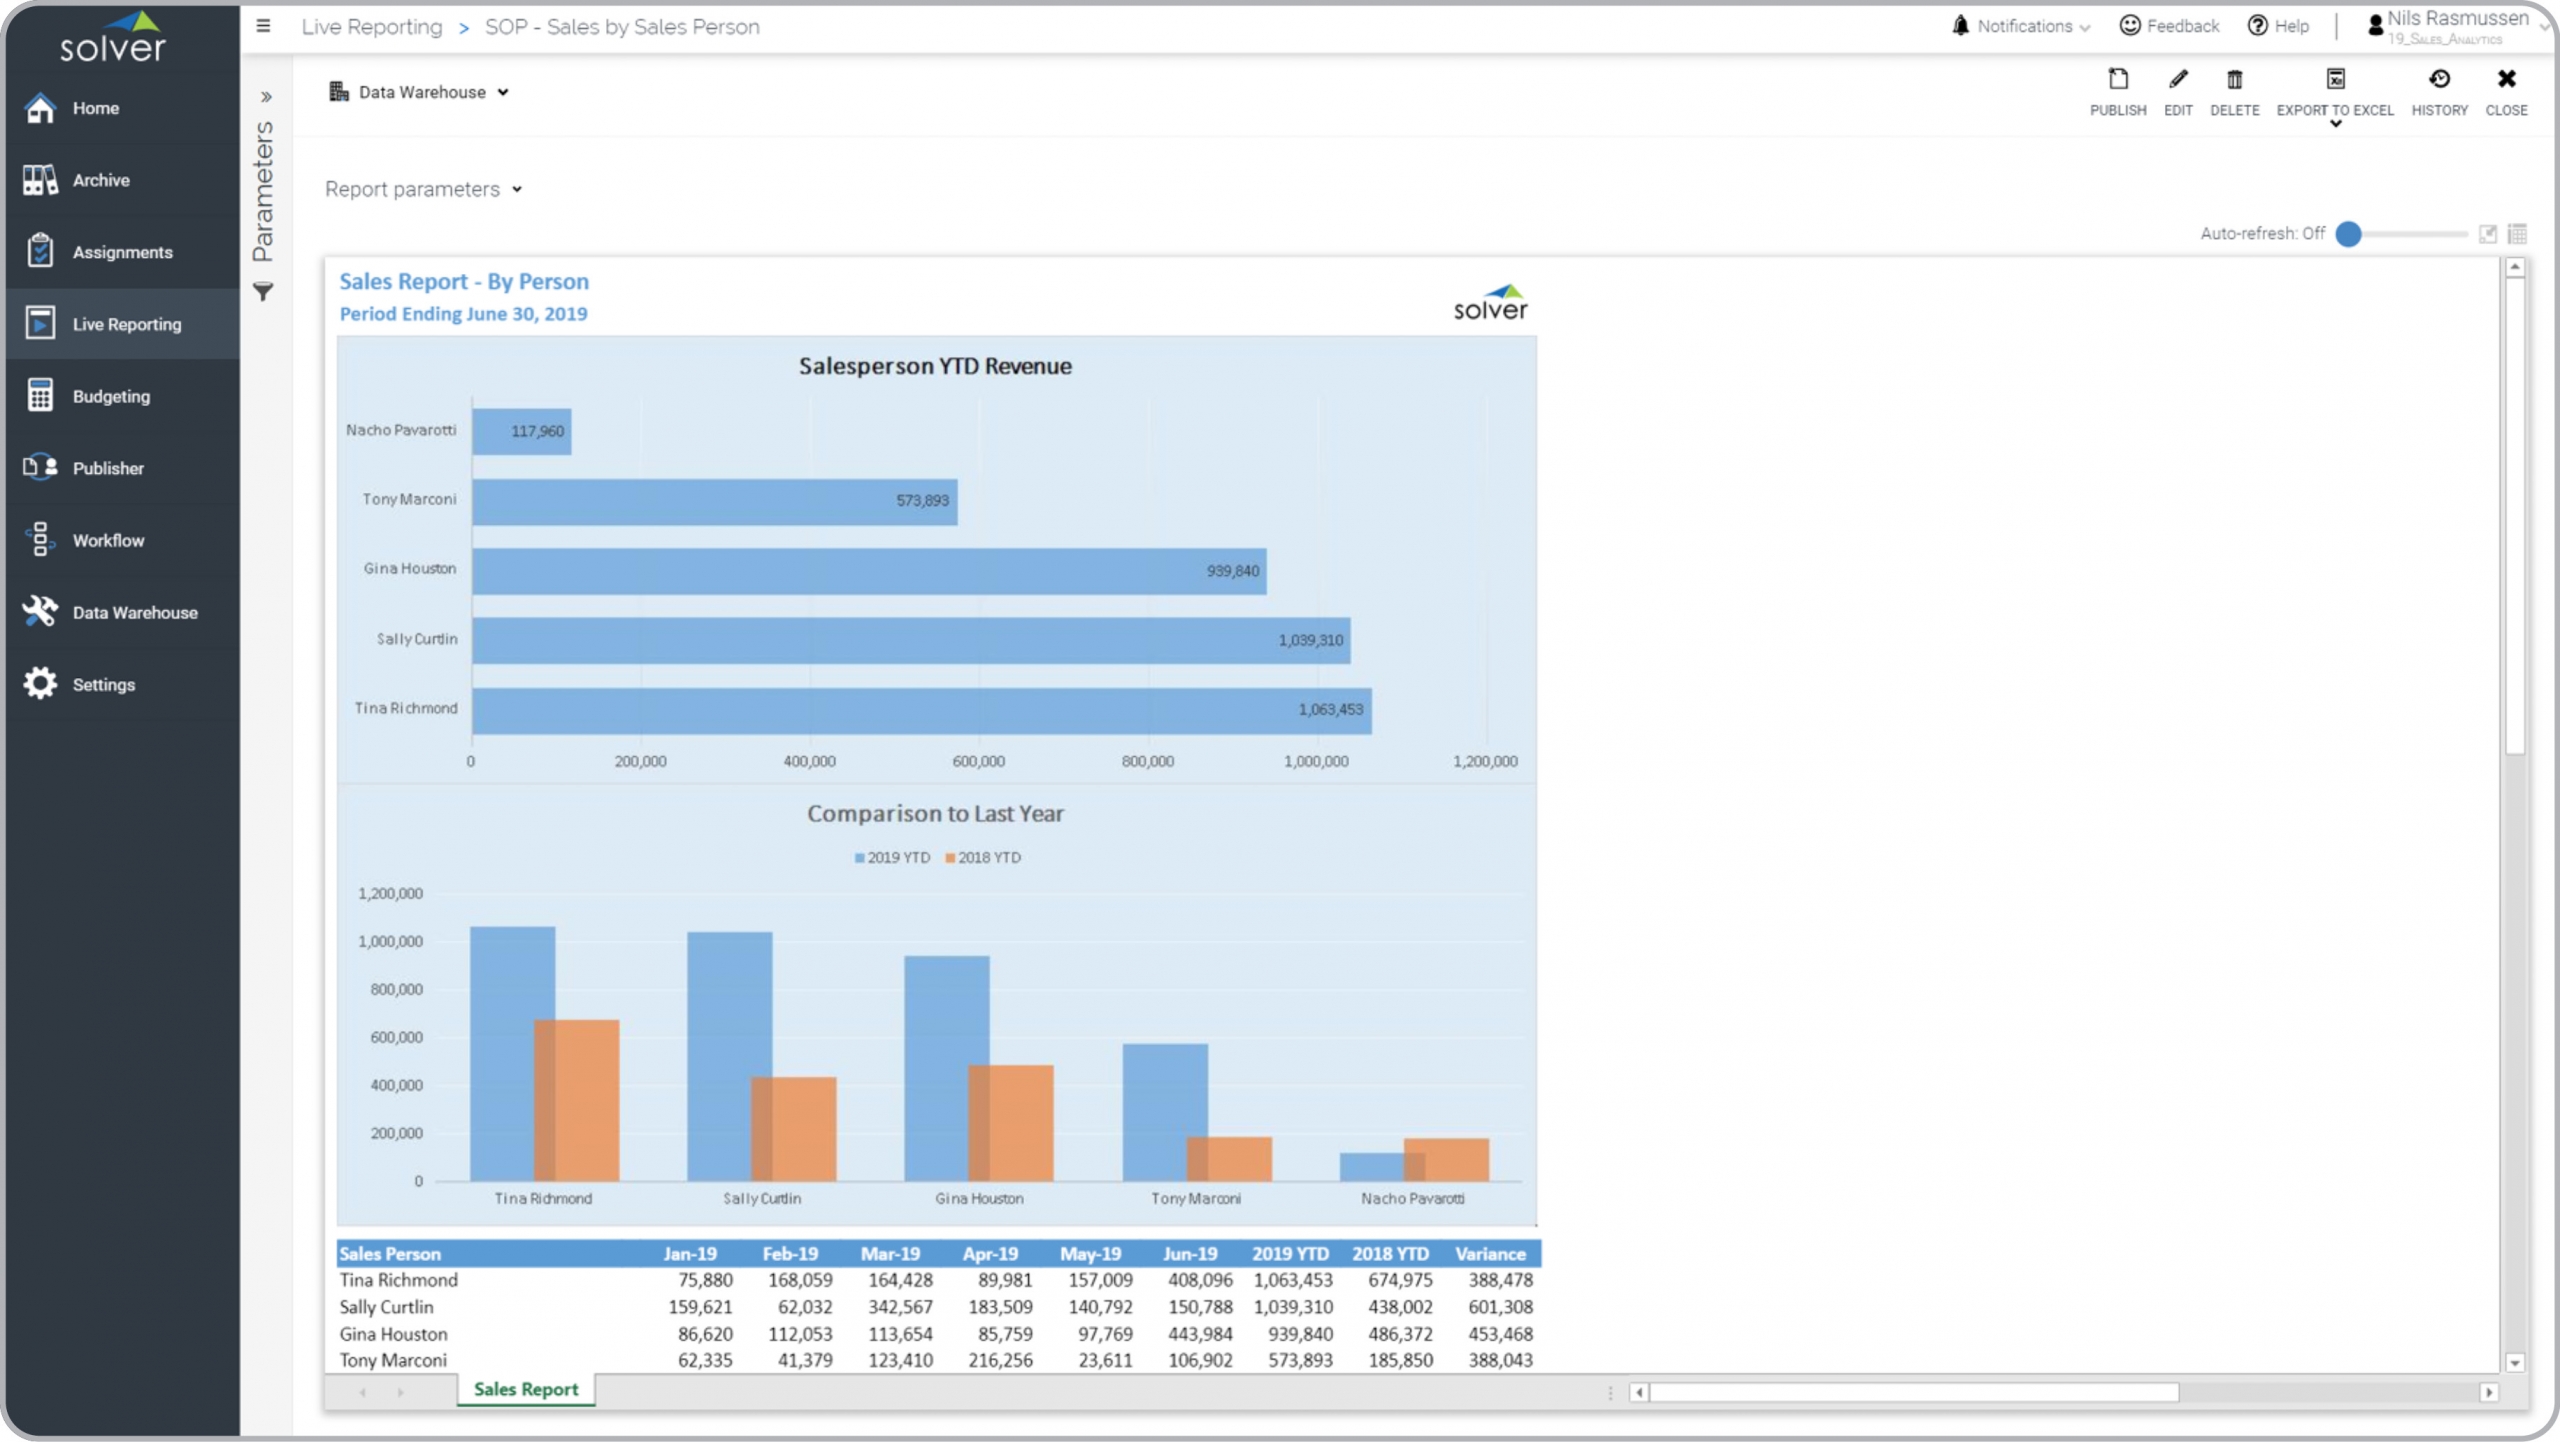
Sales by Sales Person
Detailed report grouping sales transactions by sales person with metrics analyzed in charts.
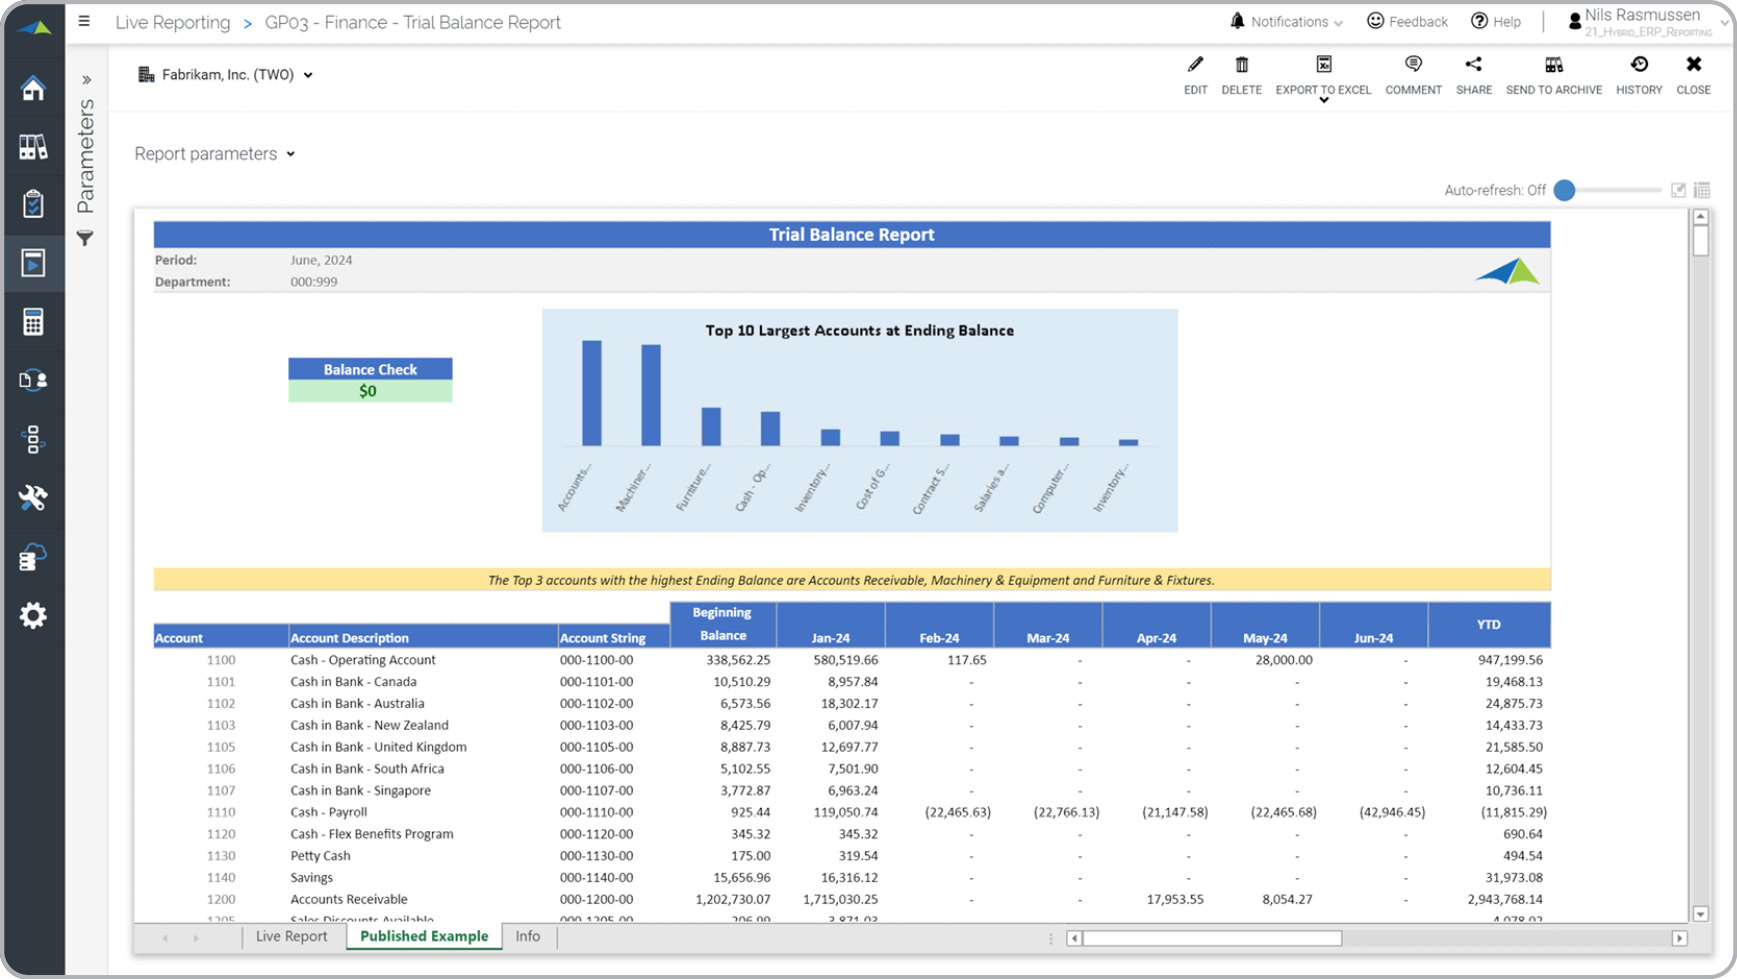
Trial Balance – YTD Trend
Shows Trial Balance all months year-to-date with balance check on the top of the report.
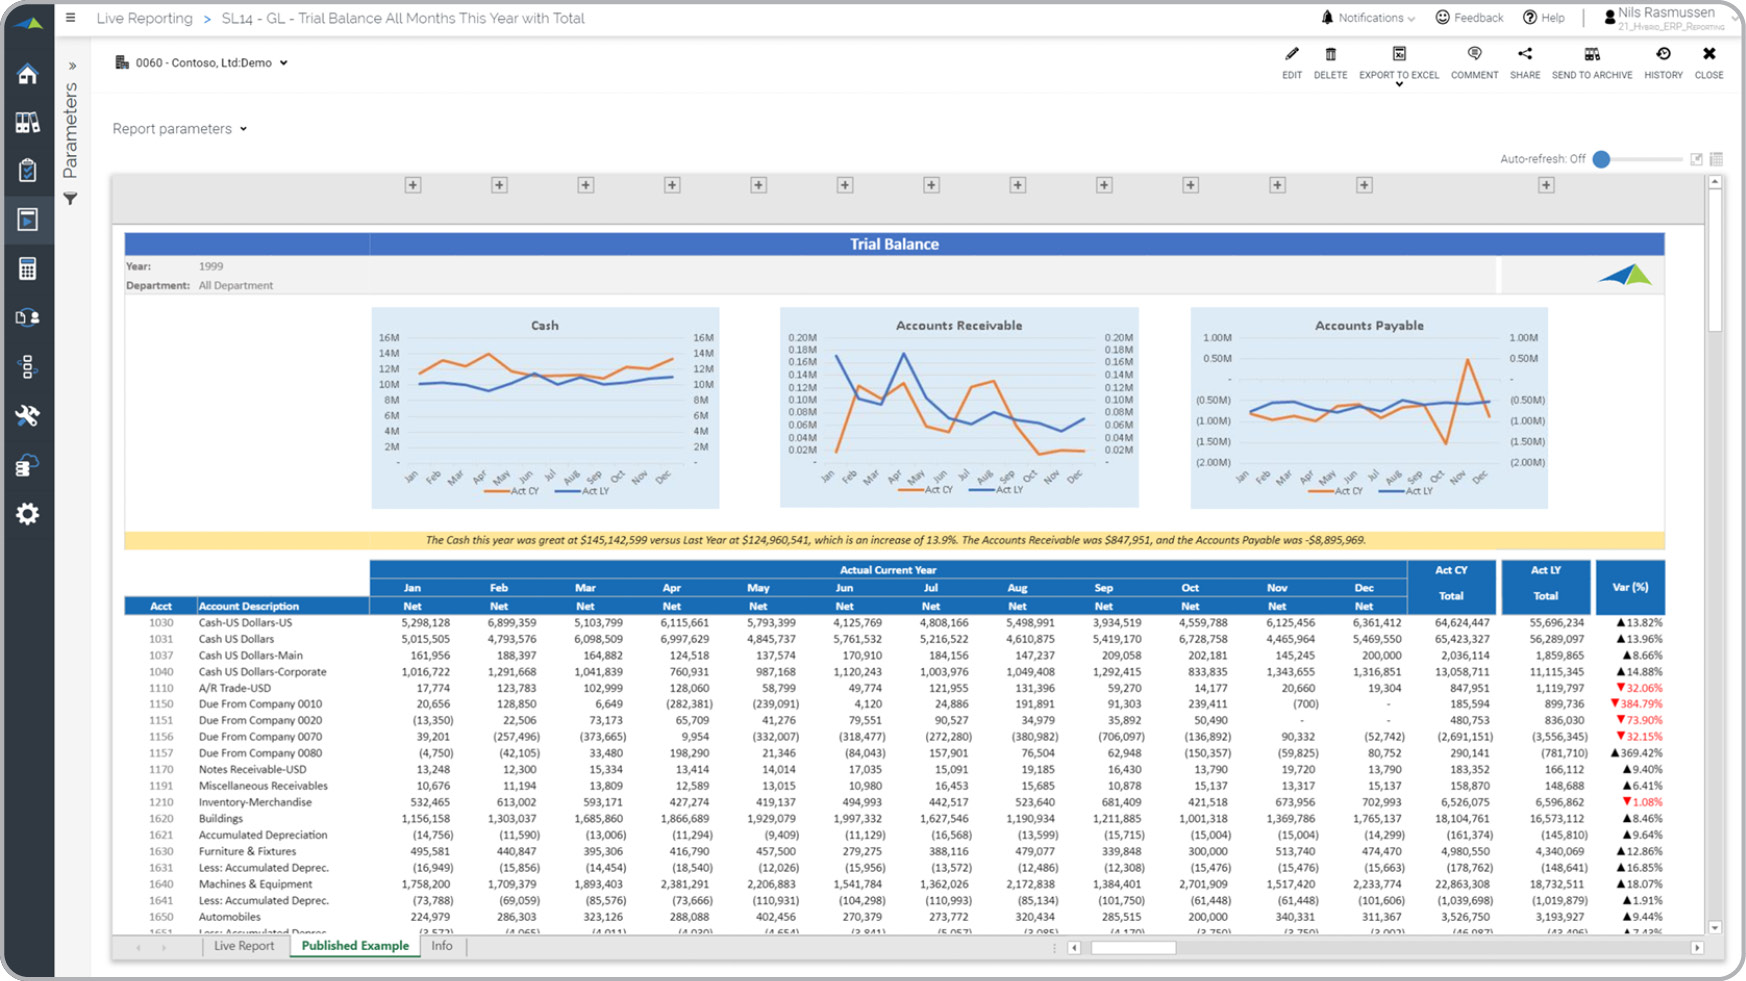
Trial Balance – Monthly Trend
Trial Balance report for all months this year and last year. Expand columns for Debit/Credit/
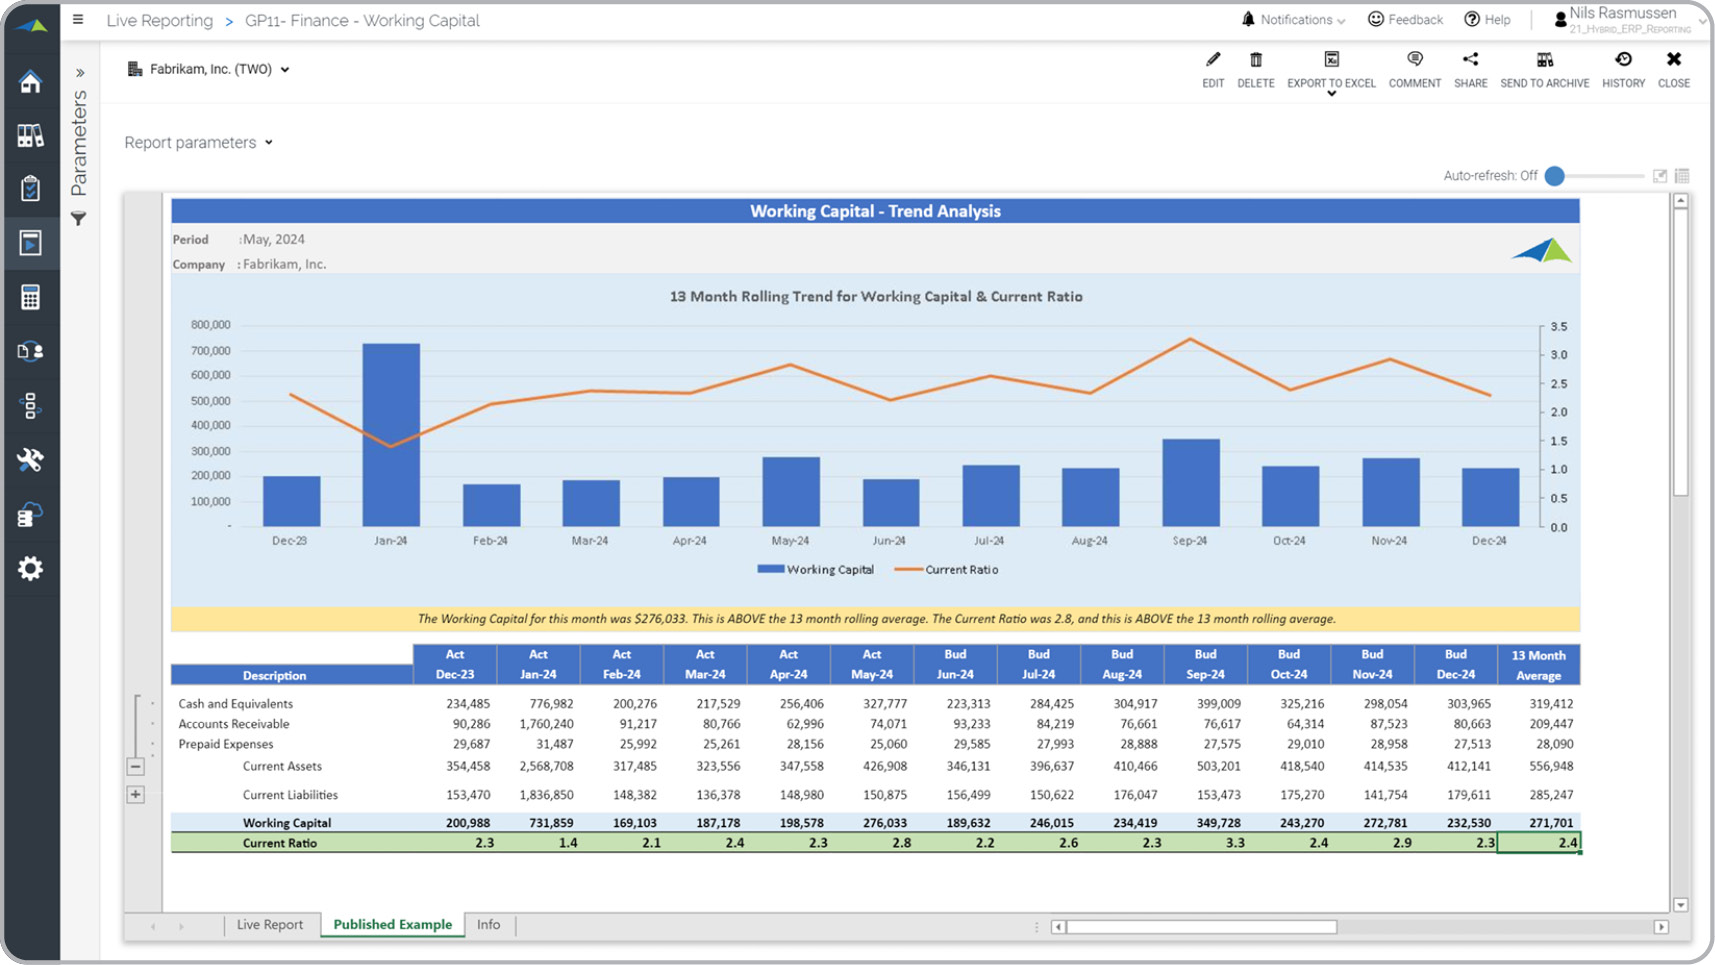
Working Capital Trend Analysis
Report combines actual YTD with budget to provide a trended estimate for the year.
Cash Flow Variance Report
Shows Cash Flow with variance against budget and last year with KPI analysis.
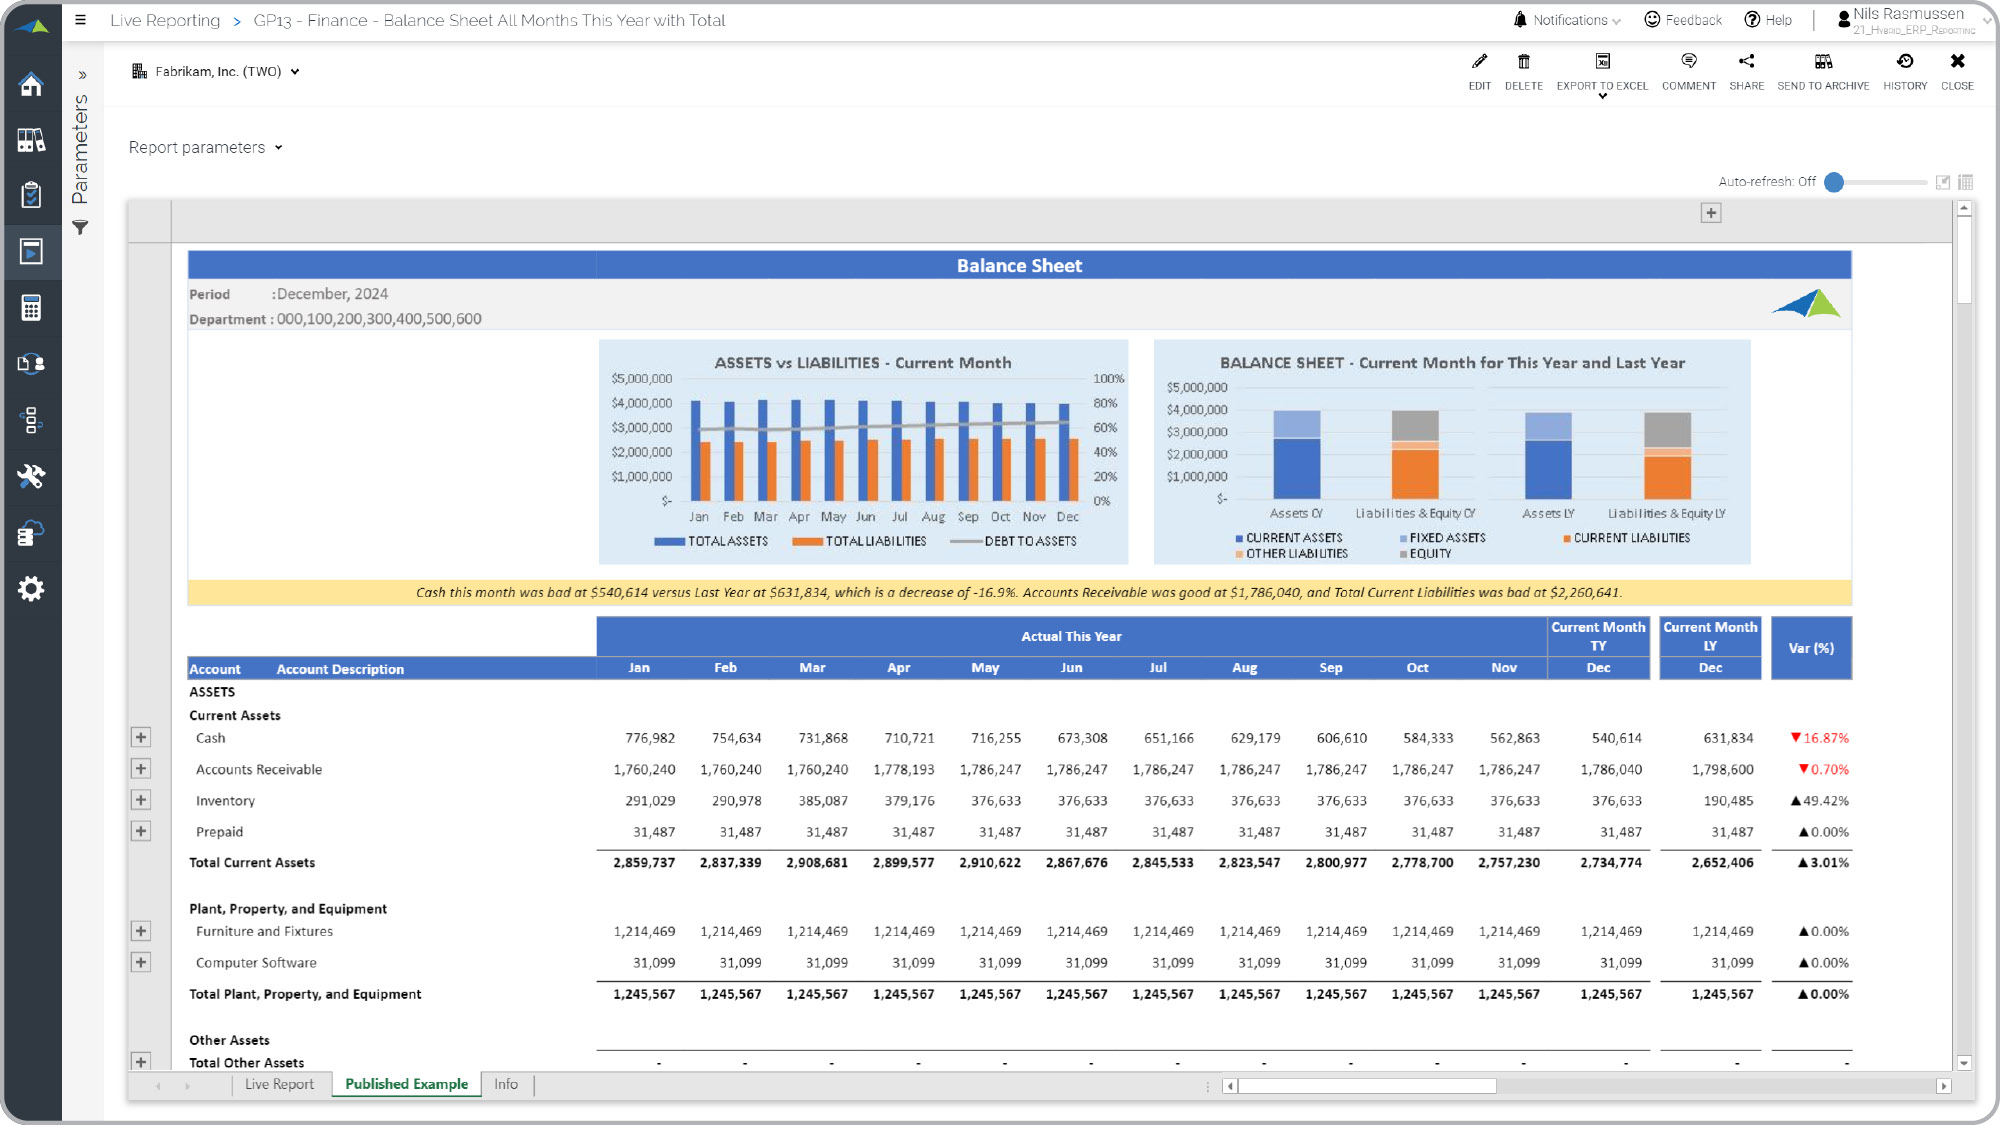
Balance Sheet – Trended
Report shows all months this year vs last year (expandable to see months) with trend charts.
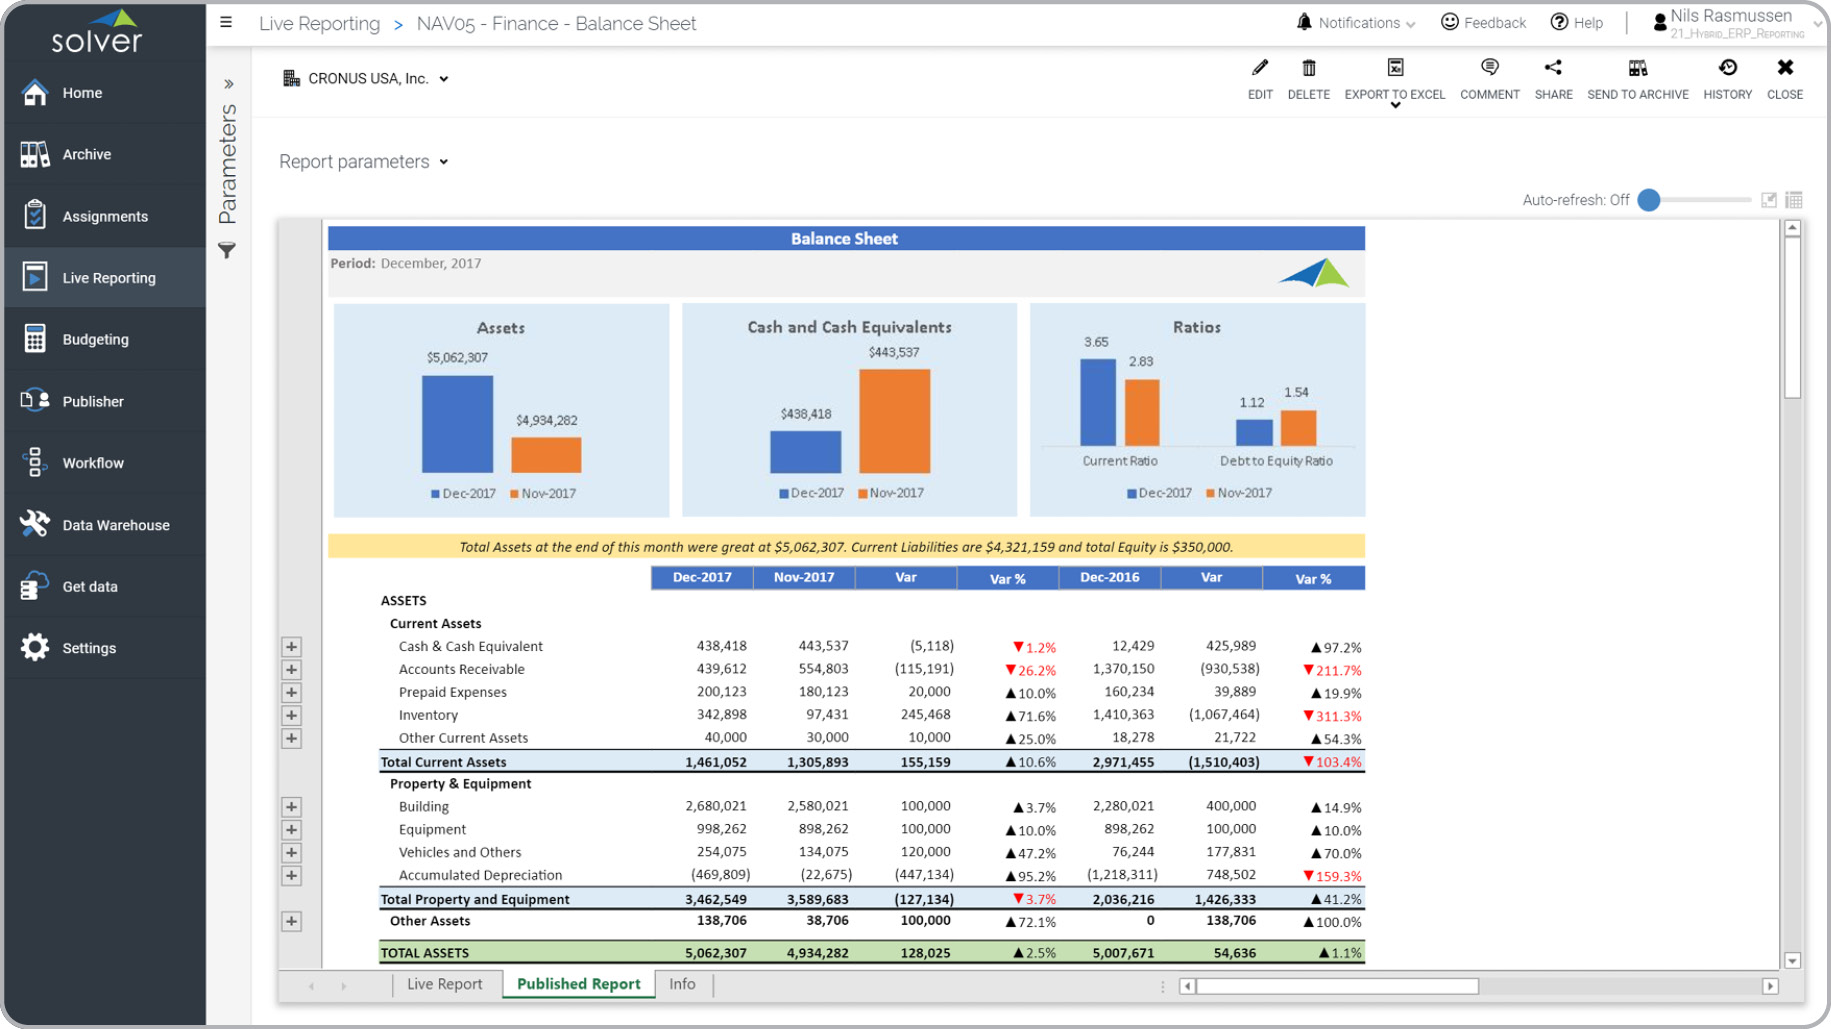
Balance Sheet – Variance Report
Balance Sheet report with variances versus prior month and last year with graphical analysis.
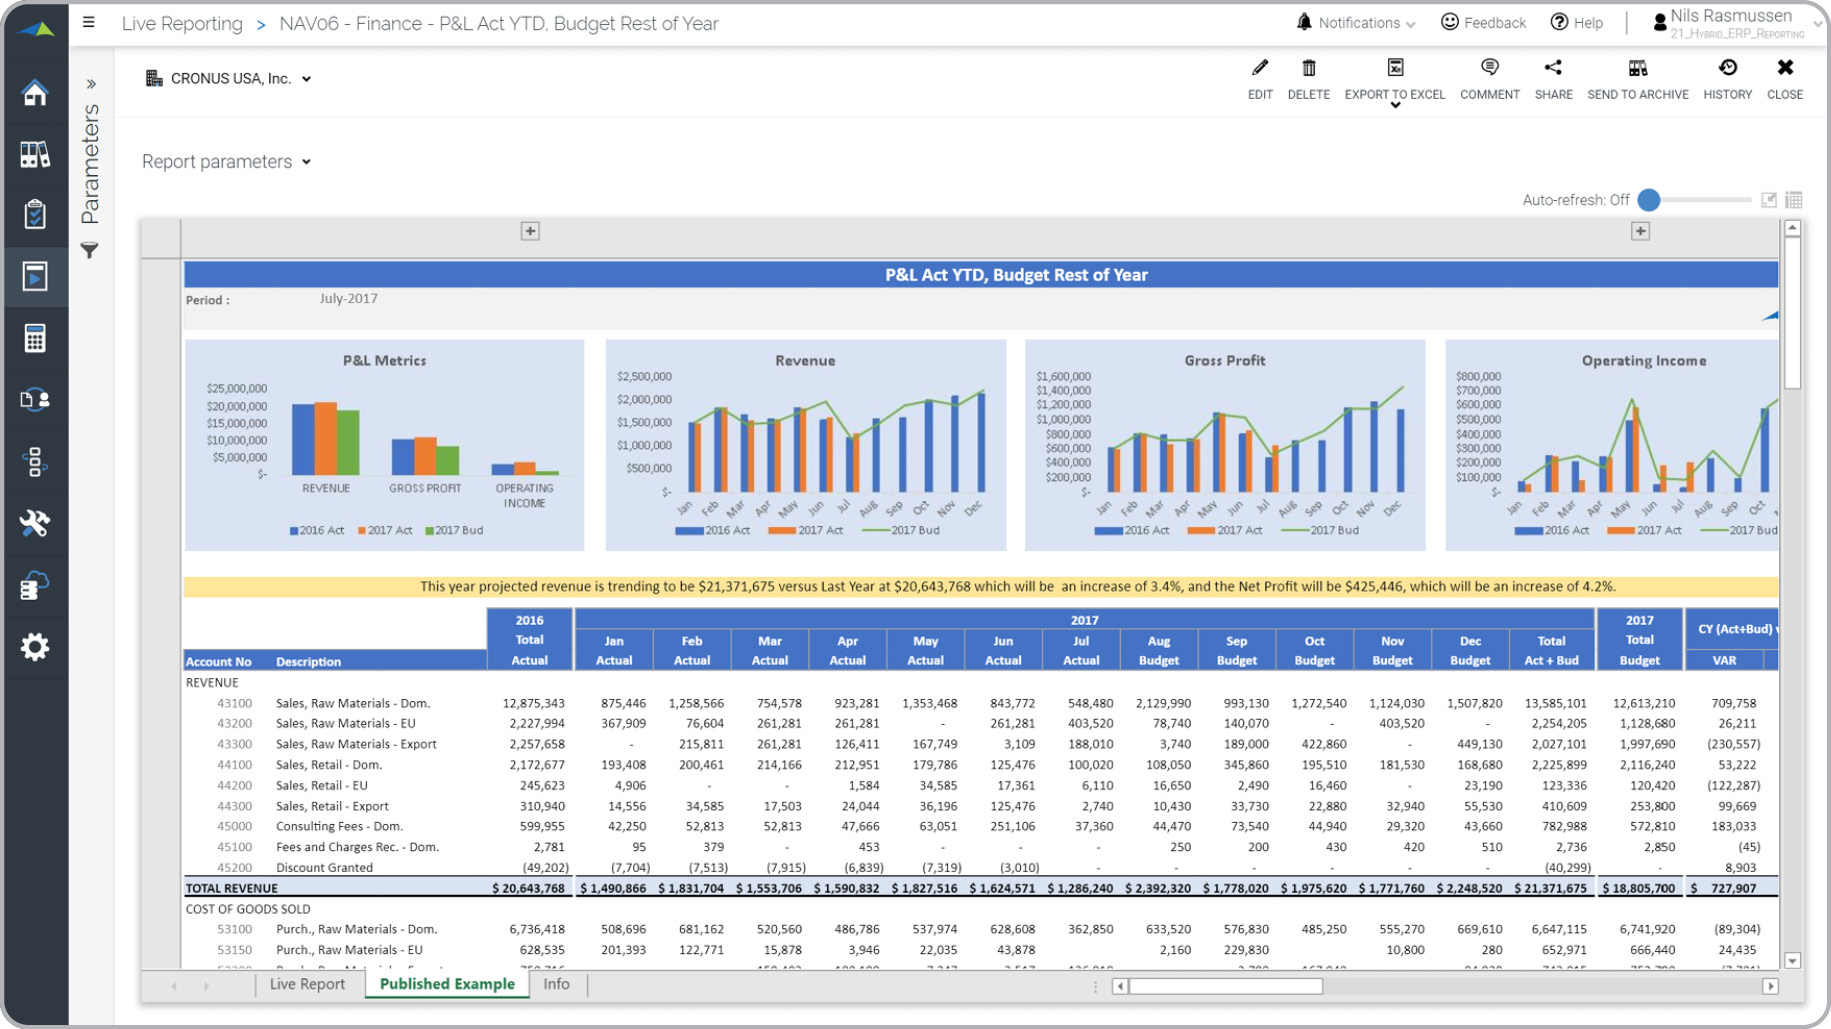
P&L Estimate with Trend Analysis
Report dynamically shows actual up to the current month and budget for the rest of the year.
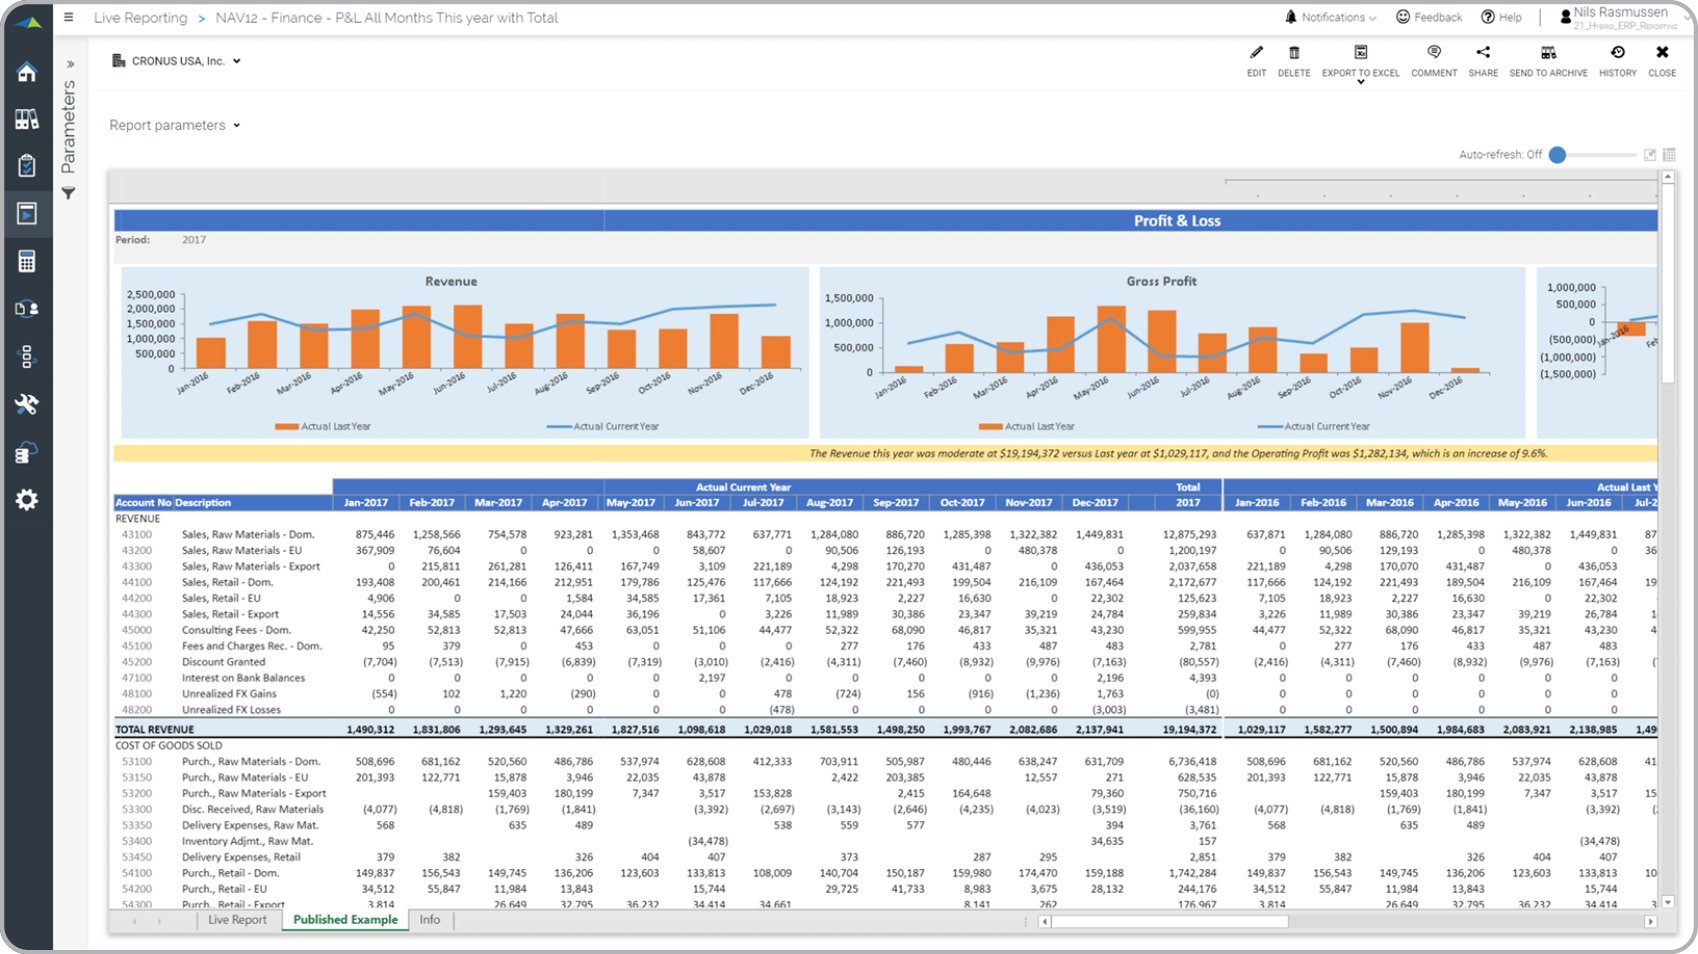
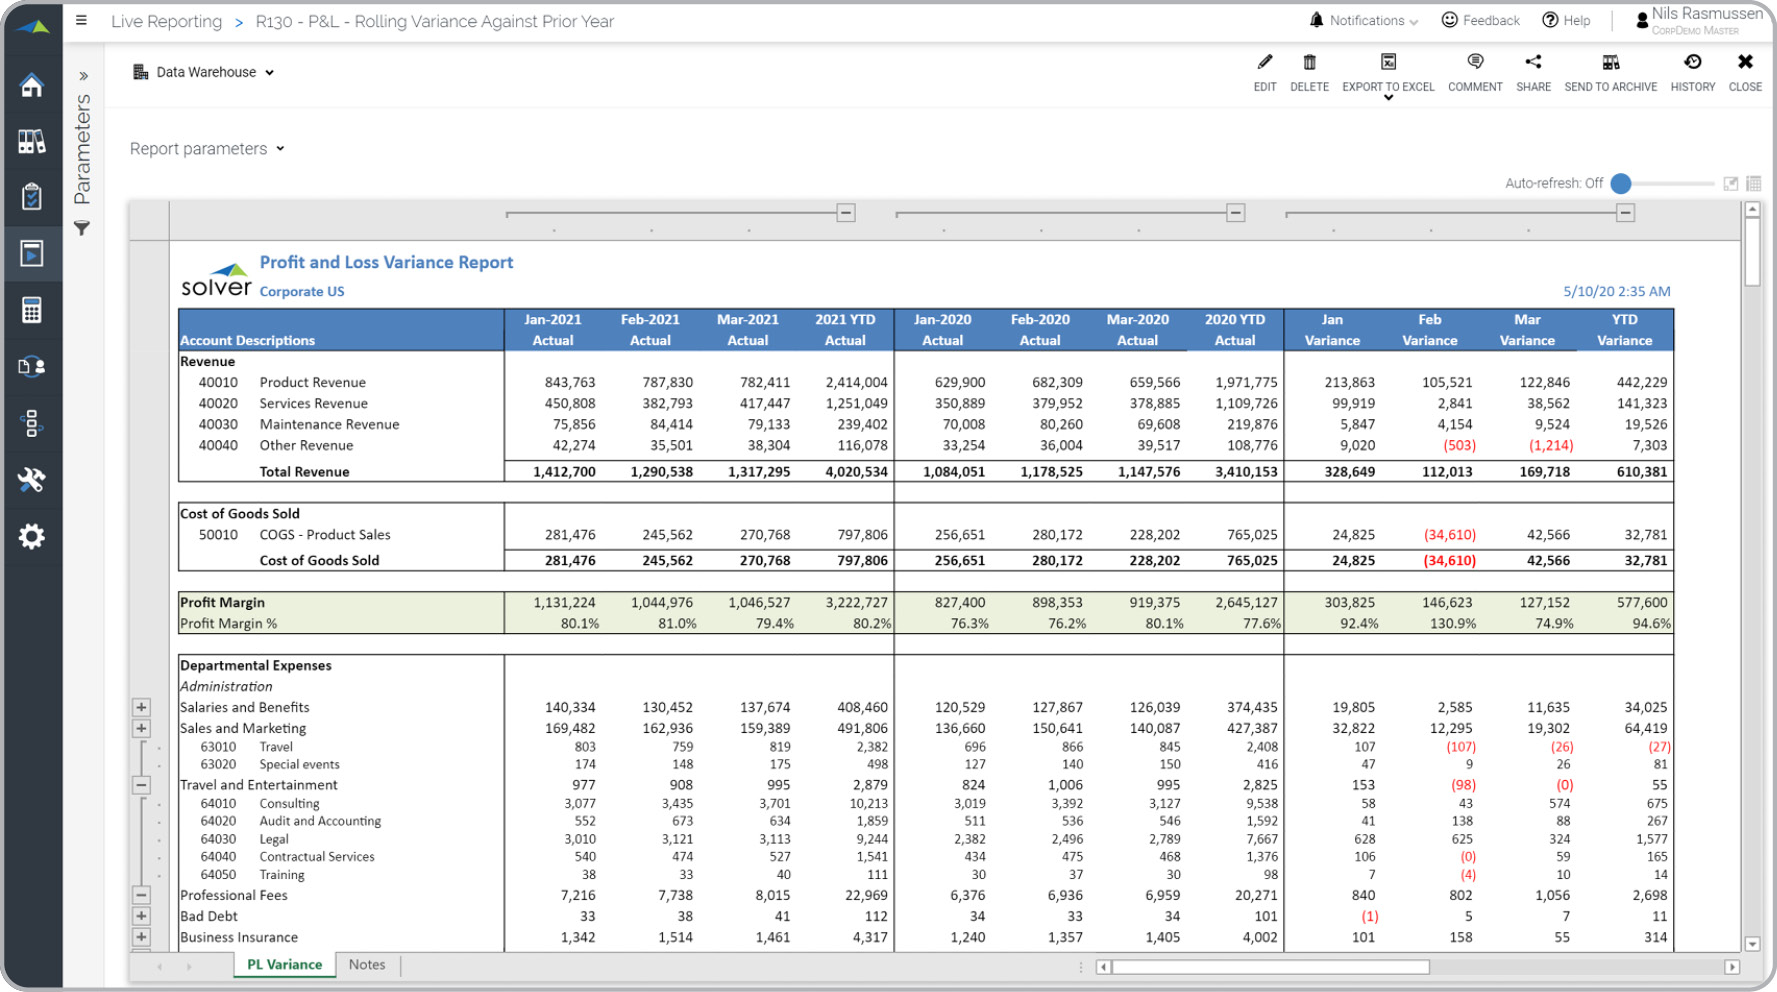
P&L – Trend Analysis vs Prior Year
The report shows the Profit & Loss trend for current and prior year with graphical KPI analysis.
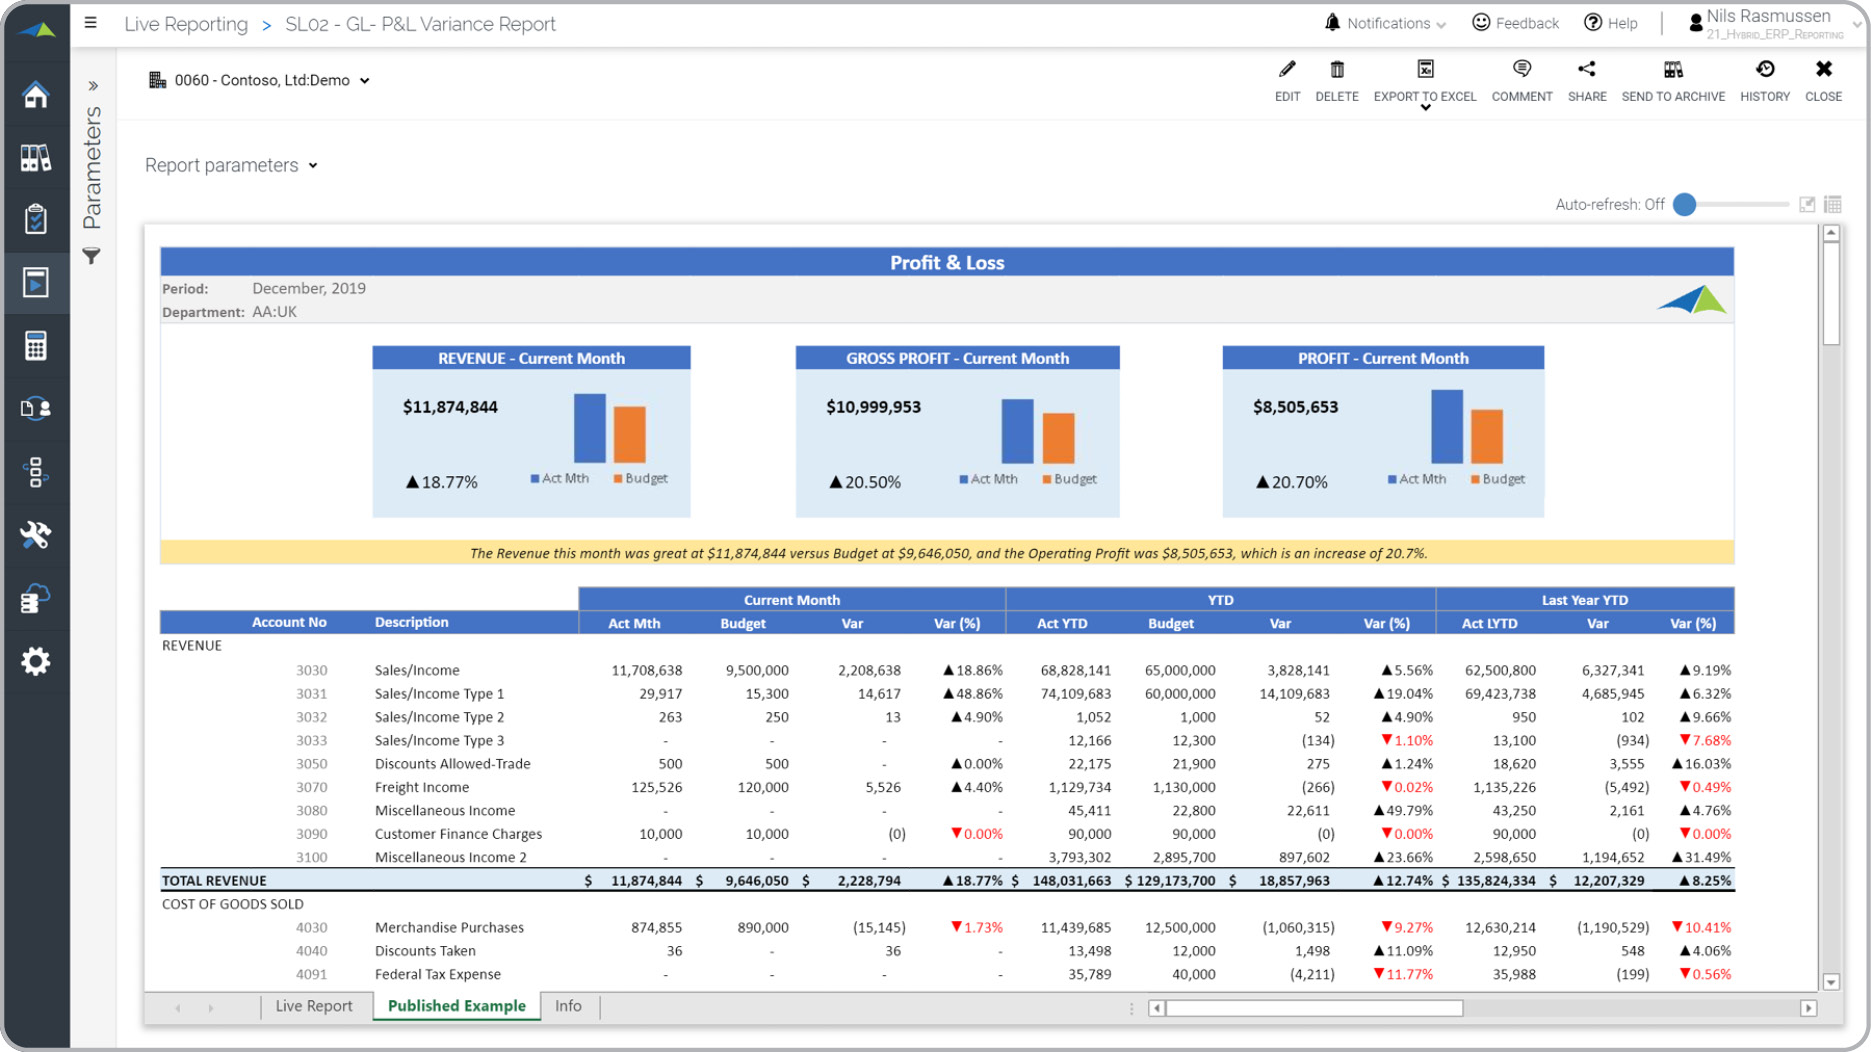
P&L – Variance Report
This Profit & Loss provides actual and budget variances for Month, YTD and Last Year.
P&L – Rolling 13 Month Trend
Profit & Loss report that dynamically shows the past 13 months and trend analysis for KPIs.
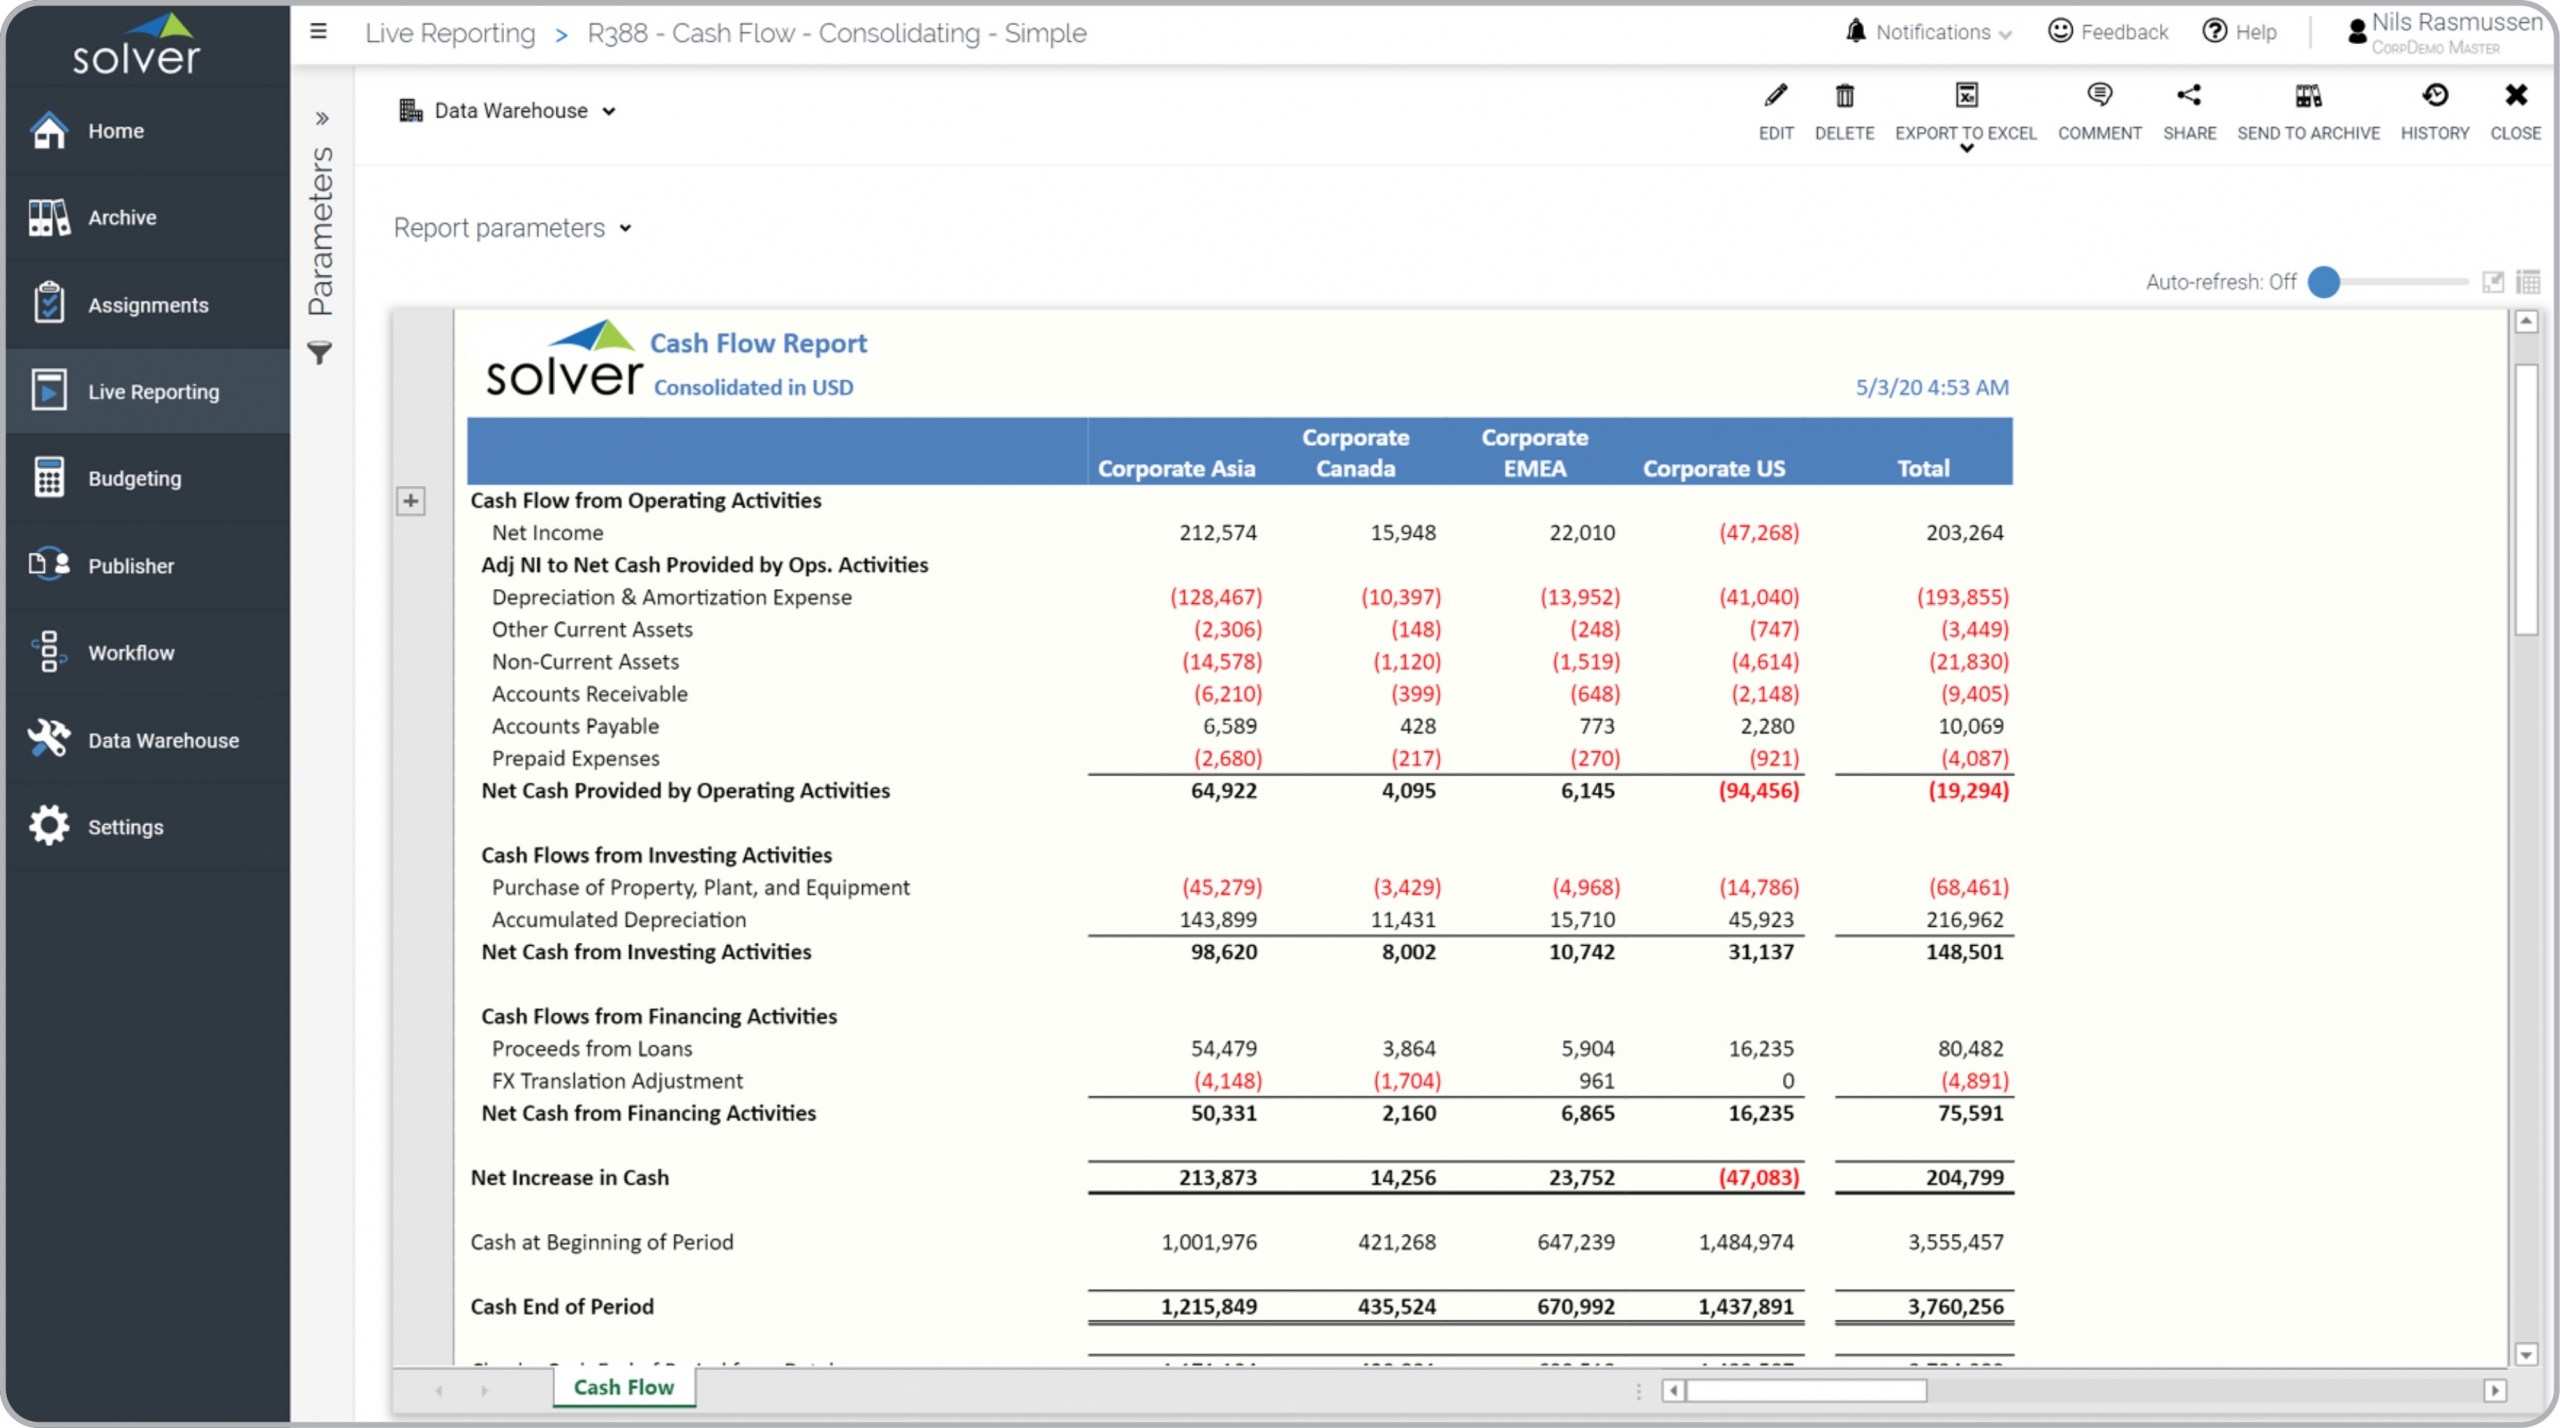
Cash Flow – Consolidating
Cash flow report with companies across columns.
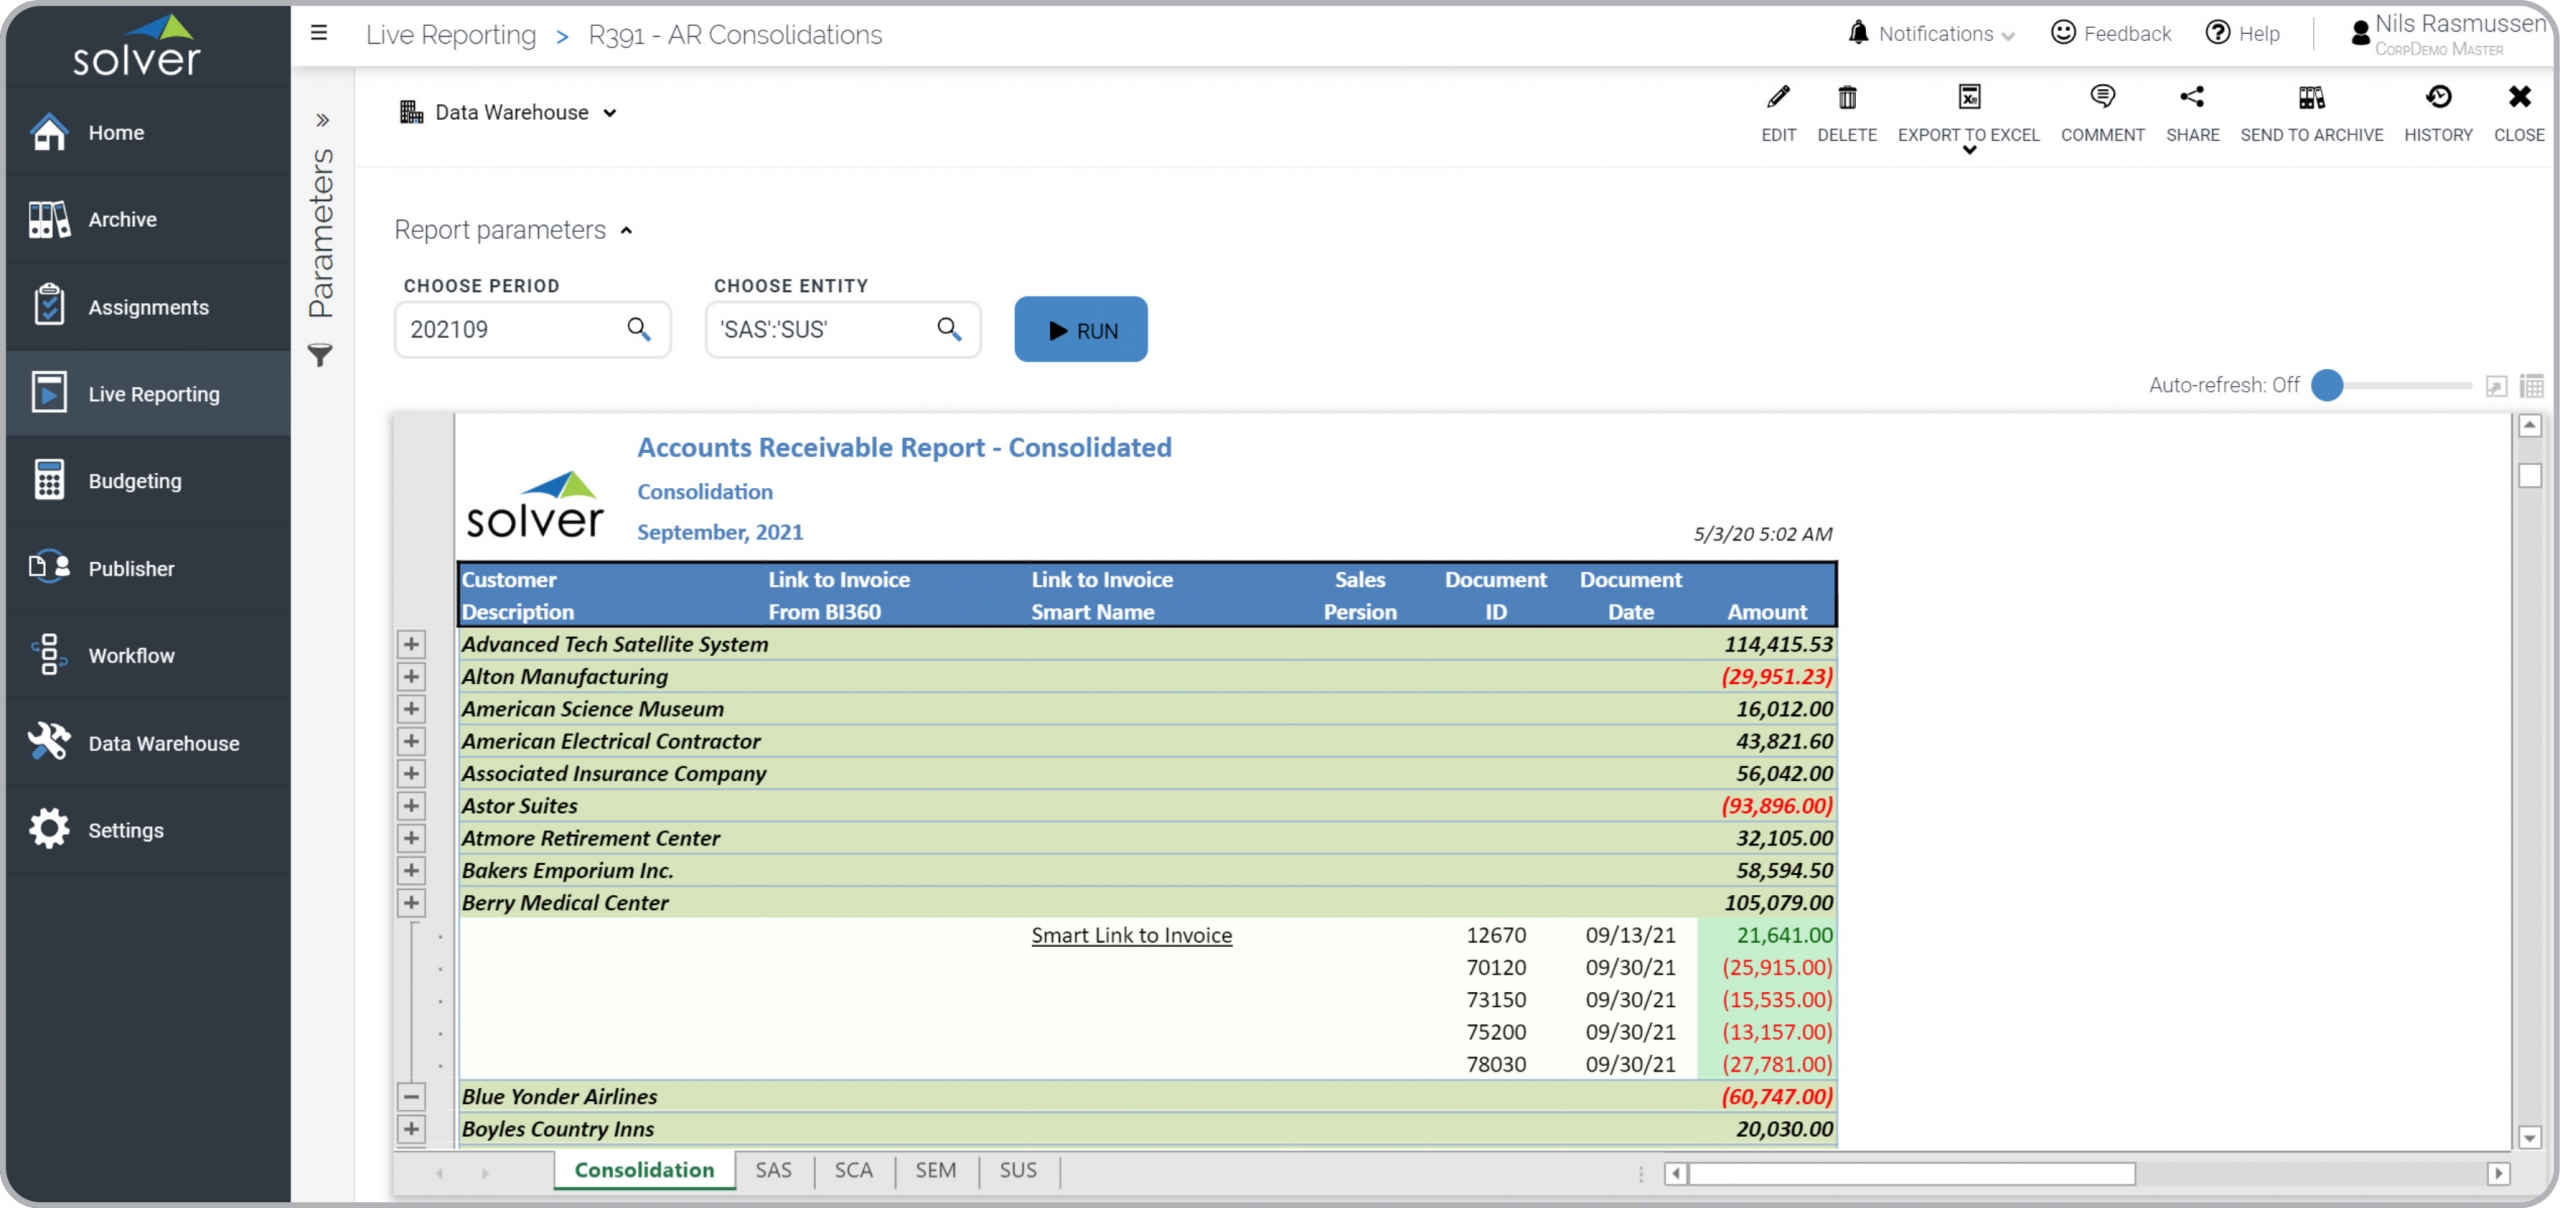
AR – Consolidated Receivables
Consolidates AR transactions to view customer receivables across all companies.
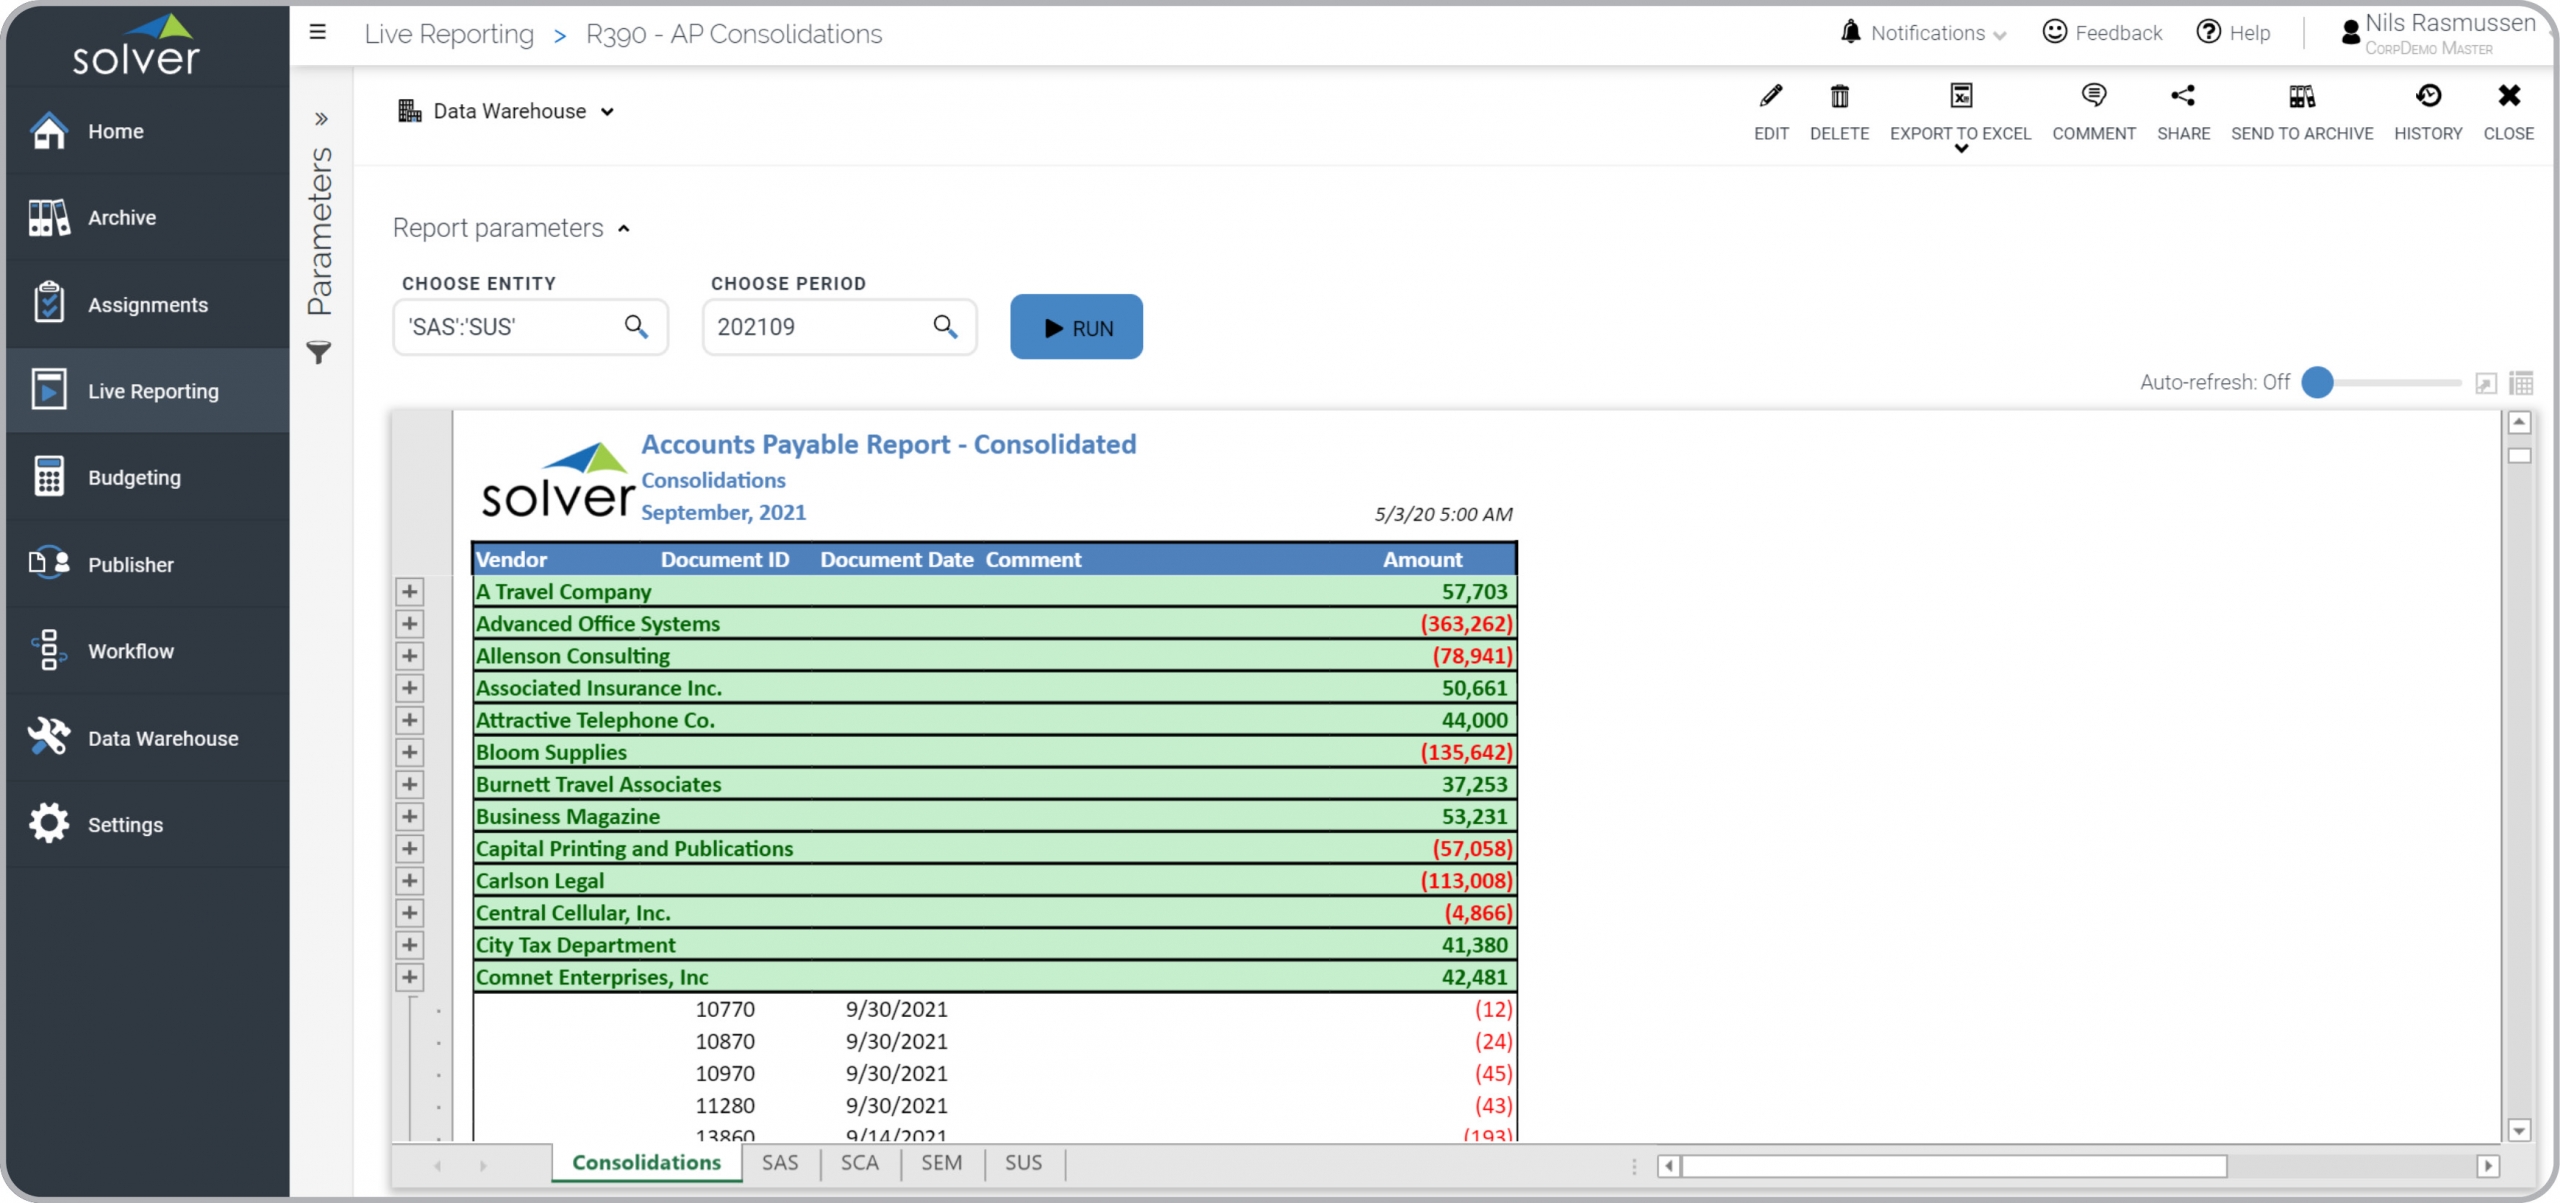
AP – Consolidated Payables
Consolidates Accounts Payables transactions to view vendor payments across all companies.
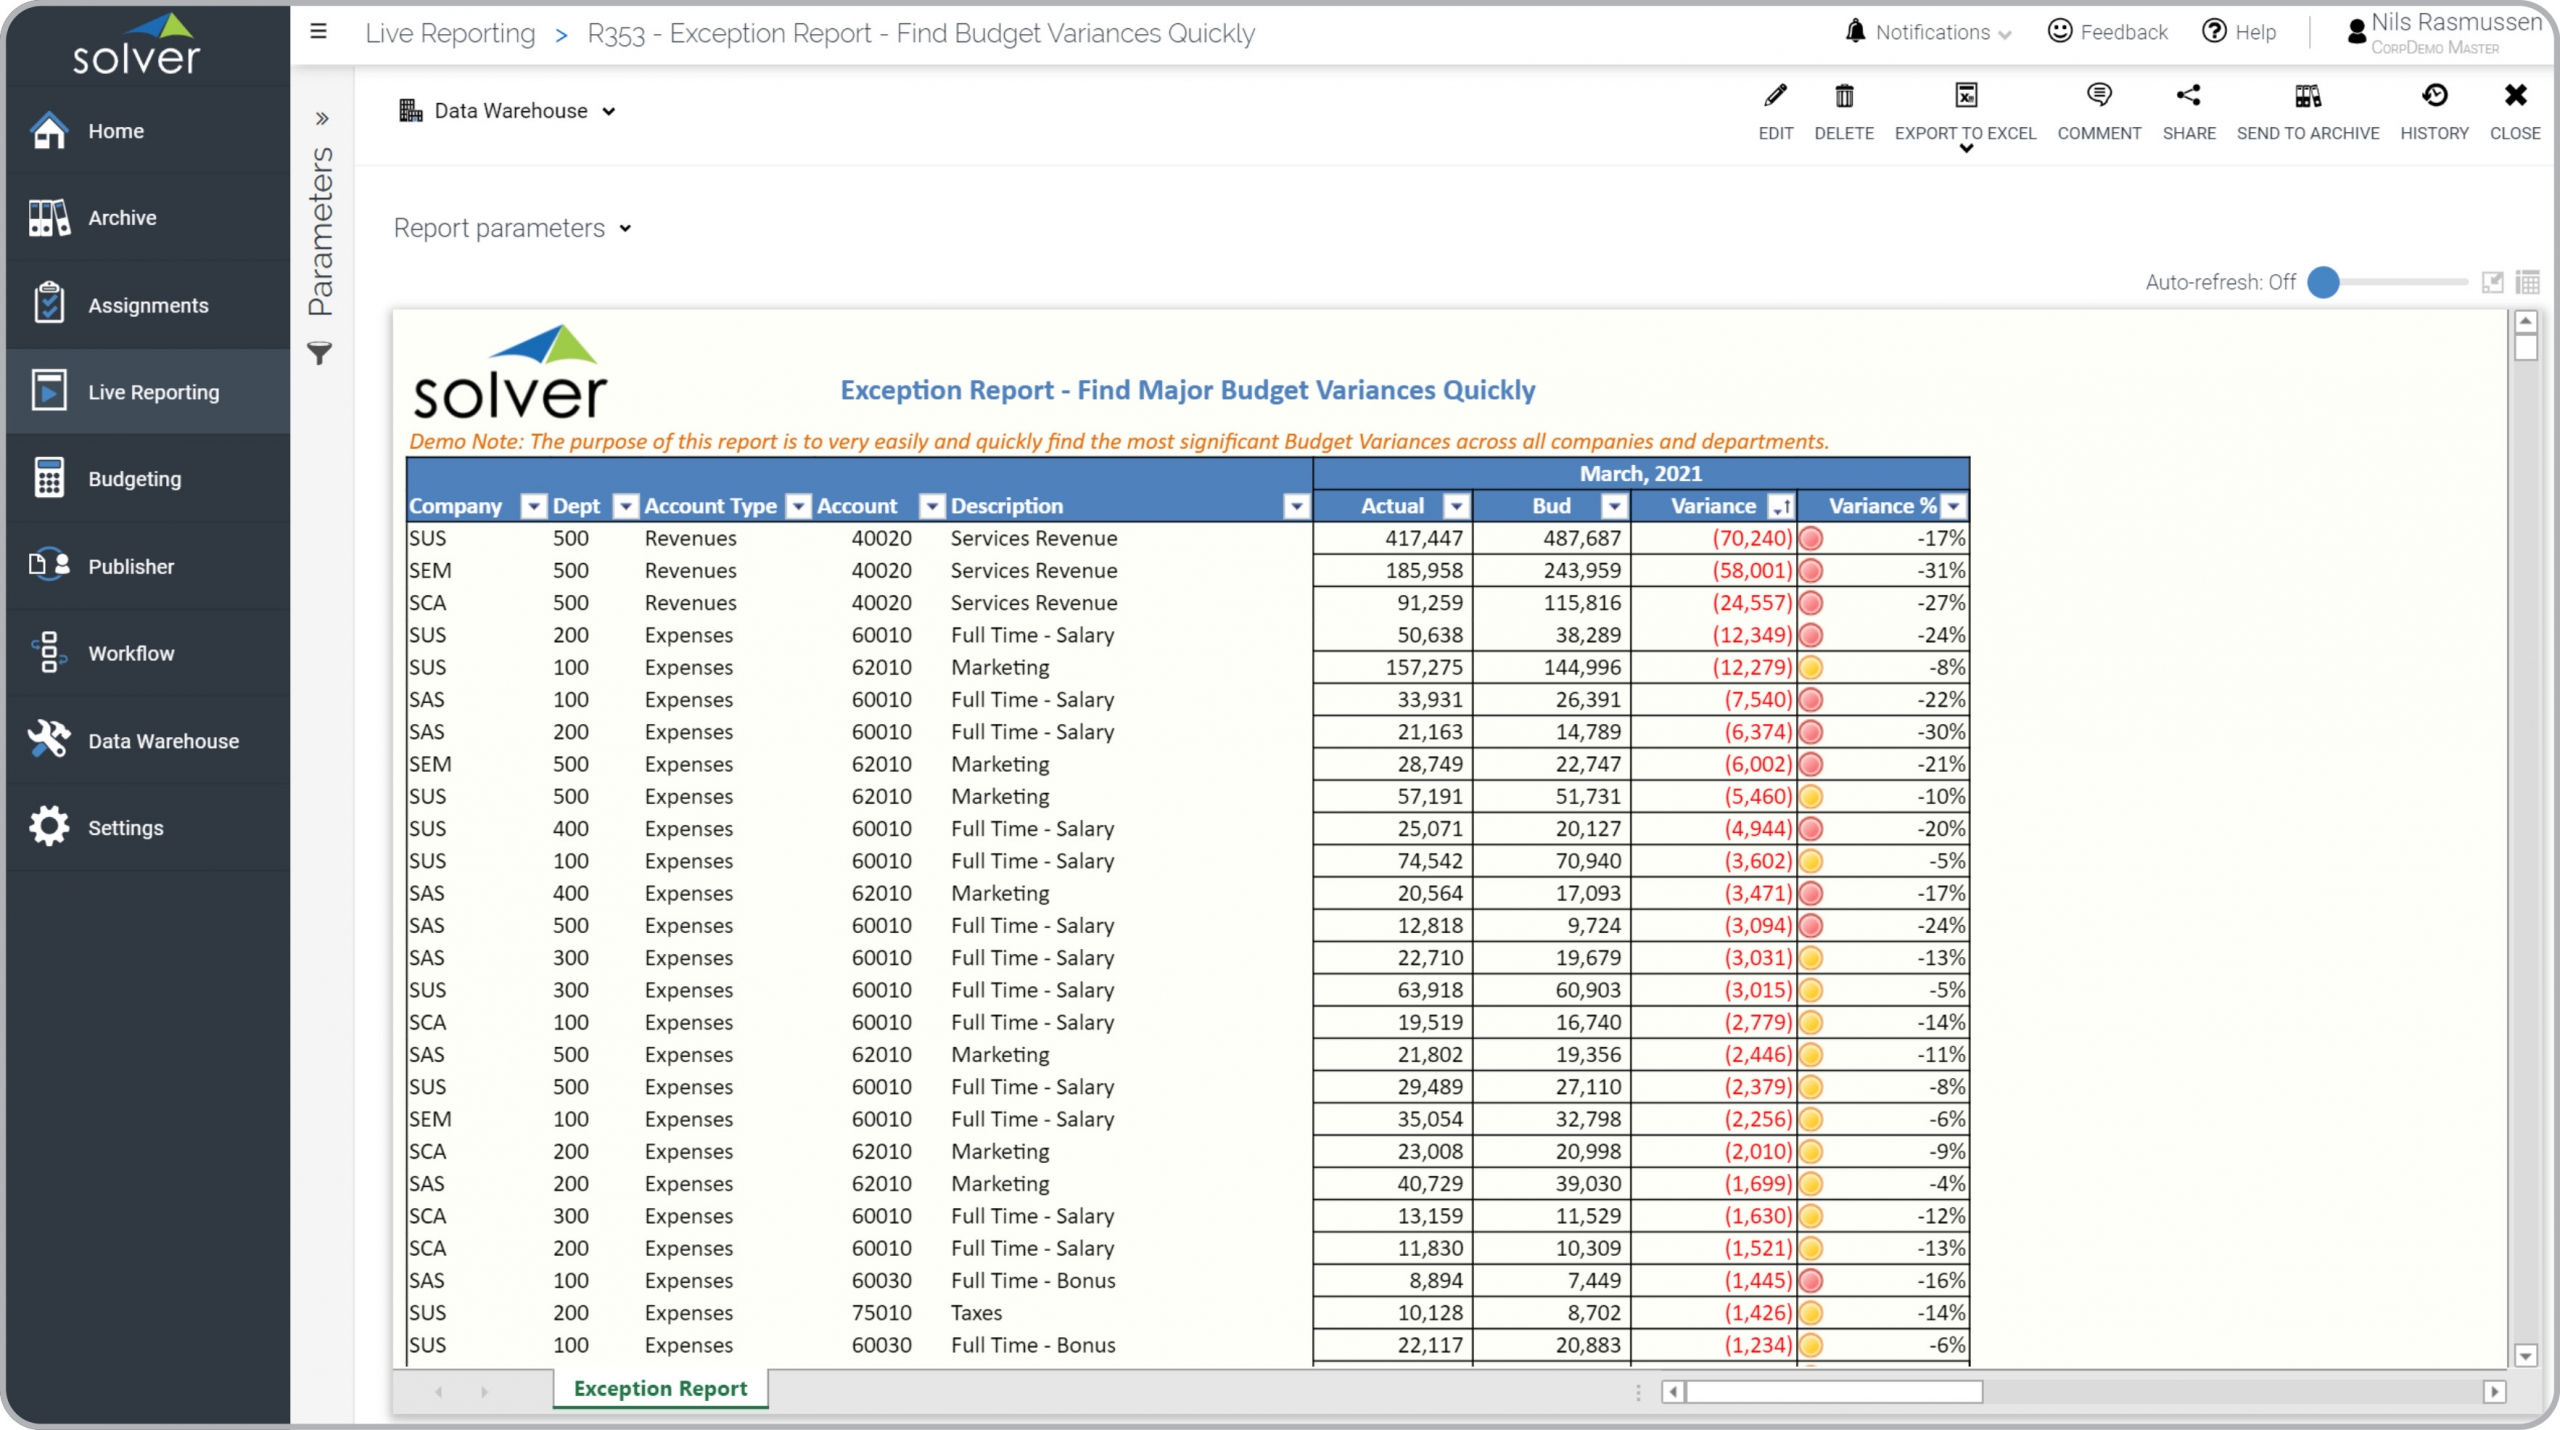
Revenue and Expense Exception Report
Displays balances across selected companies with column sorting to find highest variances.
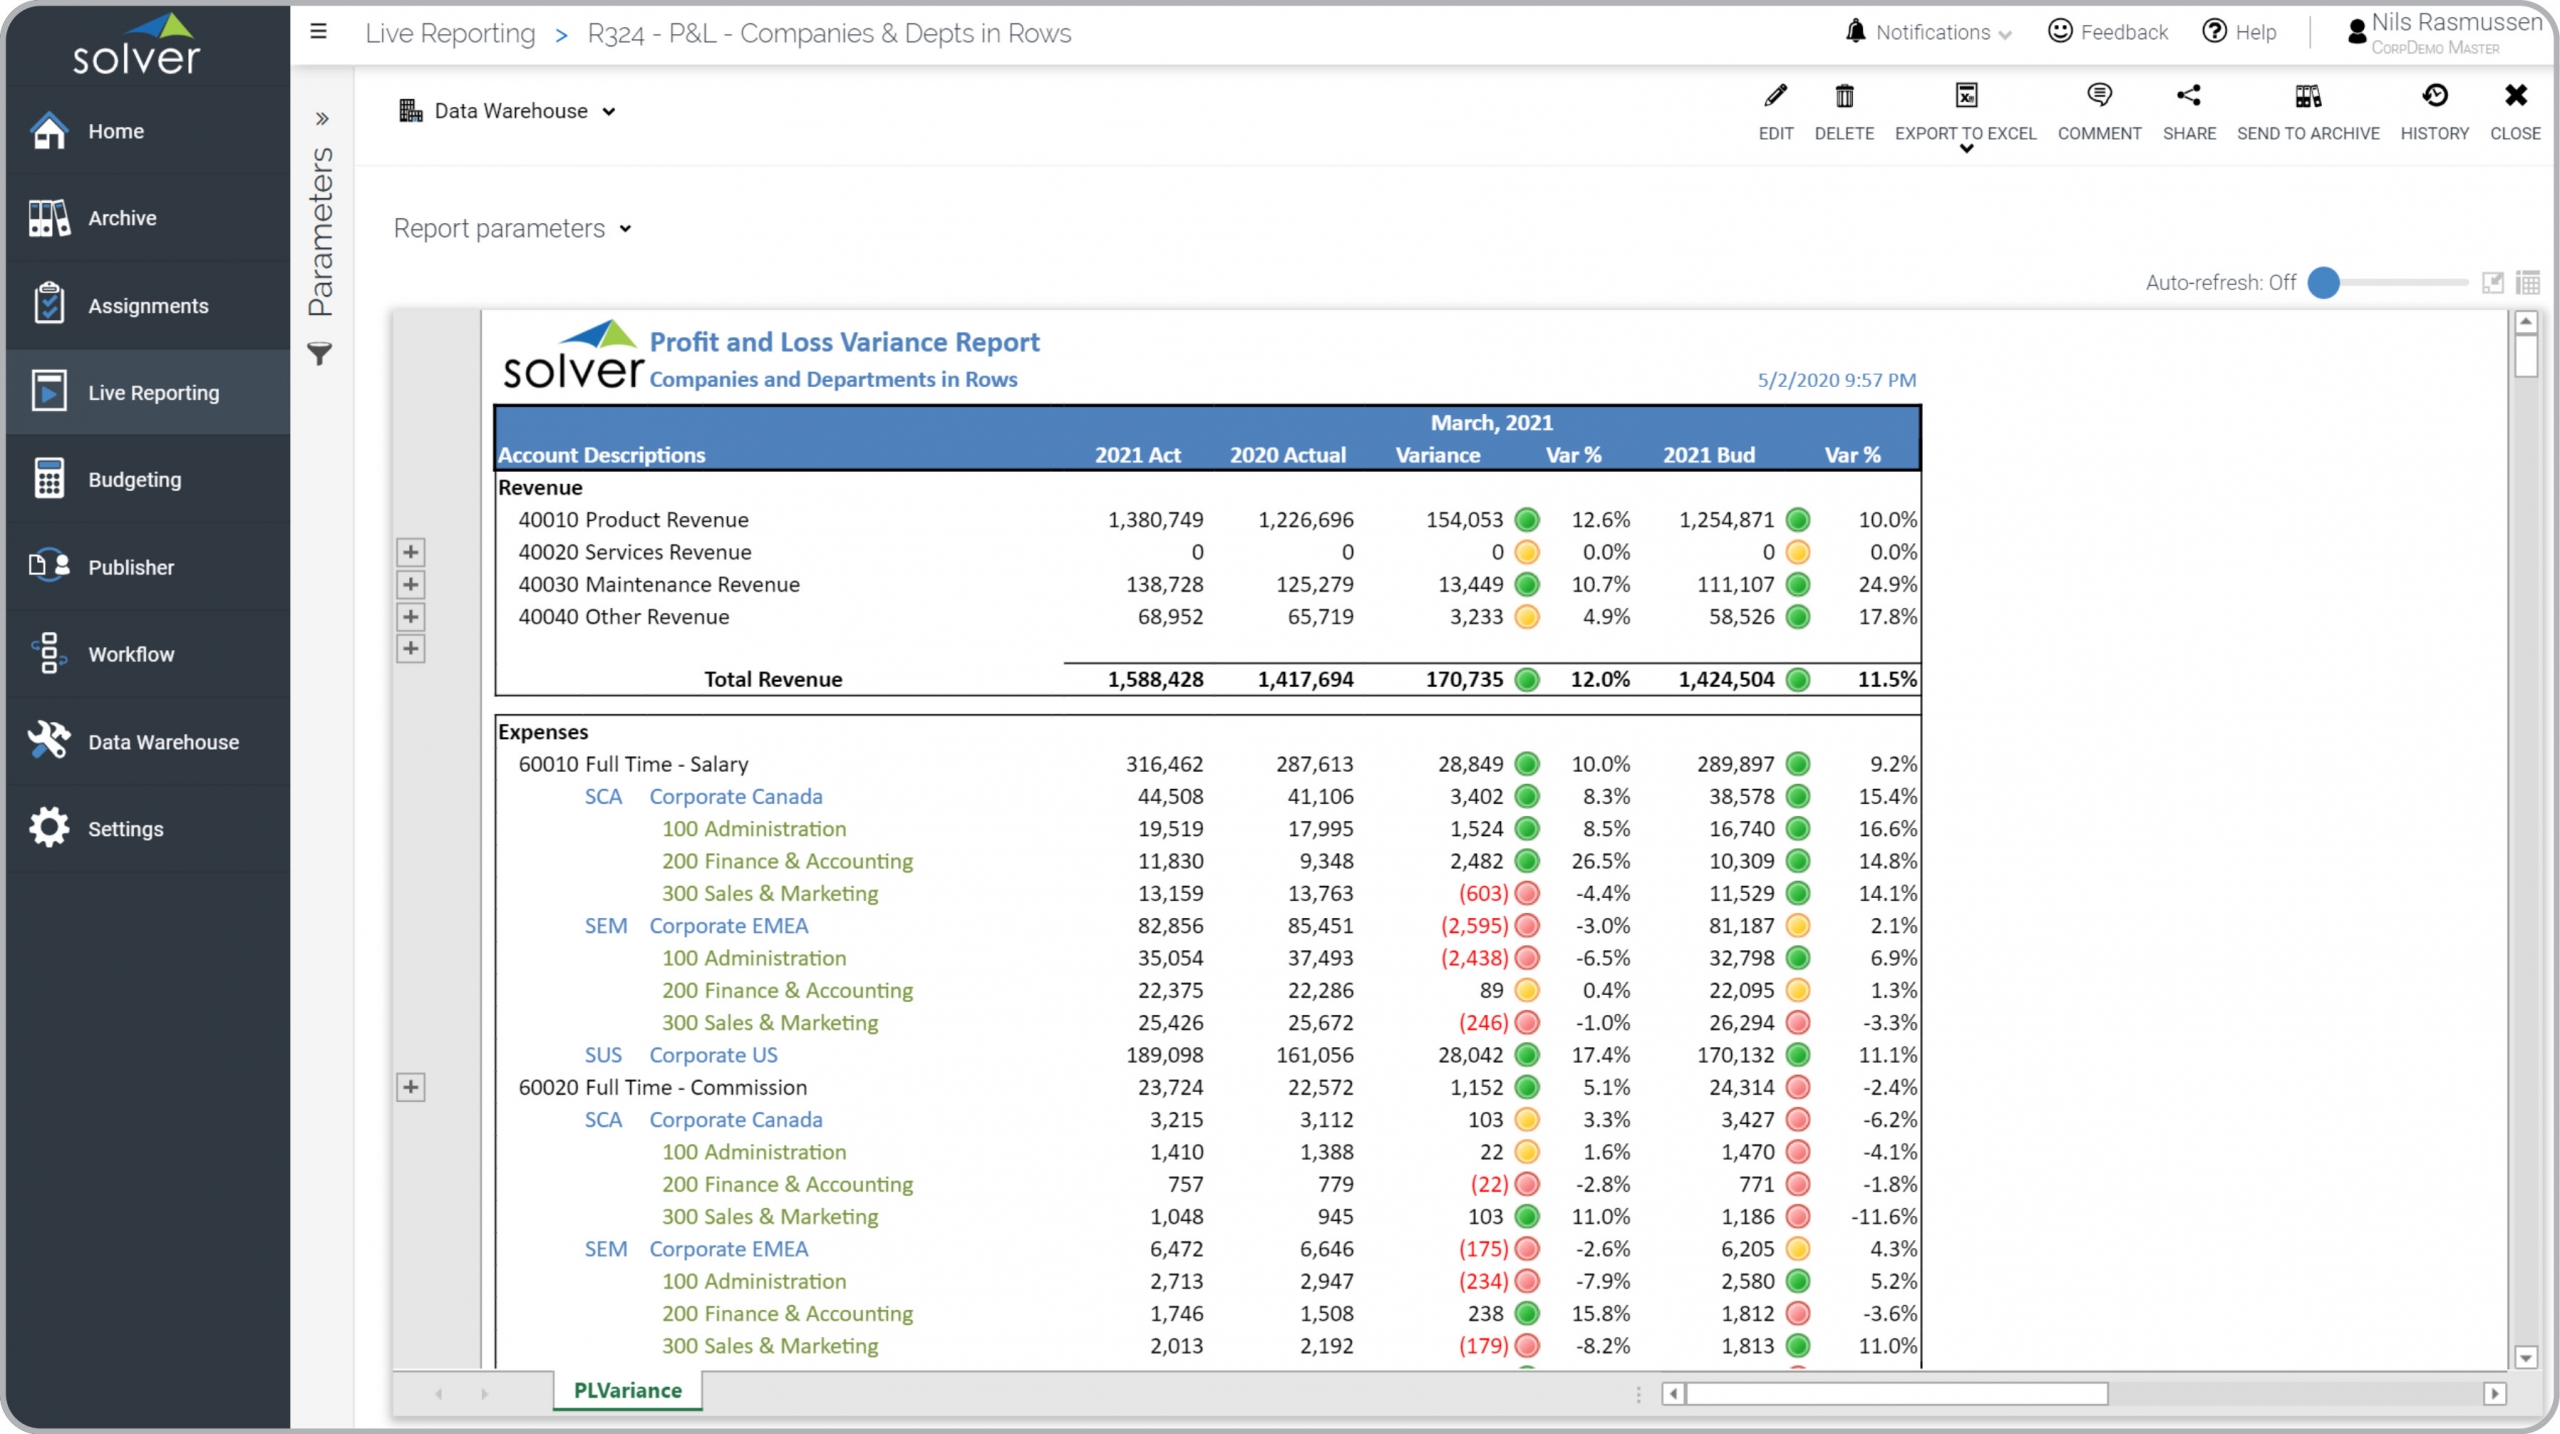
P&L with Entities in Rows
P&L with rows that breaks down each GL account by subsidiary and department.
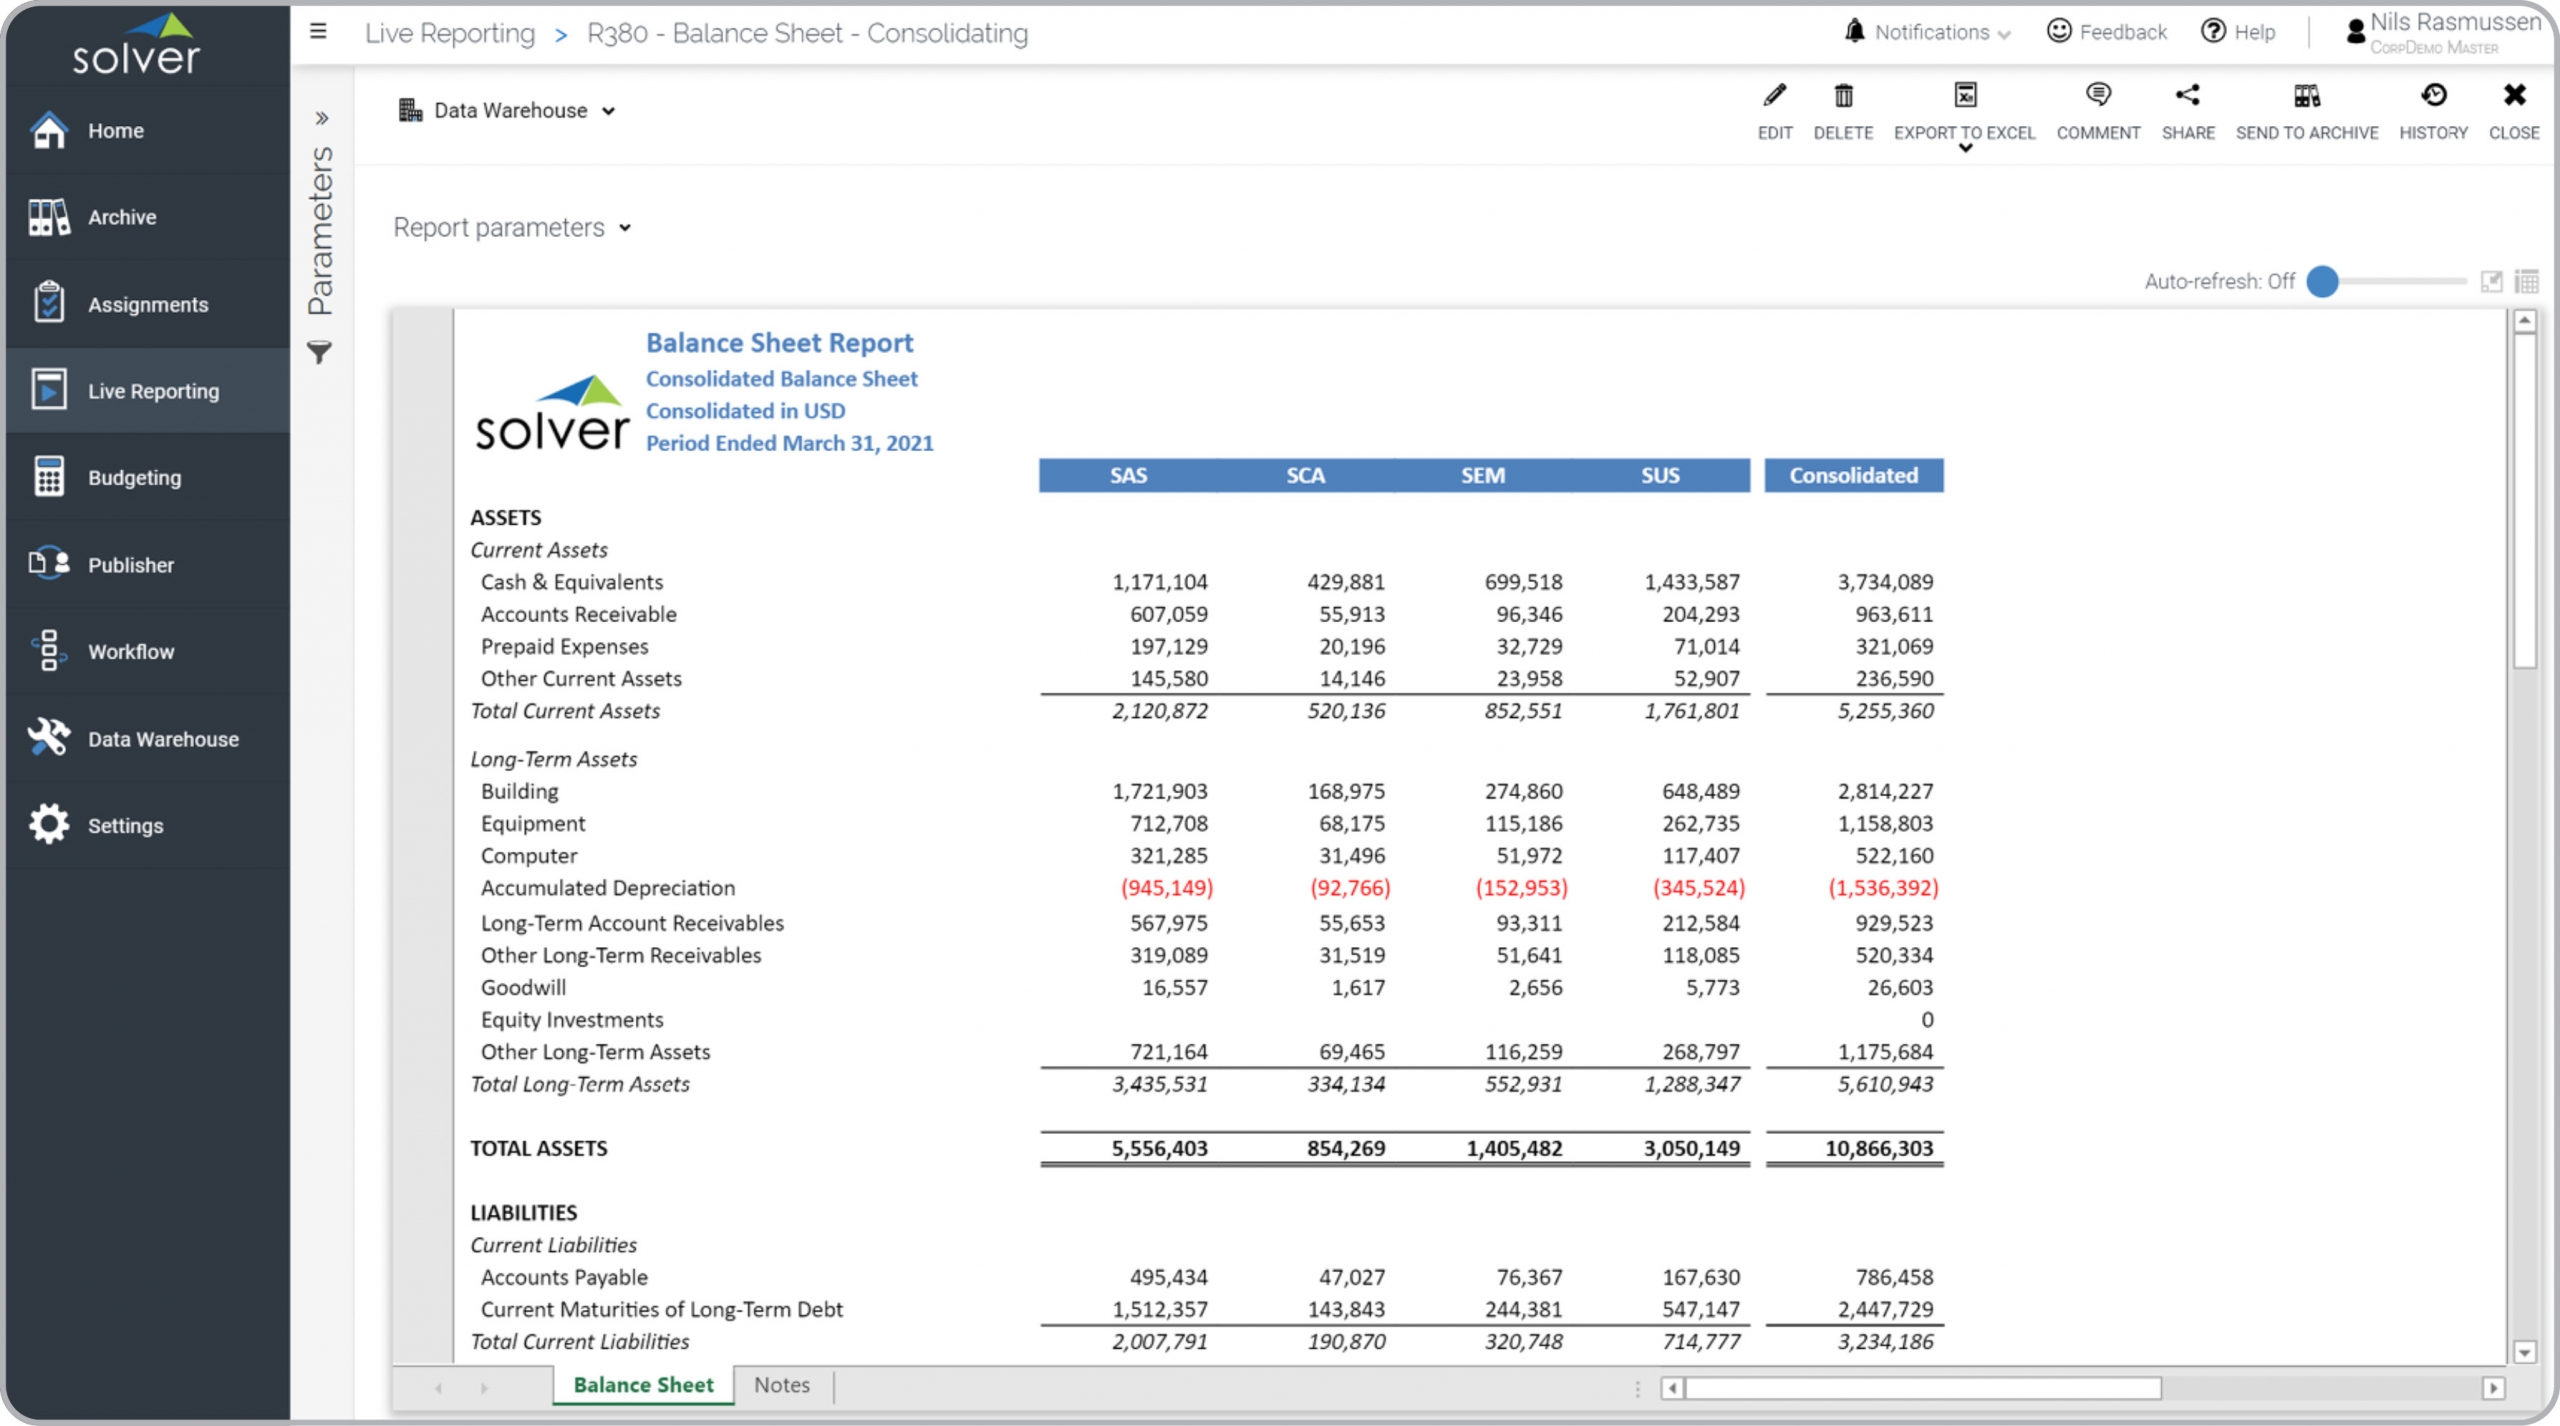
Balance Sheet – Consolidating
Balance sheet with companies across columns.
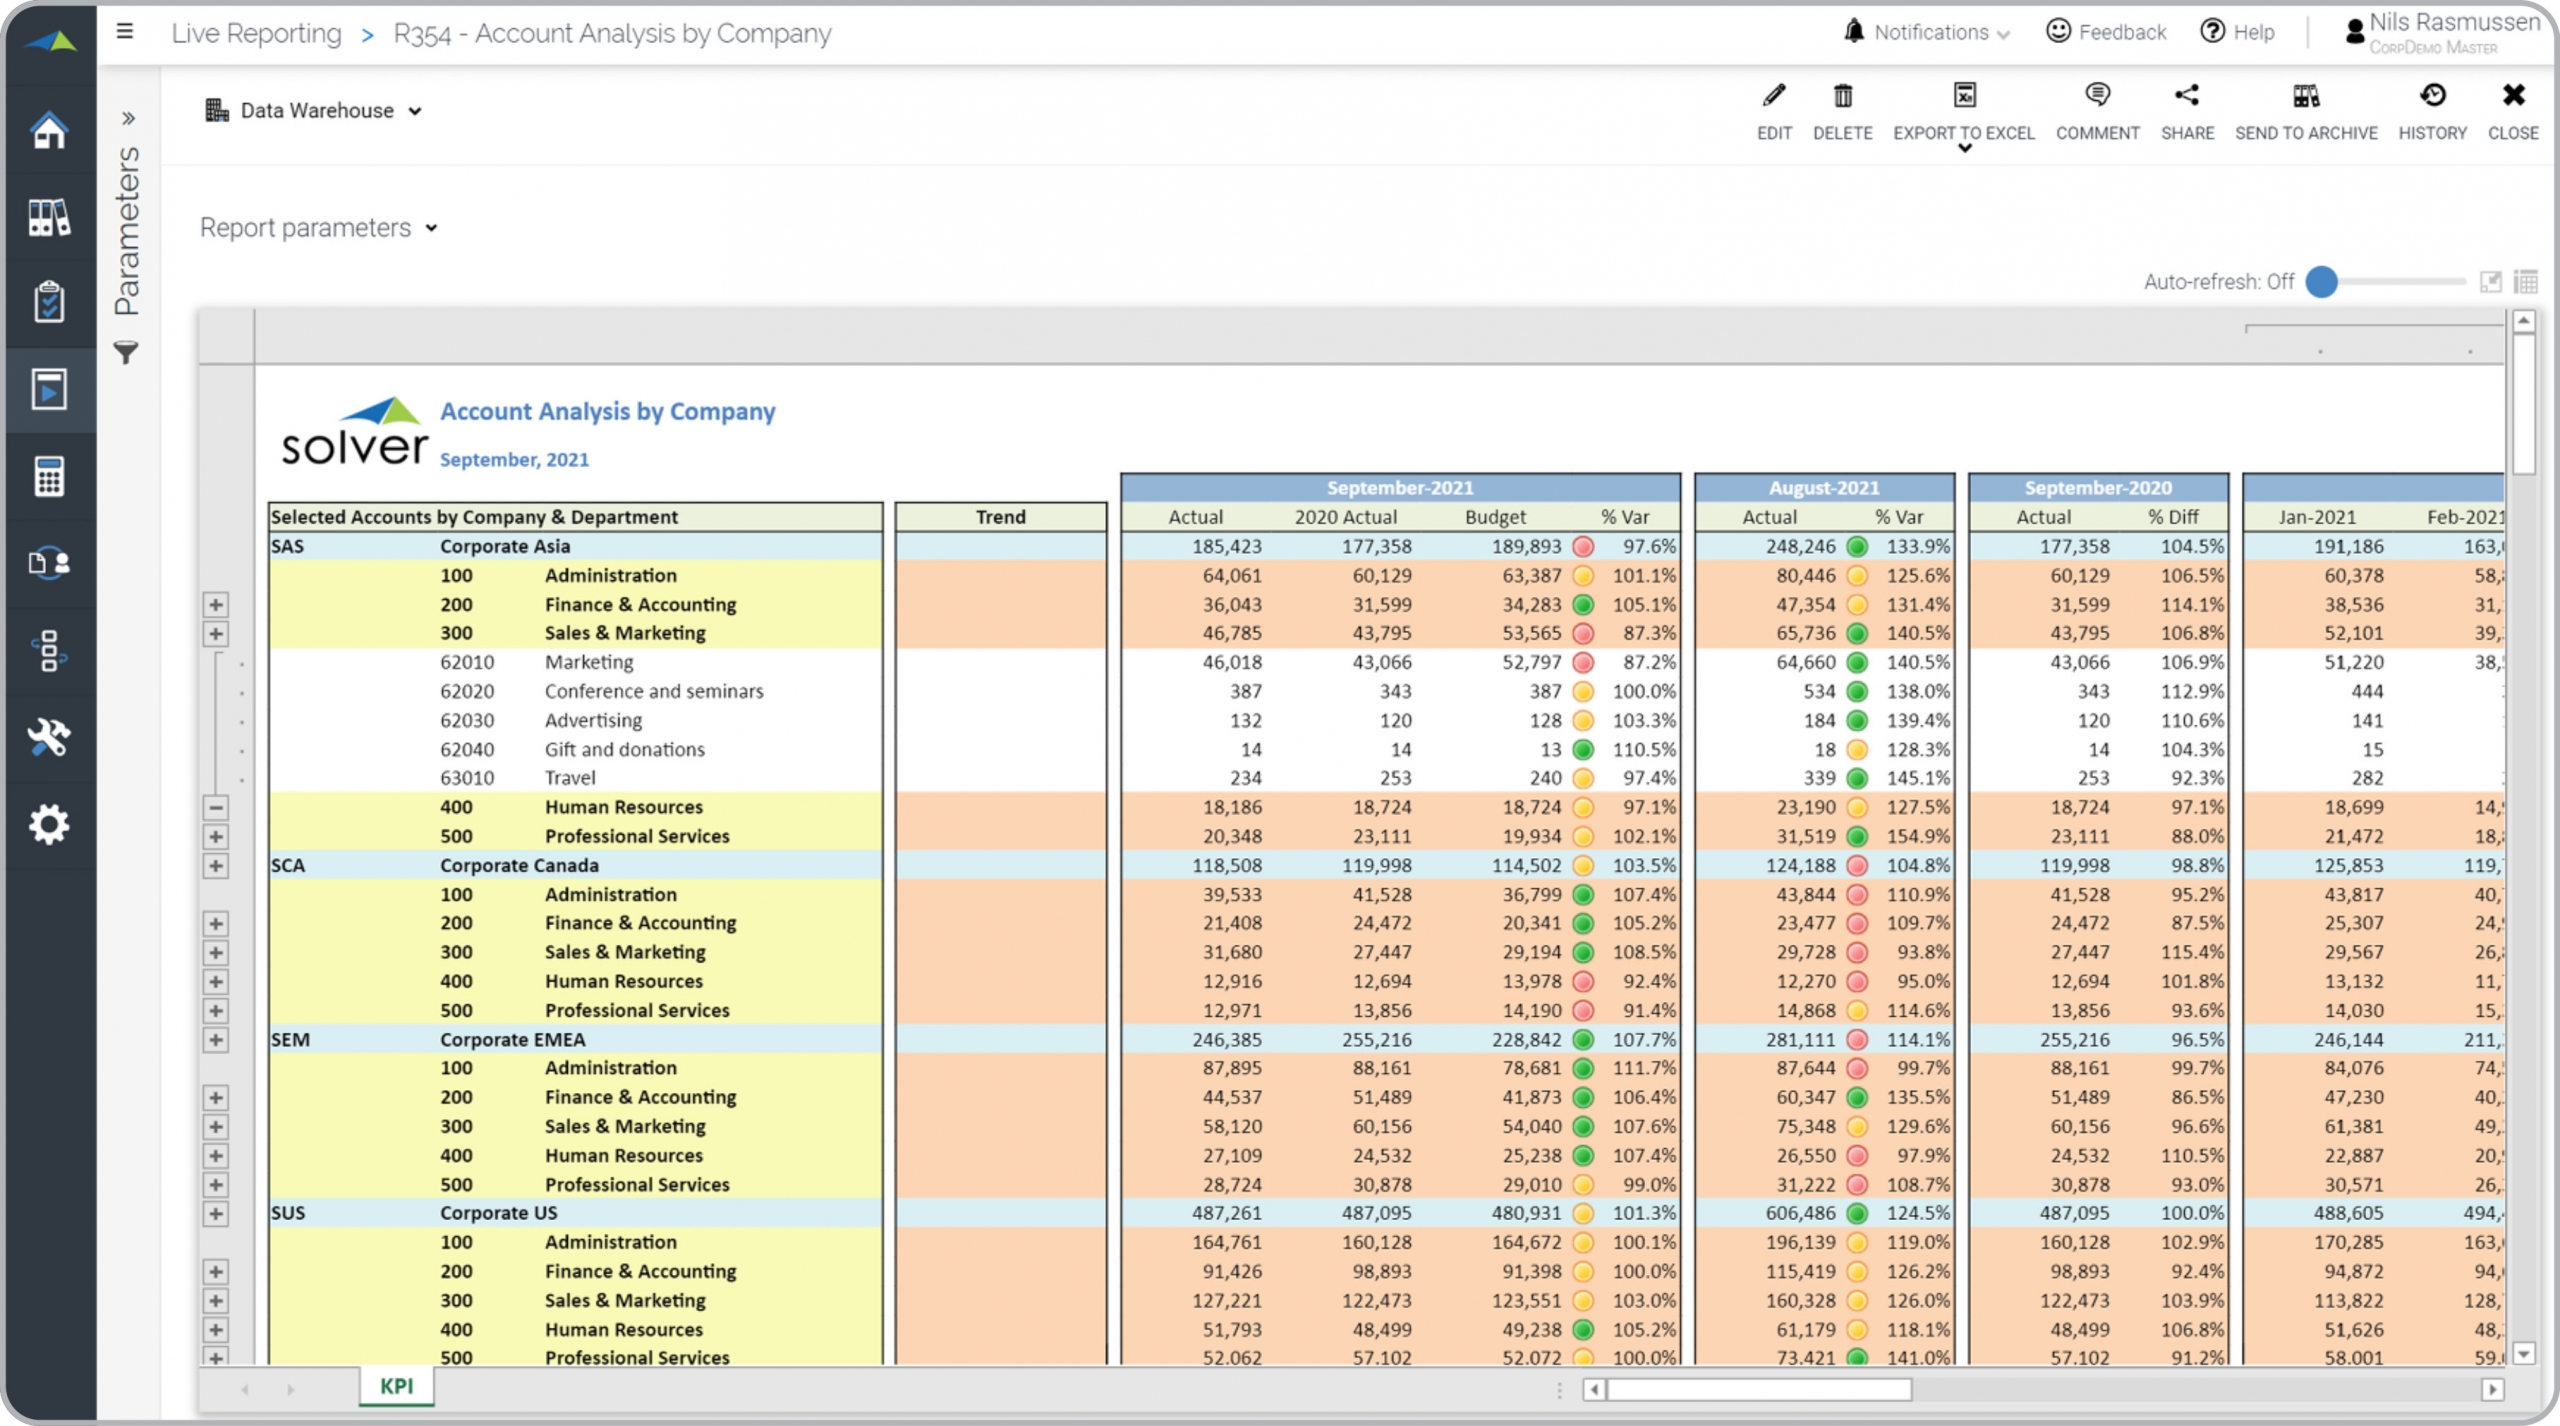
Multi-company Account Analysis
Displays each subsidiary with its departments and user-selected accounts and variances.

P&L Consolidated Variance Report
Monthly variance report with parent company on the first tab and subs on the other tabs.
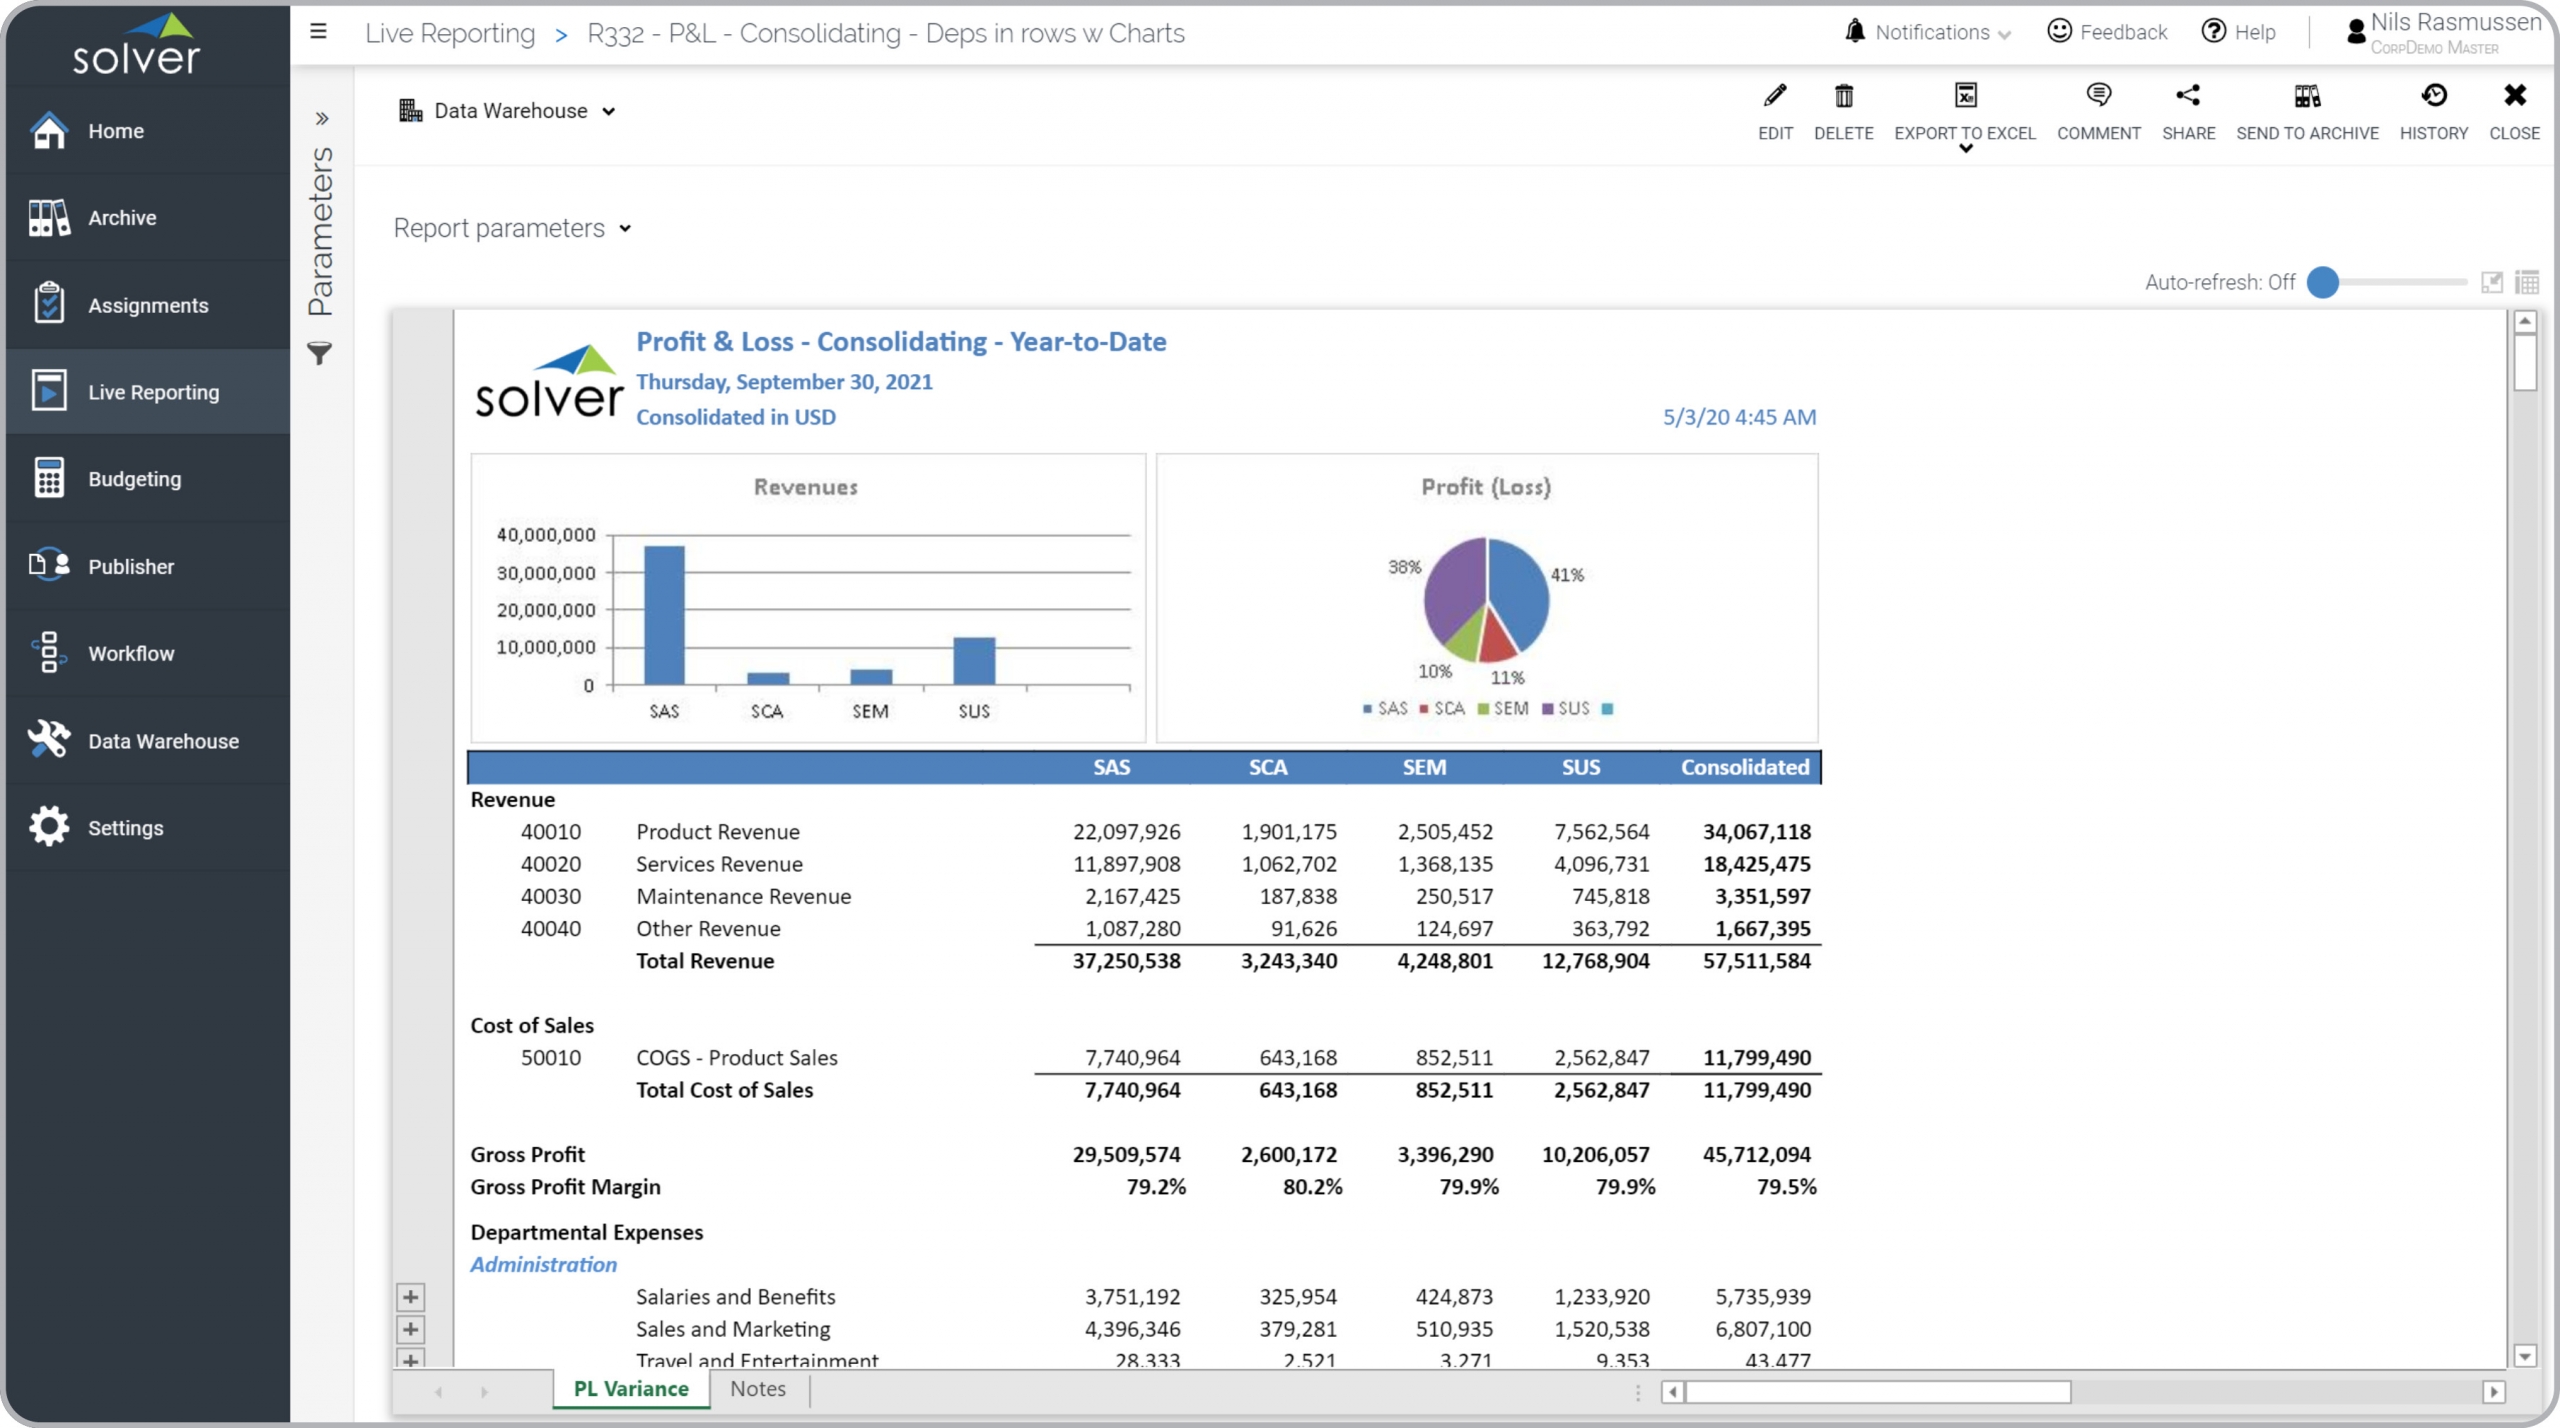
P&L Consolidating YTD Report
Shows companies across columns and displays year-to-date figures.
P&L Consolidated Variance Report
The report automatically displays parent company on the first tab and subs on the other tabs.
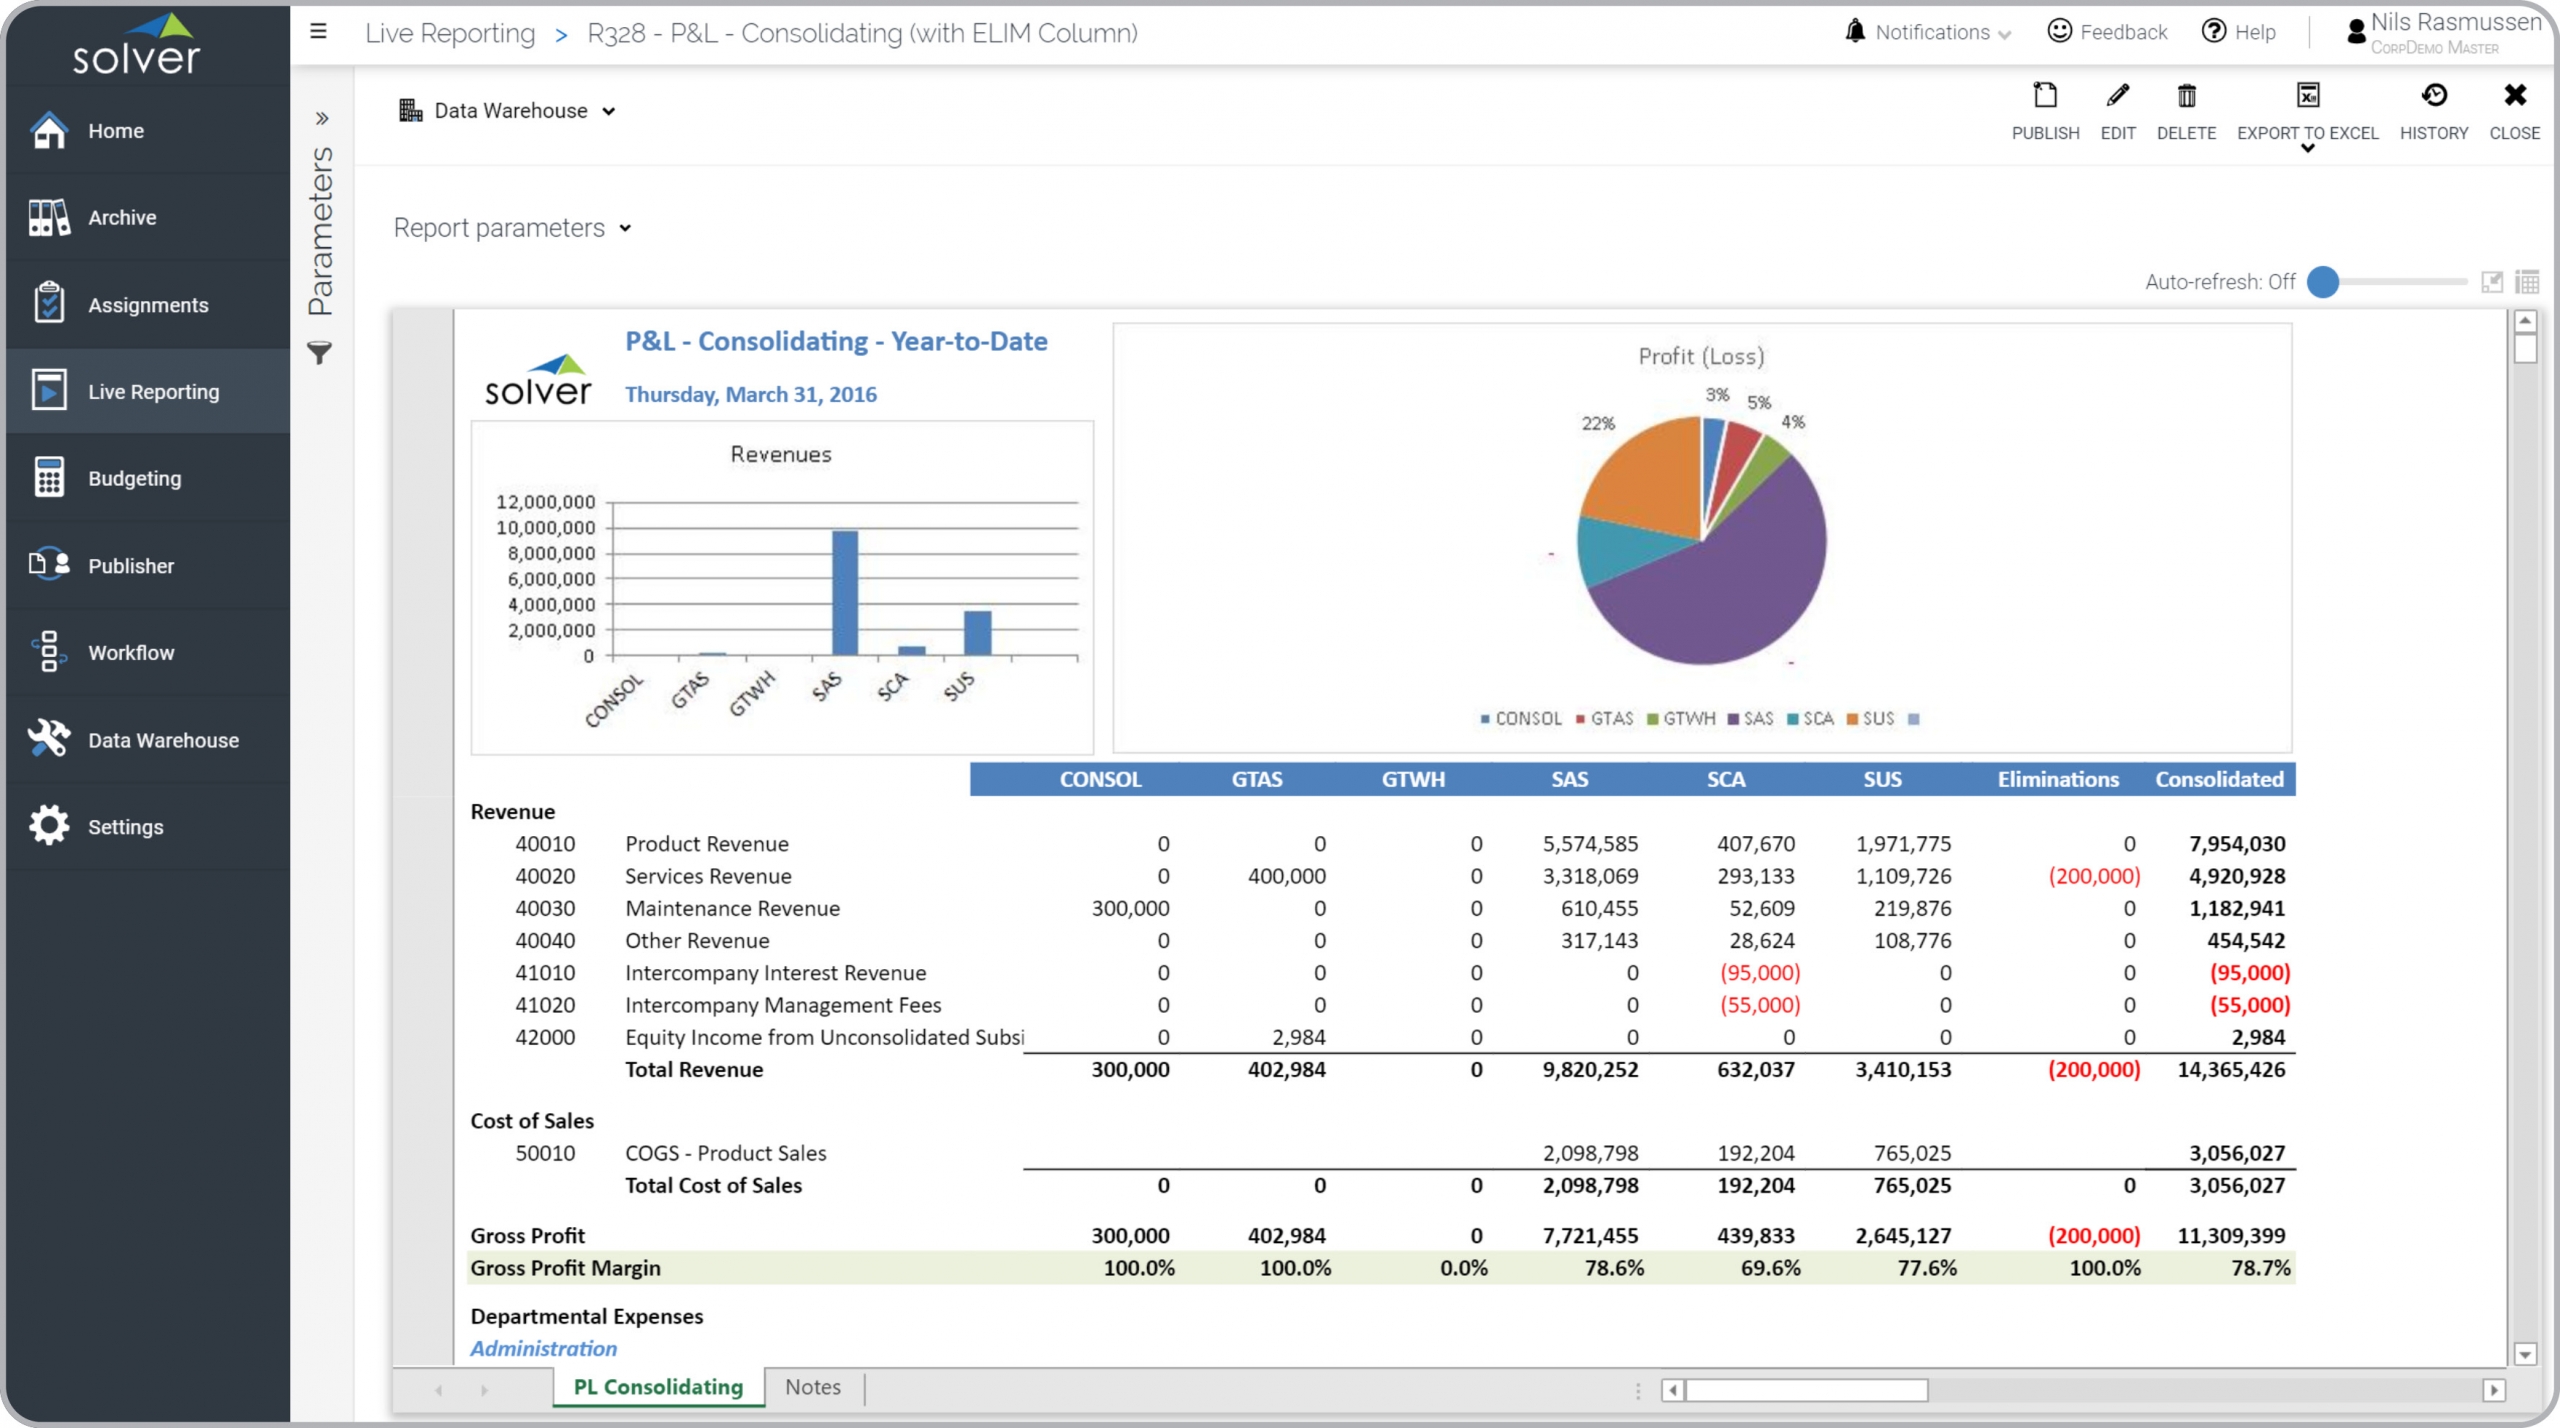
P&L Consolidating Report
Displays companies across columns with eliminations.
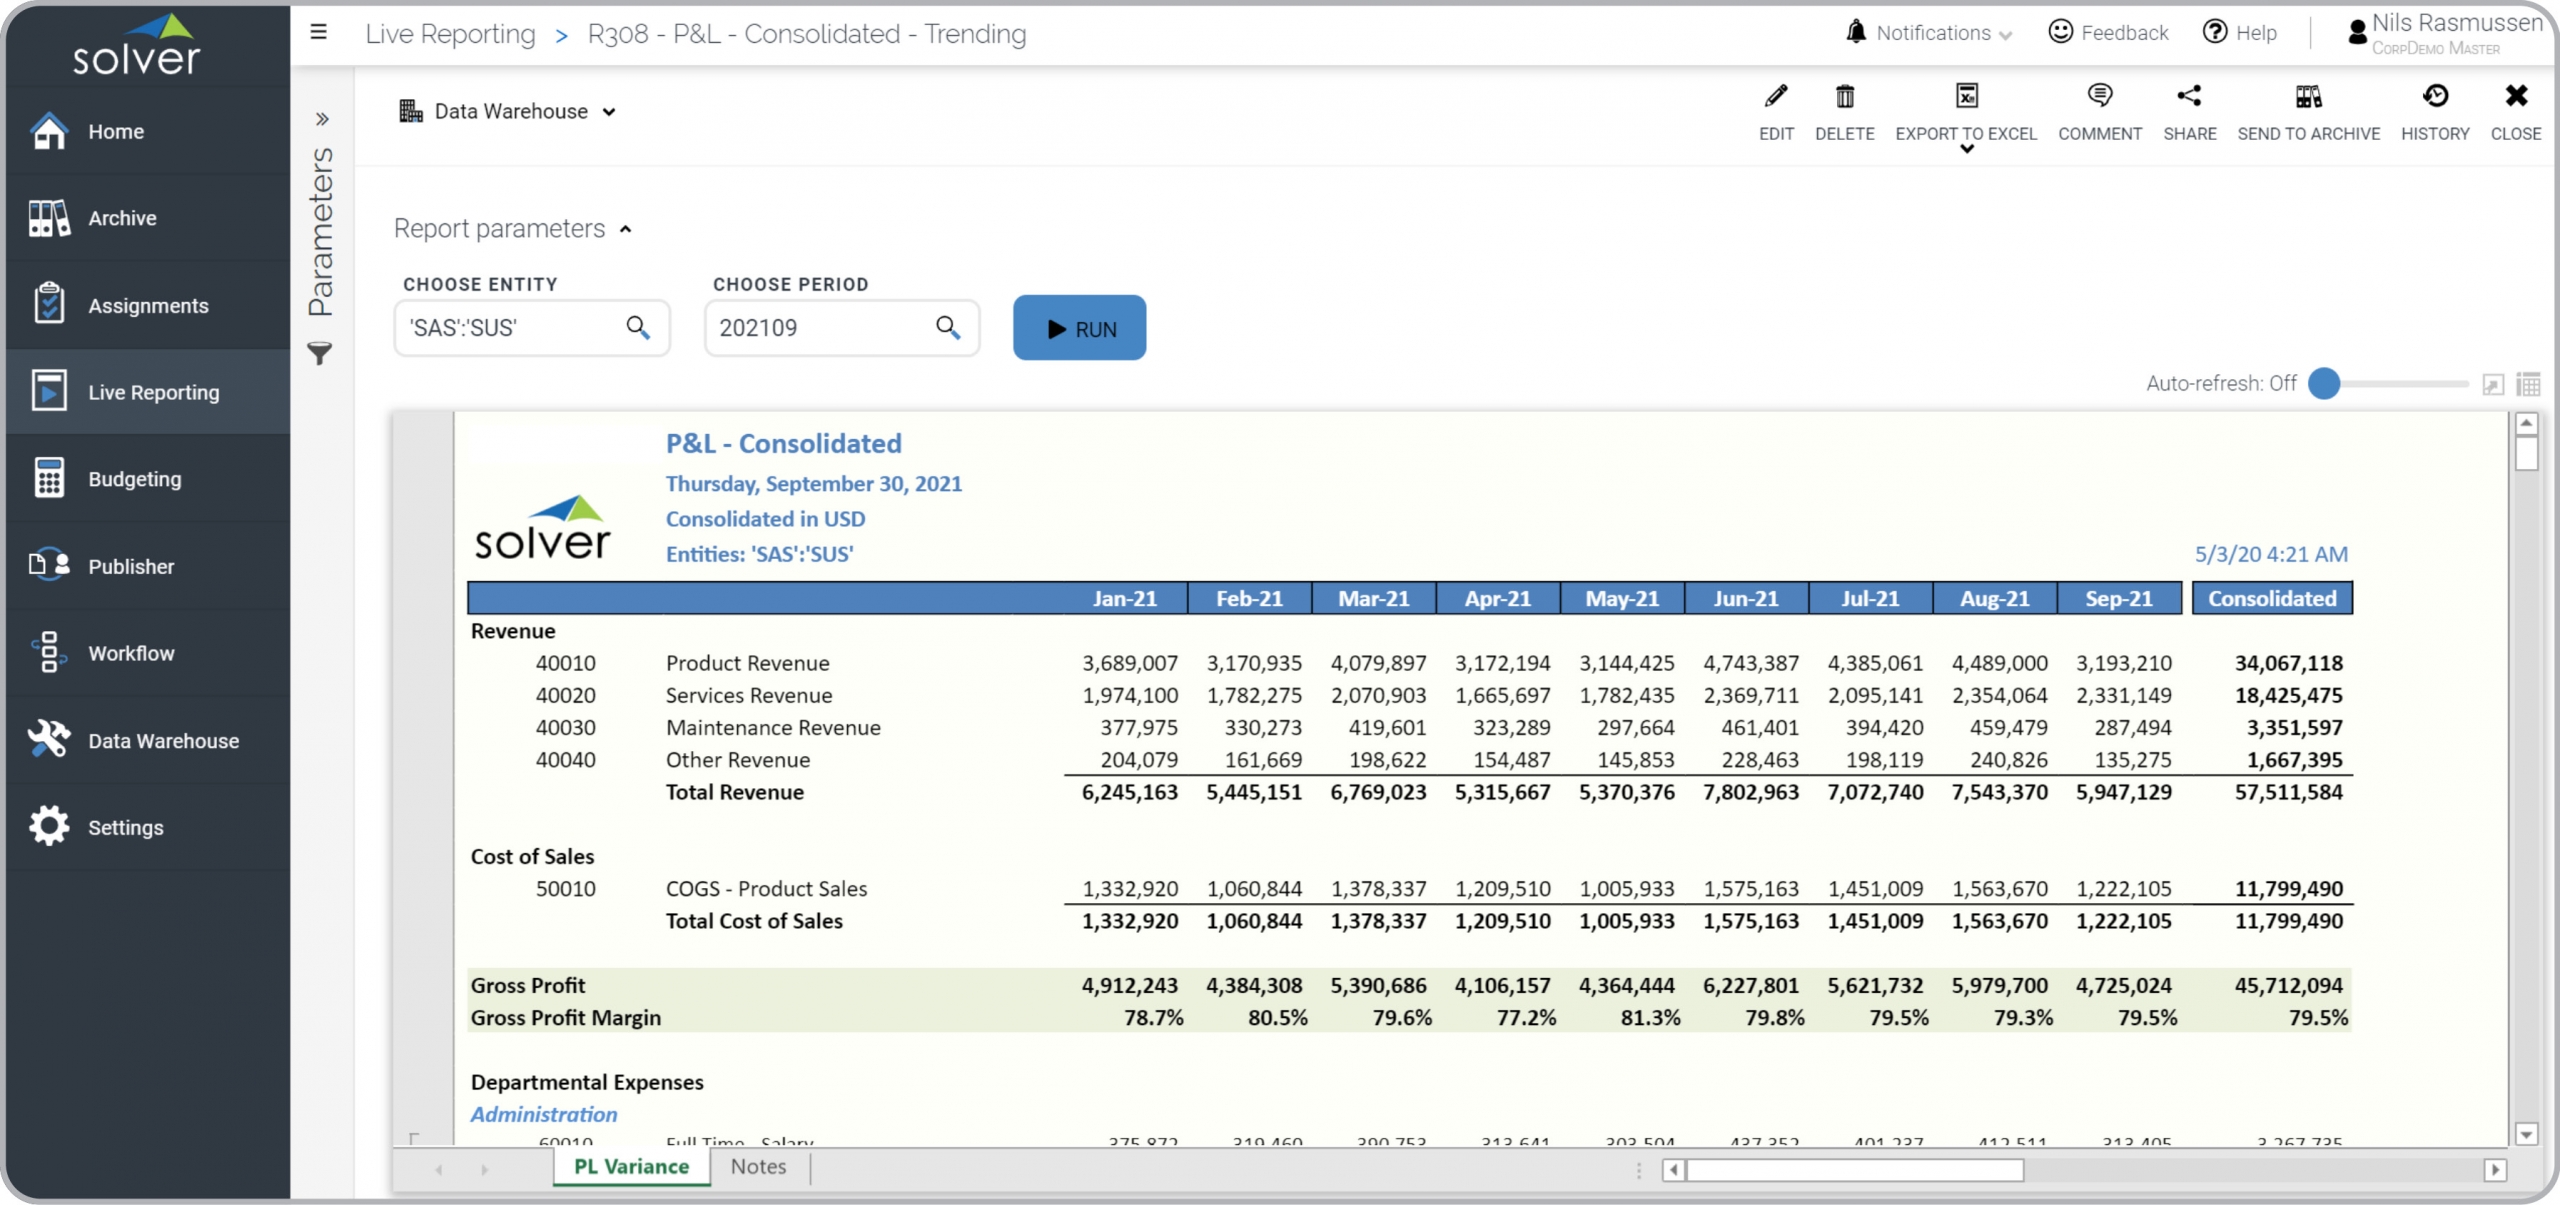
P&L Consolidated Trending
P&L report for any company and consolidated entity, with months year-to-date across.
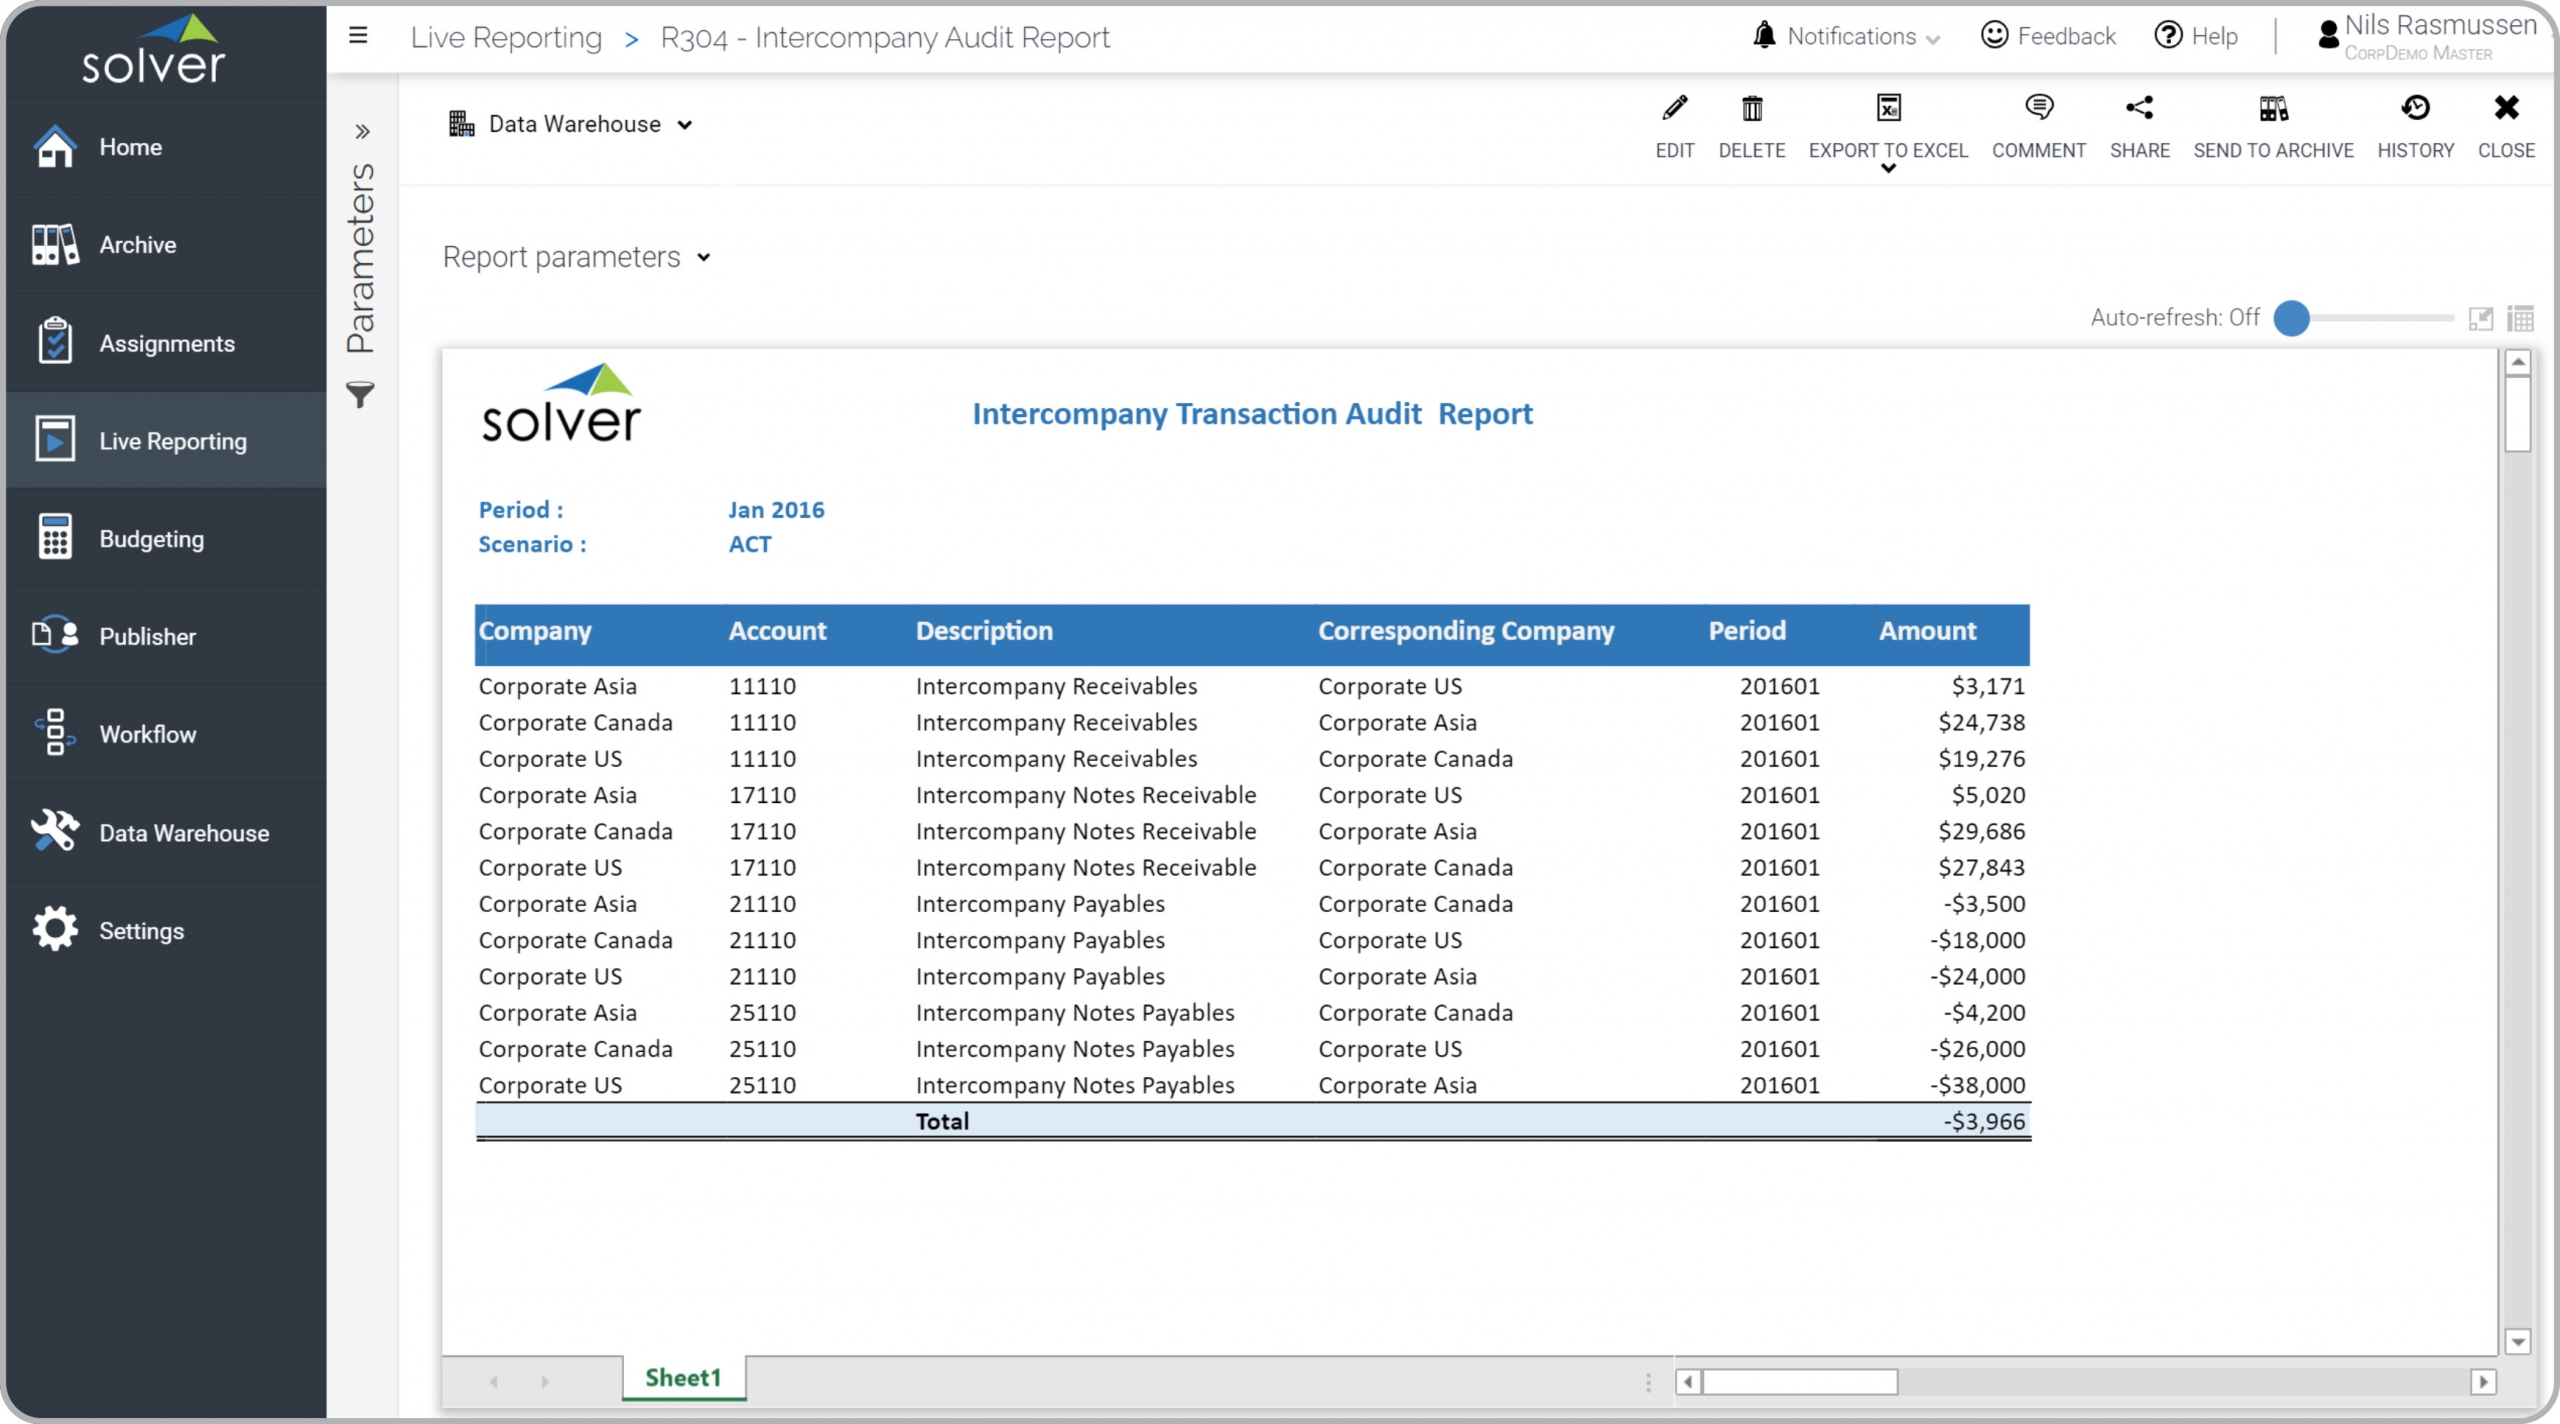
Intercompany Audit Report
Displays all intercompany transactions for a given period.
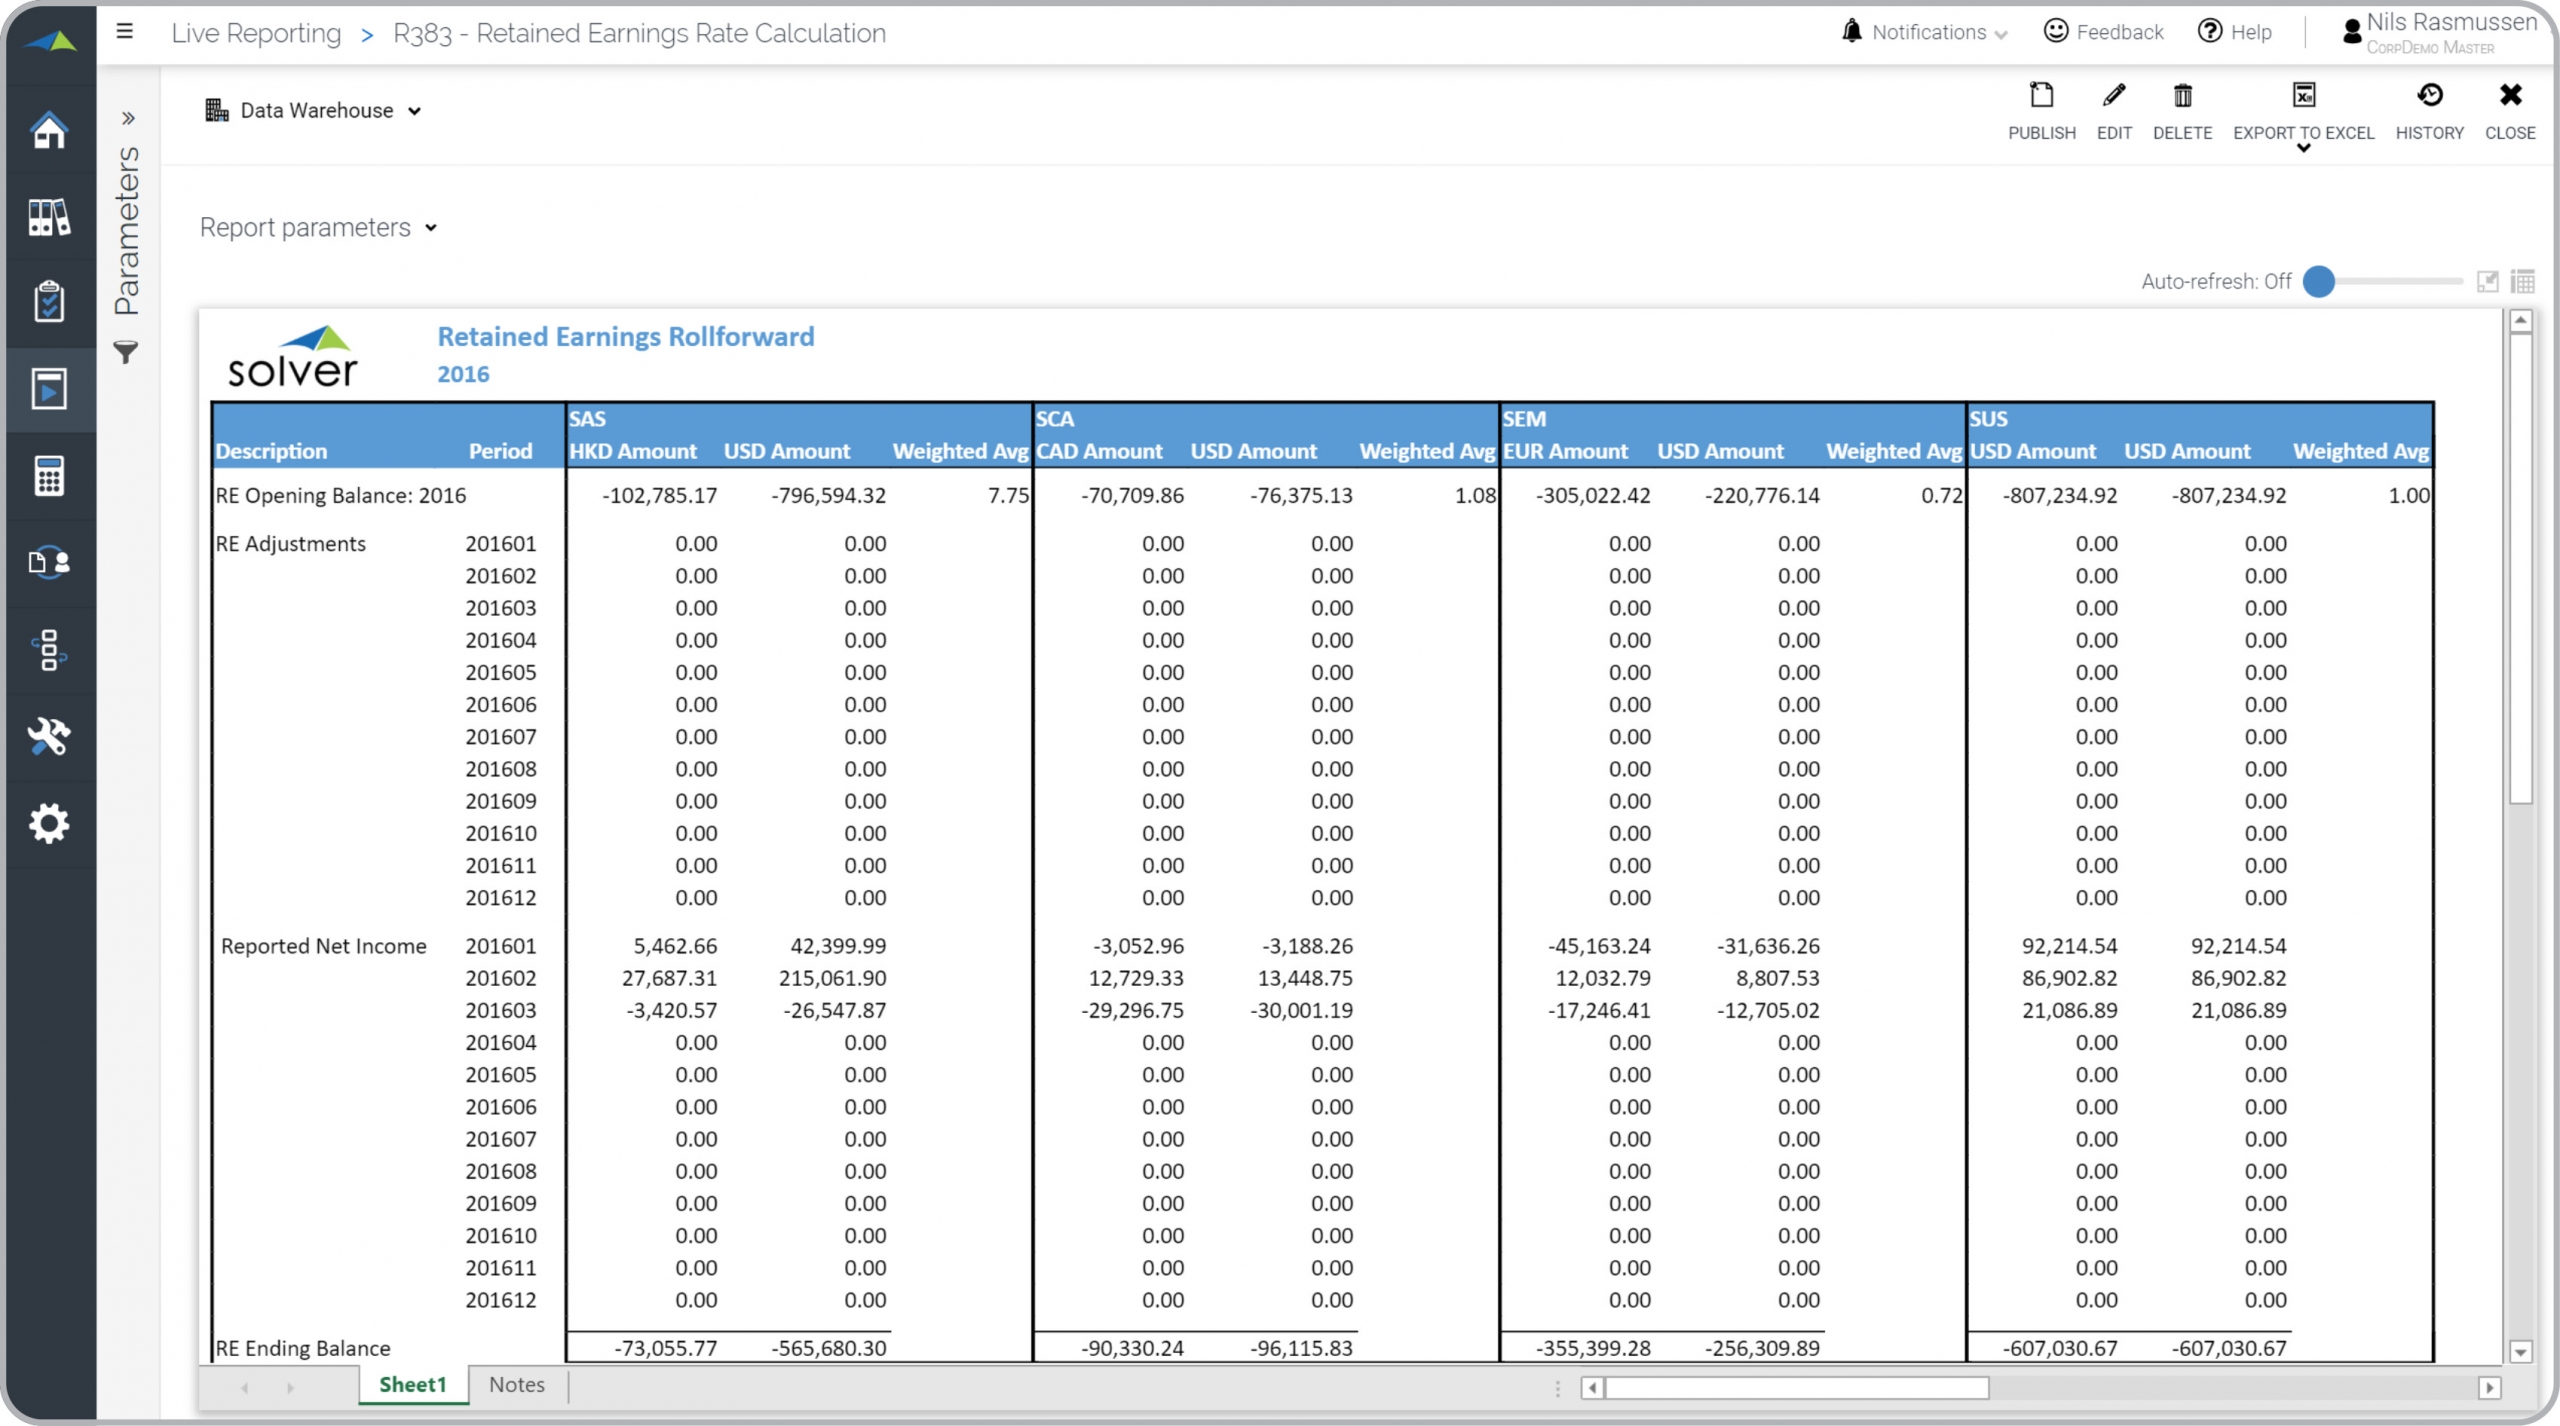
Retained Earnings Report
Produces the rollforward Retained Earnings based on OBA, adjustments, Net Income, etc.
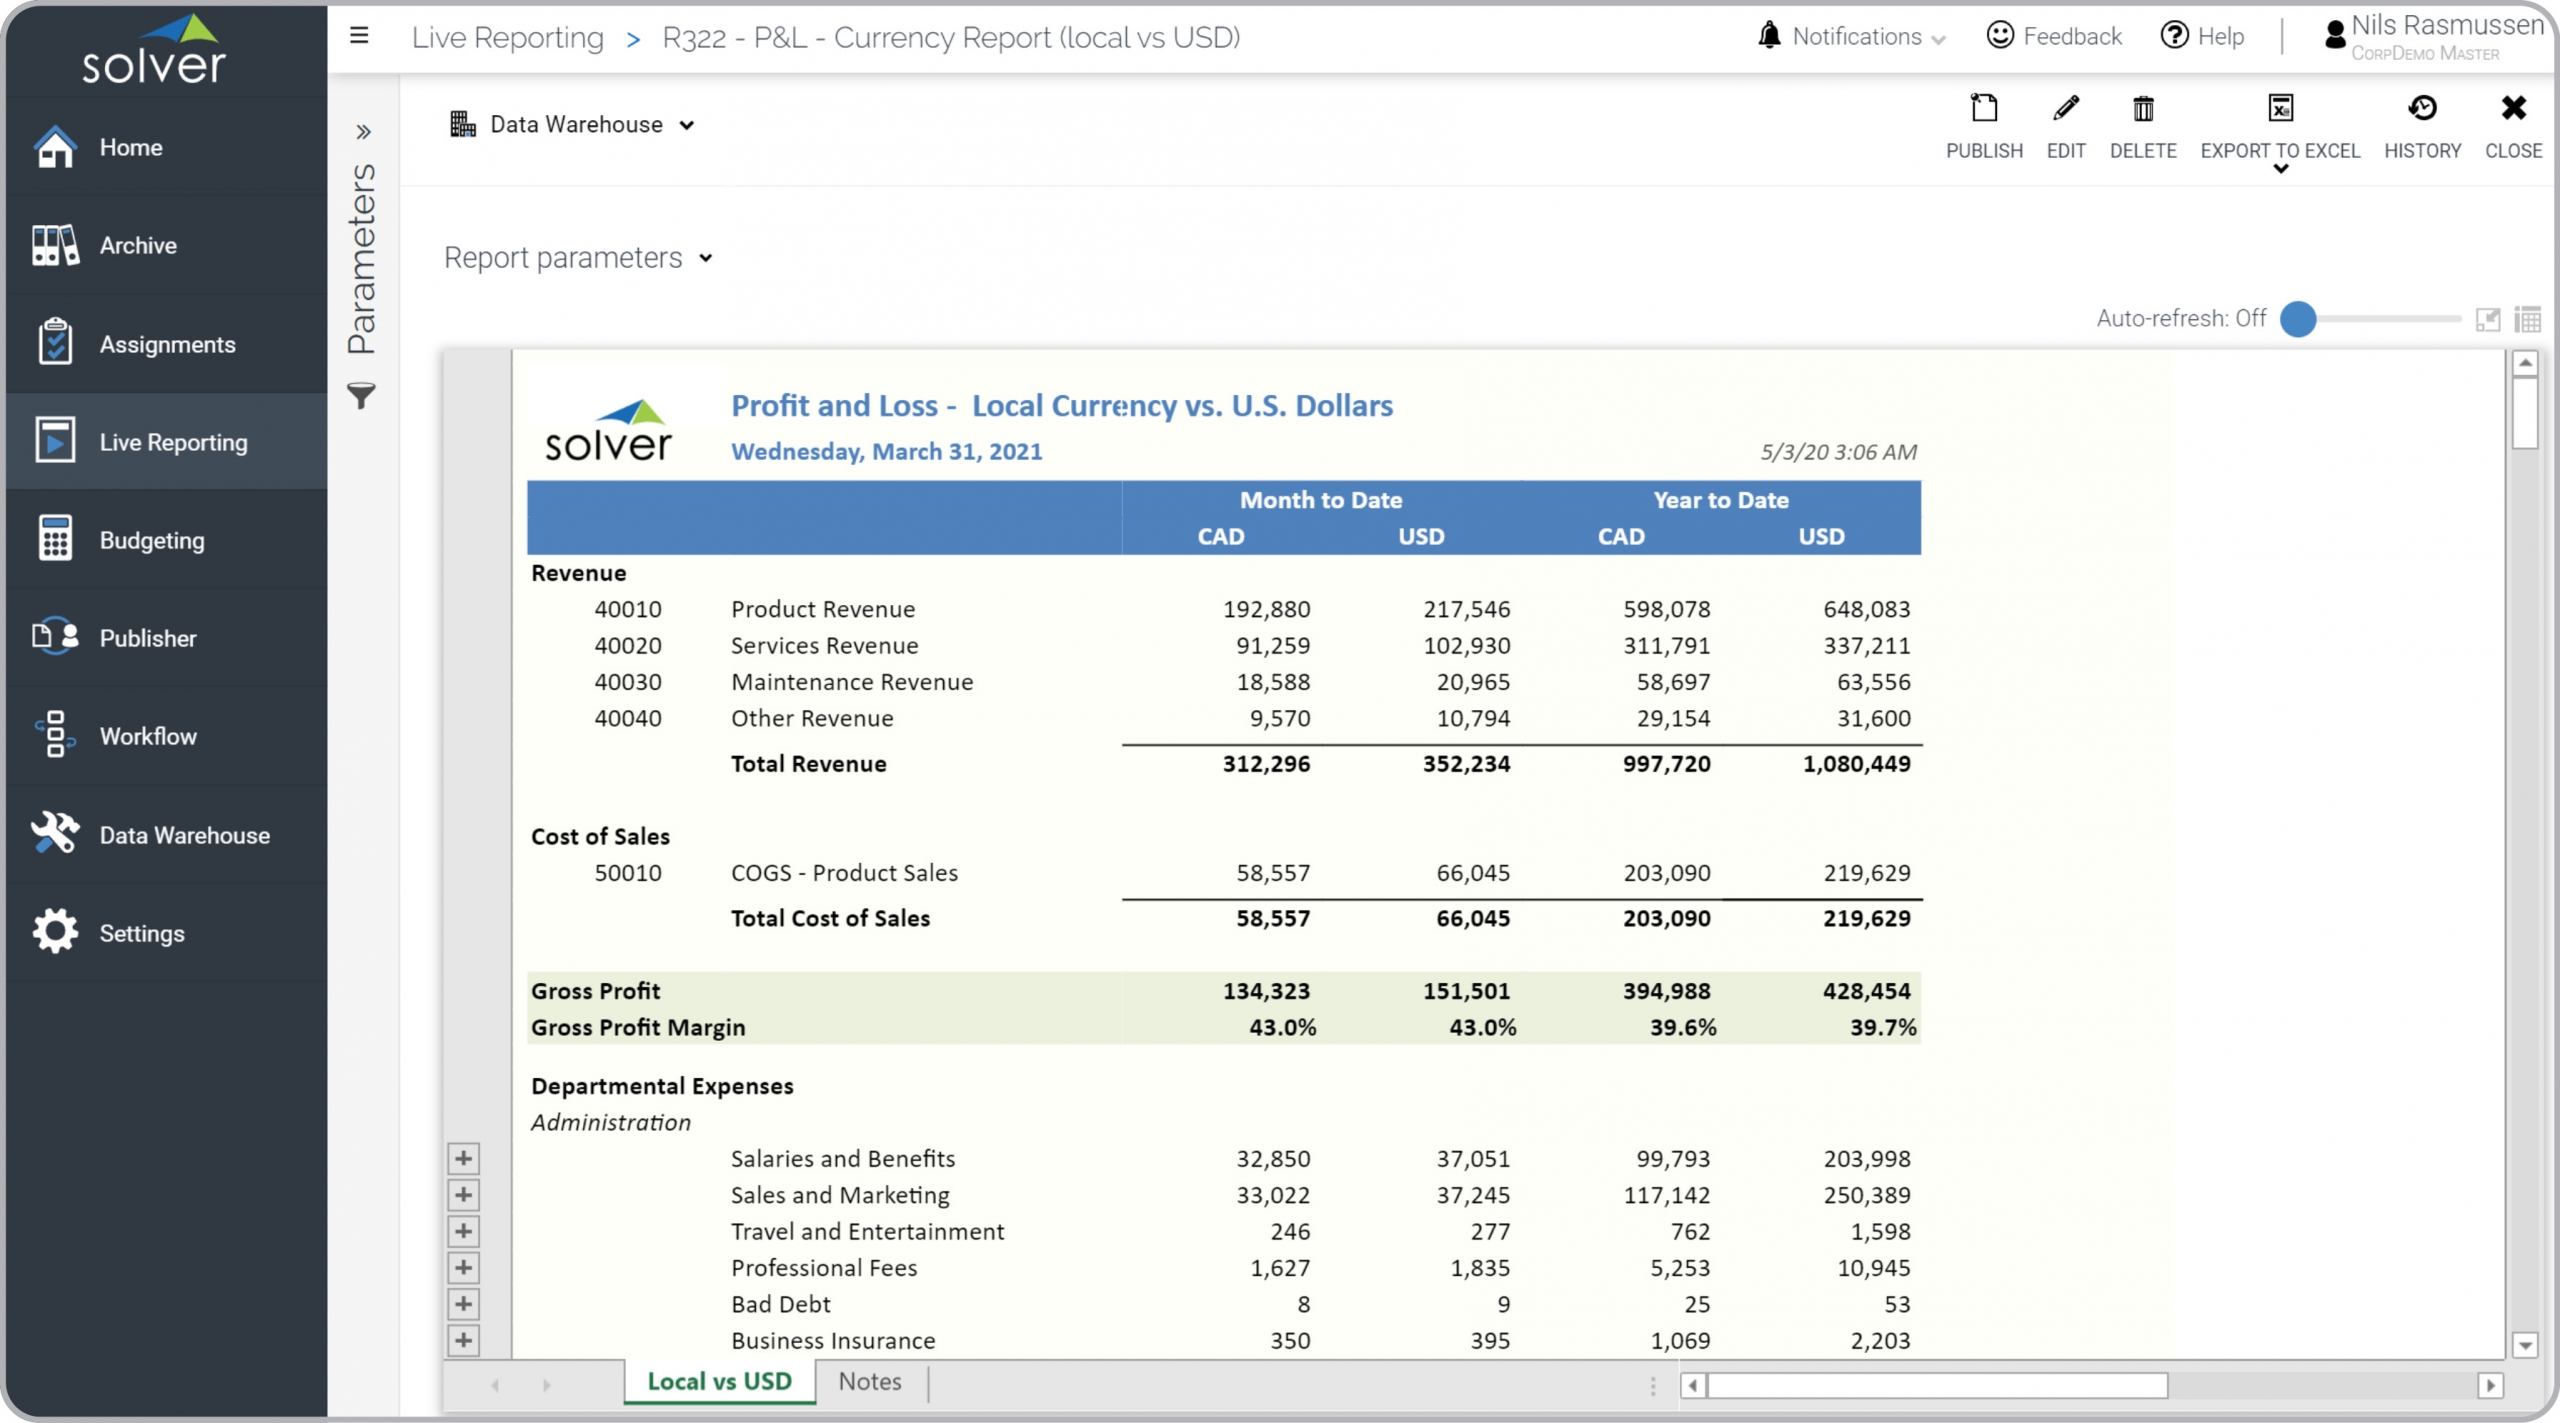
P&L Local vs Reporting Currency
Displays the P&L in both the functional and reporting currency.
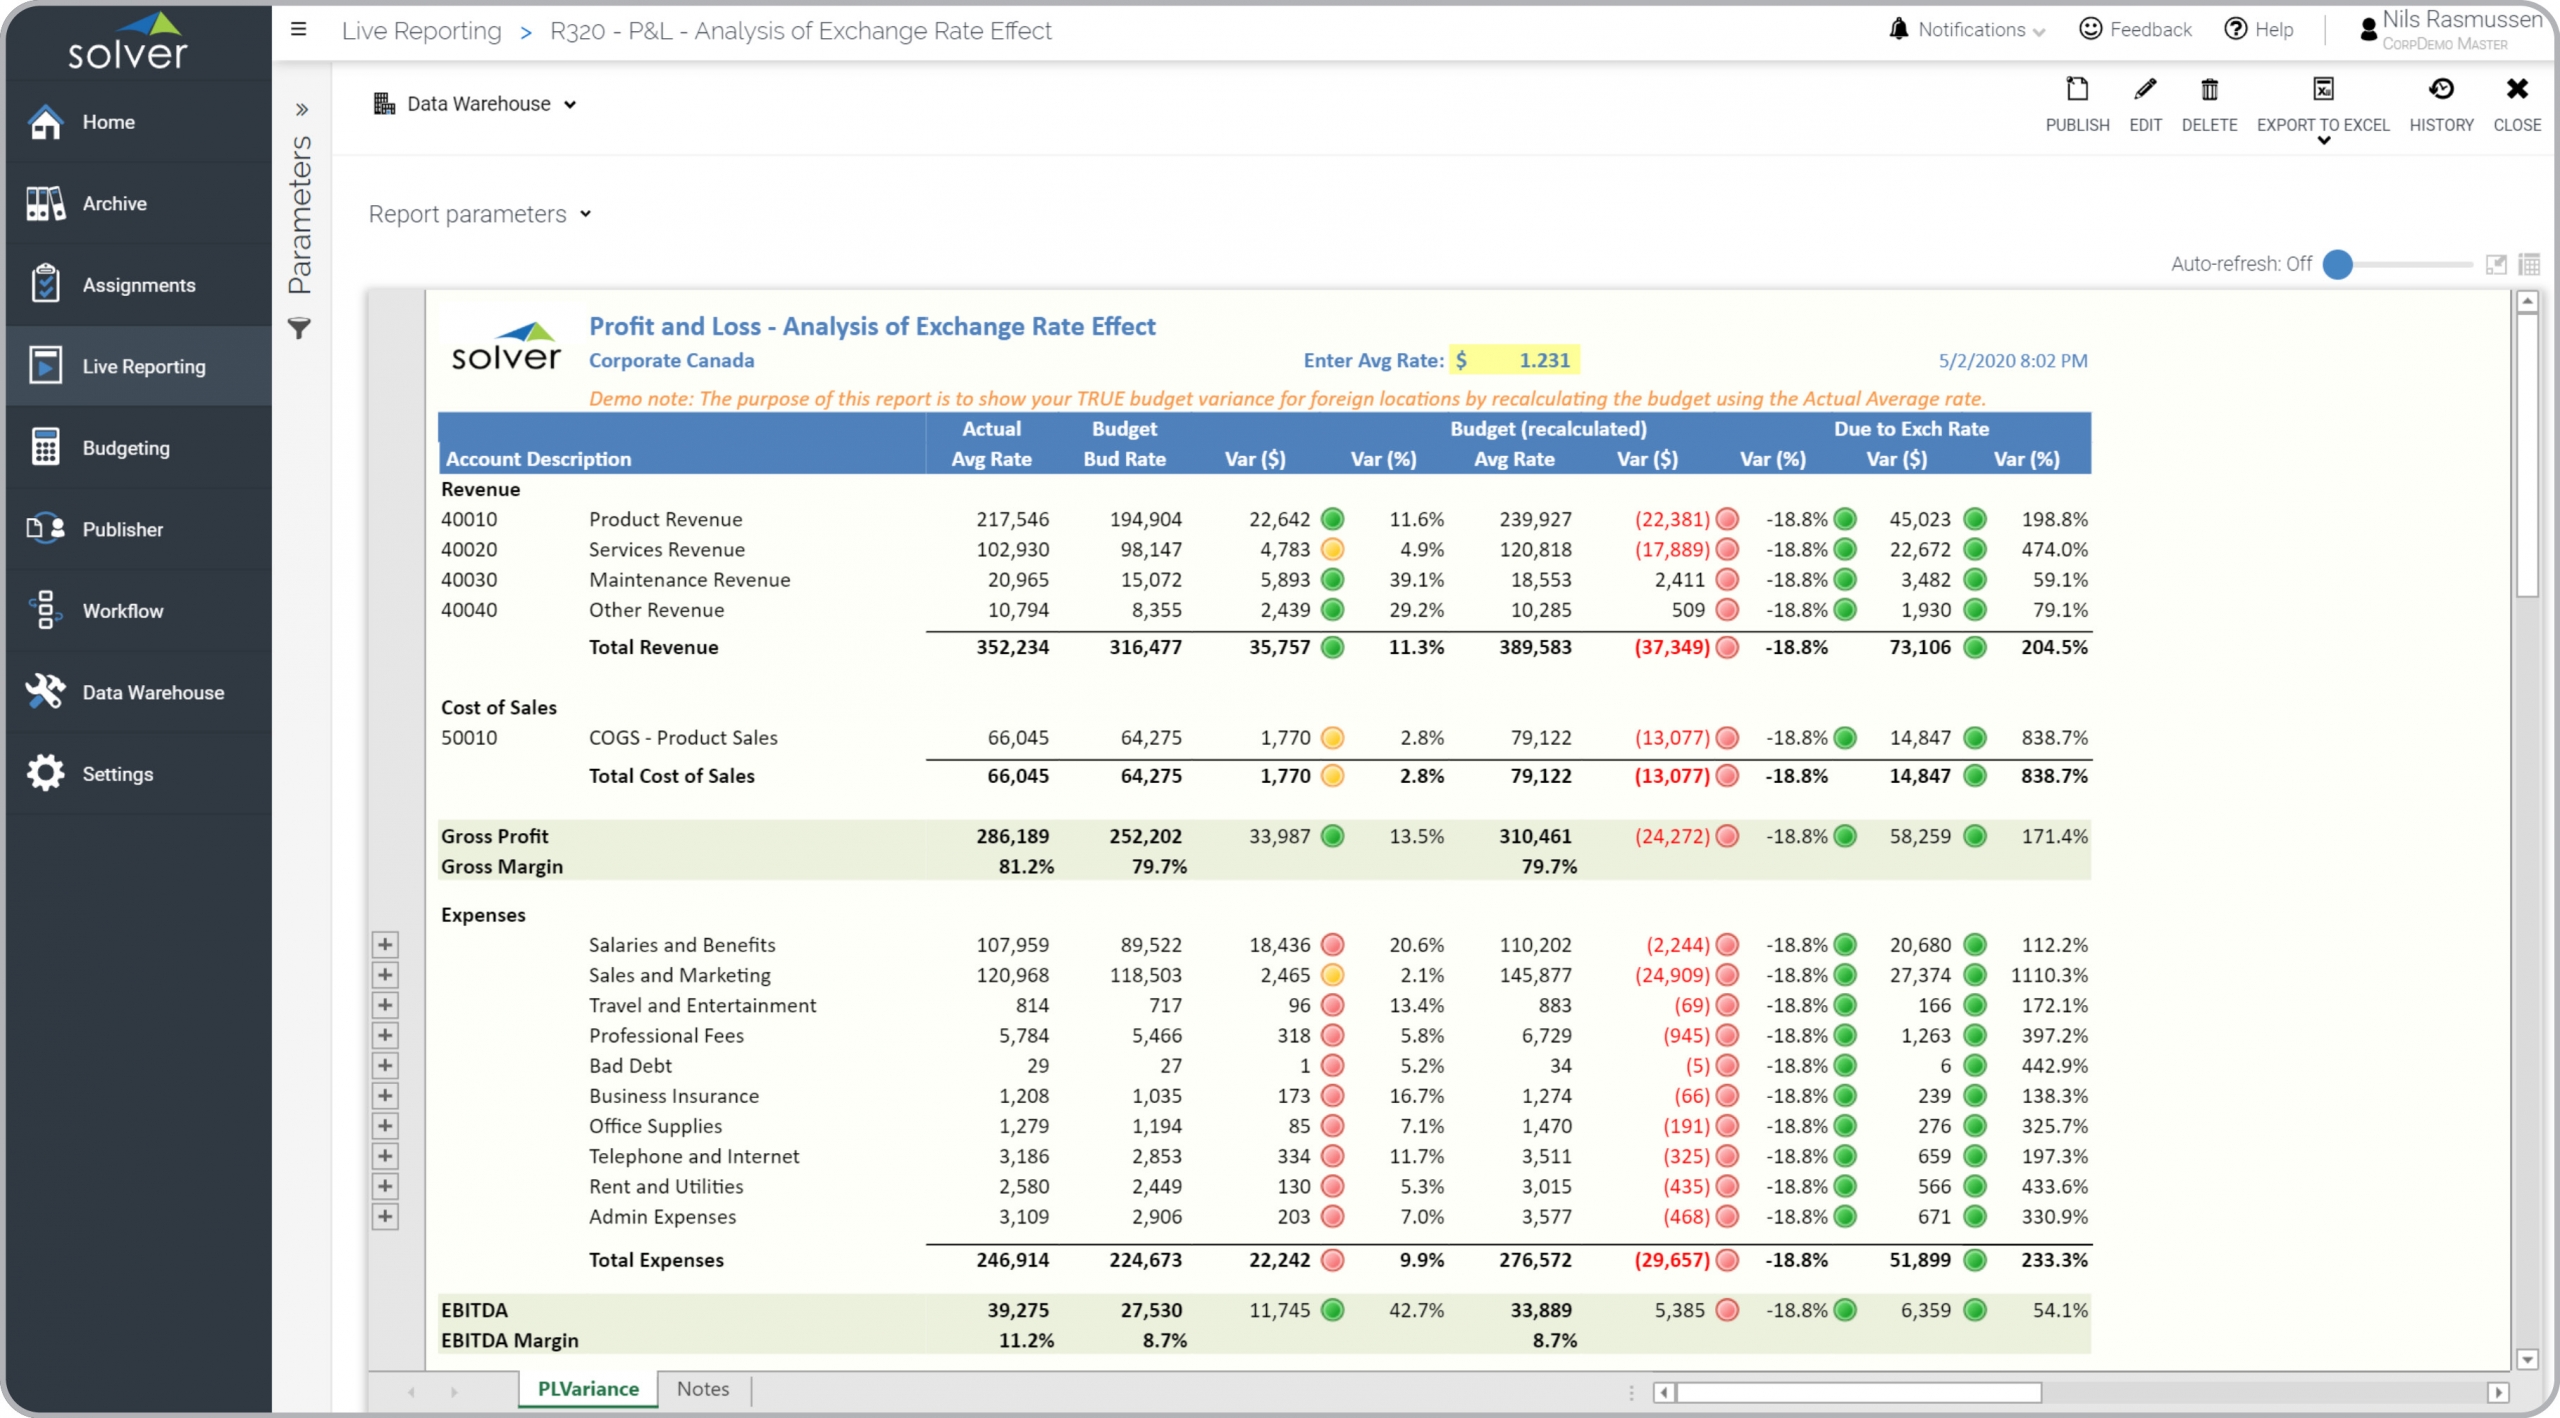
P&L Currency Analysis
Shows budget both with budget rate and recalculated with average rate to show true variance.
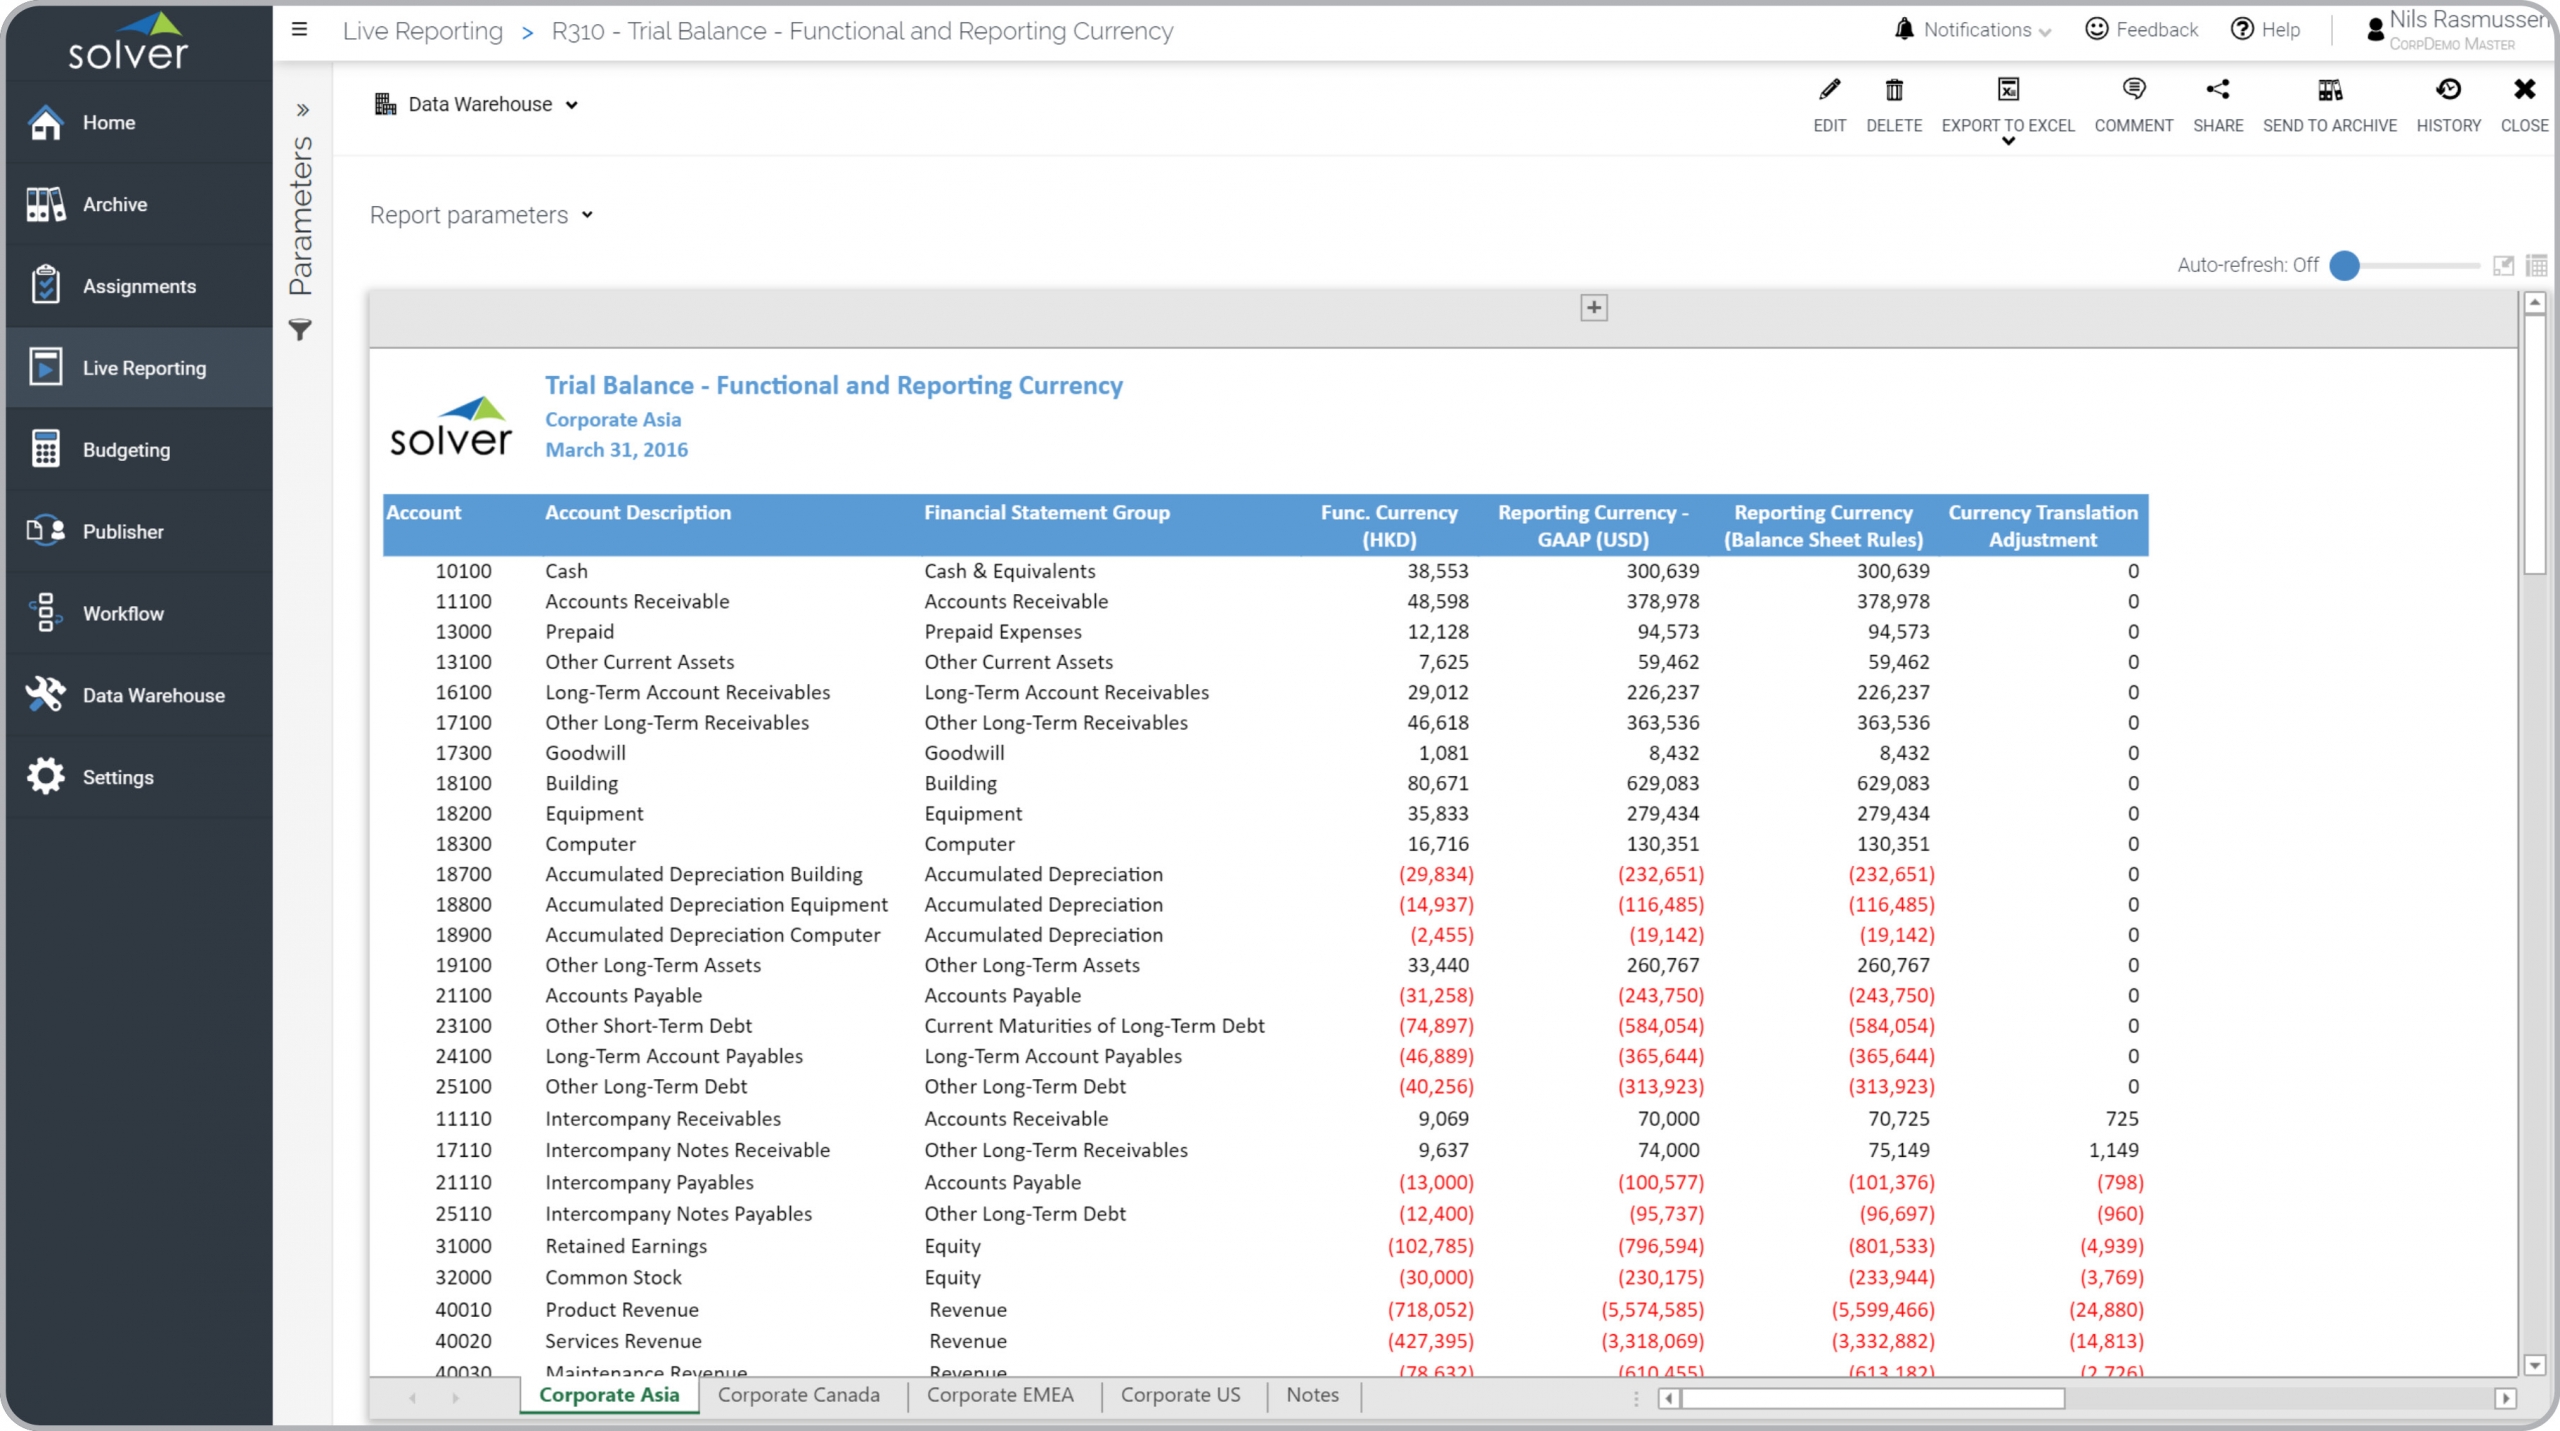
Trial Balance – Currency Analysis
Displays trial balance in both functional and reporting currency. Companies in tabs.
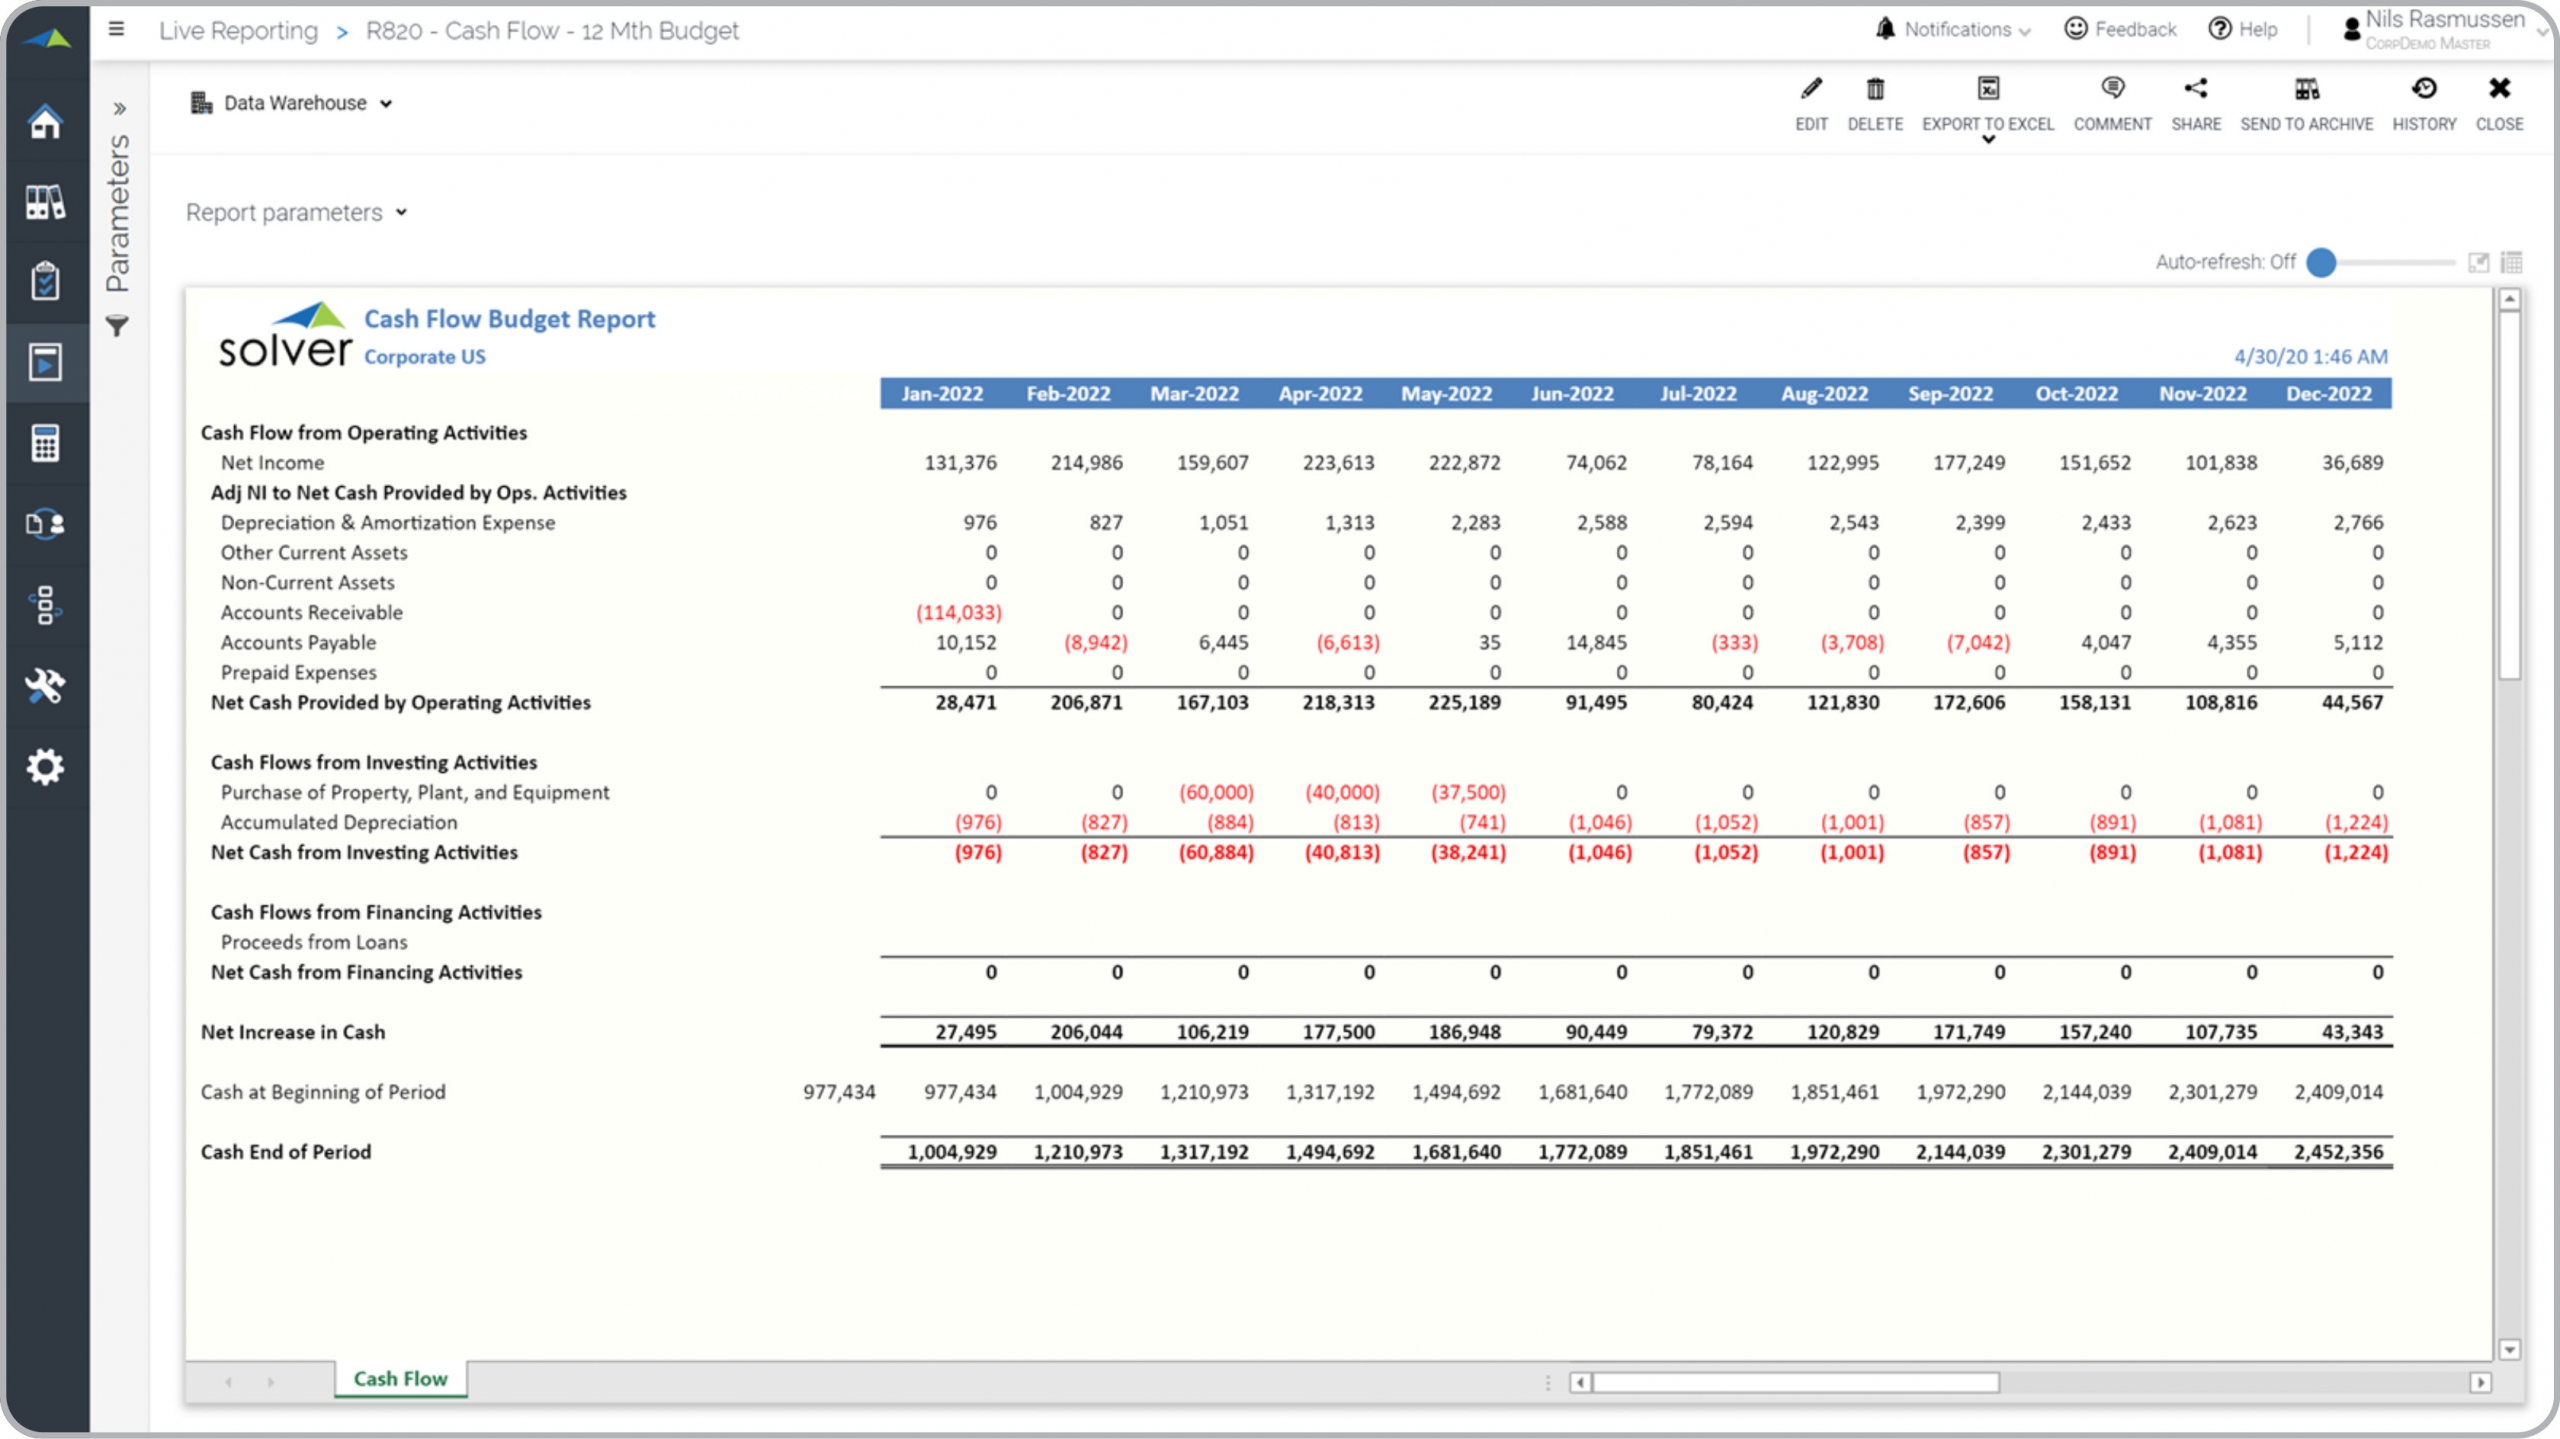
Cash Flow Budget Report
Analyze the Cash Flow budget for each month of the year.
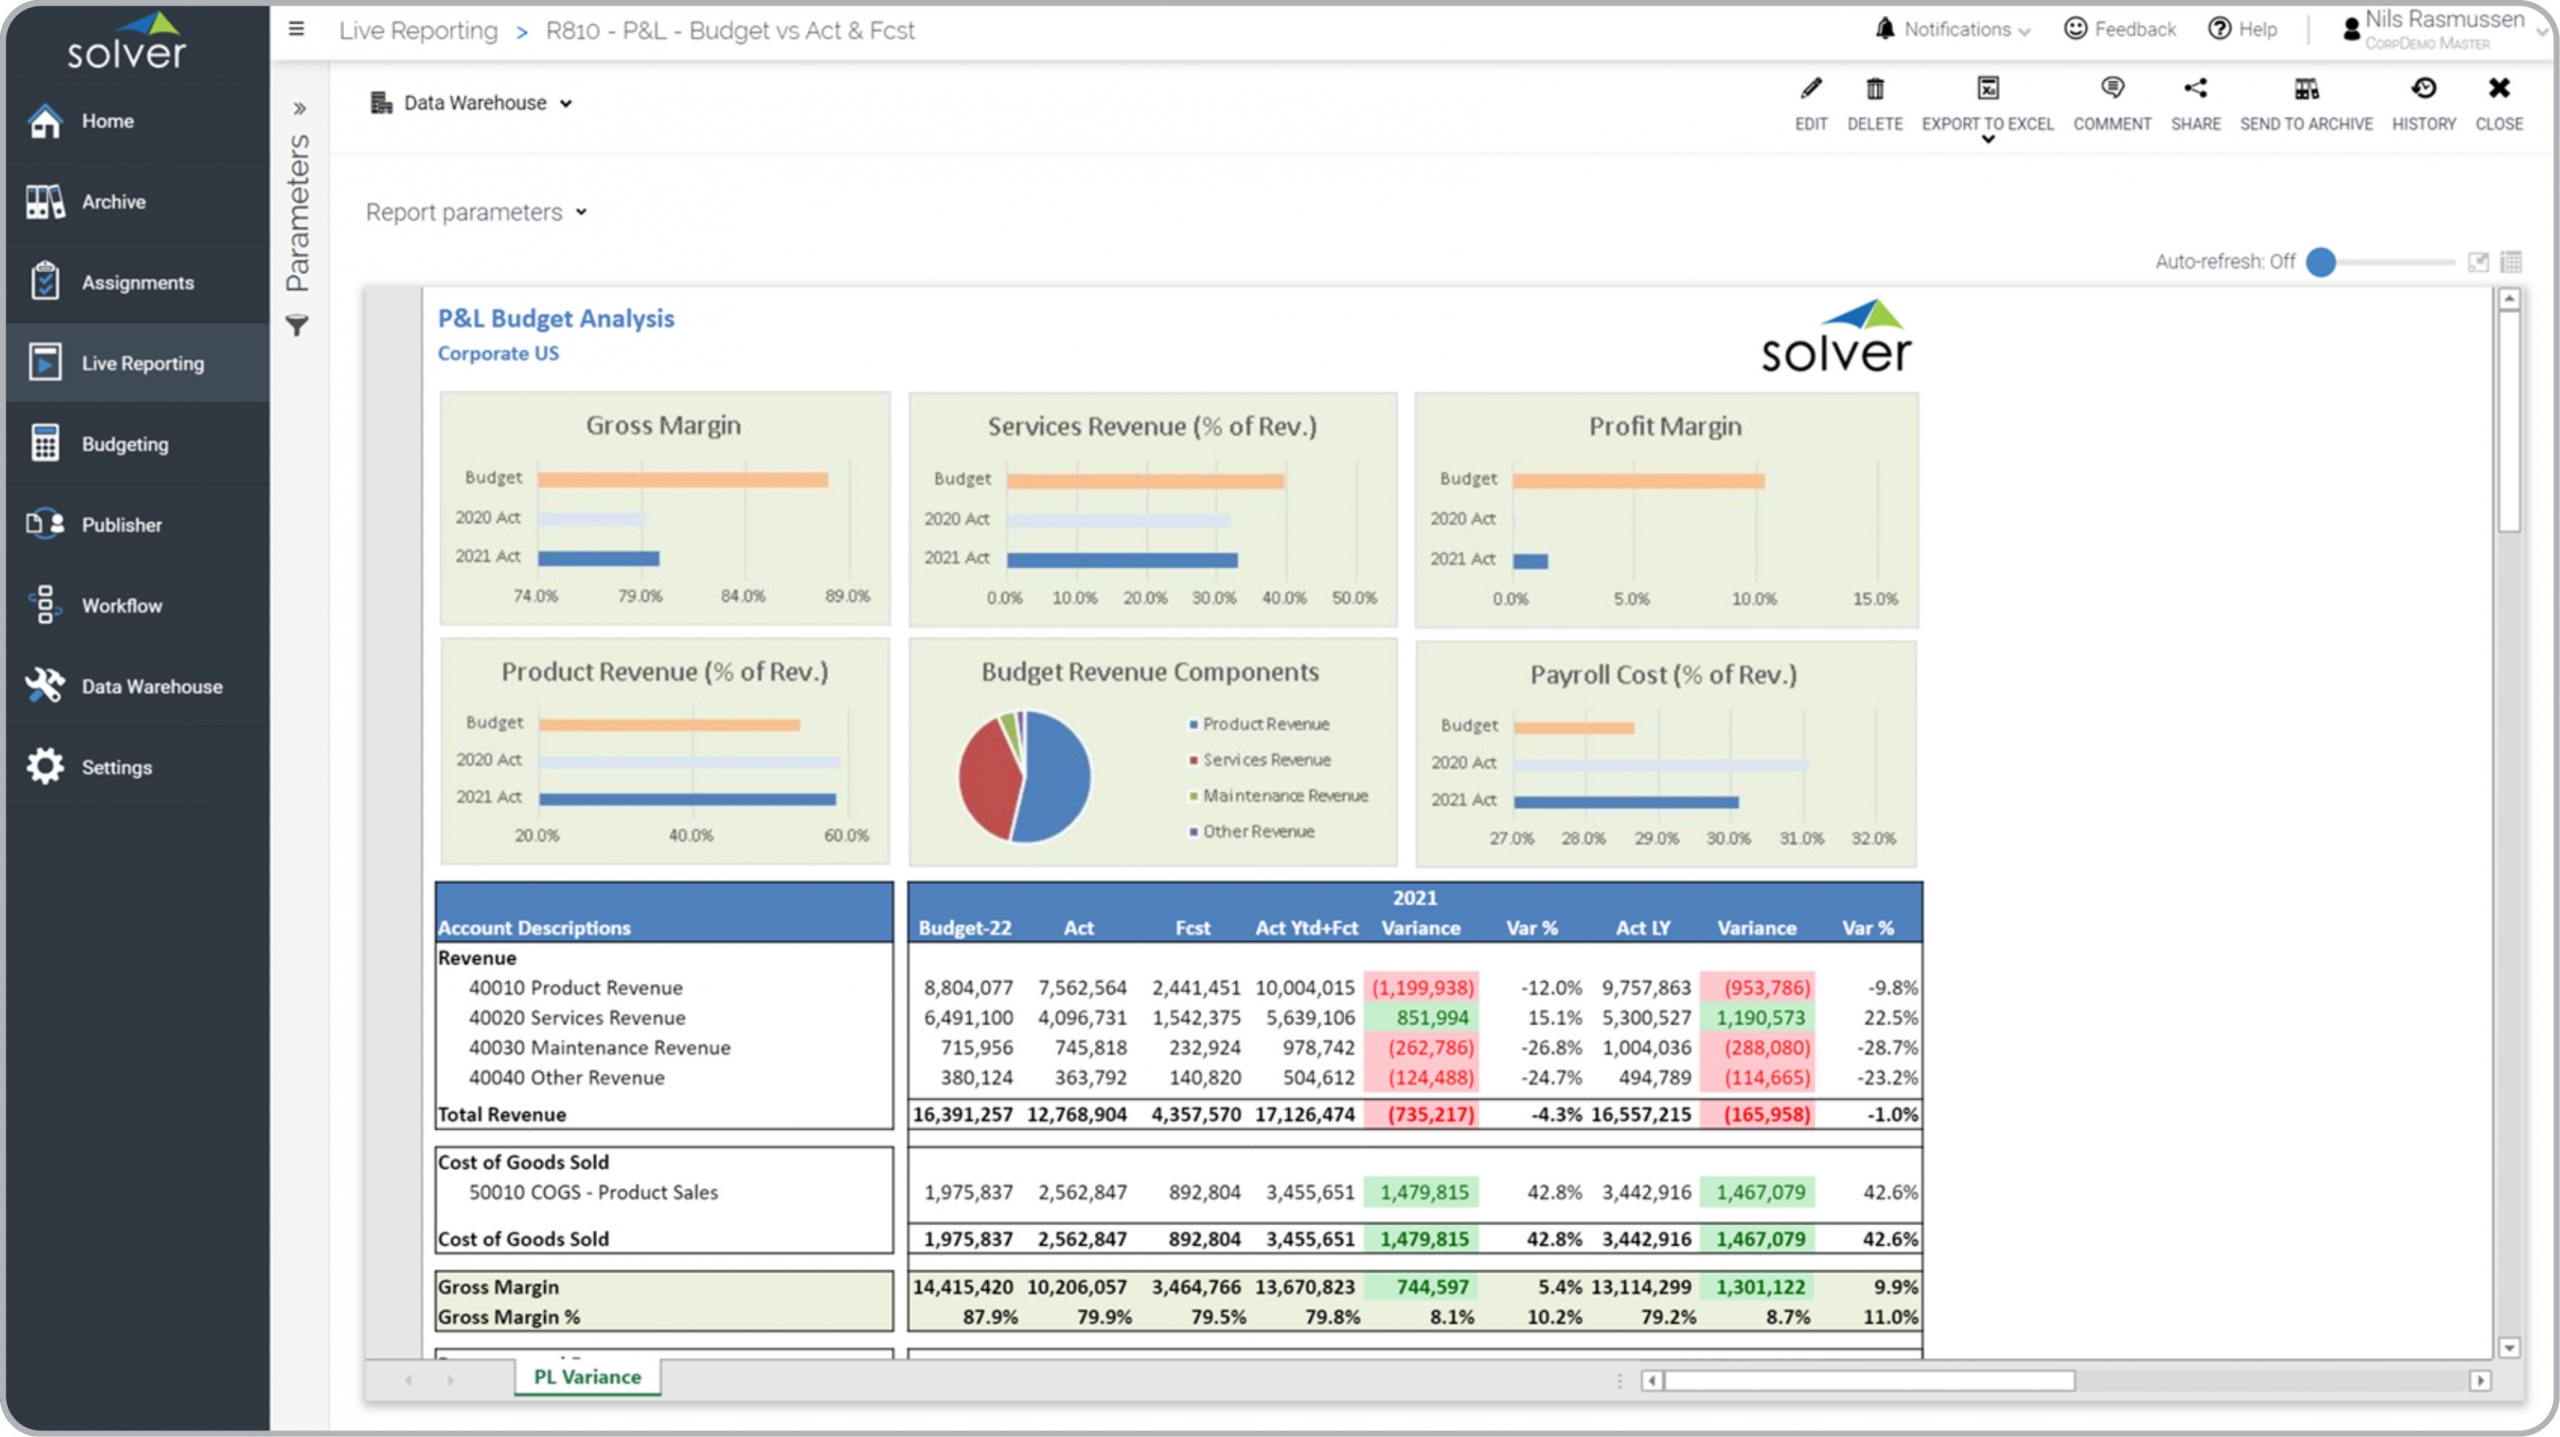
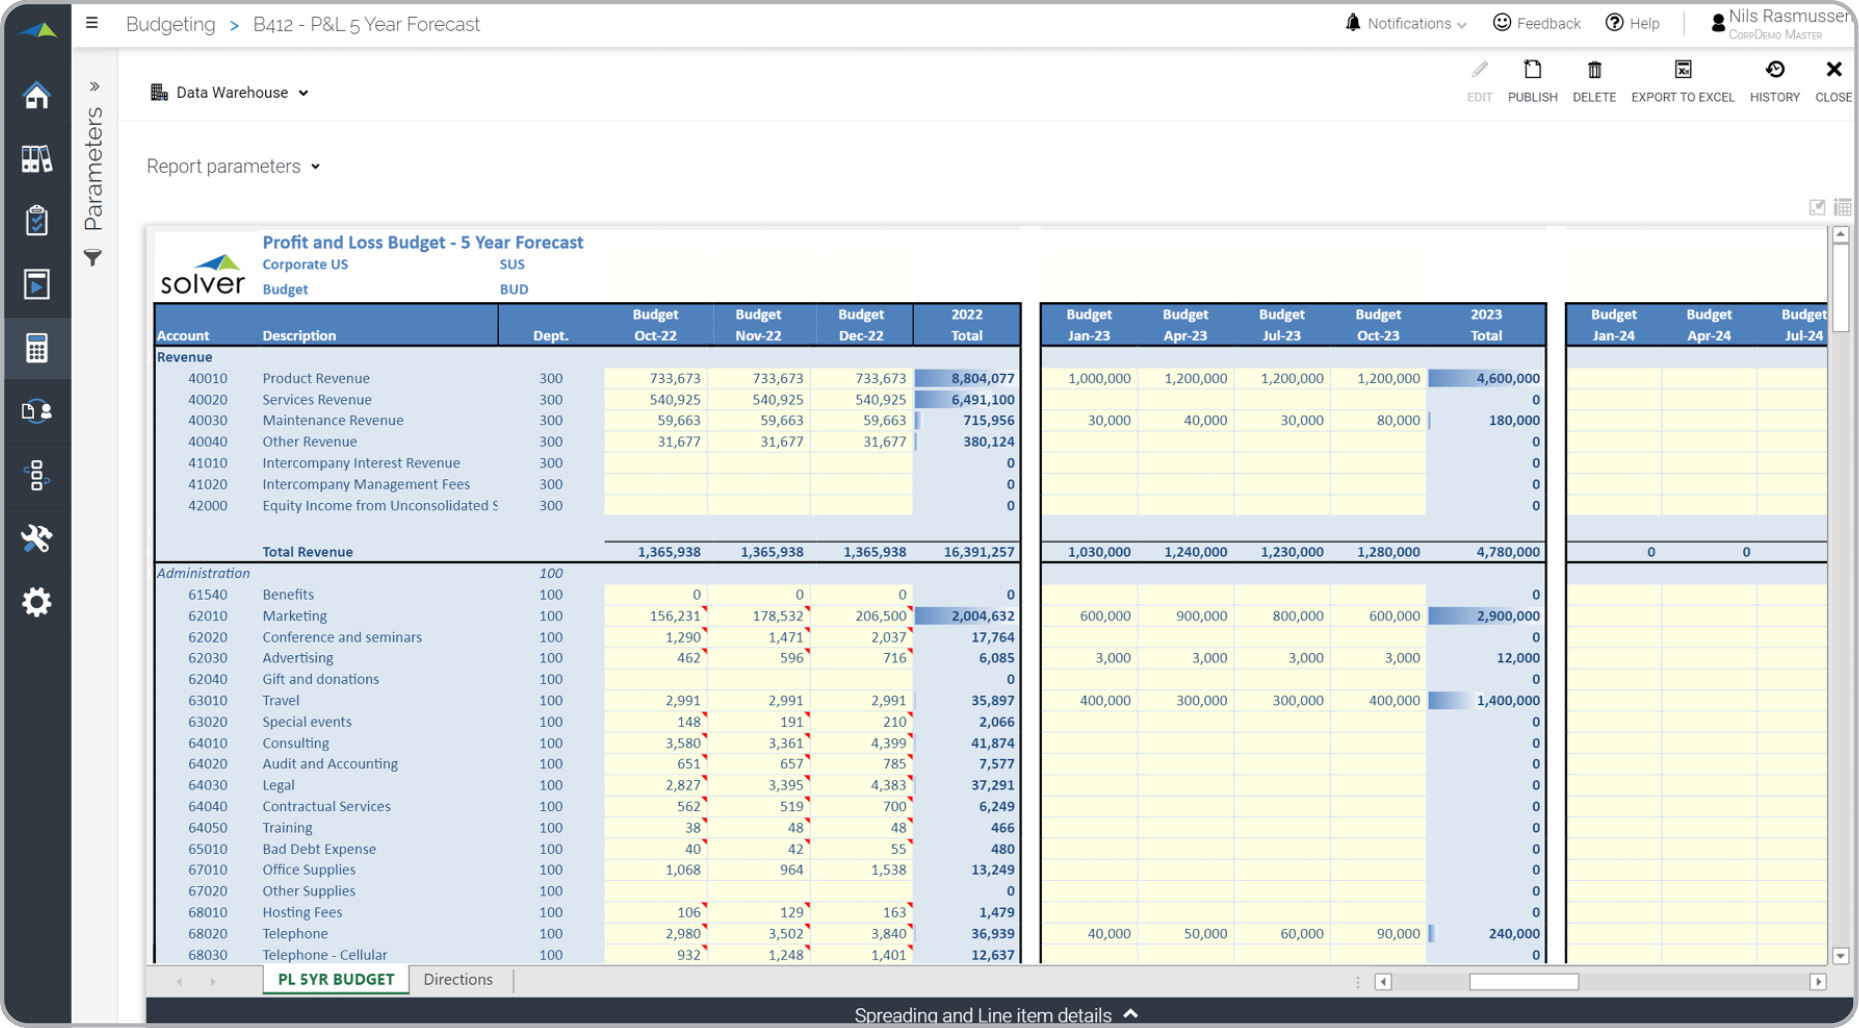
P&L Budget Report
Analyze the newly created budget versus actual and forecast for the current year.


Security Overview
Shows the detailed user security in Solver Cloud which enables SOC II and HIPAA compliance.
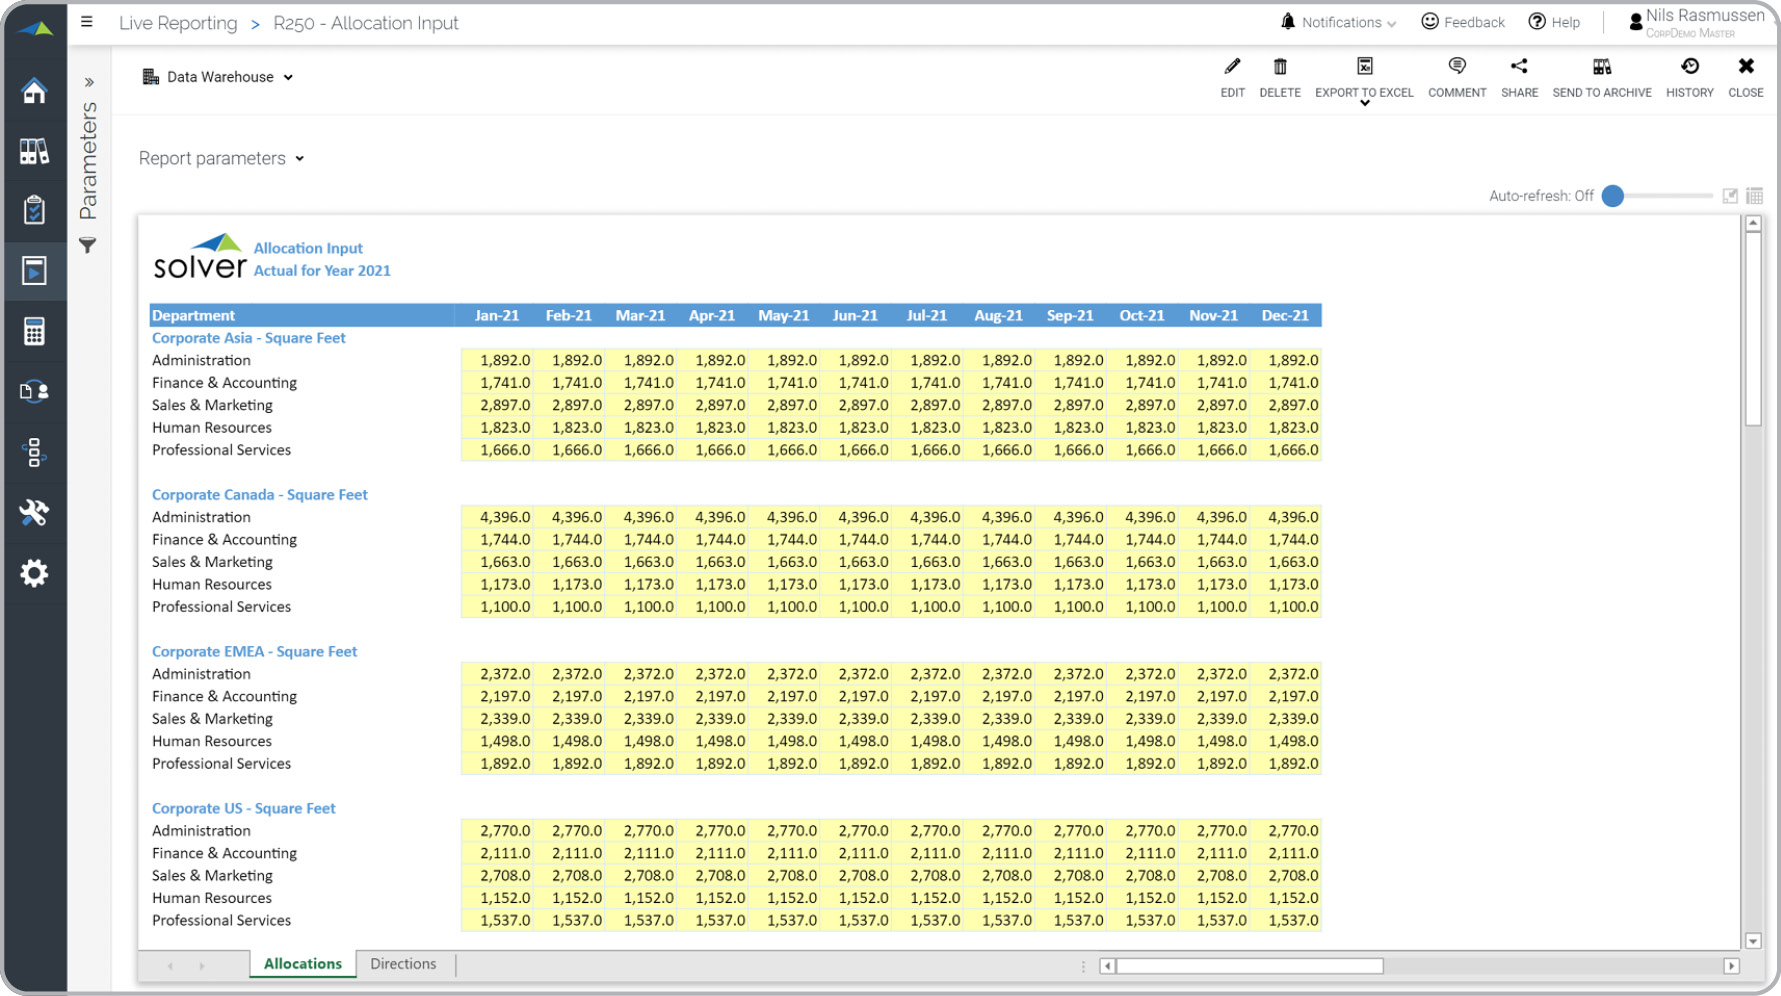
Allocation Input Report
Input form to capture statistical drivers for use in automated allocations.
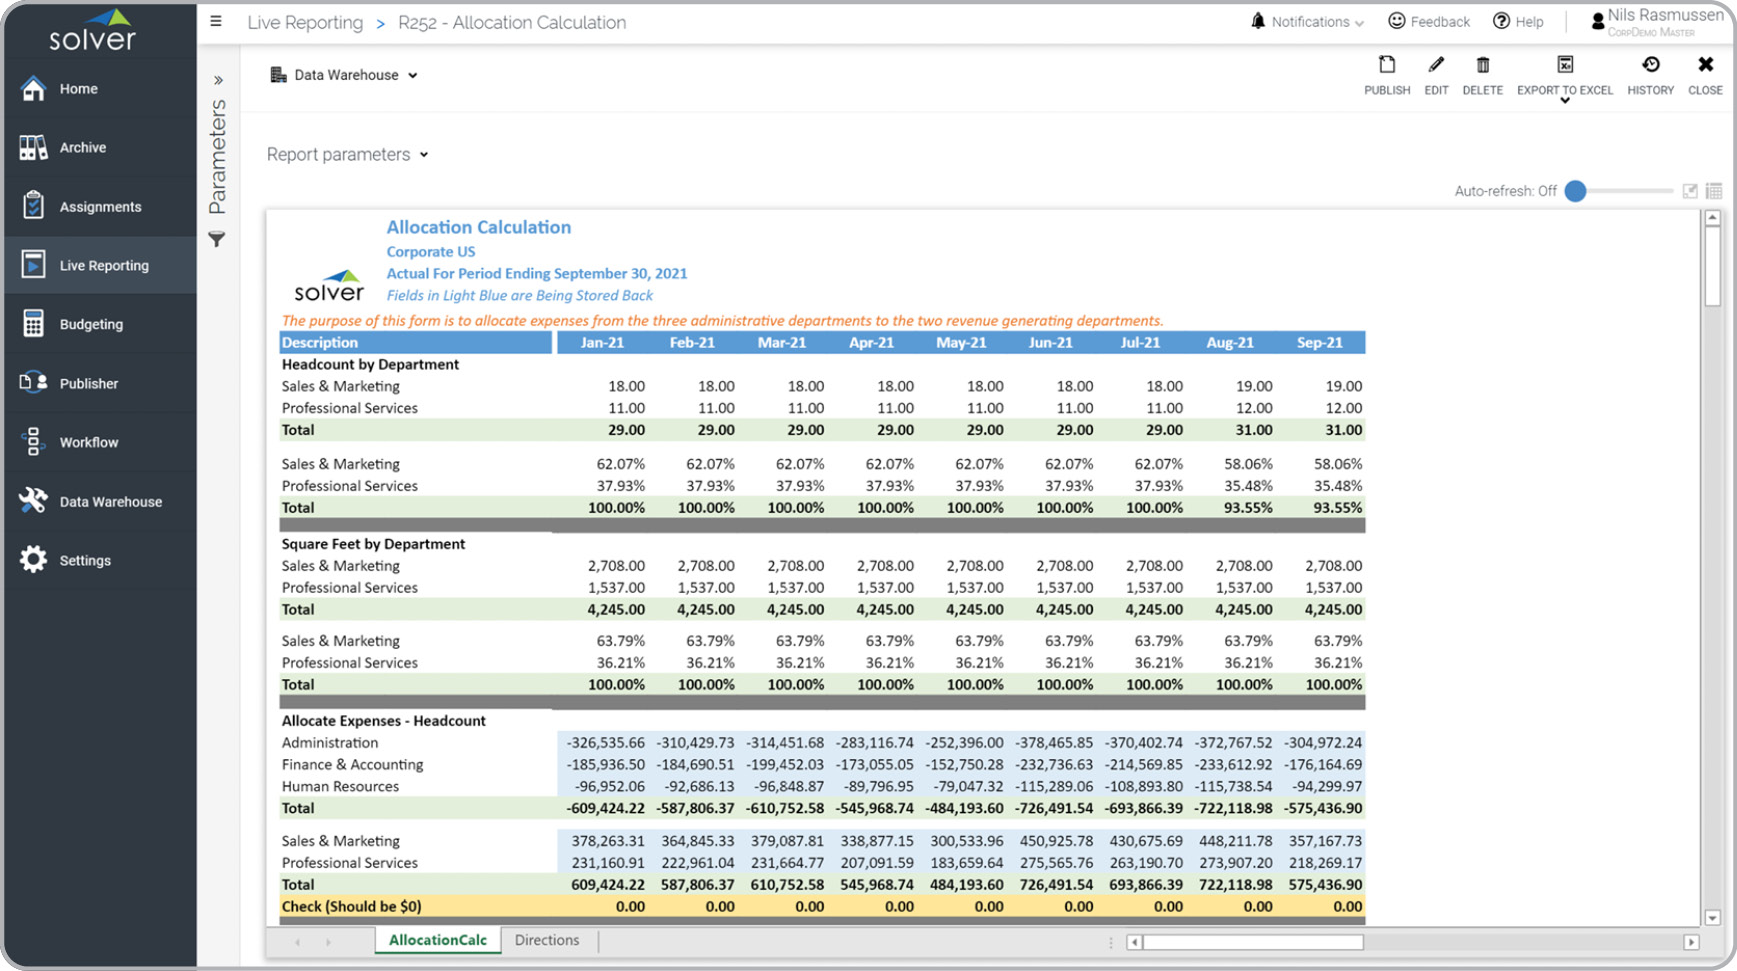
Allocation Calculation Report
Automatically allocates admin expenses to departments based on drivers (i.e. headcount).
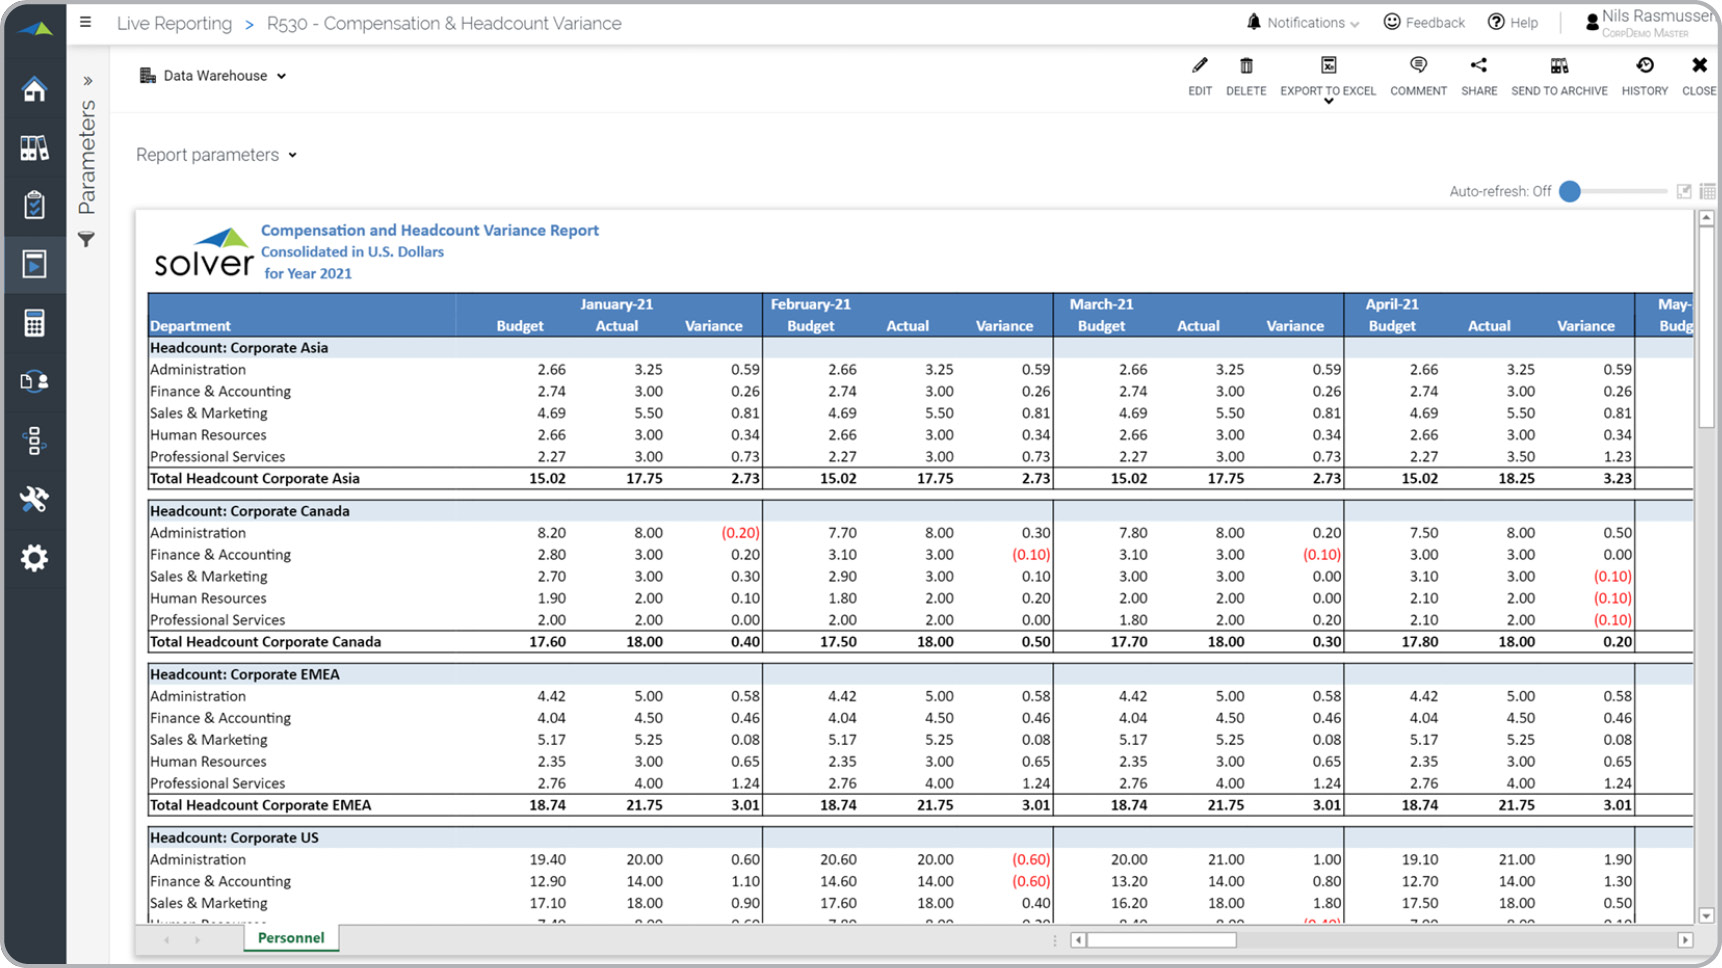
Compensation & Headcount
Provides detailed headcount and employee compensation by month with budget variance.
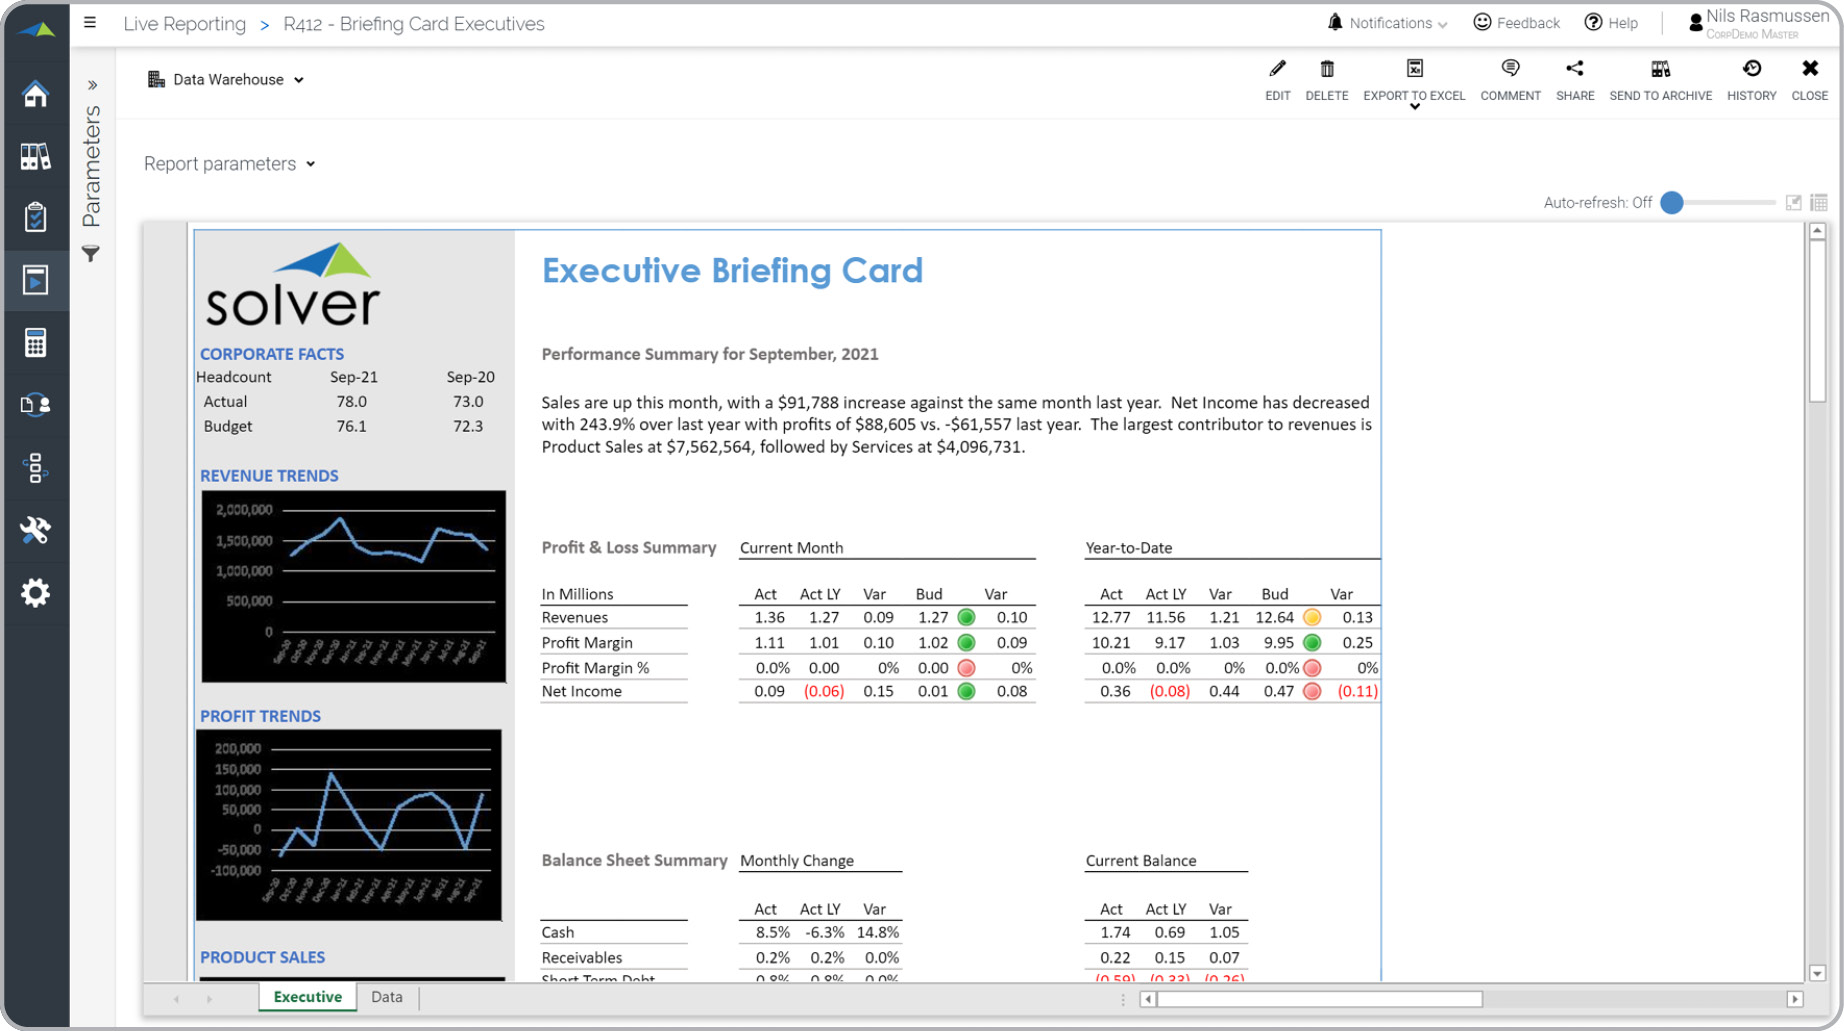
Executive Briefing Card
Unique and automated one page report presenting key financial info as briefing card.
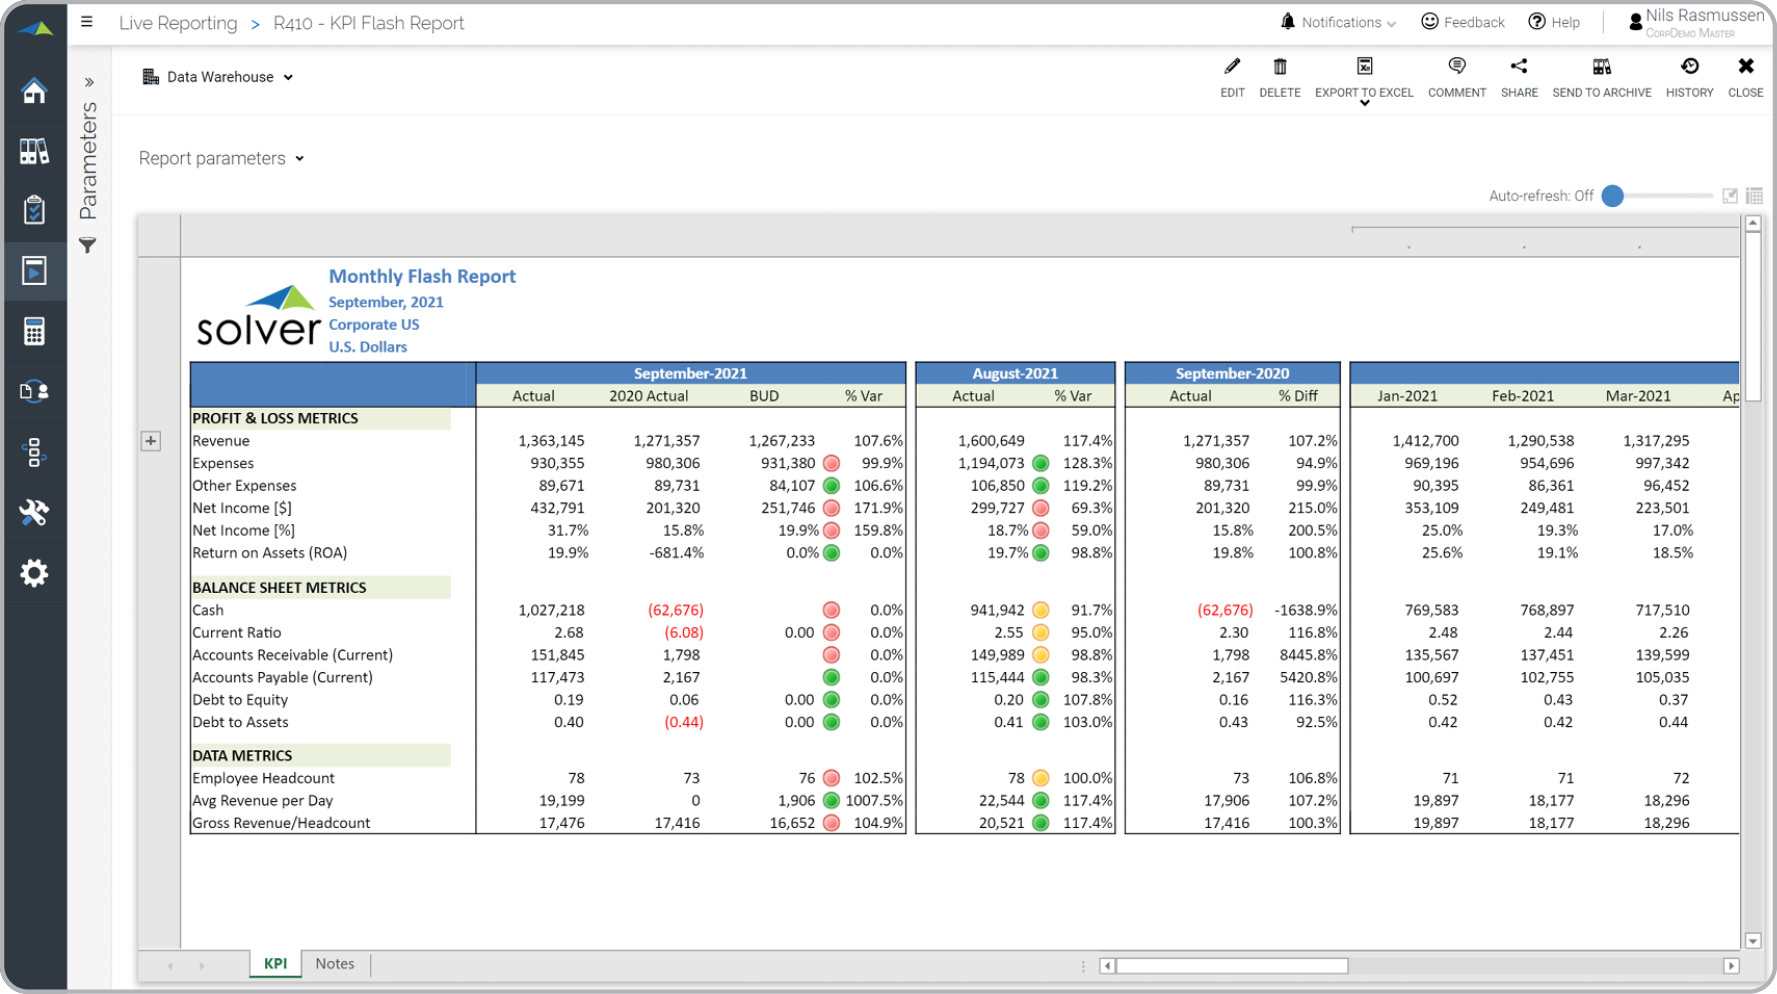
Financial Flash Report
Combines actual, budget and variances for key figures from P&L, BS and statistics.
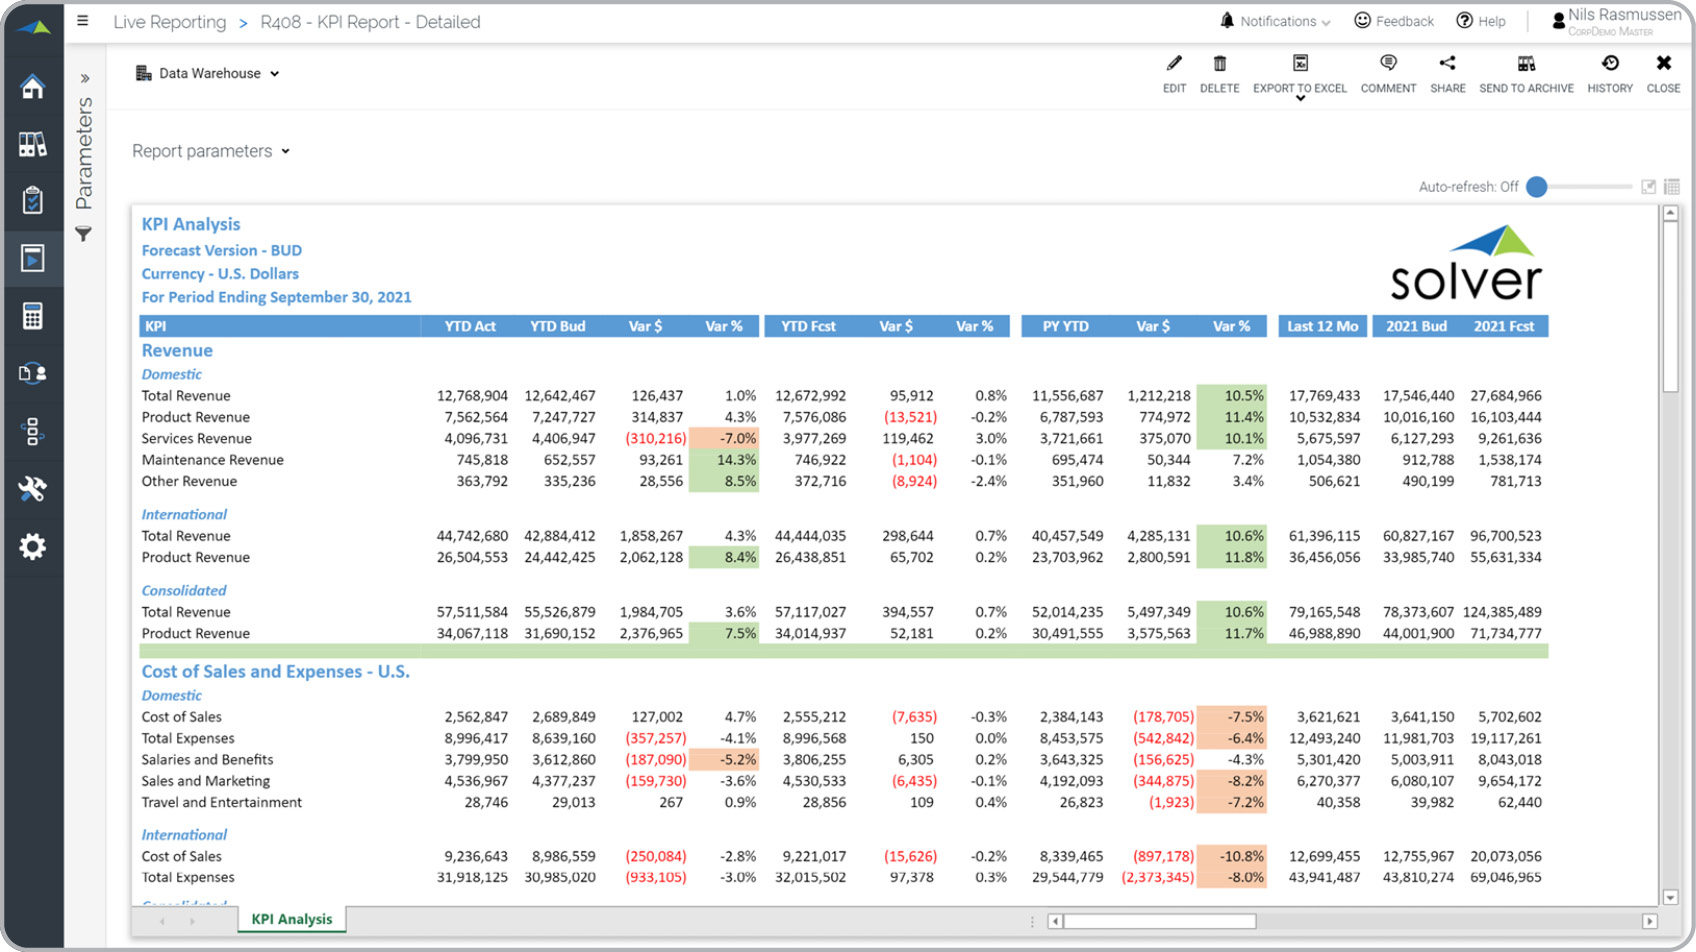
Detailed KPI Variance Report
Detailed KPI report with actual and budget variances.
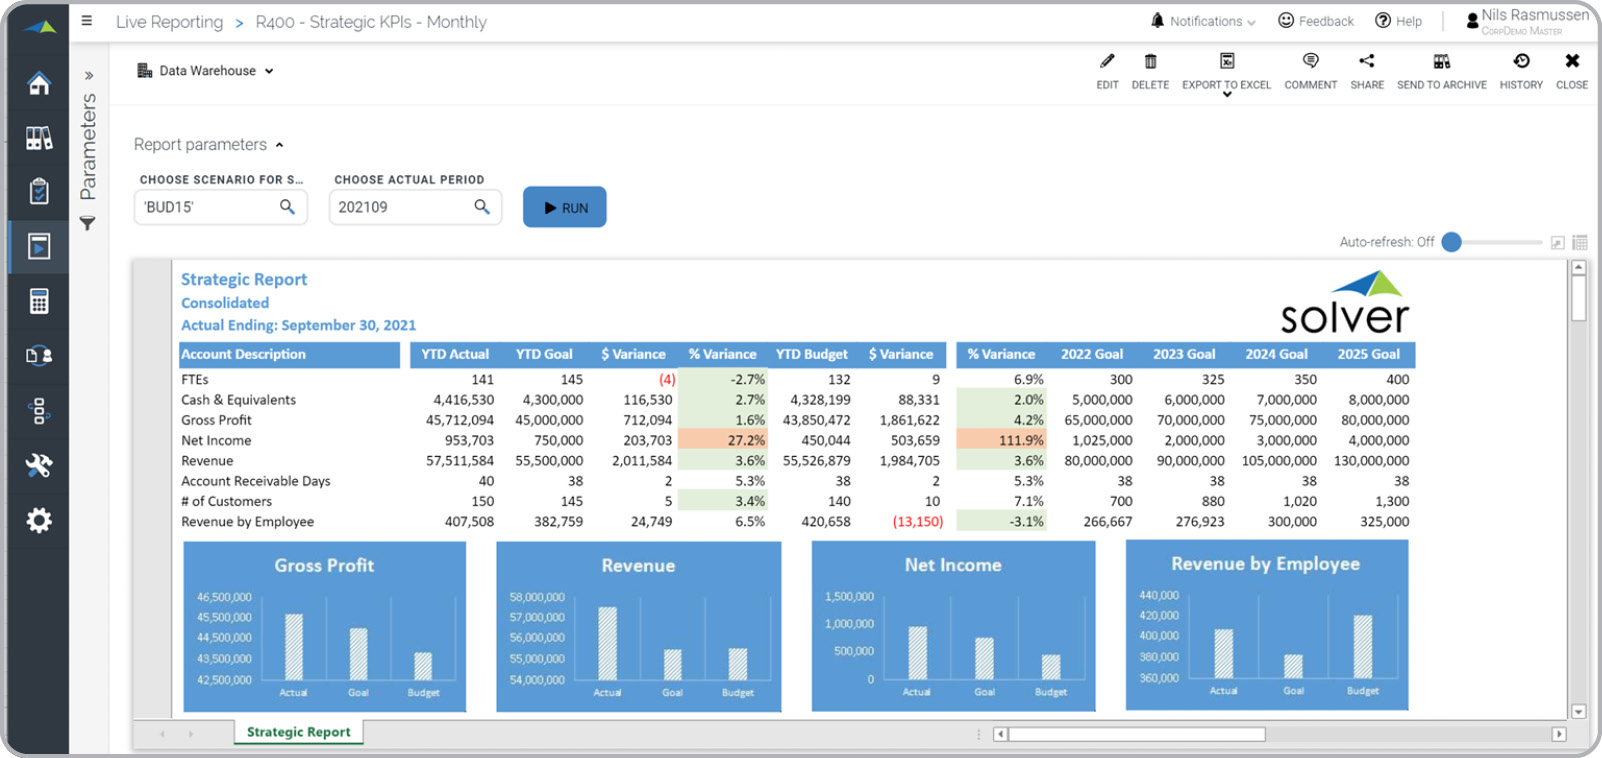
Strategic KPIs vs Goal and Budget
Shows KPIs as report and charts with variances and includes goals for the next 4 years.
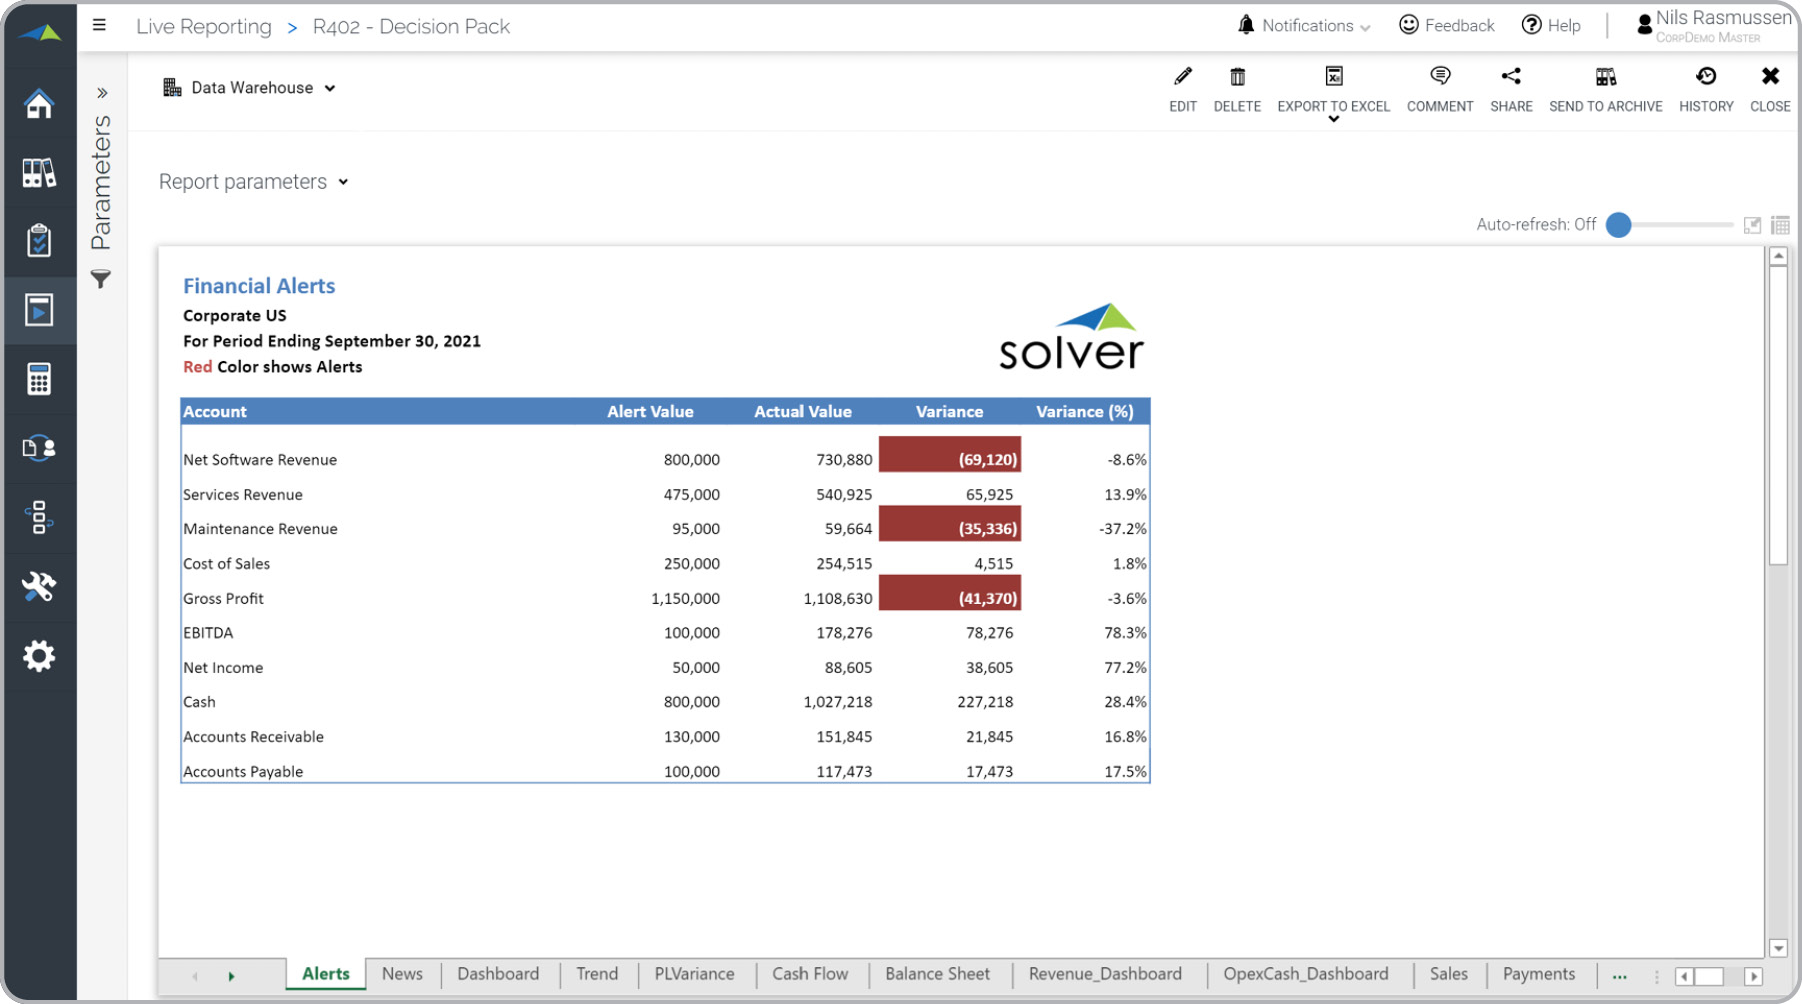
Financial Alerts
Alert report where the user quickly can see exceptions vs goal (can be budget).
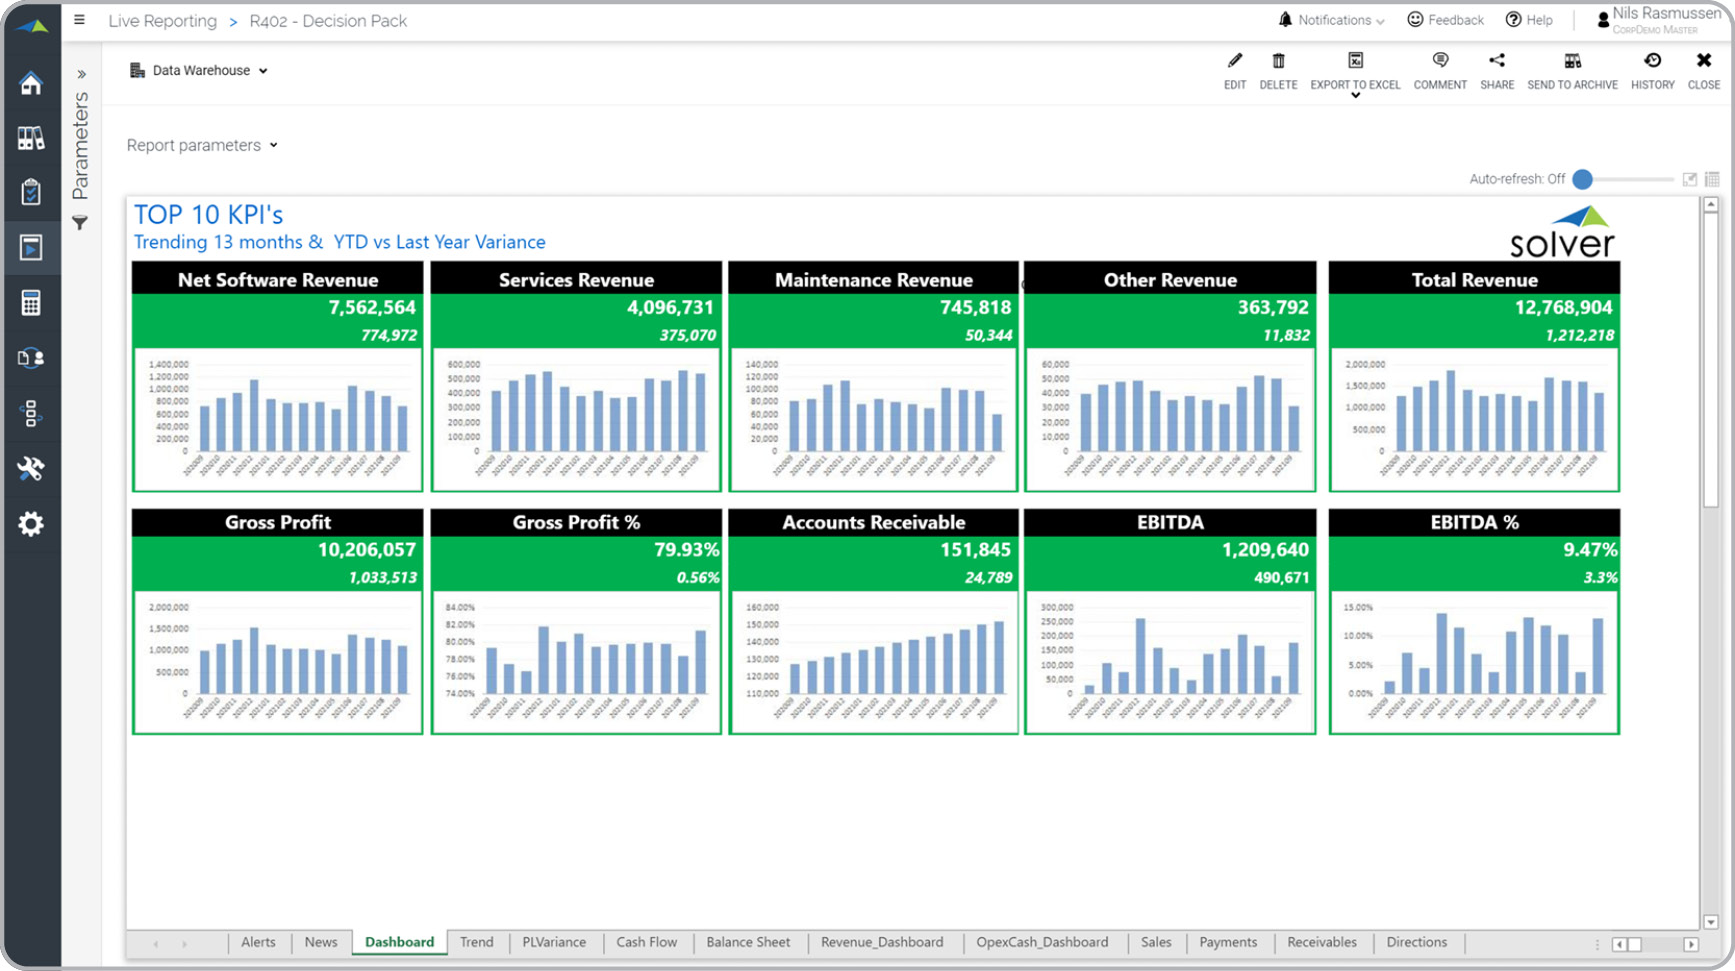
Top 10 KPIs with 13-Month Trend
Graphical view of top KPIs with 13-month trend charts that includes actual last year and variance.
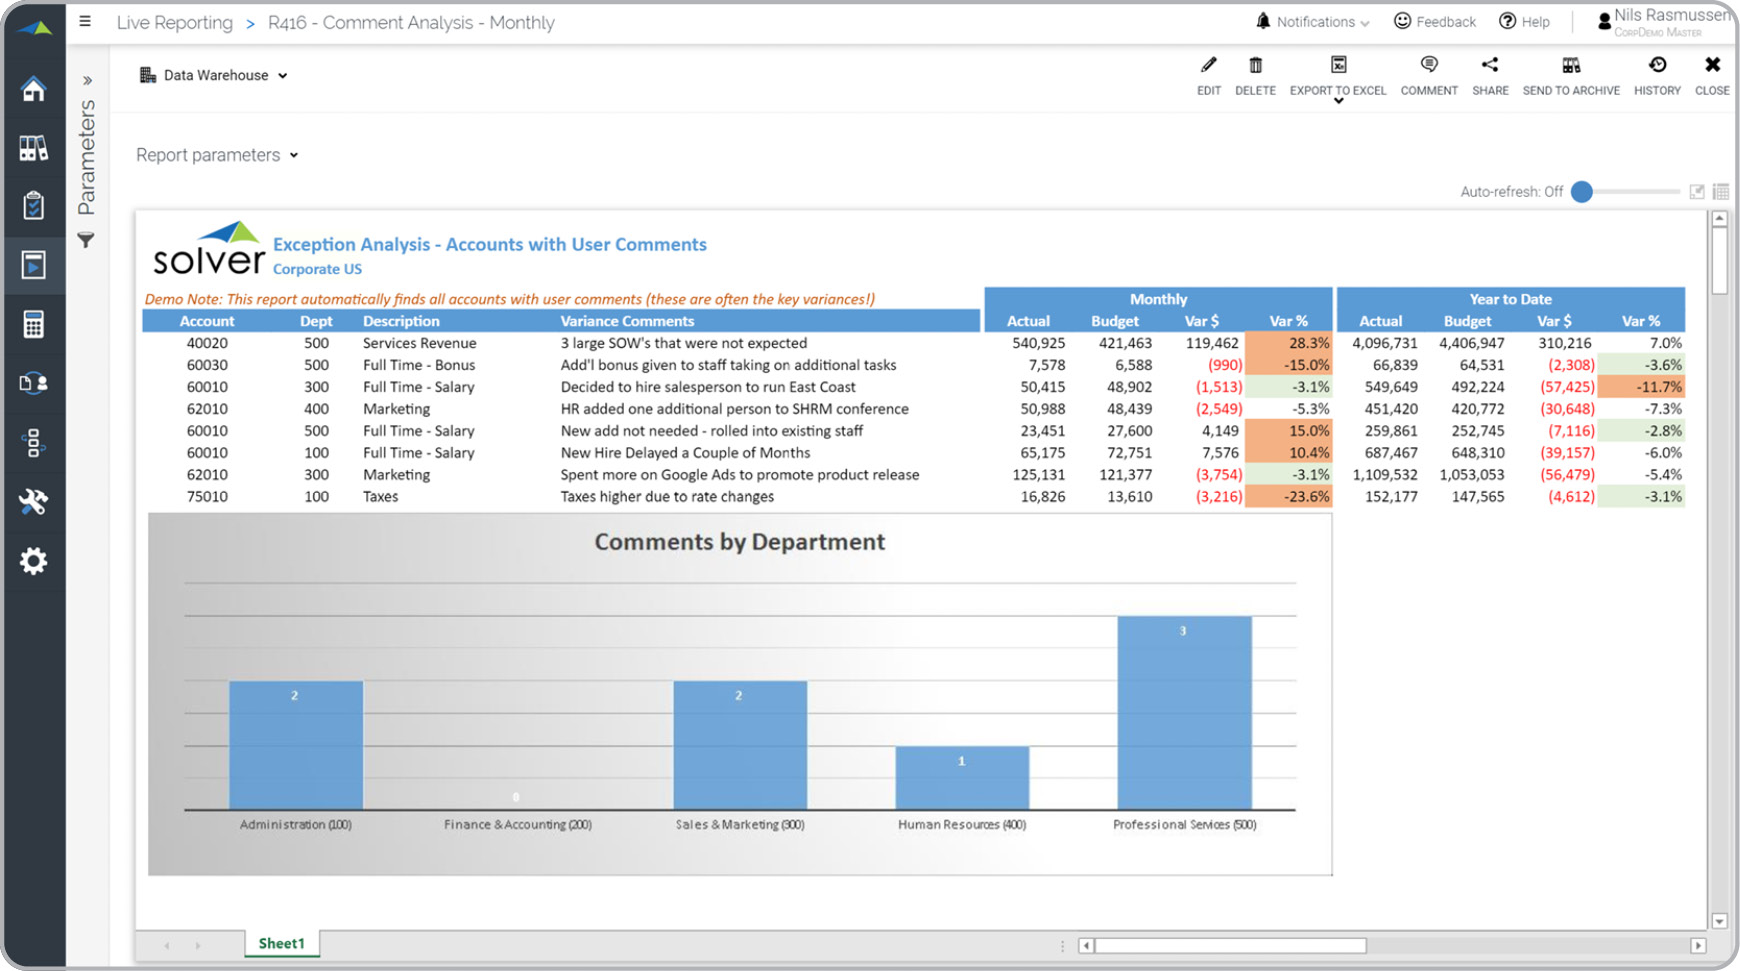
Variances with User Comments
Automatically finds accounts with text comments and displays them with variance analysis.
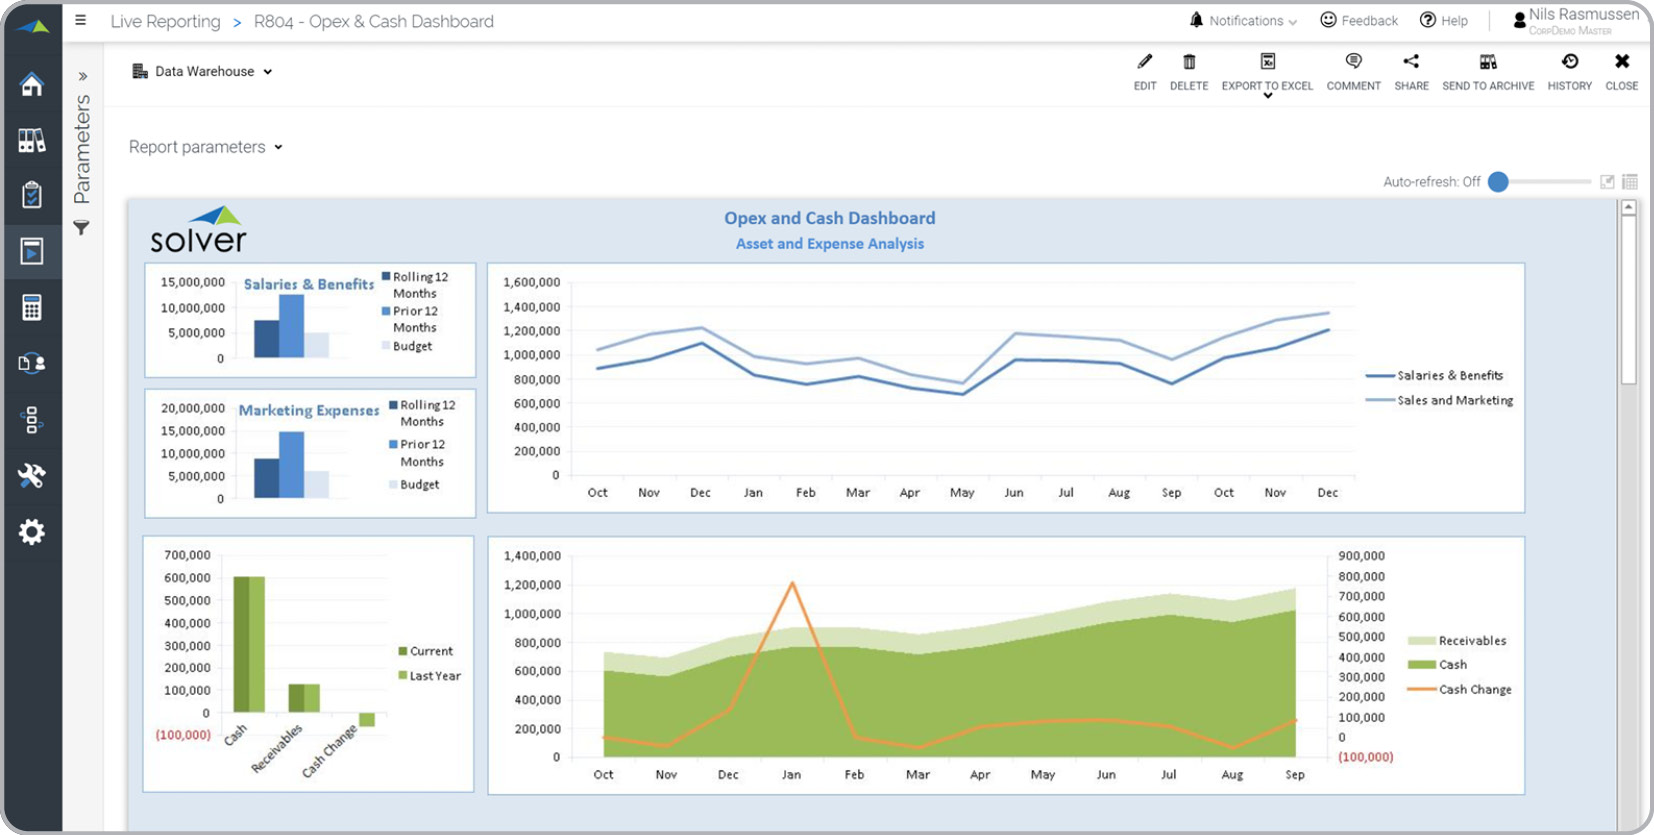
Asset and Expense Trend Analysis
Shows 15-month graphical trend analysis of expense groups and 12 months for key assets.
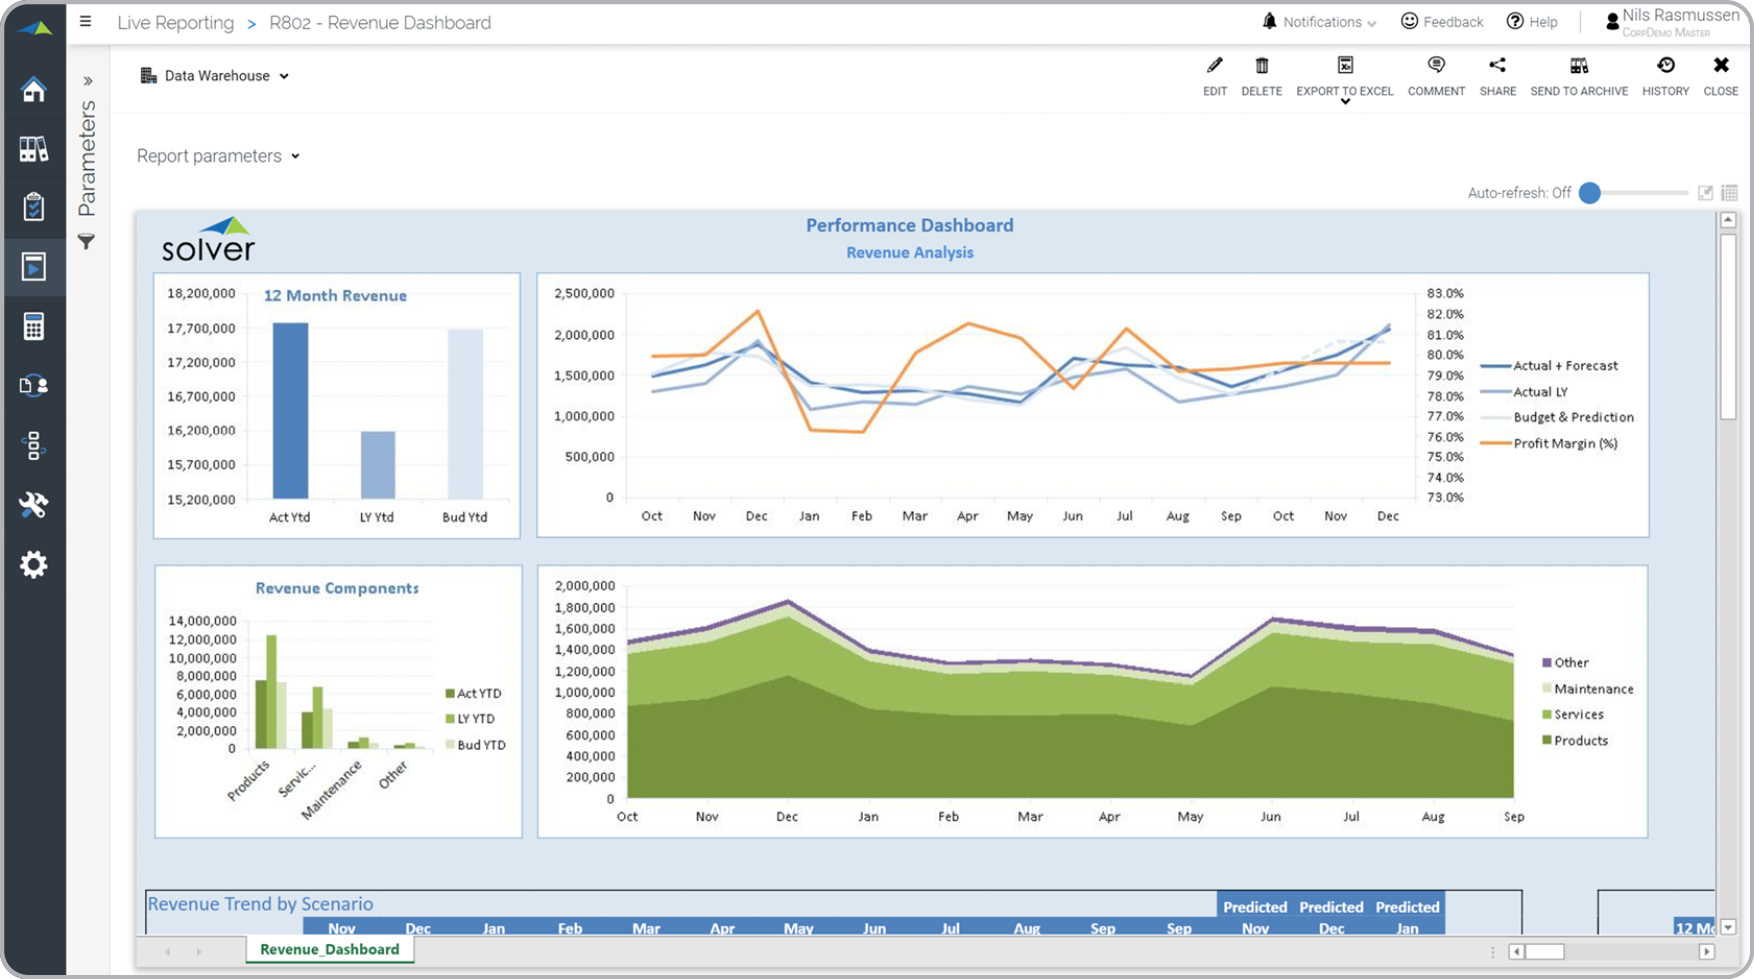
Revenue – Rolling Trend Analysis
Shows 15-month graphical trend analysis of revenue categories with budget and predictions.
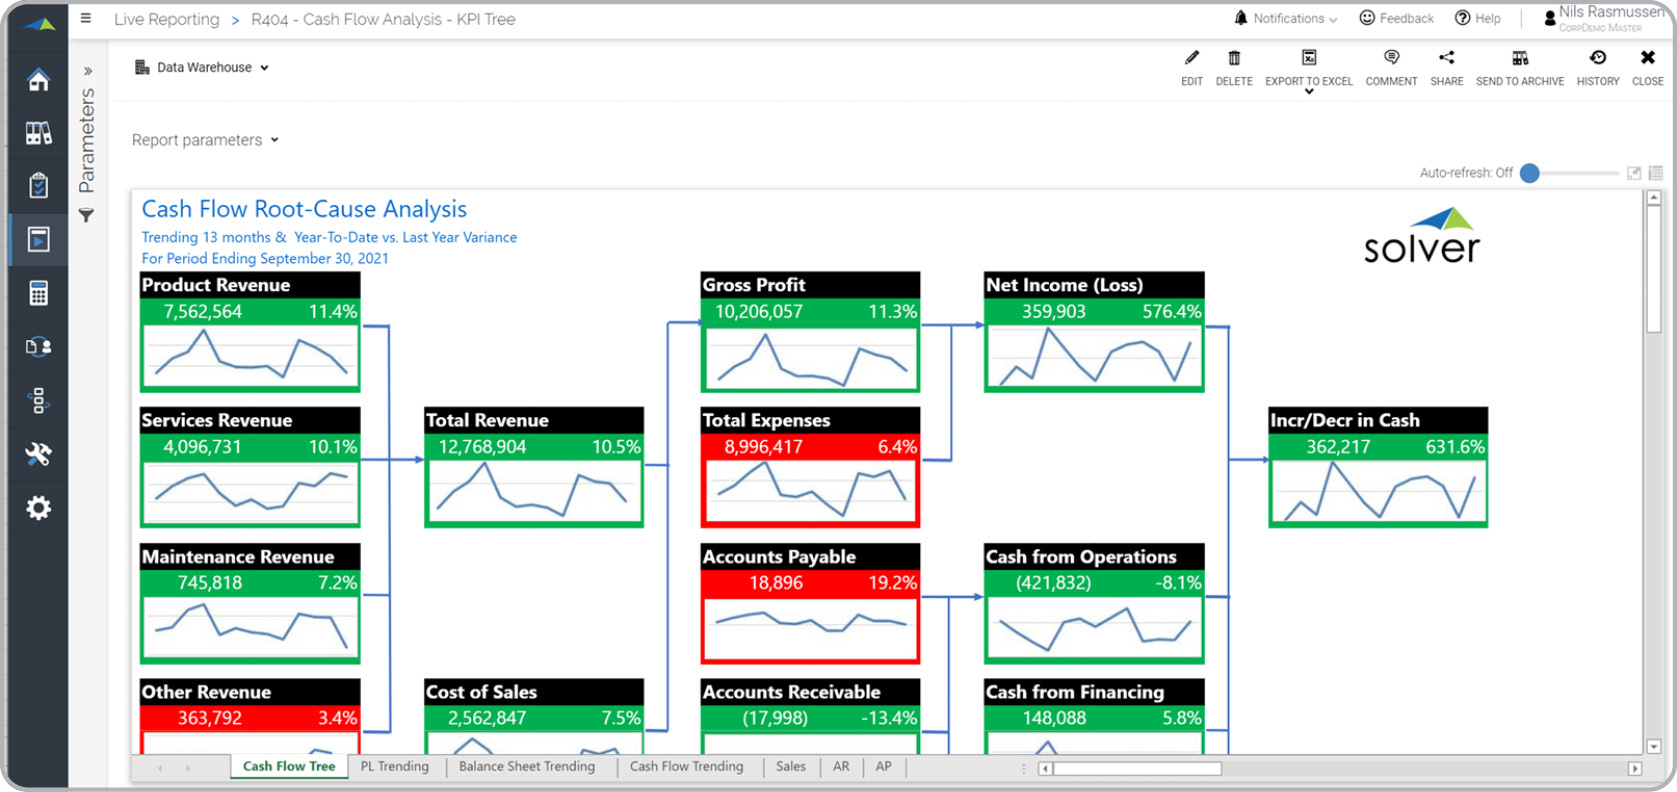
Cash Flow Analysis Tree
Provides easy root cause analysis of cash flow drivers, with 13-month trend and color alerts.
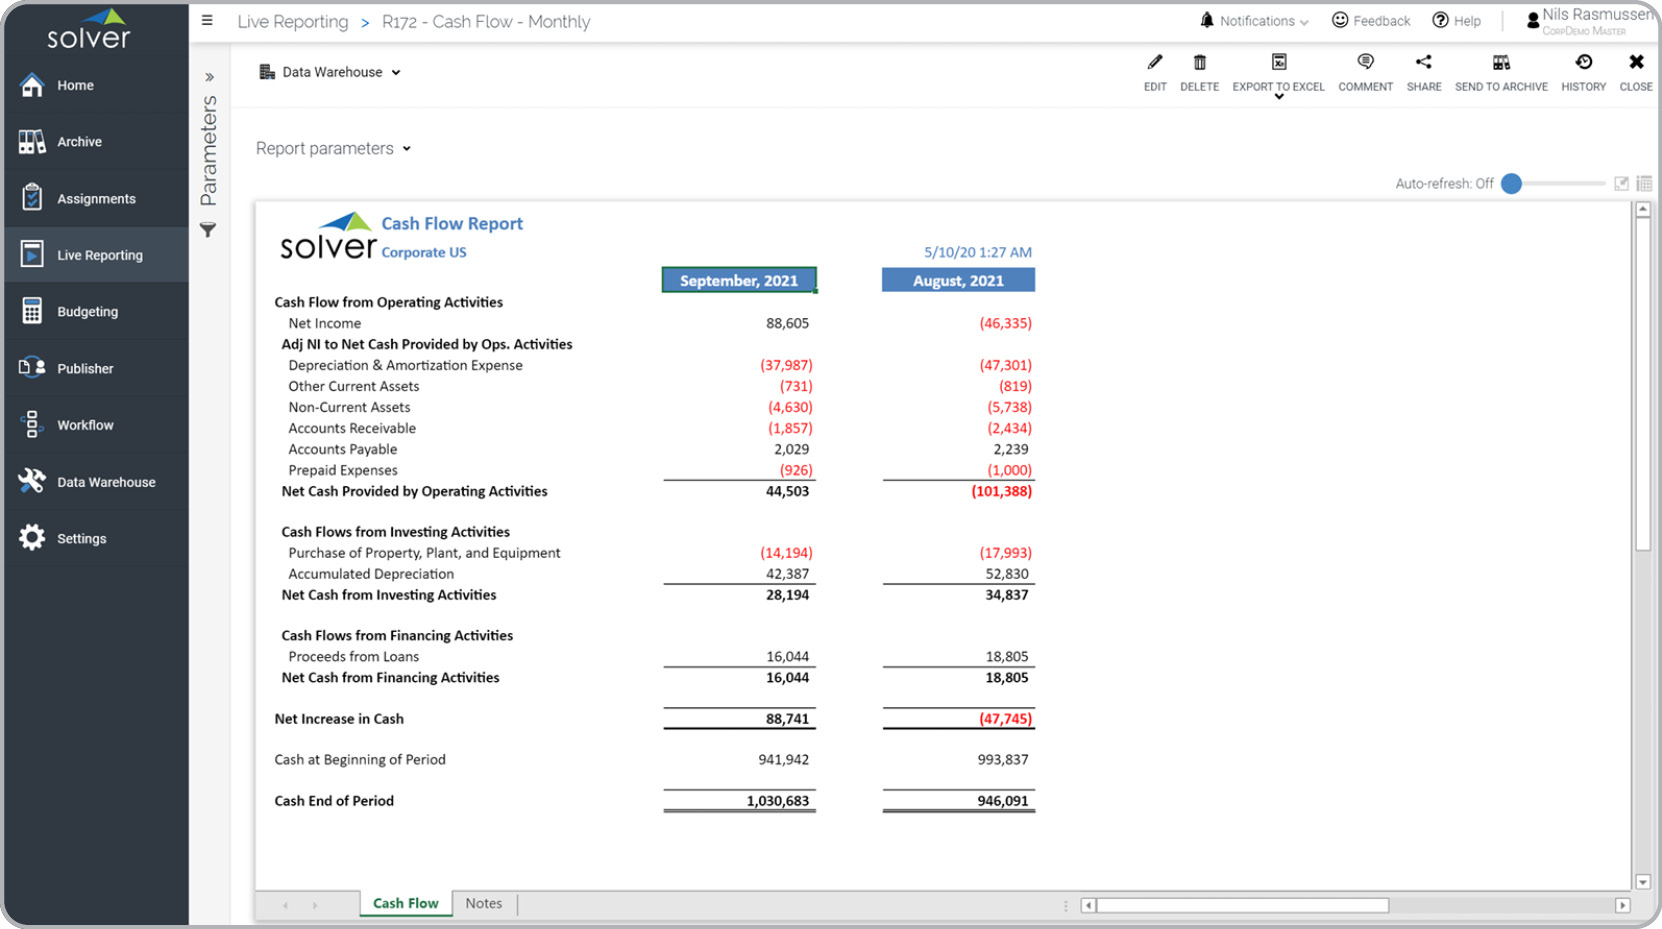
Cash Flow – Monthly
Indirect Cash Flow that shows current and prior month.
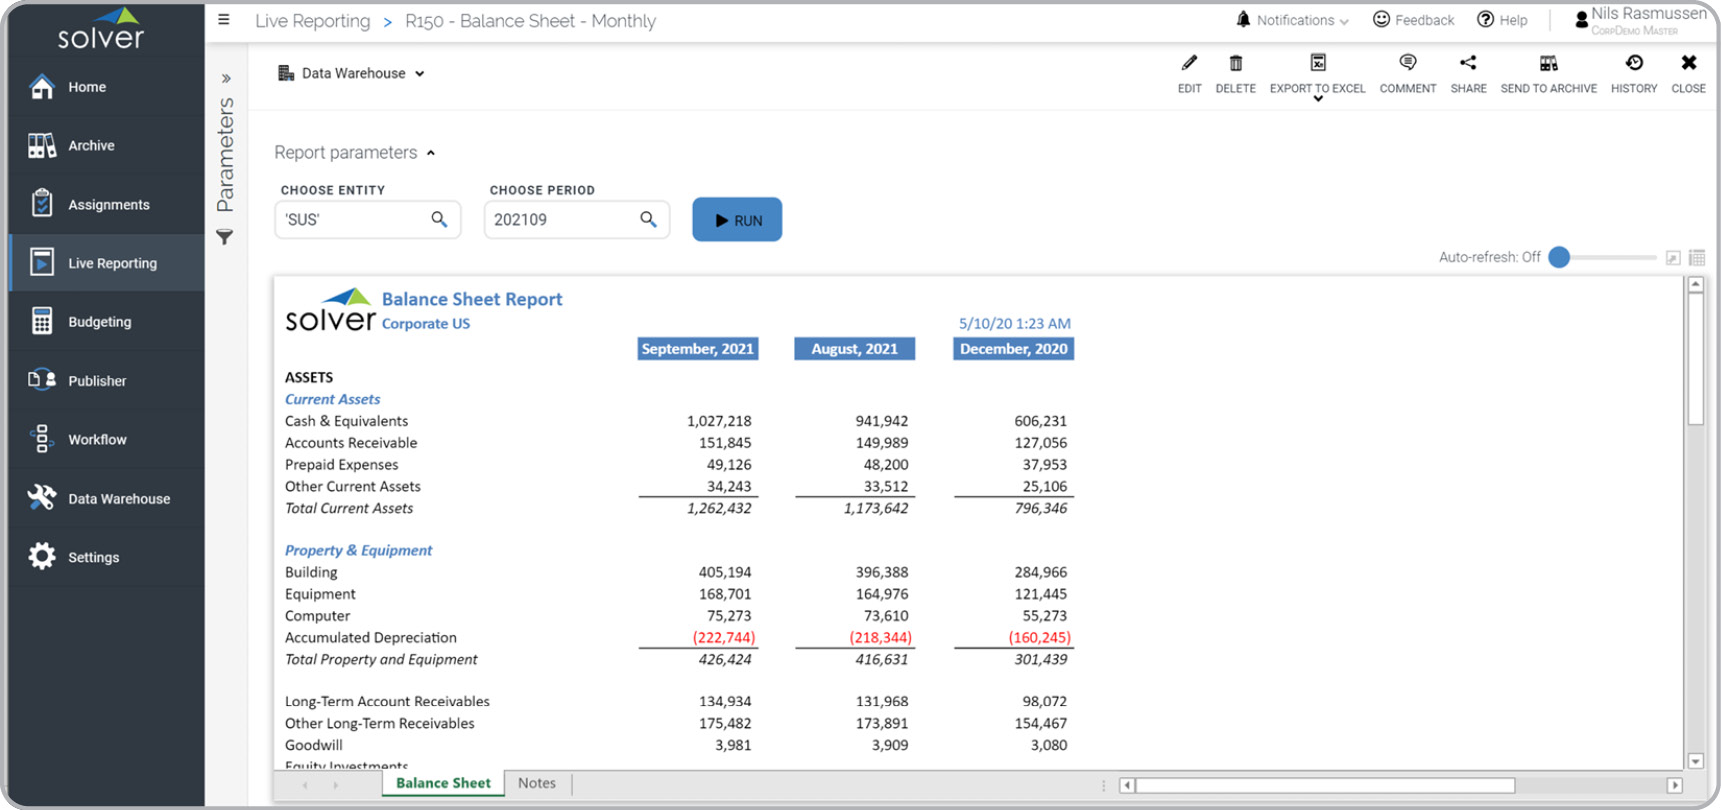
Balance Sheet – Monthly
This report compares the current month to prior month and last year's ending balance.
P&L – Trended, Current vs Last Year
Trended P&L that shows variance for each month versus prior year.
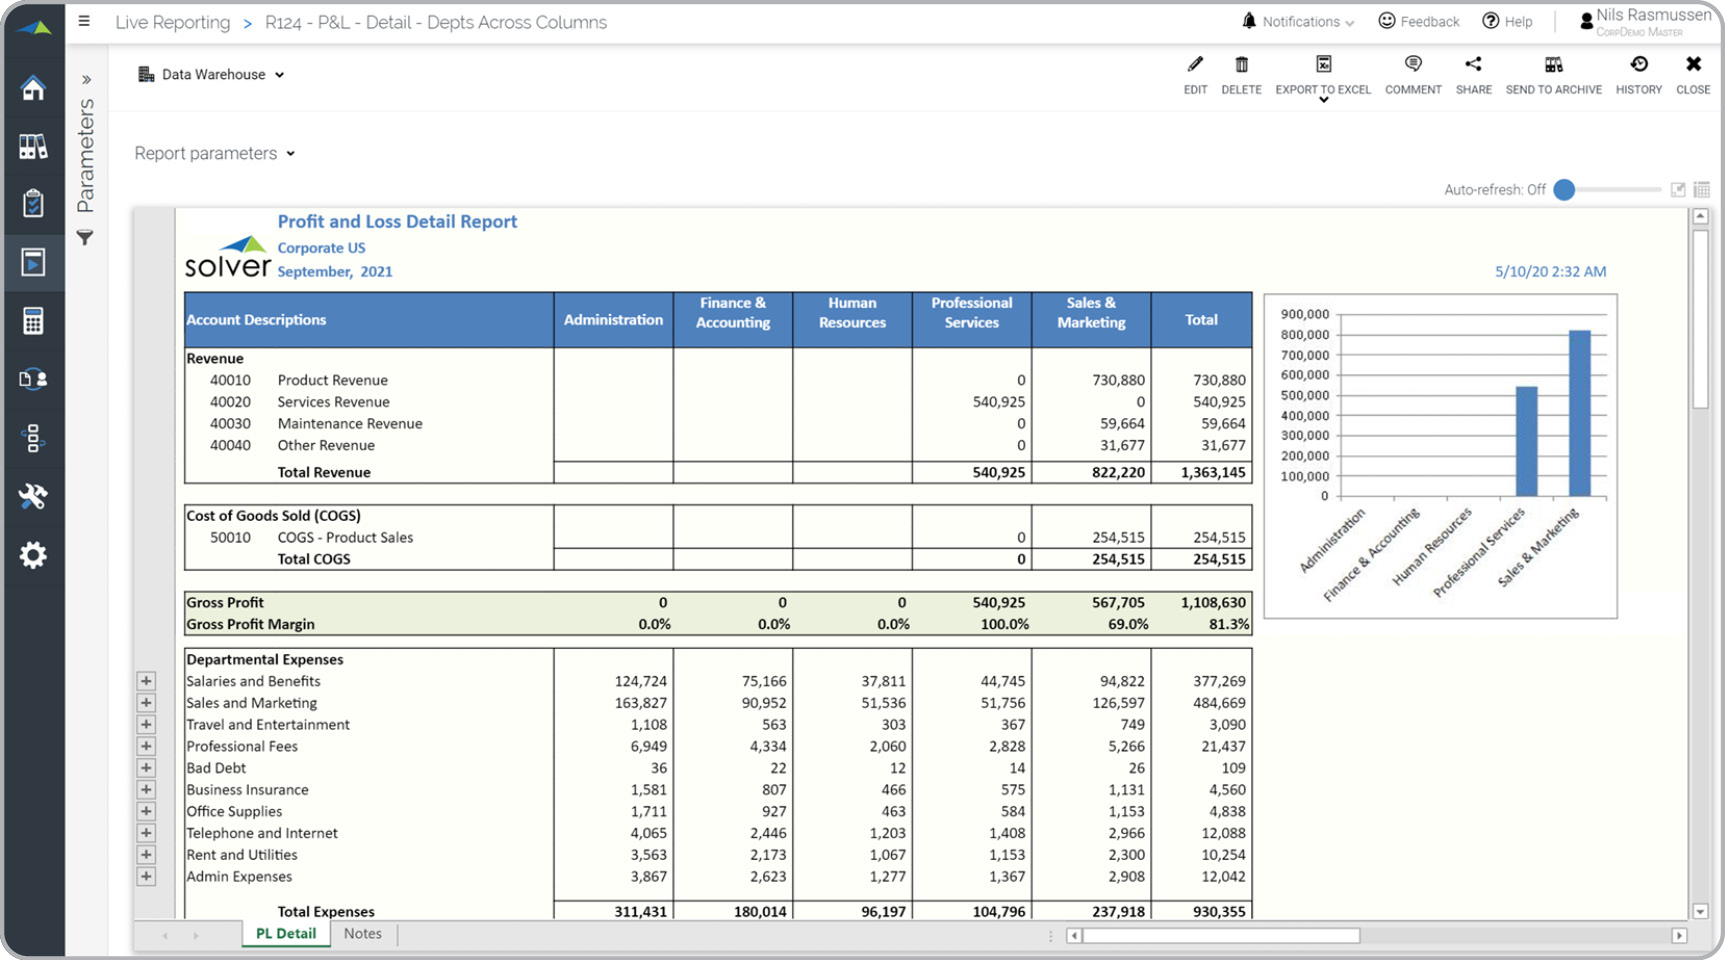
P&L – Departments in Columns
Compares departments across columns with consolidated total.
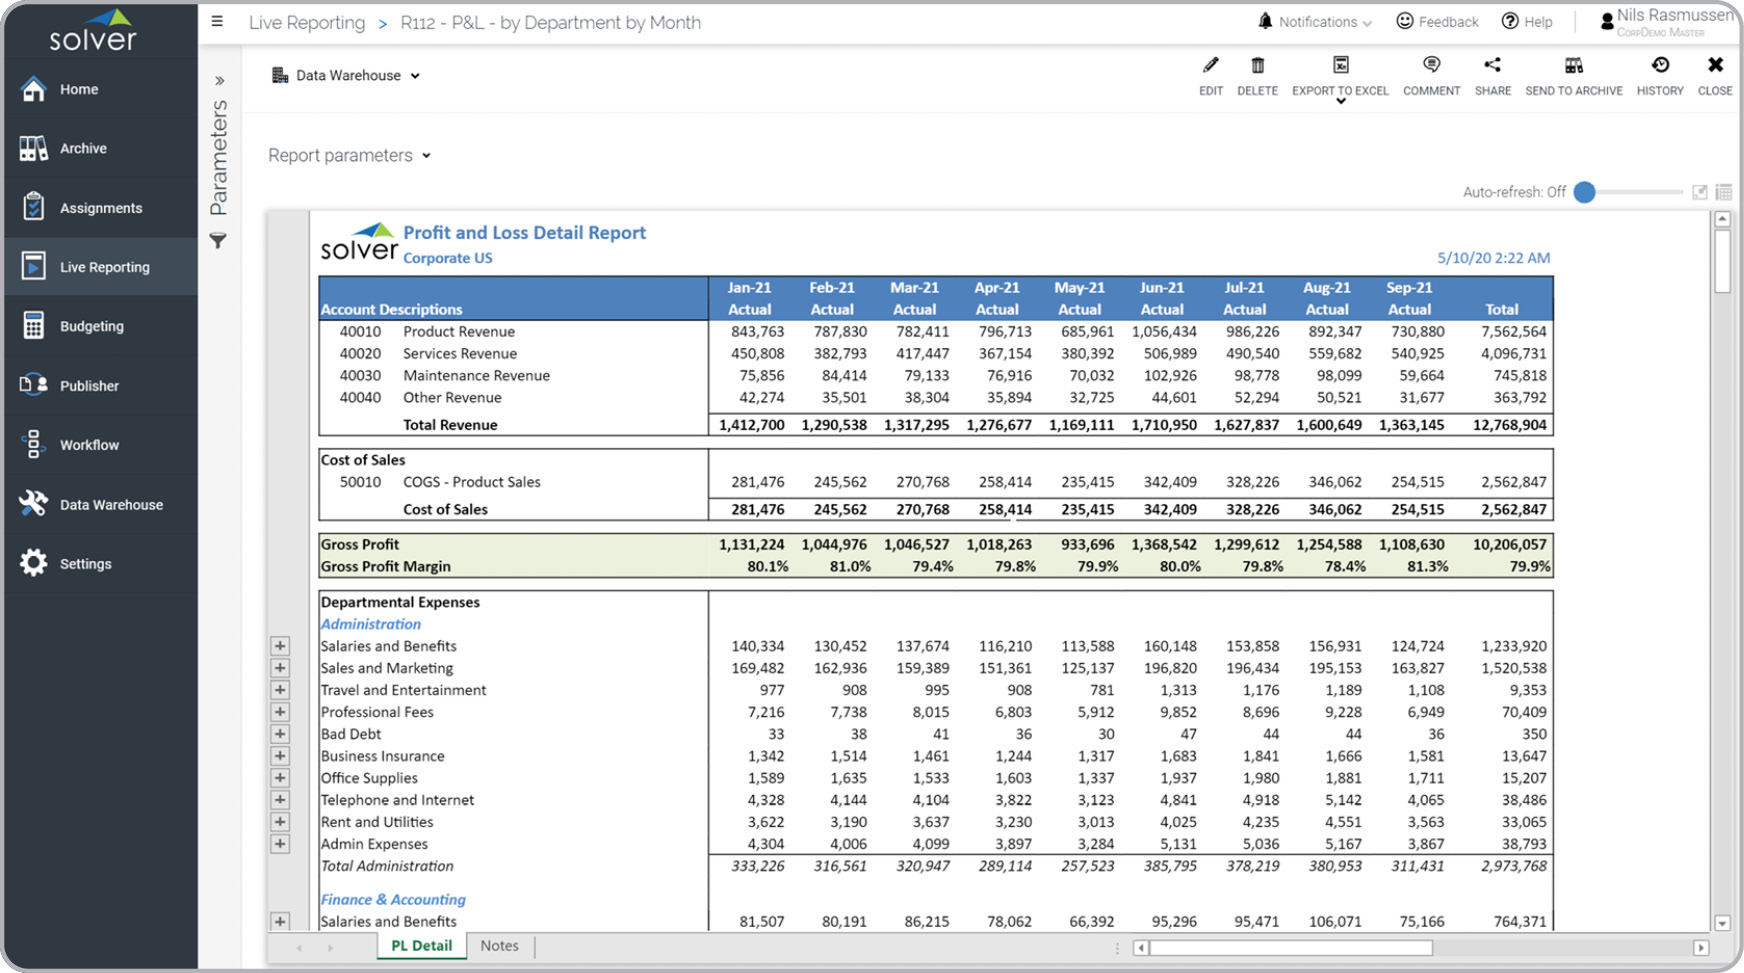
P&L – Trended with Accounts by Department
Trended P&L by month and accounts grouped by department in the rows.
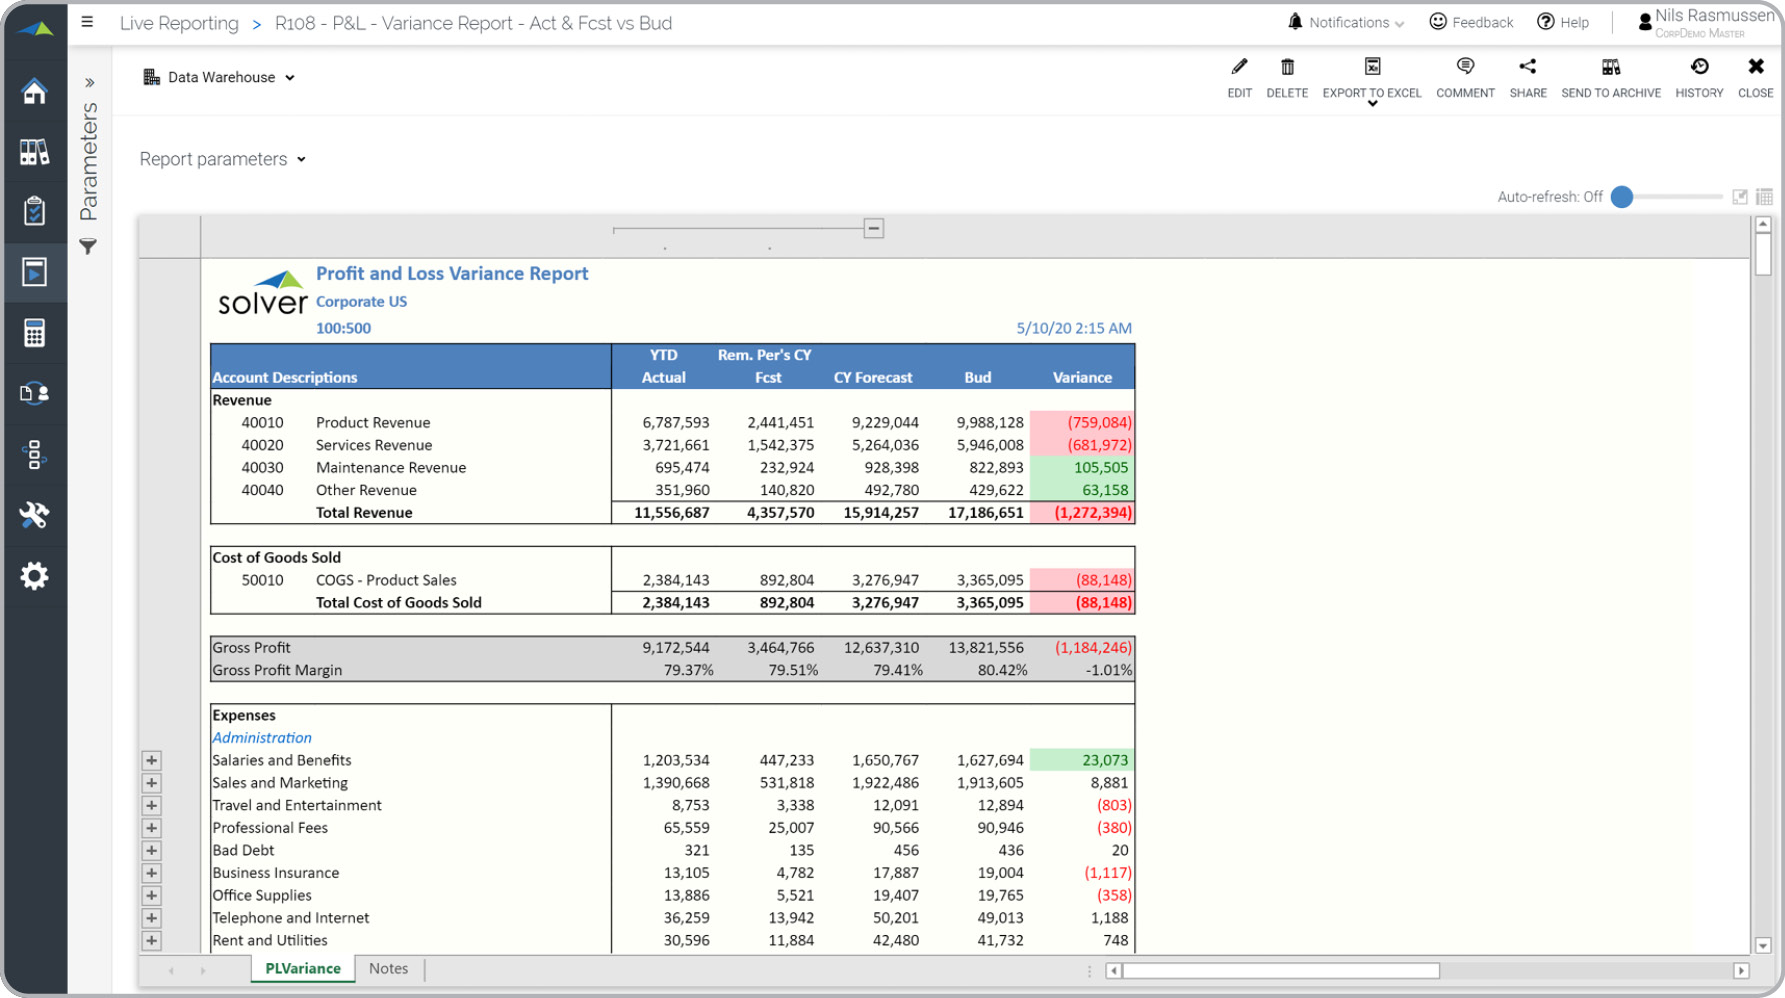
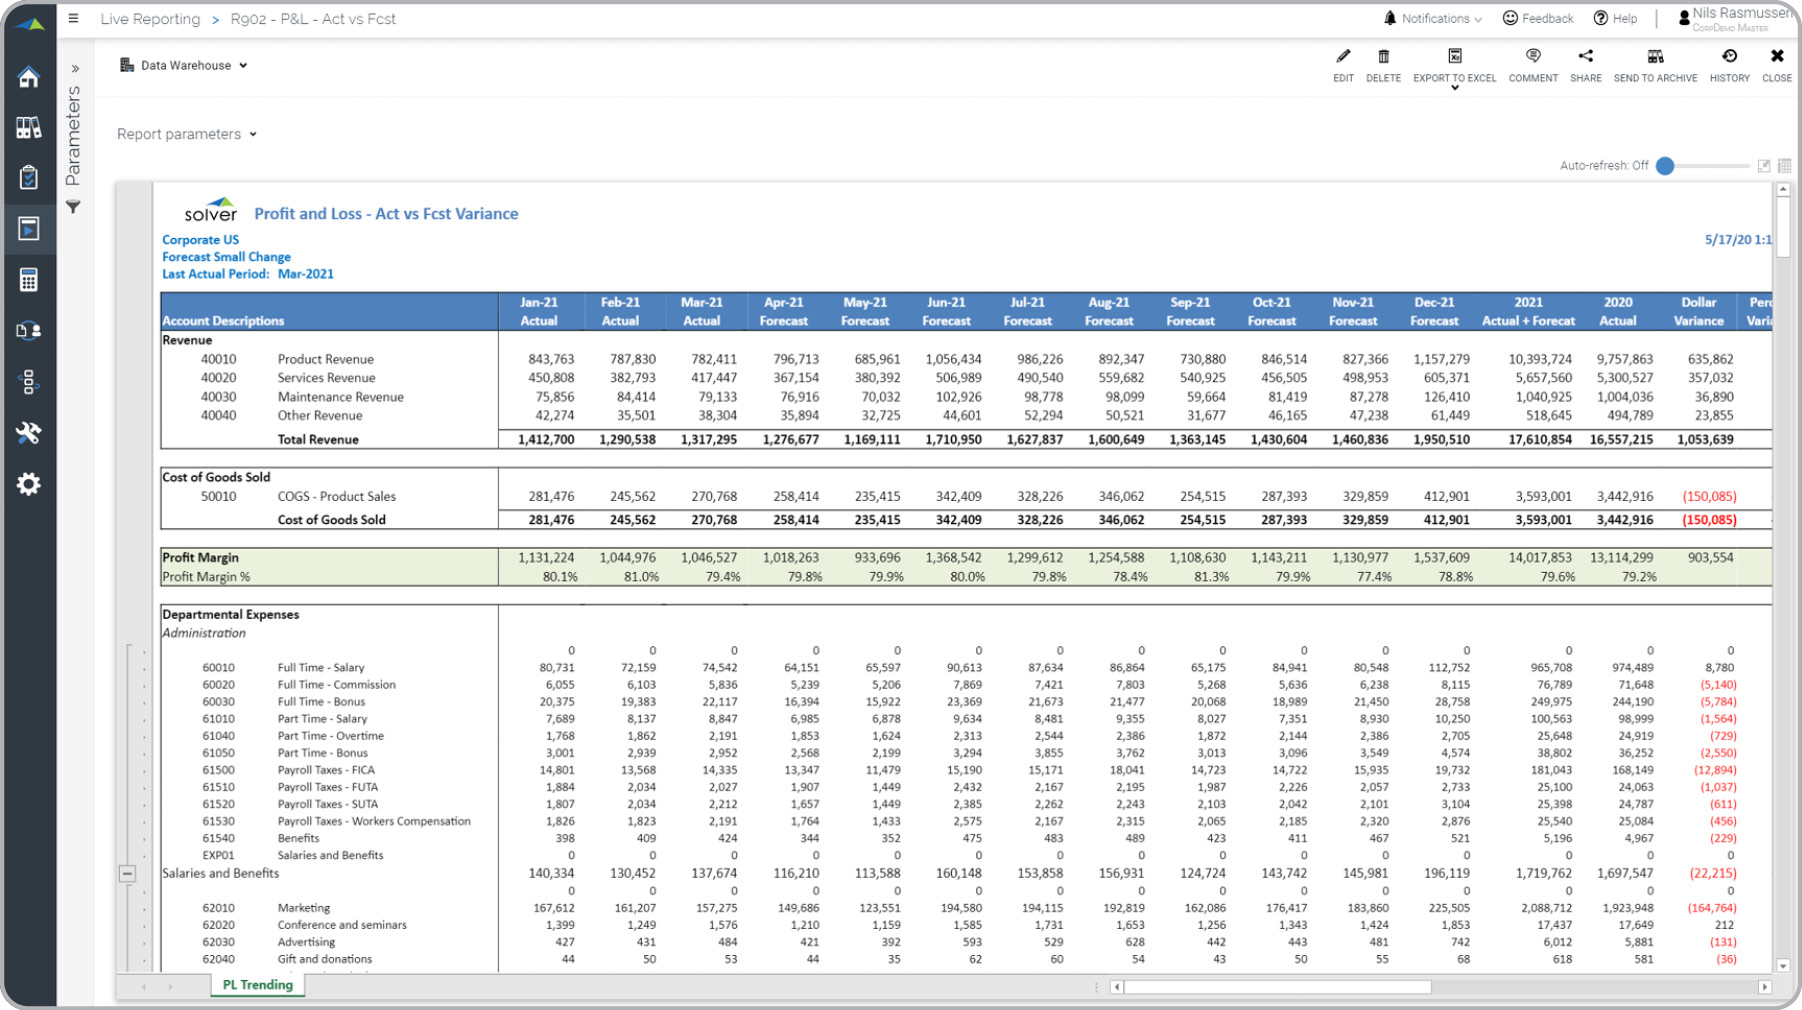
P&L – Estimate with Act and Forecast
P&L that provides an estimate with actual YTD + forecast and compares to original budget.
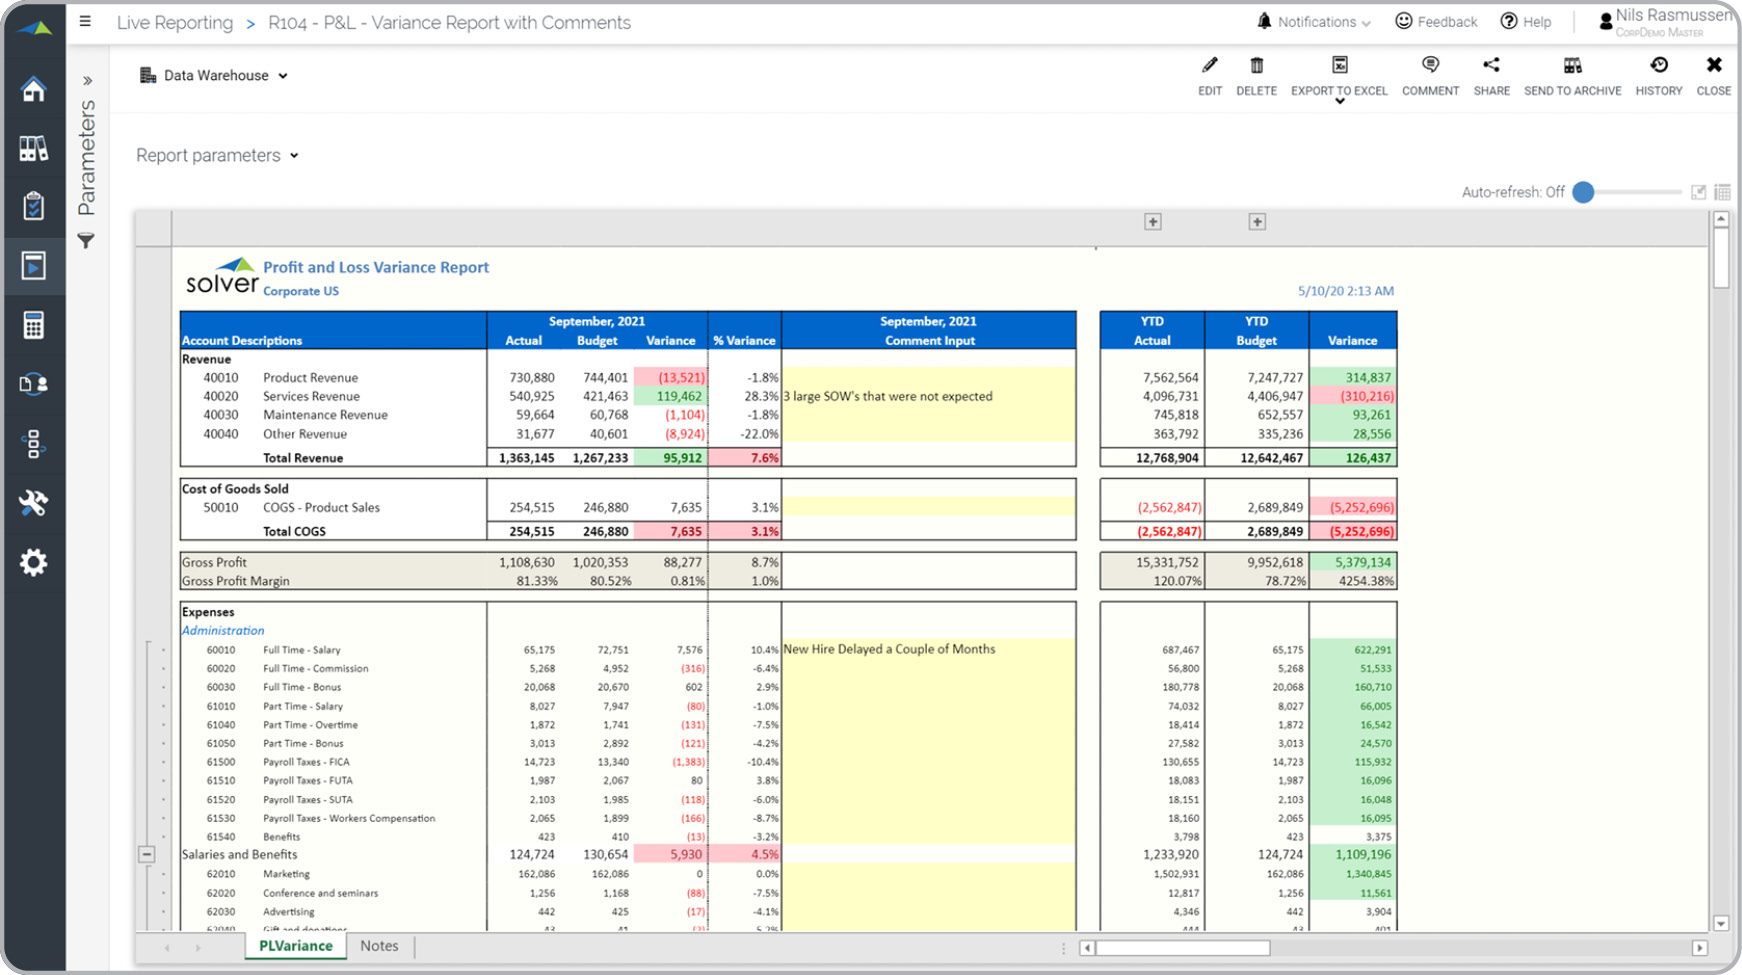
P&L – With Comment Column
Special P&L design with comment input for the current month.
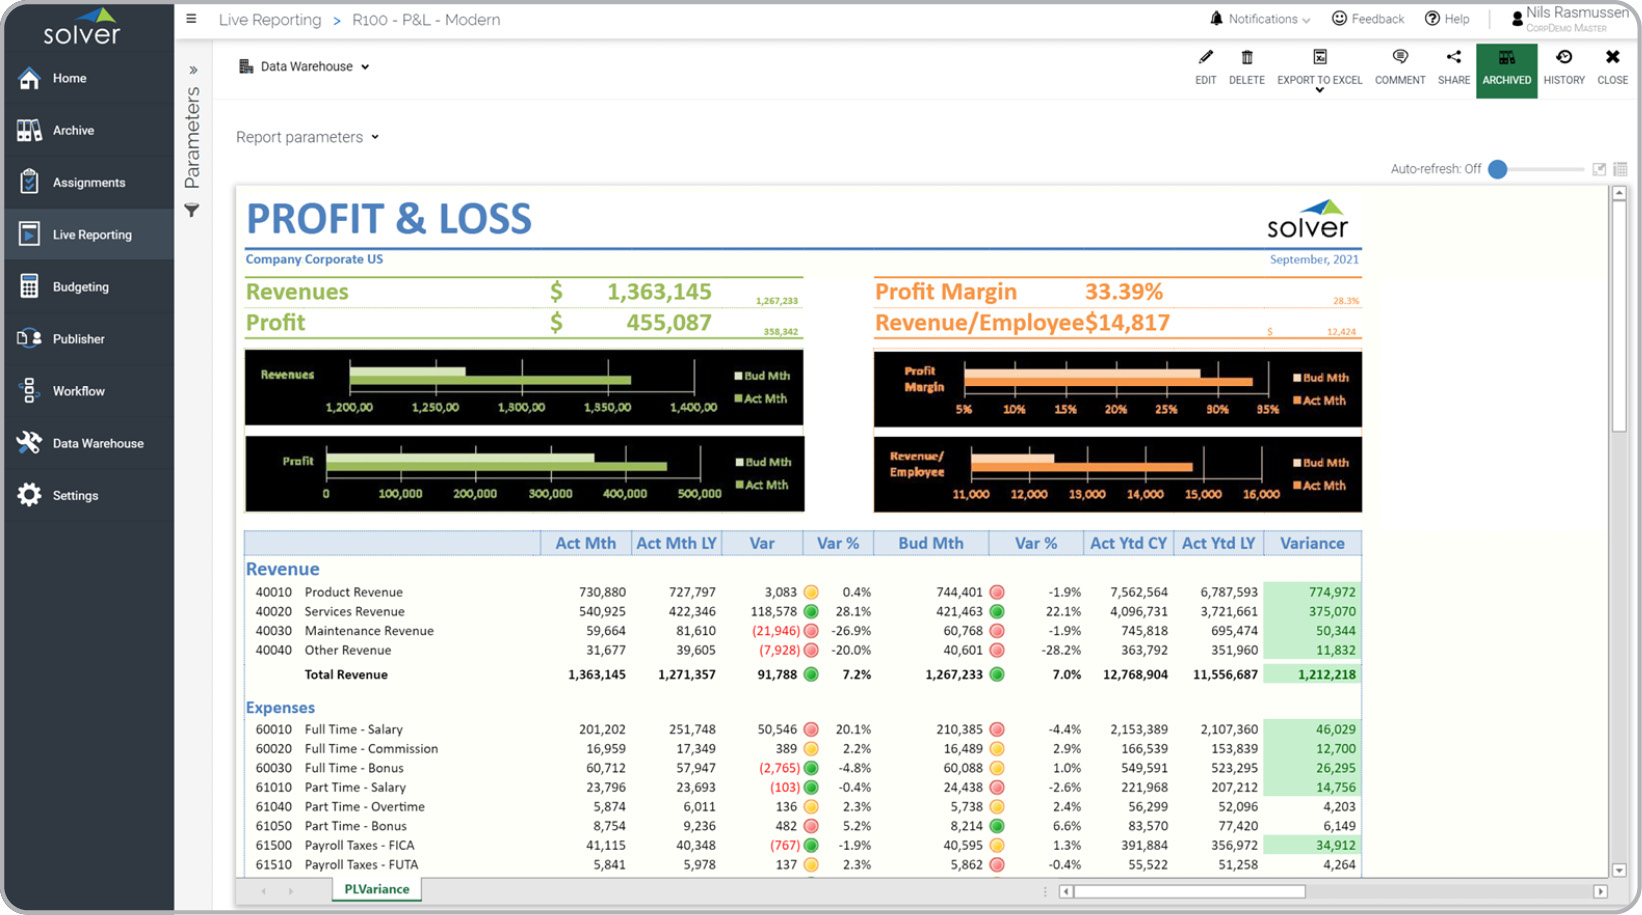
P&L – Variance, Modern Design
P&L variance report with modern design gives users quick KPI highlights with charts.
P&L – Estimate vs Budget
Compares actual to forecast and budget, and compares full year budget to actual + forecast.
P&L – Variance vs Last Year and Budget
Compares current month and YTD to last year and budget, with expandable YTD columns.
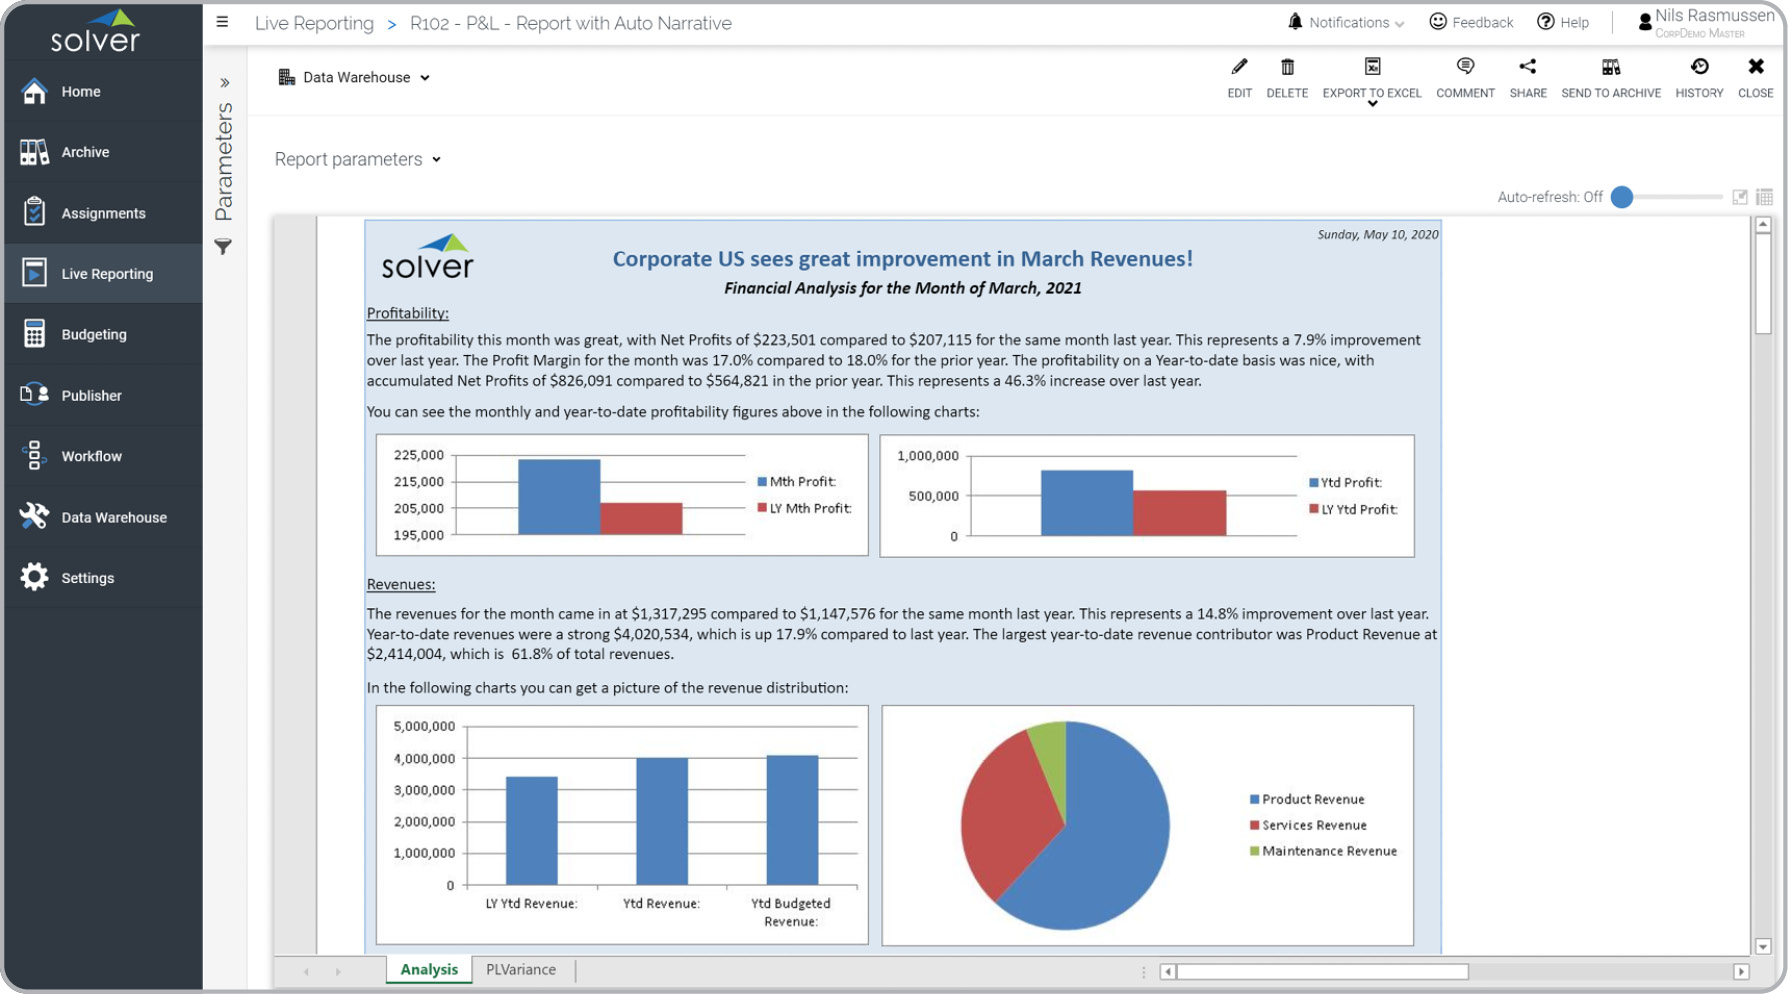
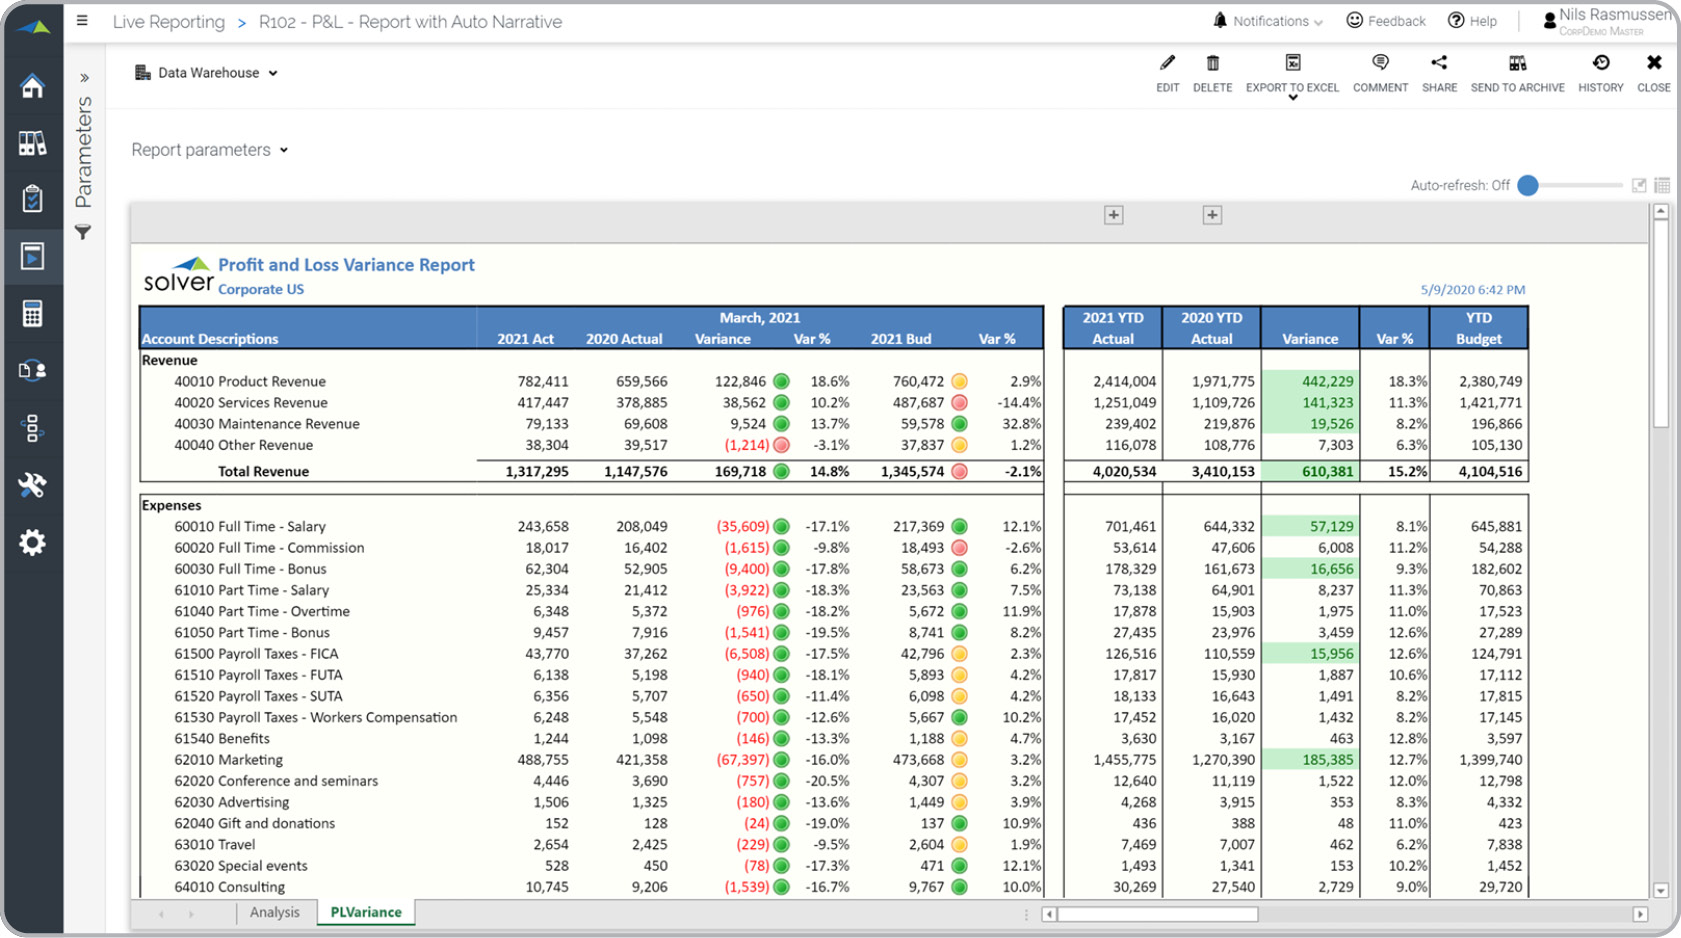
P&L – Auto Narrated
This report is typically used as a cover page and automatically narrates financial highlights.
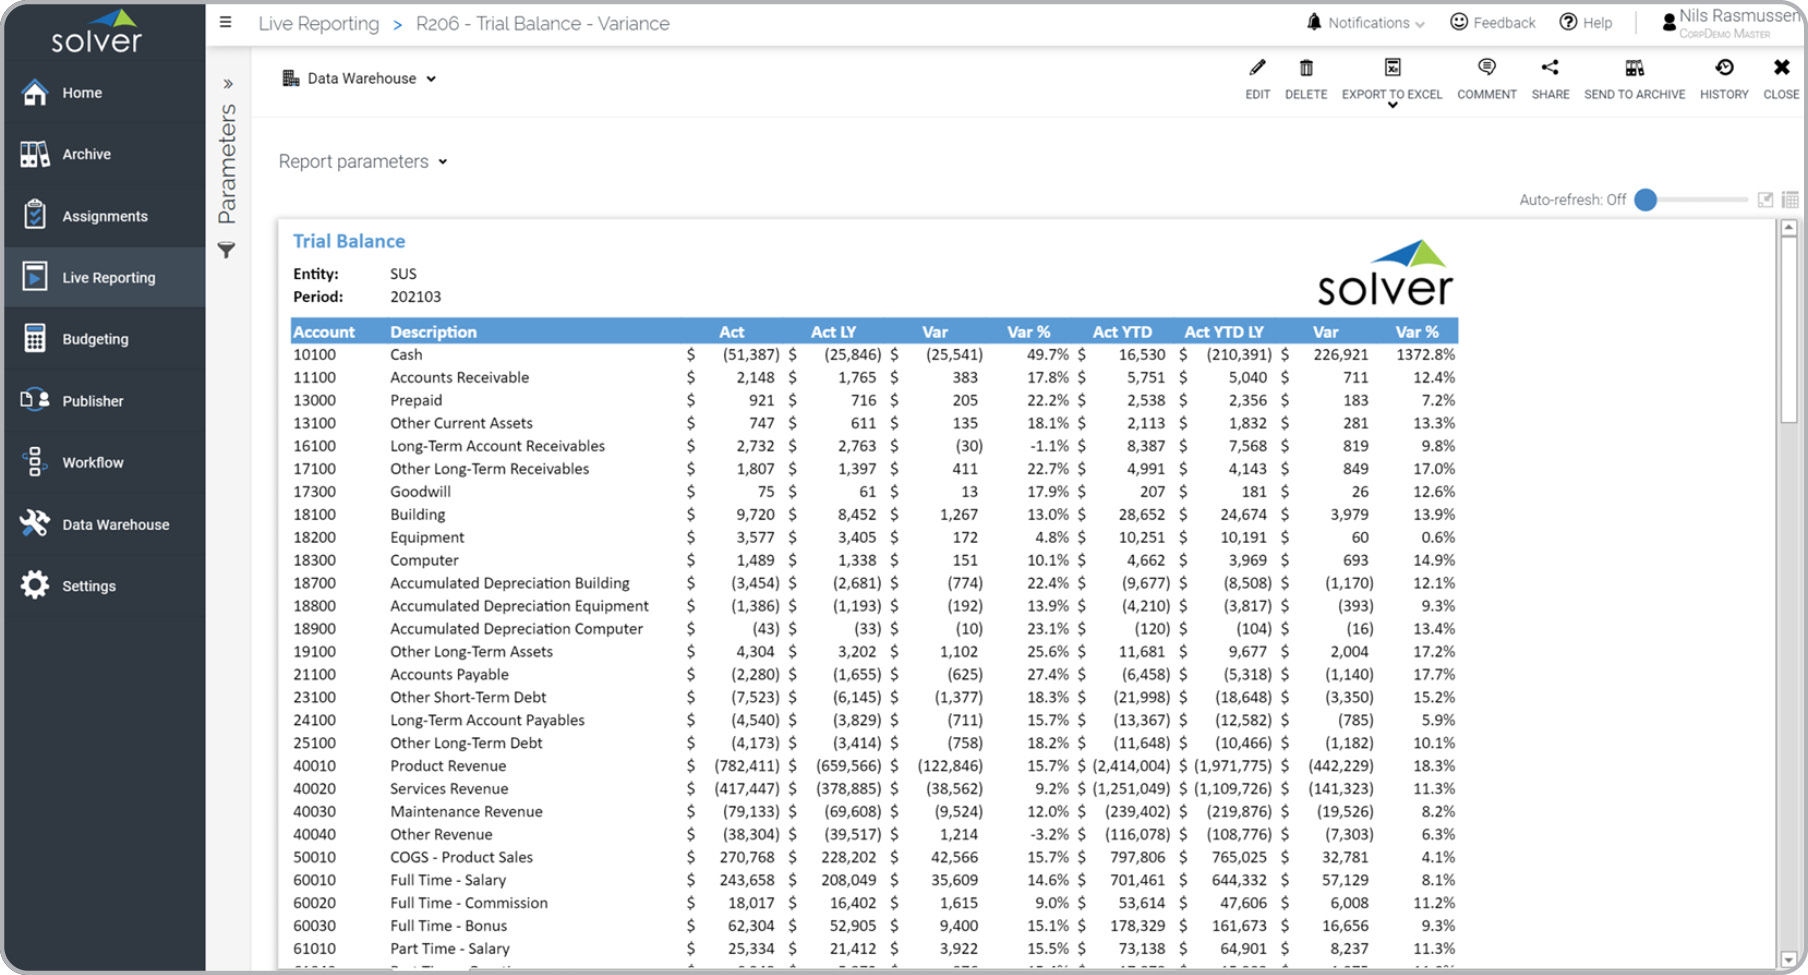
Trial Balance with Variance Analysis
This Trial Balance report helps find discrepancies by comparing to last year's actual figures.
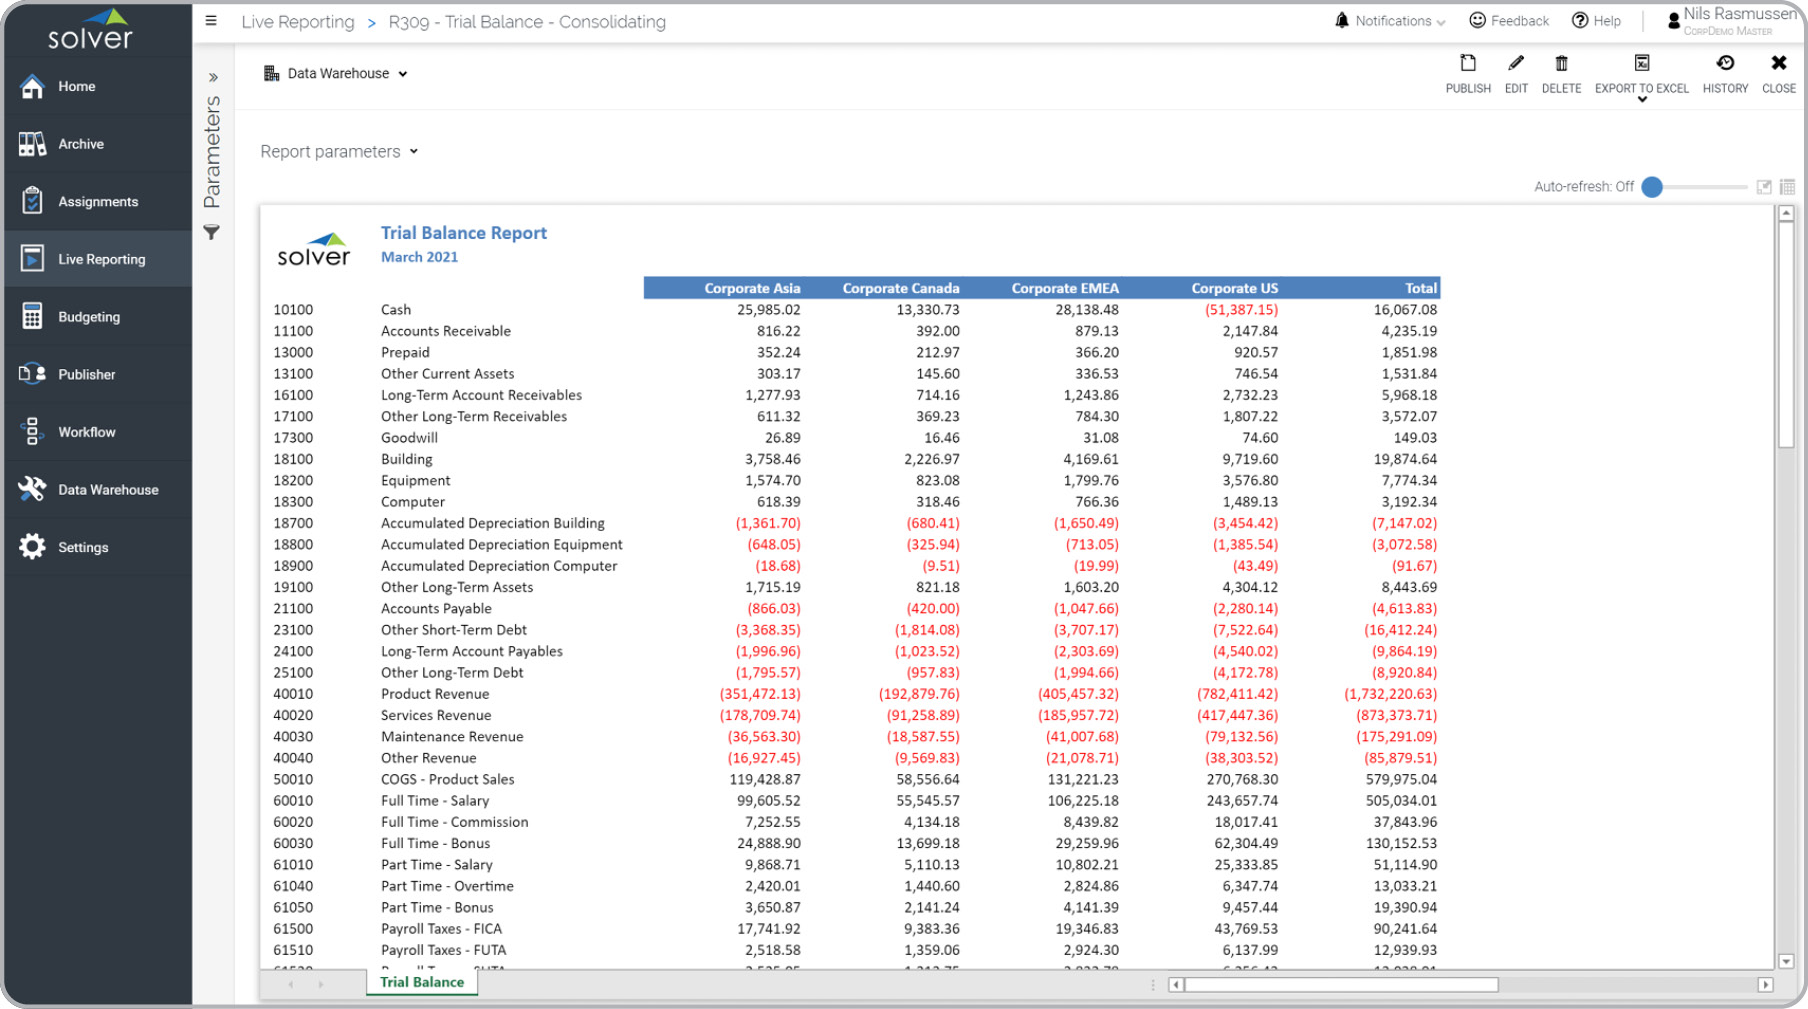
Trial Balance – Consolidating
Displays companies across columns with a consolidated total.
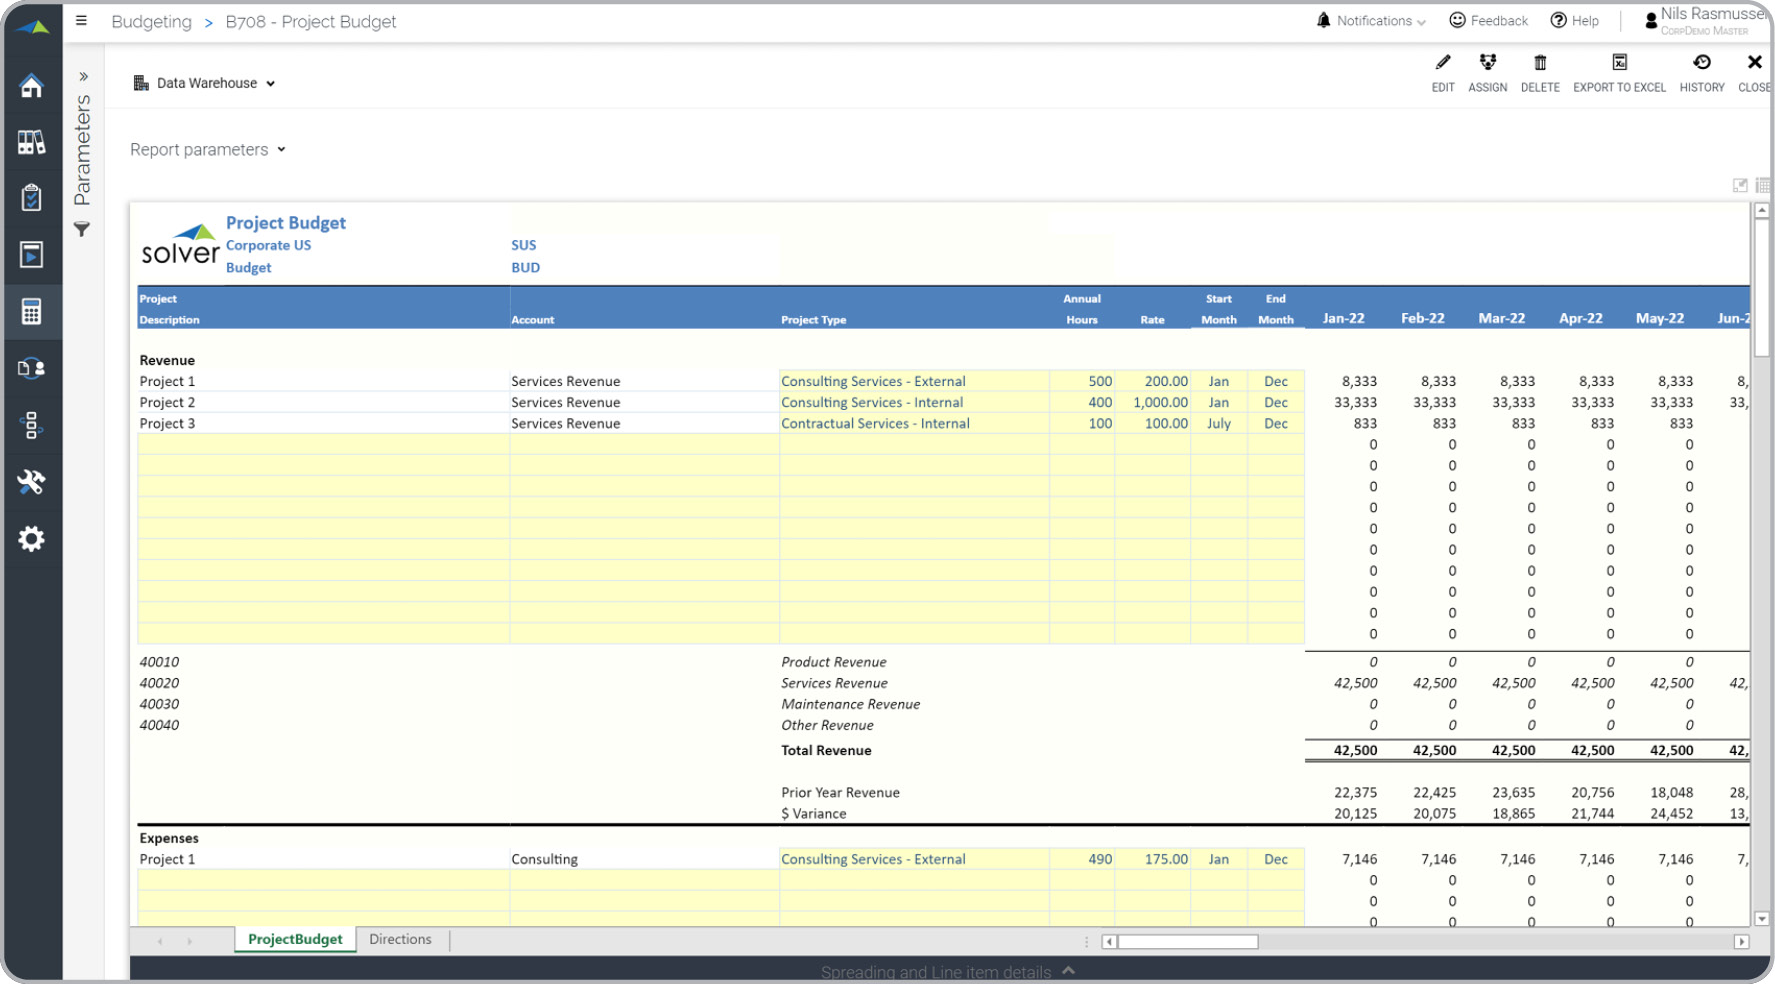
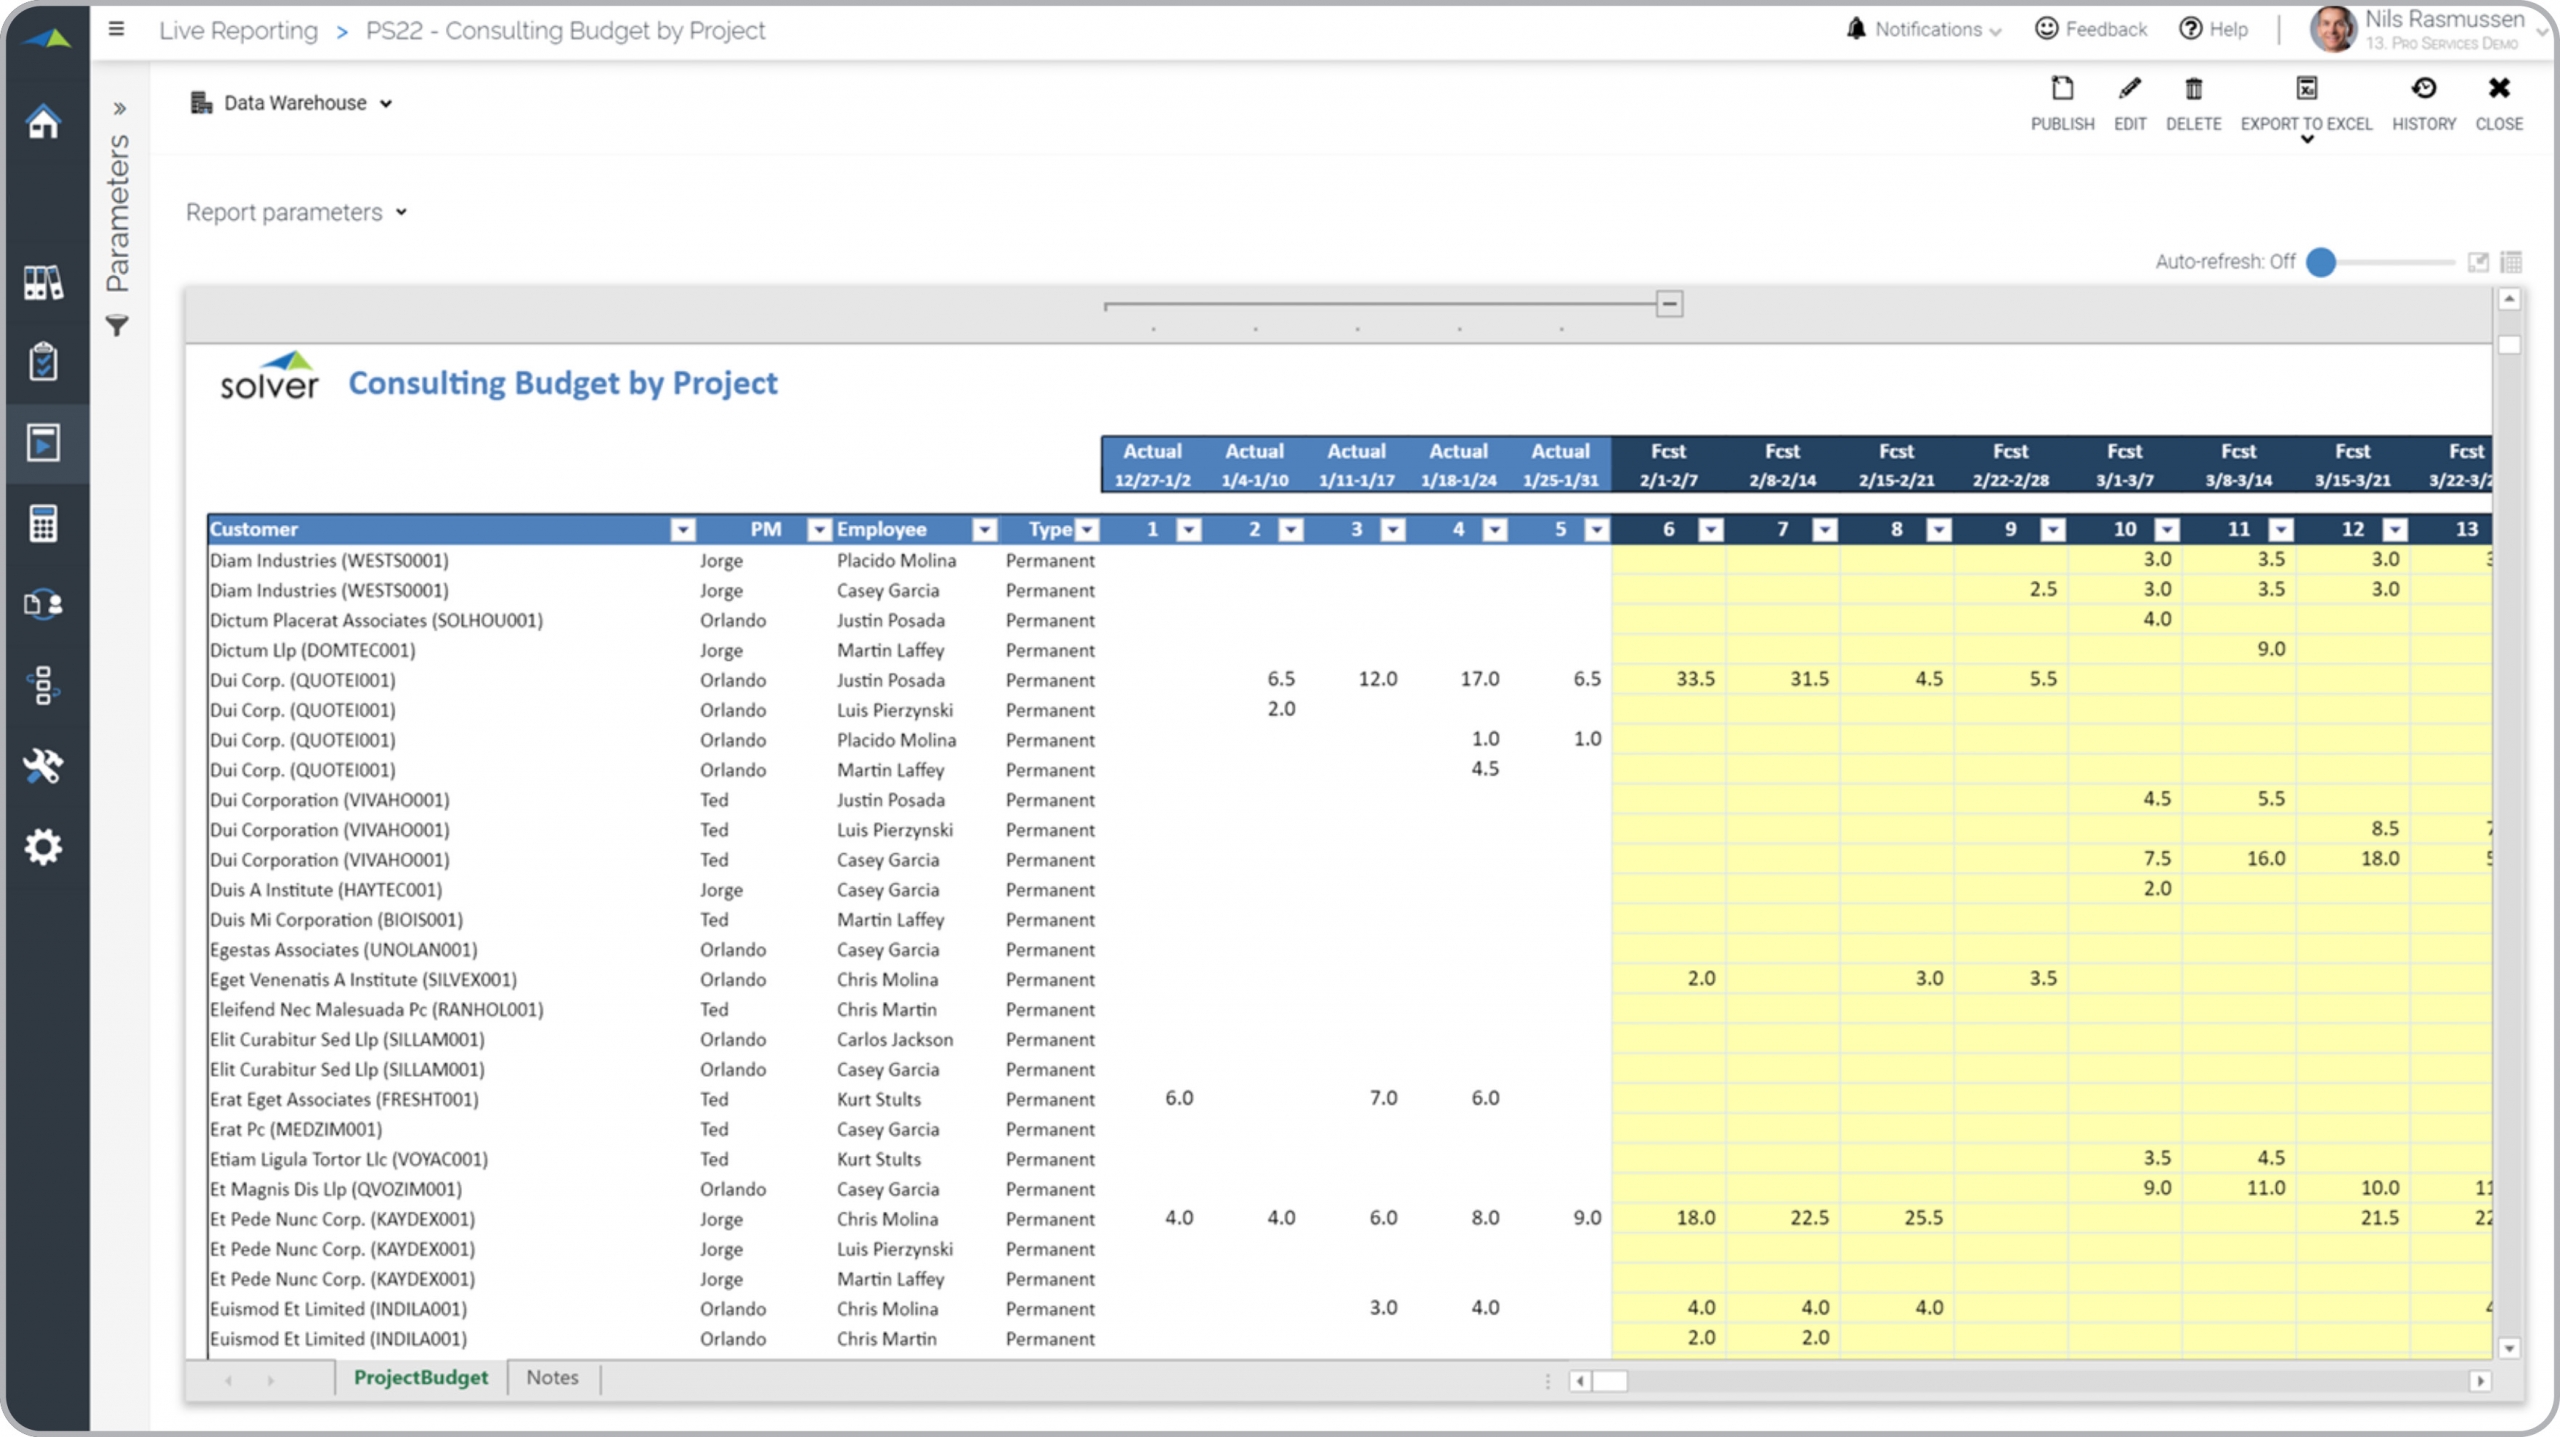
Project Budget
Enter project budgets at any level of detail.
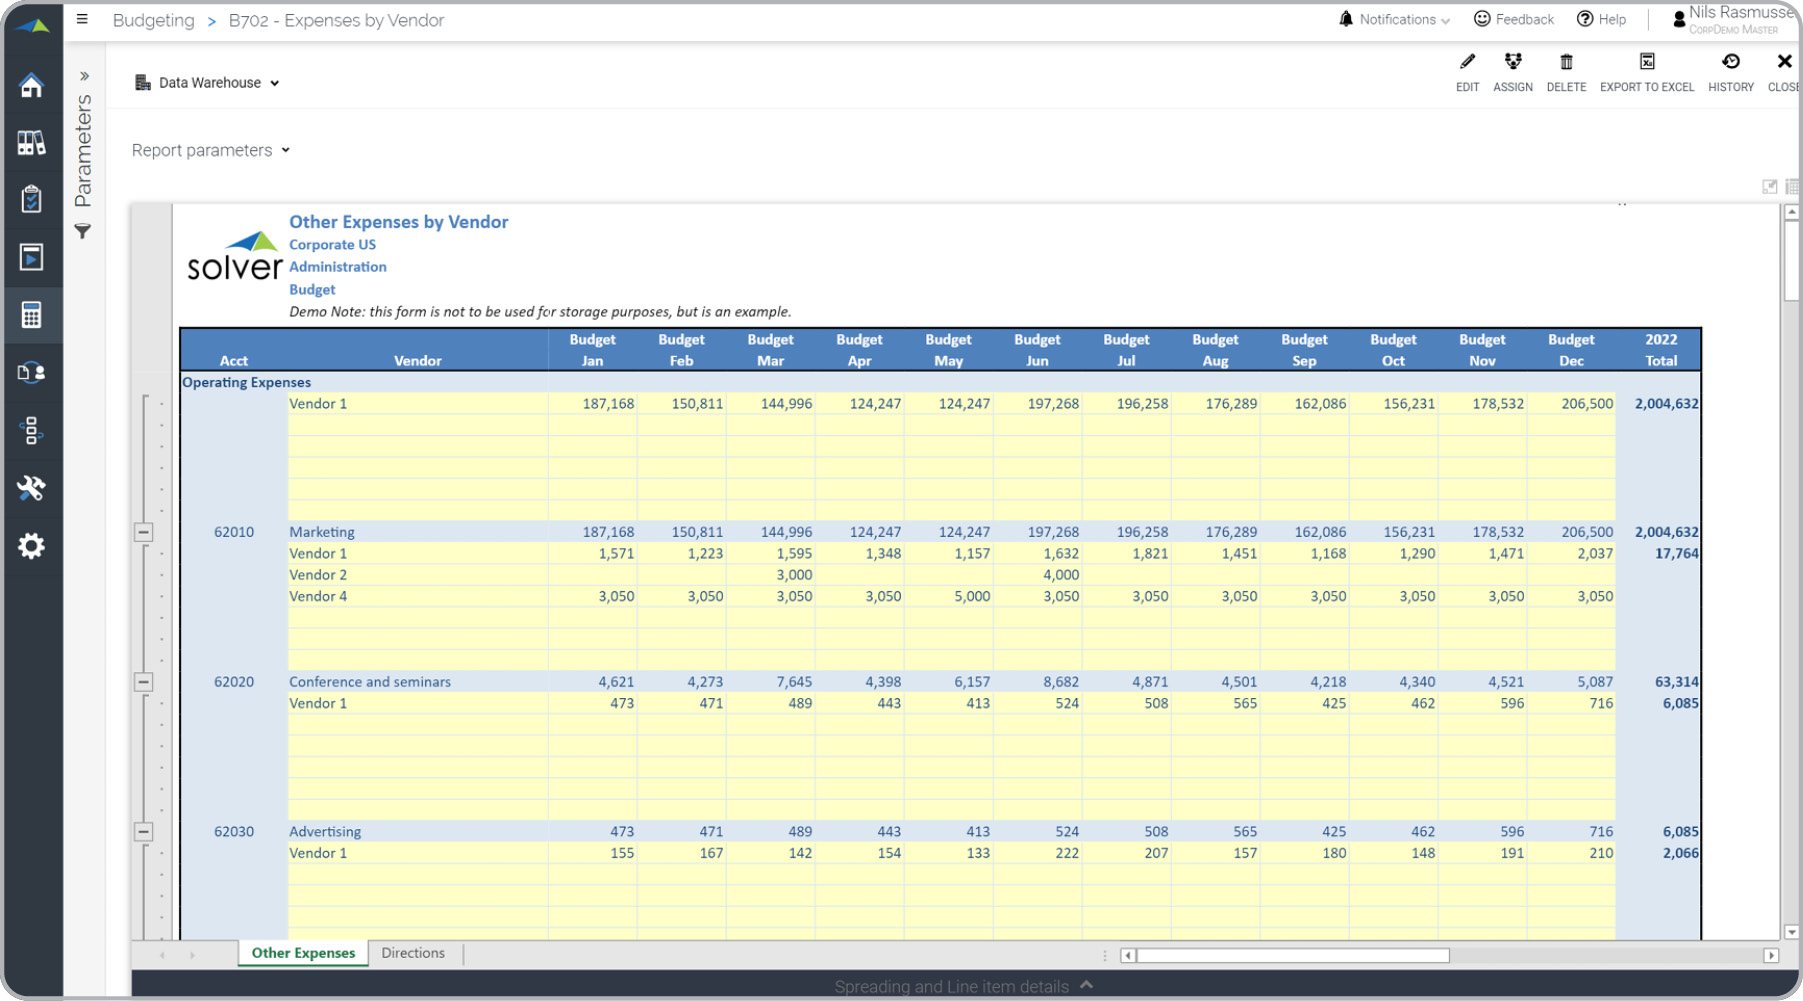
Vendor Expense Budget
Enter budgeted expenses per vendor. Actual history from ERP can also be integrated.

P&L driver-based budget
Input net Income target and algorithms automatically creates revenue and expense budgets.
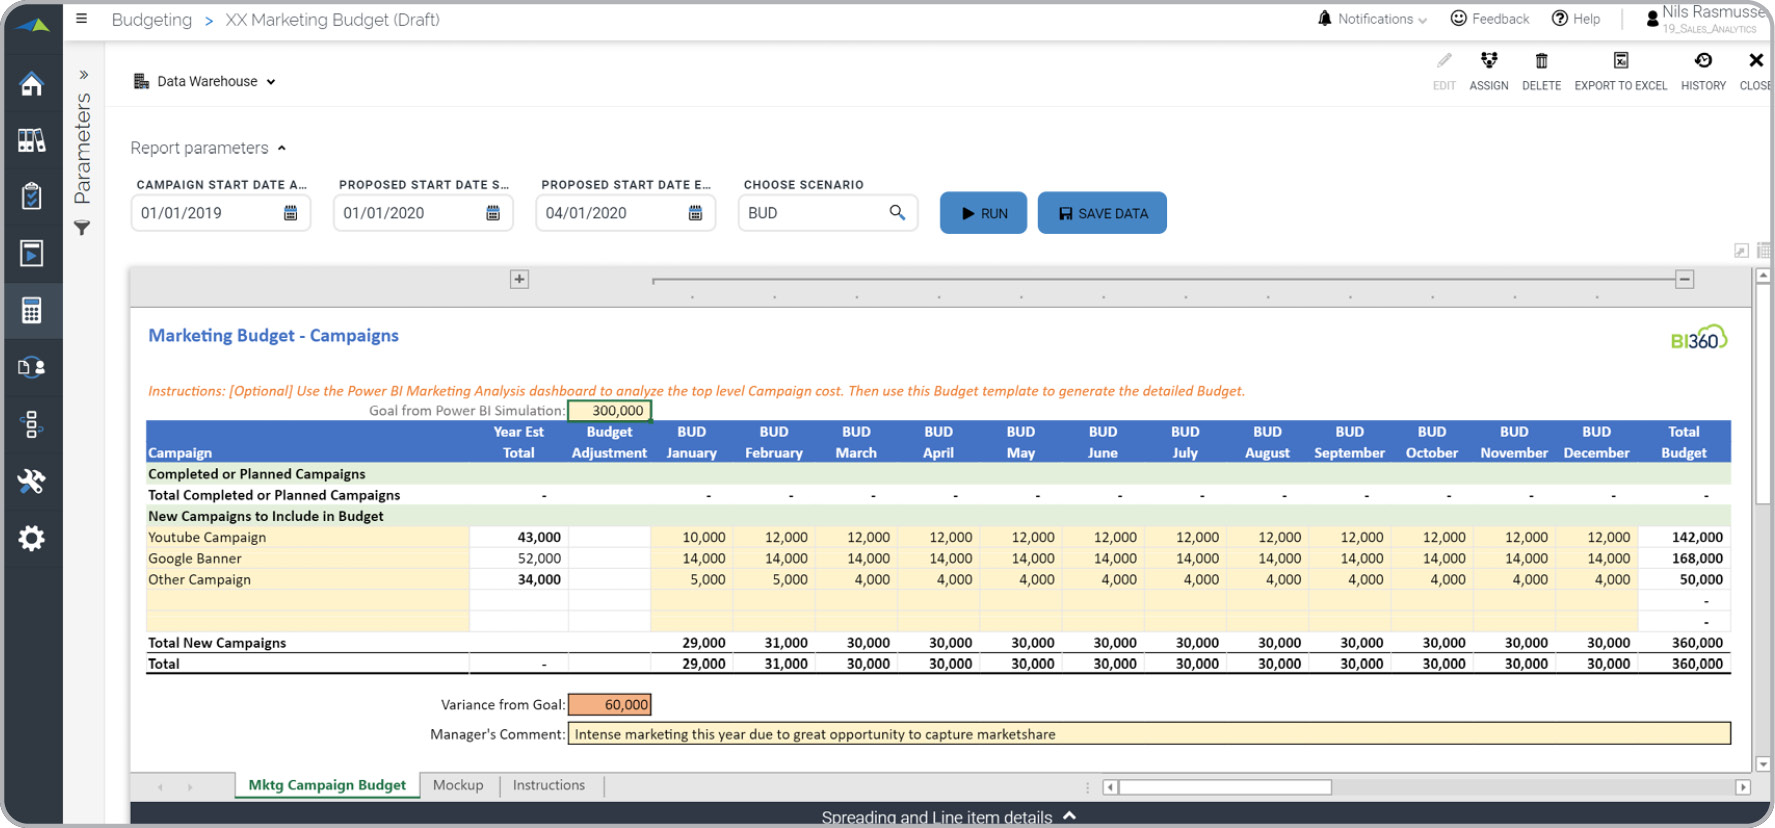
Marketing Budget
Marketing budget with input per campaign.
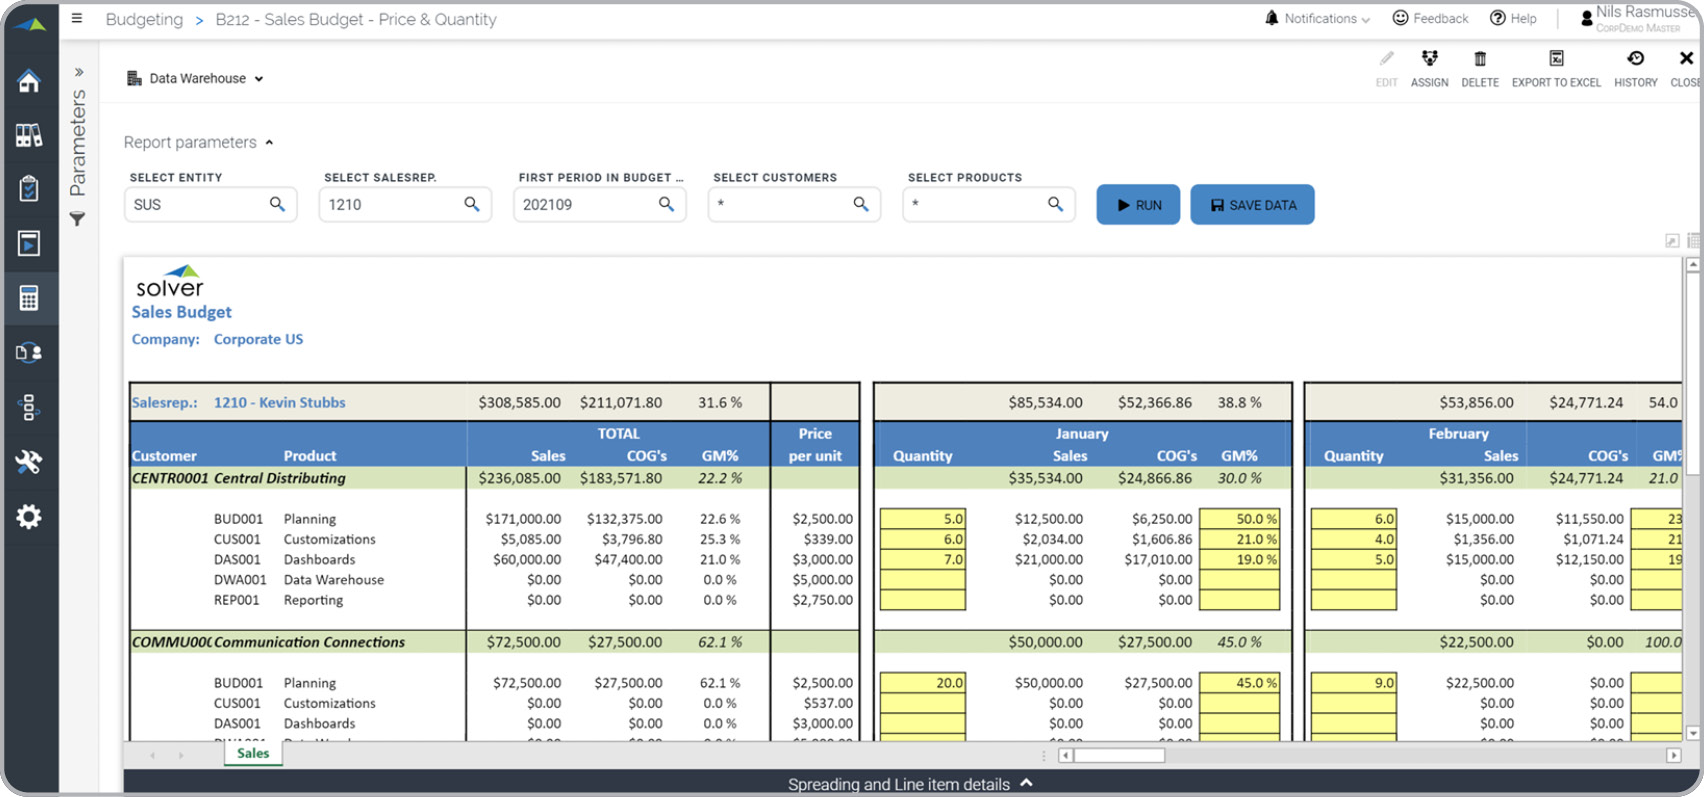
Sales Budget
Sales budget form with price, quantity, and margins.
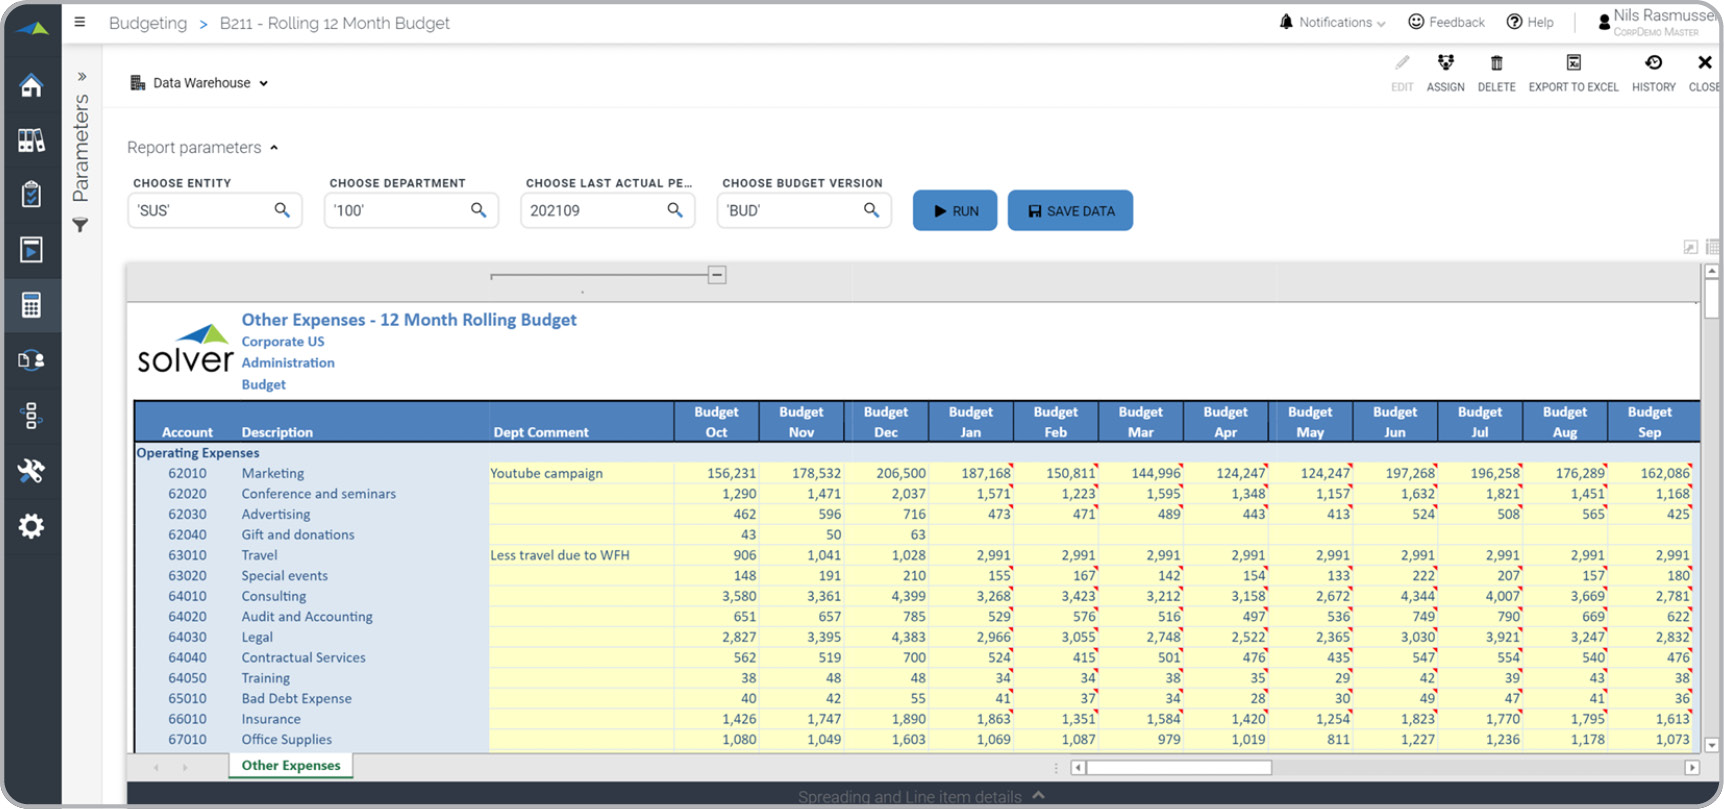
Rolling 12-Month Budget
Enter budgets on a 12-month rolling basis.
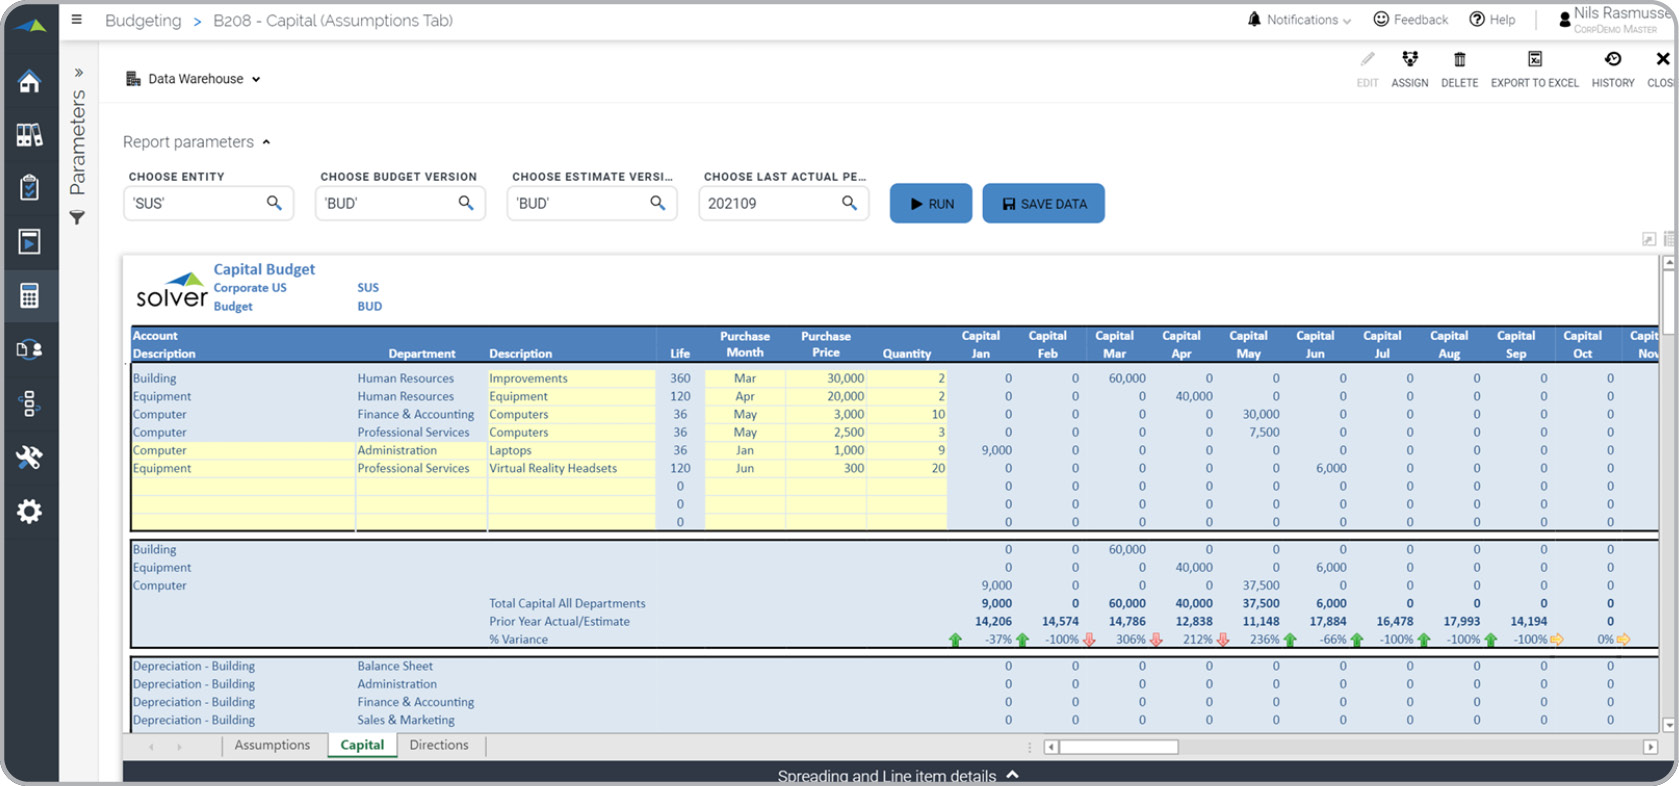
Capital Budget
Enter capital purchases by department with comment, price, and quantity.
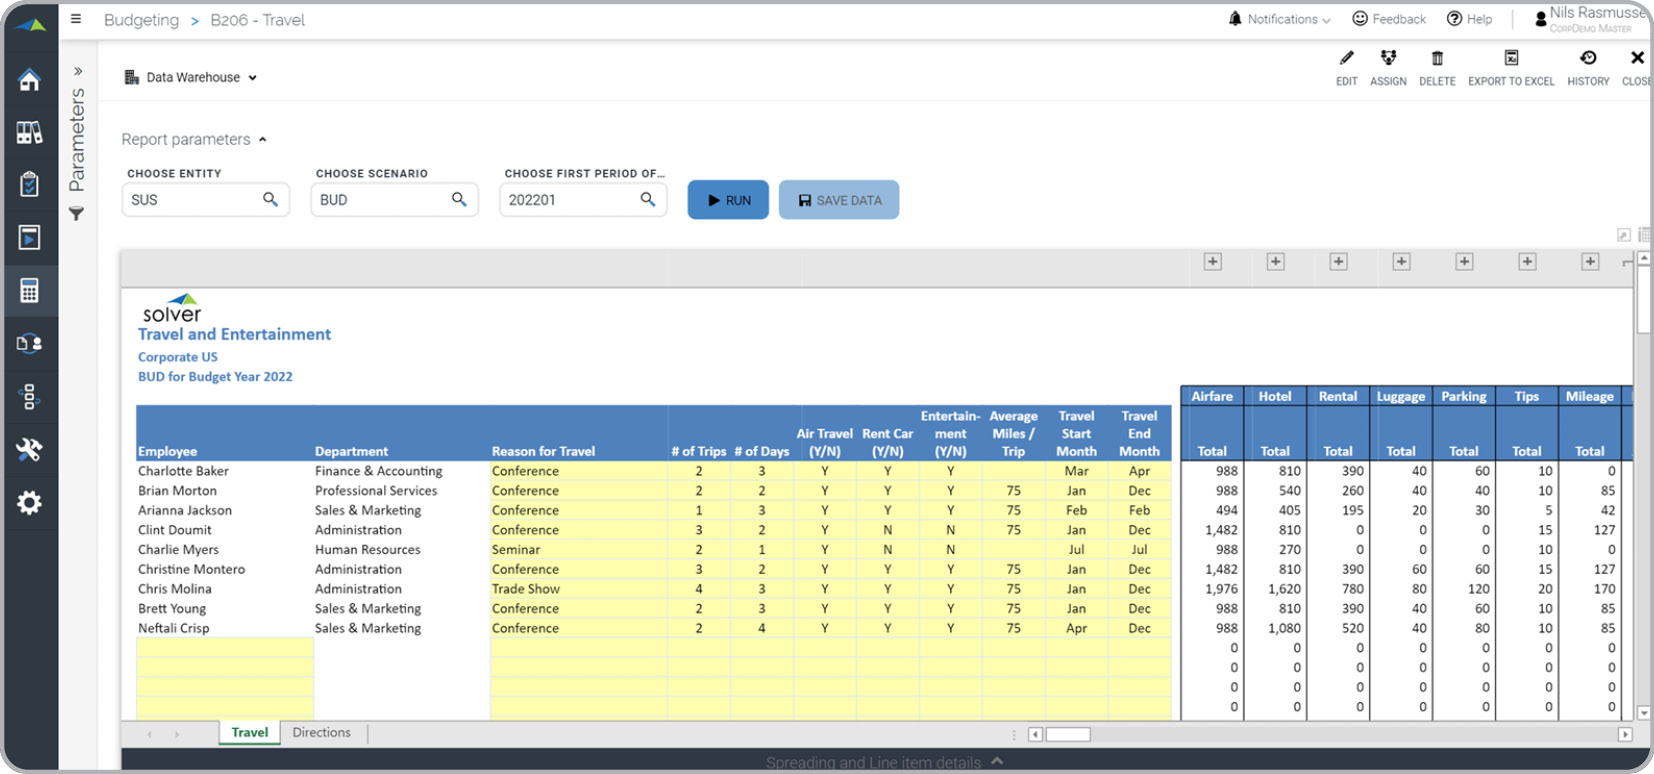
Travel & Entertainment
Get accurate Travel & Entertainment budgets by capturing detail per employee.

Budget Accuracy Analysis
Compare budgets from prior years to analyze ACCURACY before the new budget process.
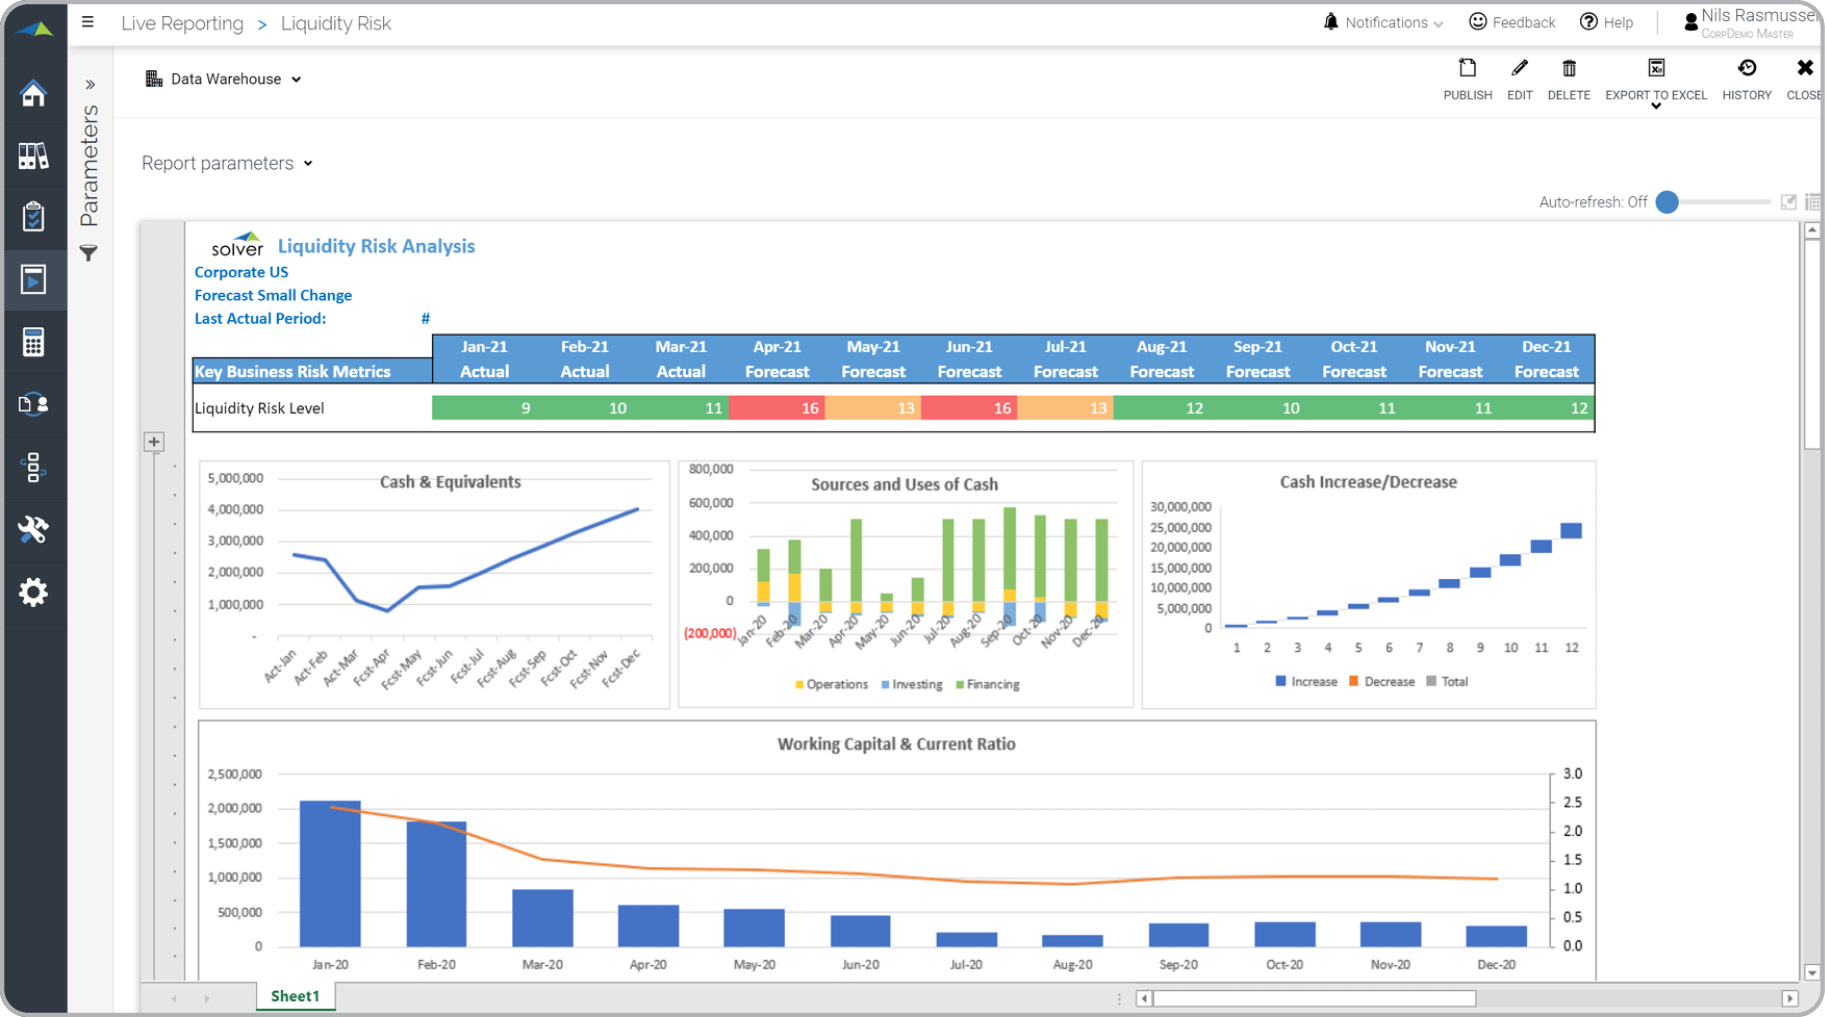
Liquidity Risk Forecast
Based on actual YTD and forecast, this report helps analyze cash and liquidity needs.
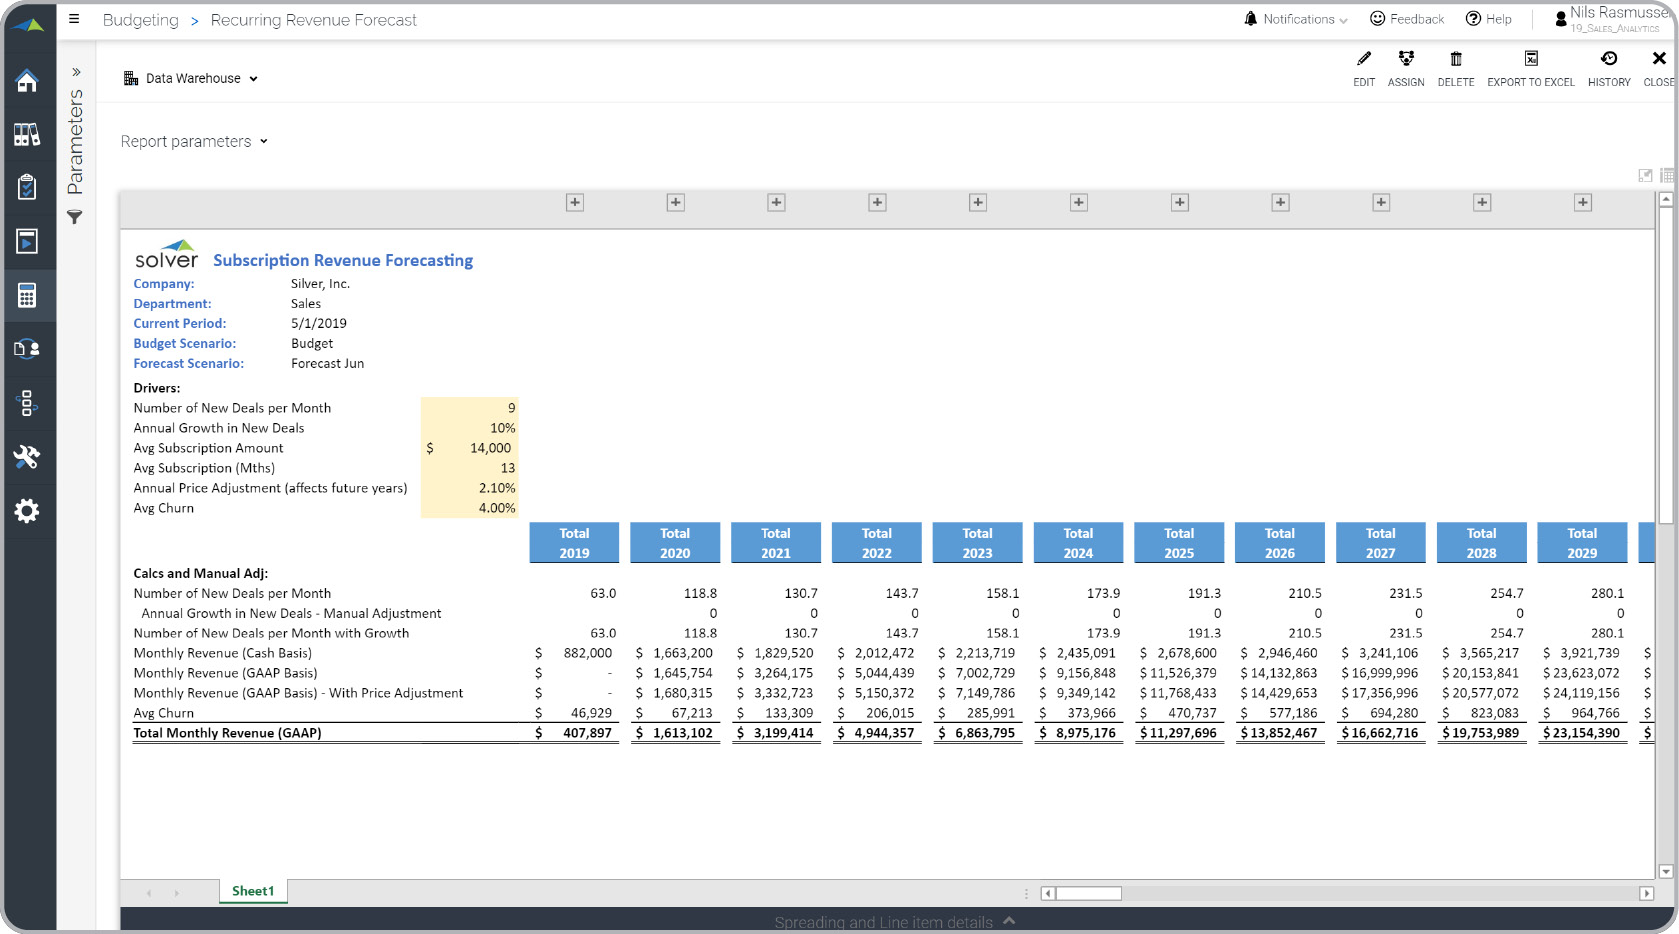
Subscription Revenue Forecasting
Enter key drivers for your subscription revenue and automatically spread into future years.
Multi-Year Forecast
Example of input of multi-year (5 years) forecast.
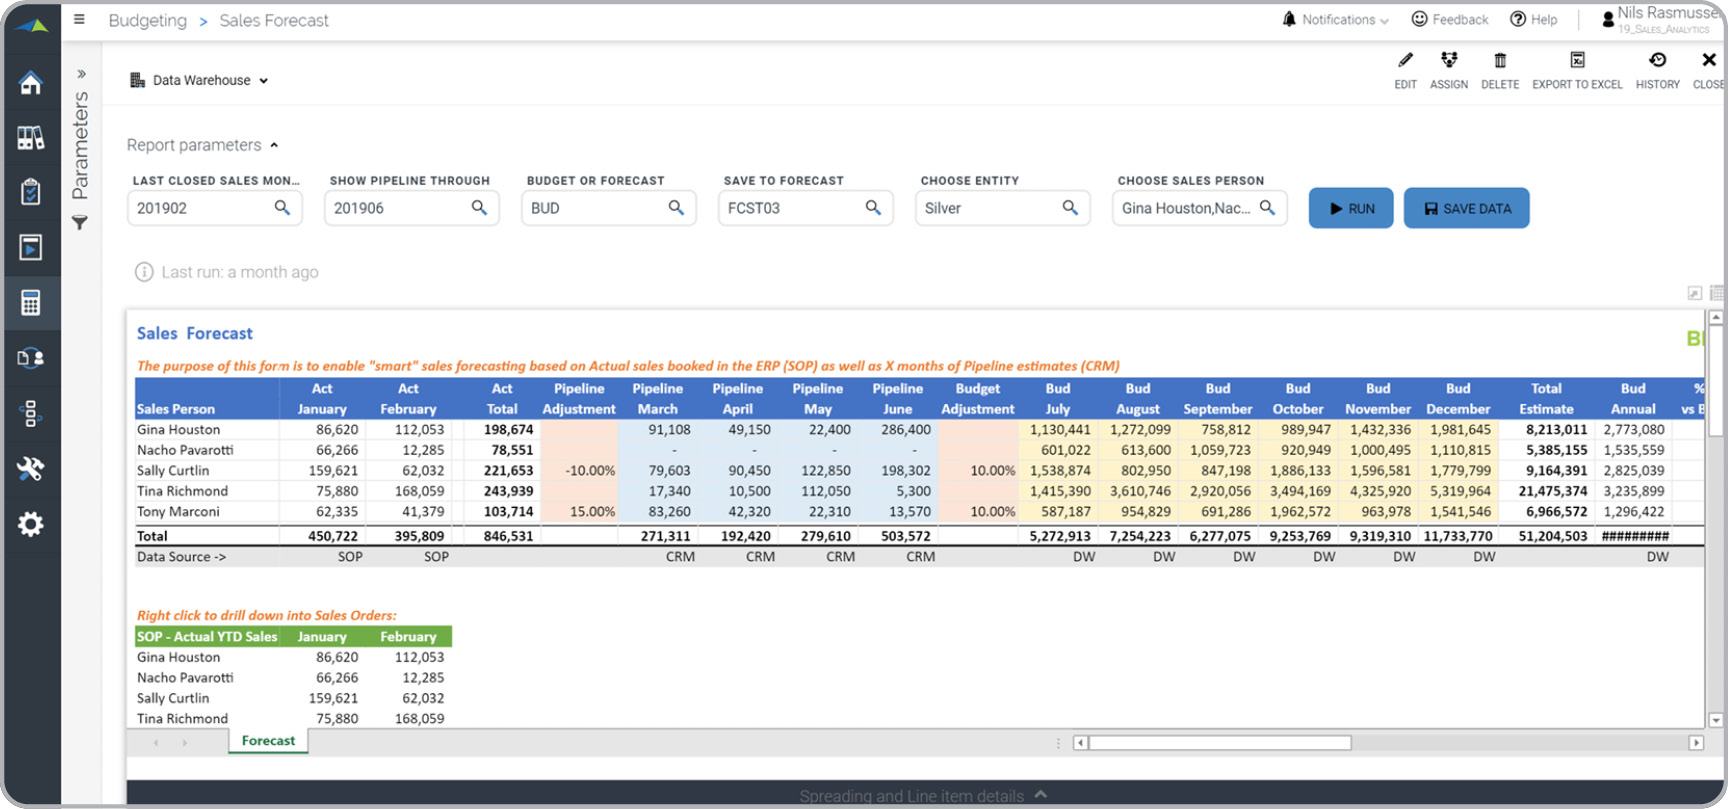
Sales Forecast from CRM Pipeline
The form combines sales history from the ERP with CRM pipeline to create forecast.

Sales Forecast
Enter sales target and the form generates the forecast, then override where desired.
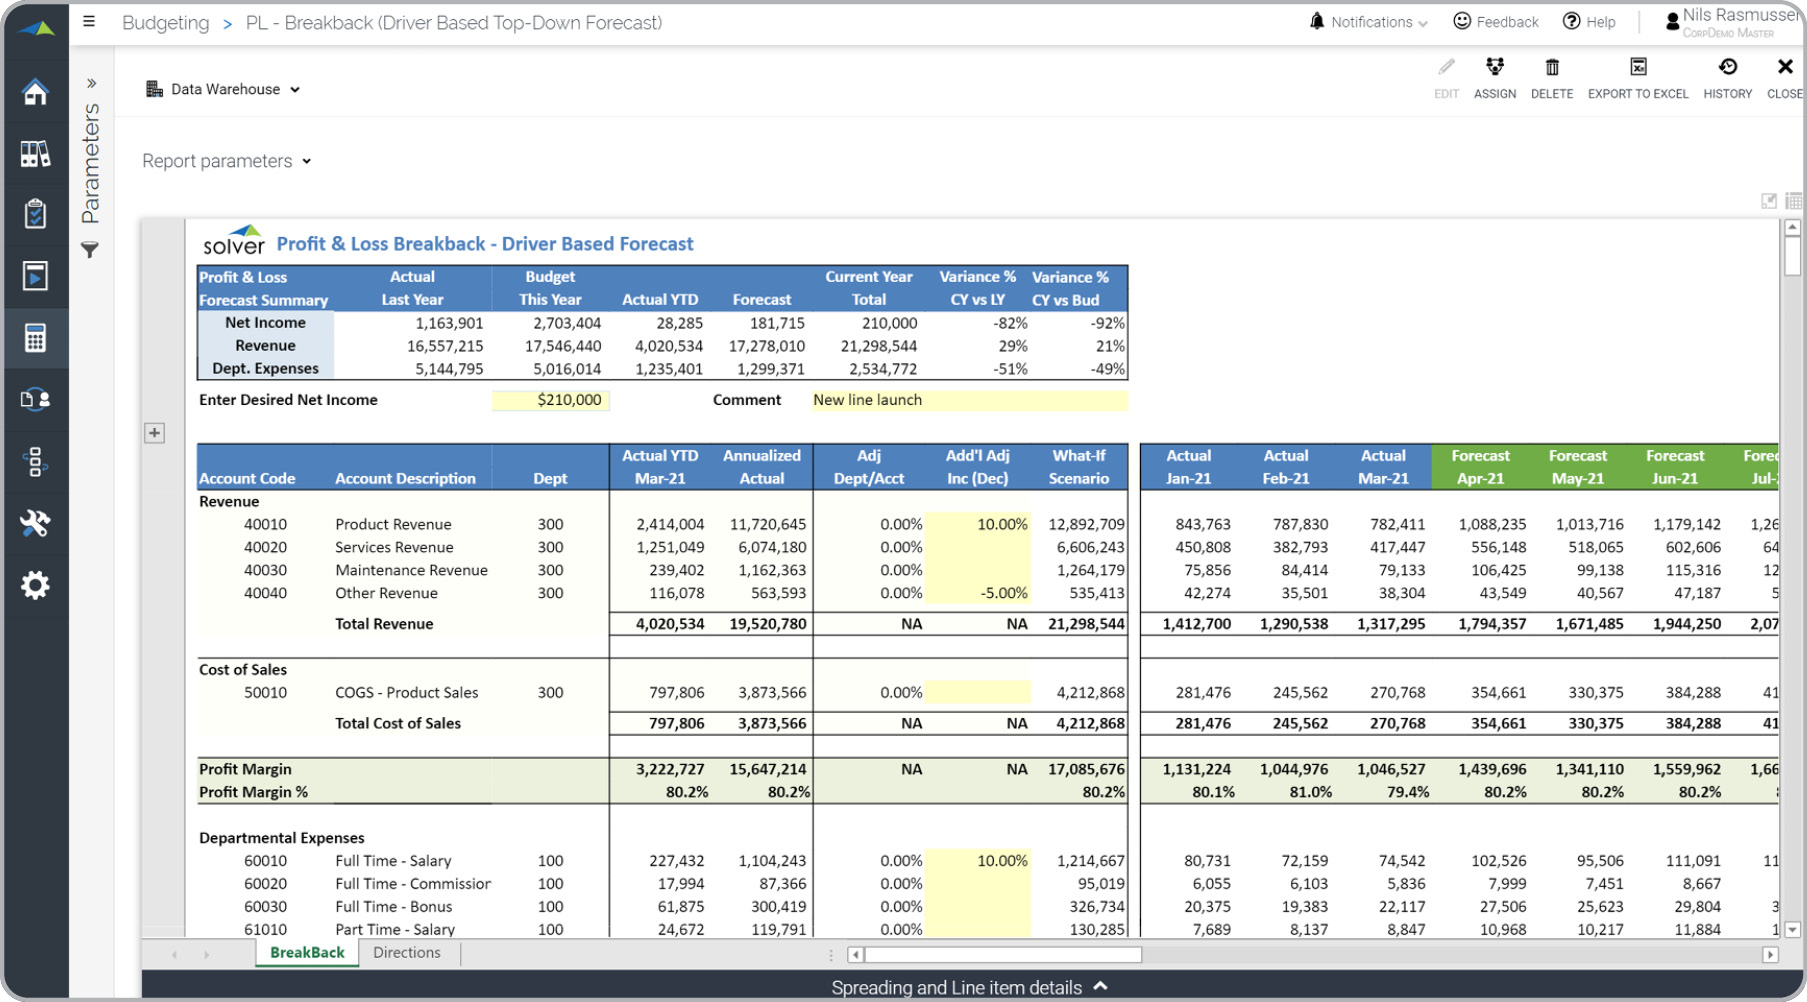
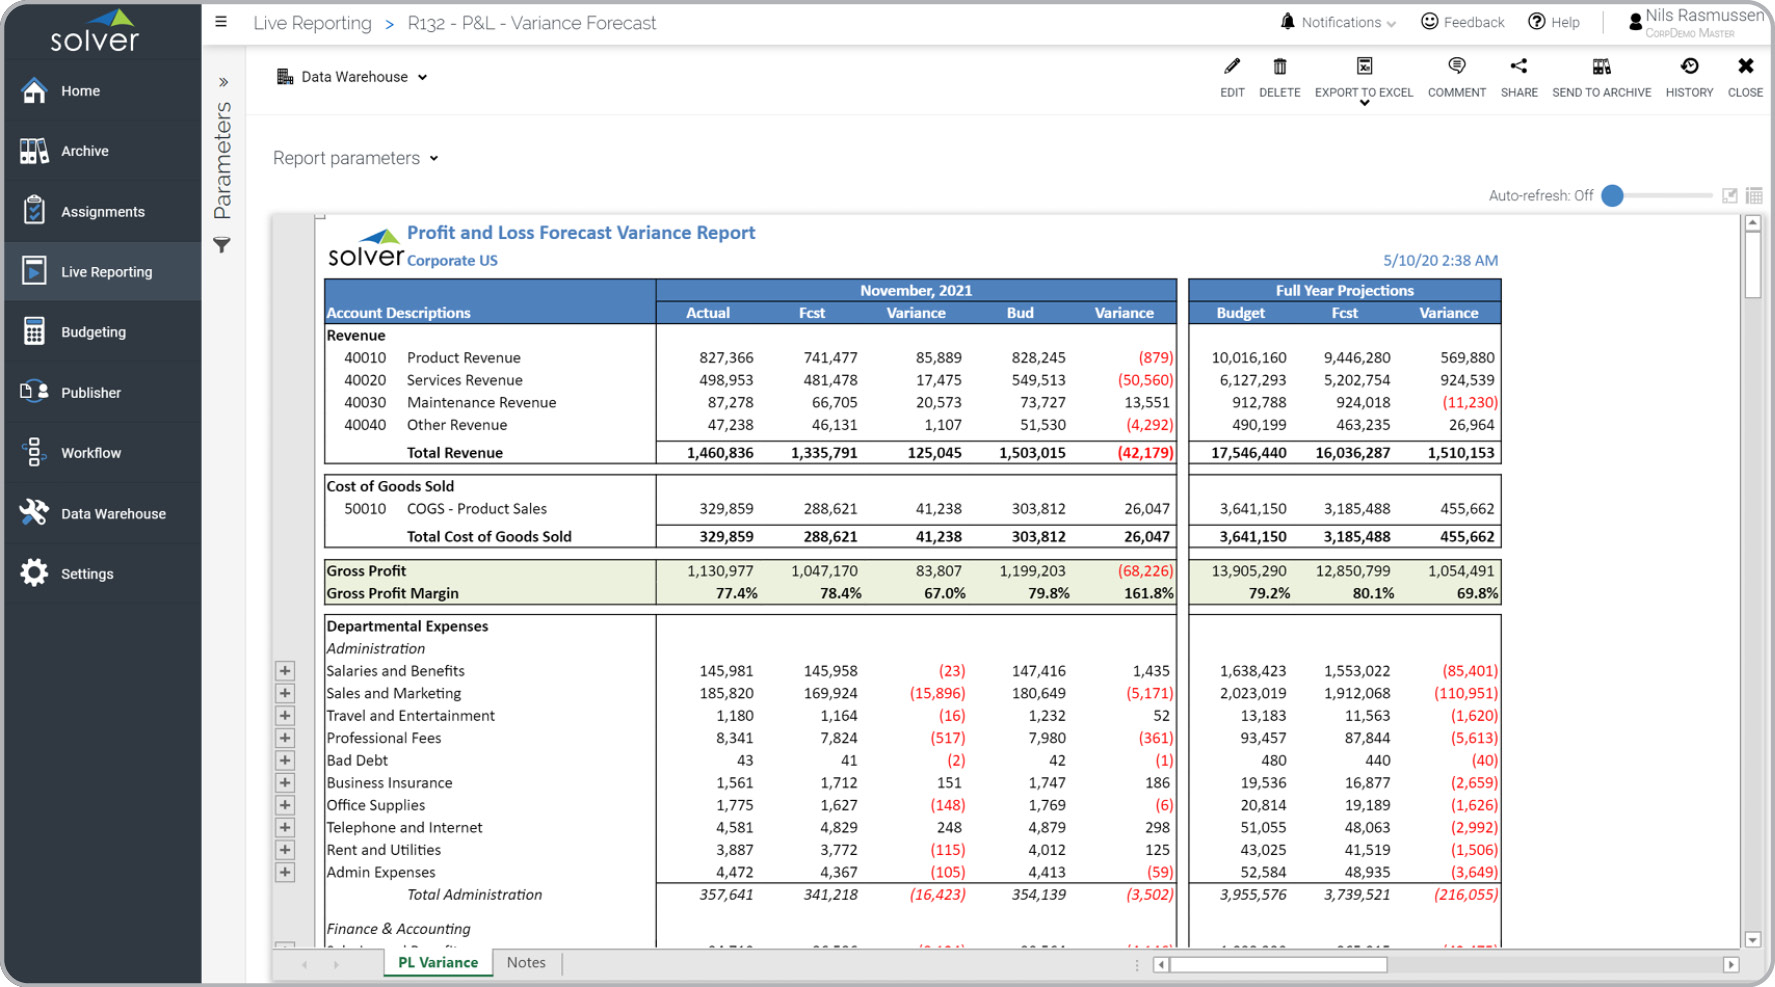
Profit & Loss Forecast
Enter target Net Income and the form's algorithms automatically creates the forecast.
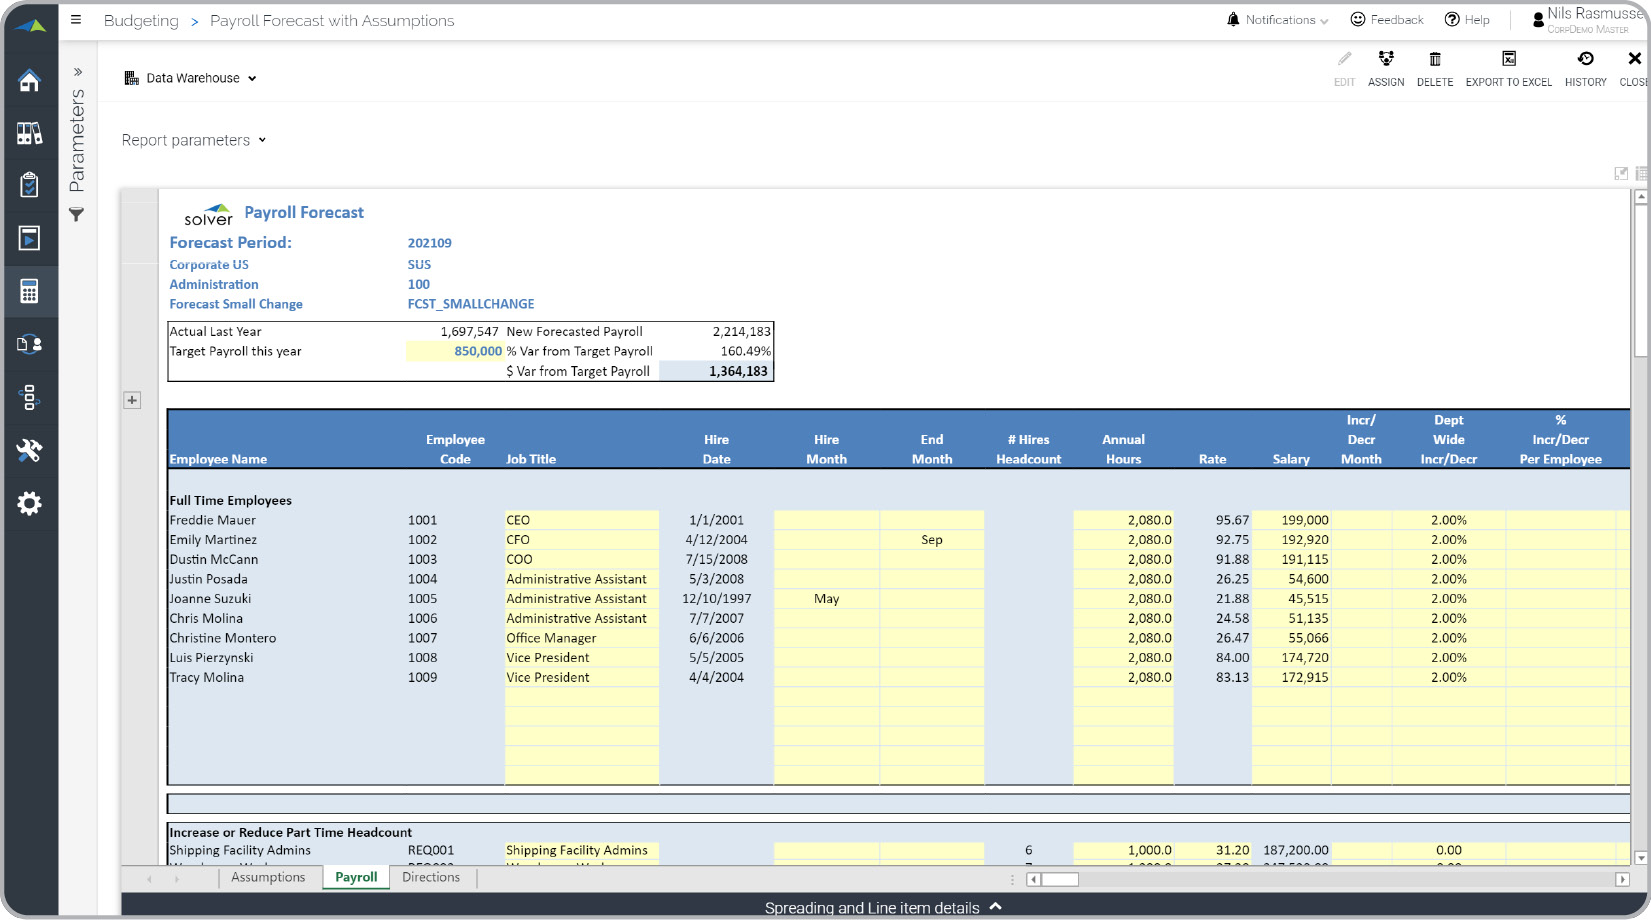
Payroll Forecast
Adjust drivers and let the form calculate salaries, benefits, taxes and headcount.
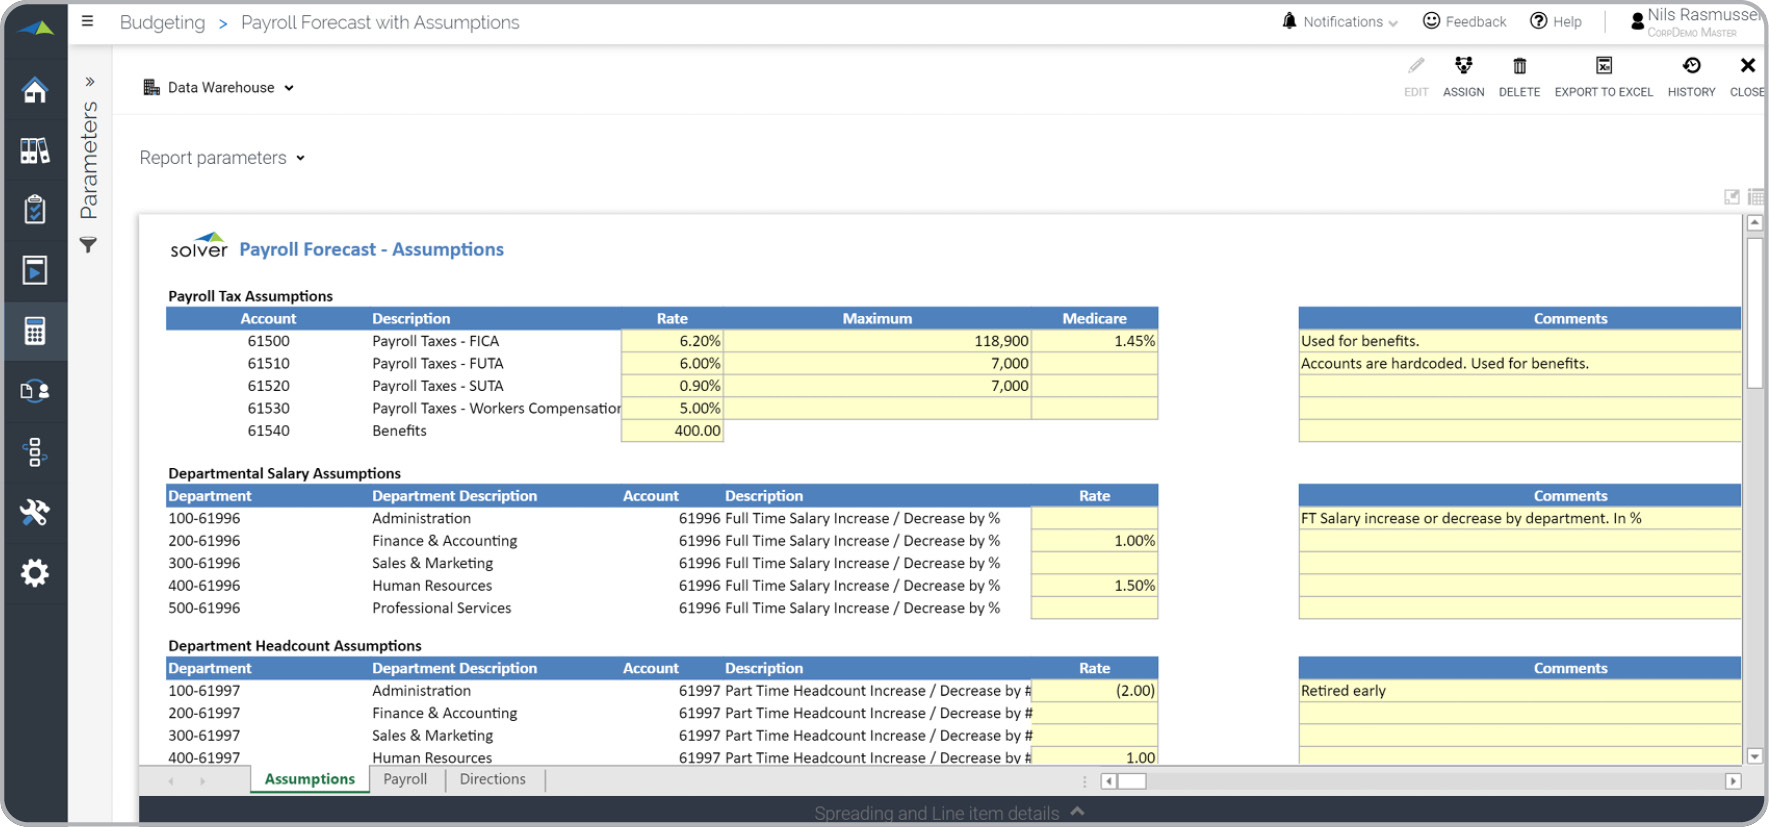
Payroll Assumptions
Enter assumptions that will drive the payroll and headcount forecast.
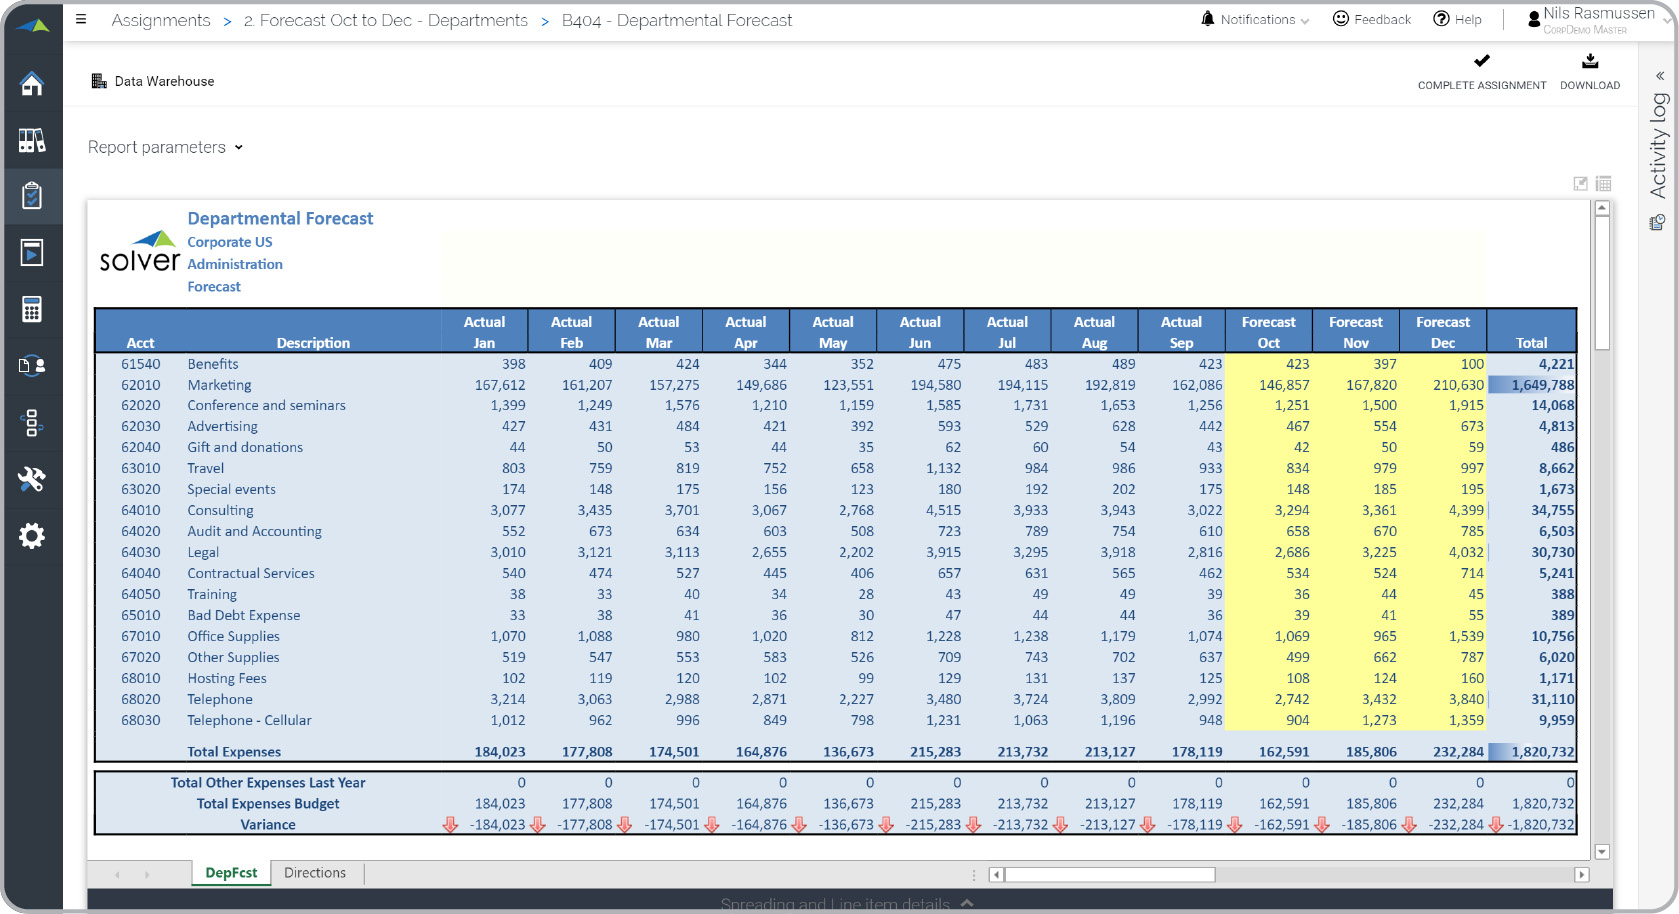
Department Forecast
Historical months populate automatically and user enters forecast.

Strategic Initiatives
Track status of strategic initiatives and related accountability.
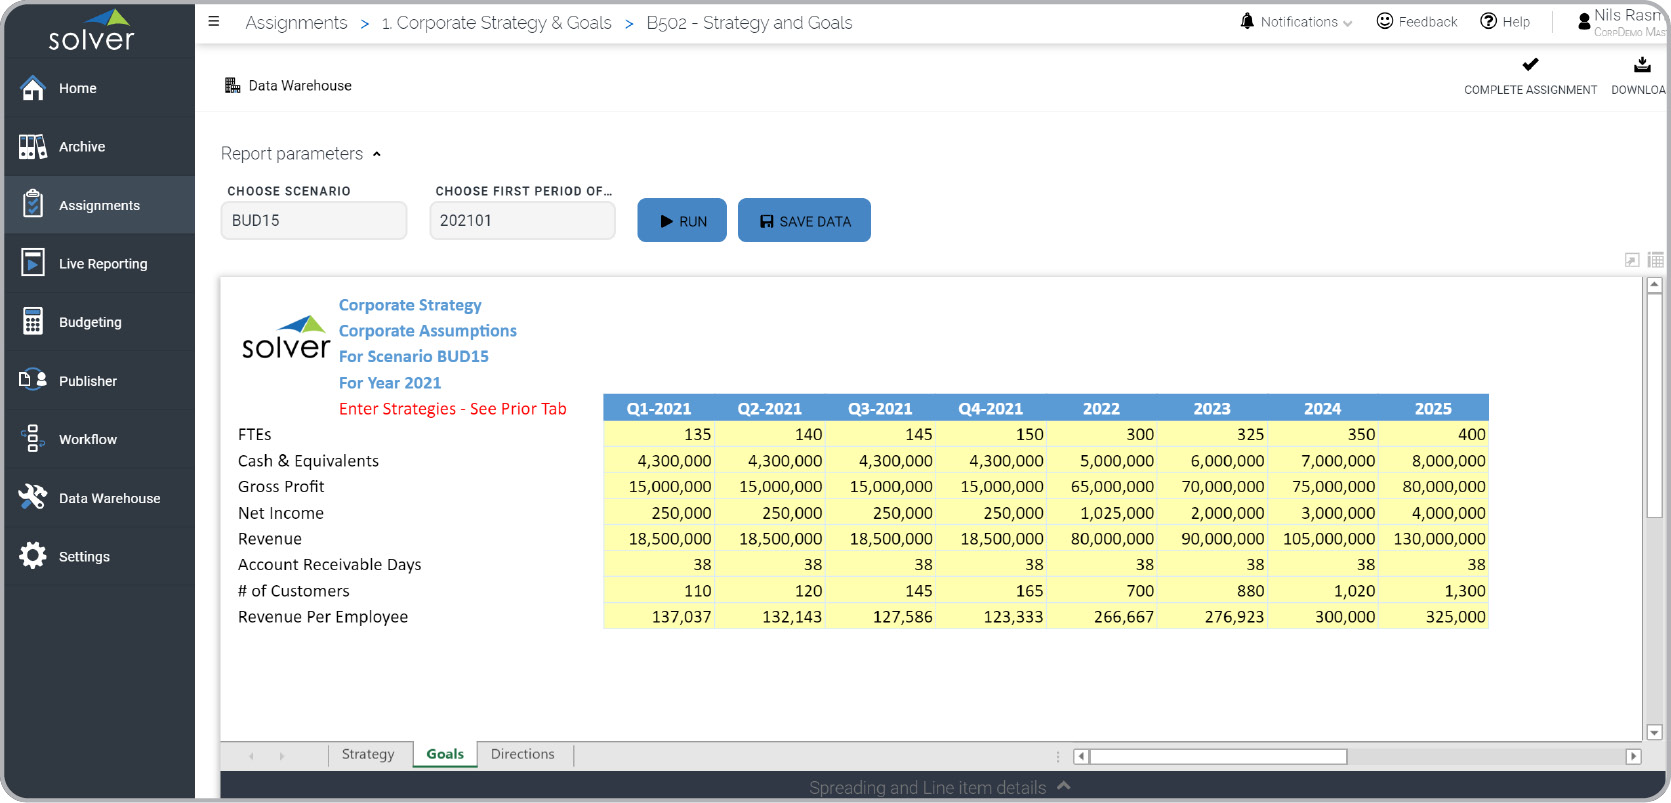
Strategy & Goals
Enter strategies and then enter the associated goals.
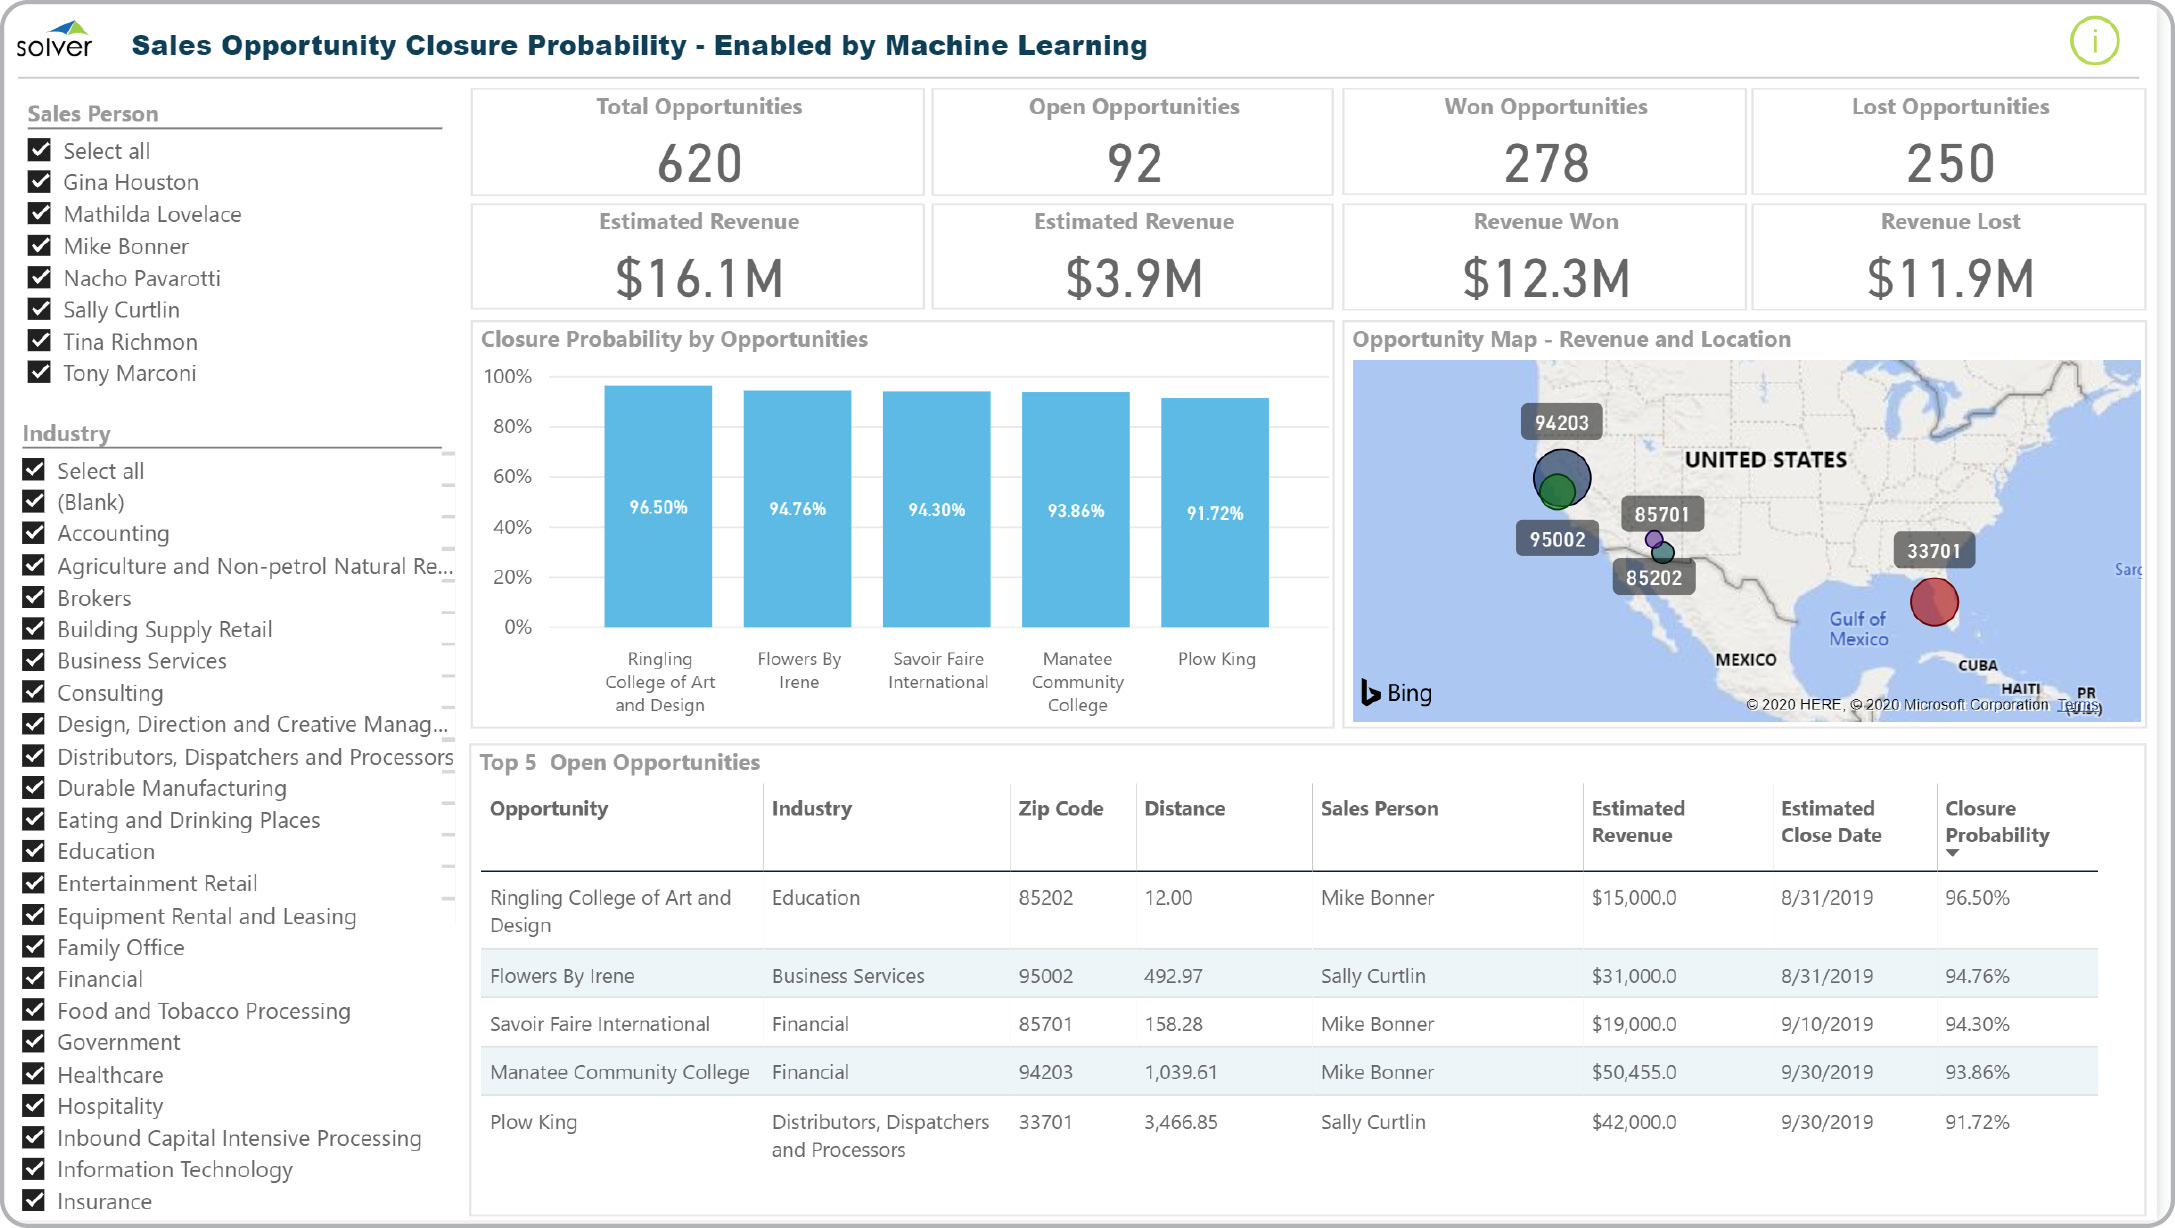
Sales Opportunity Analysis
Power BI dashboard that uses Machine Learning to suggest which opportunities to focus on.
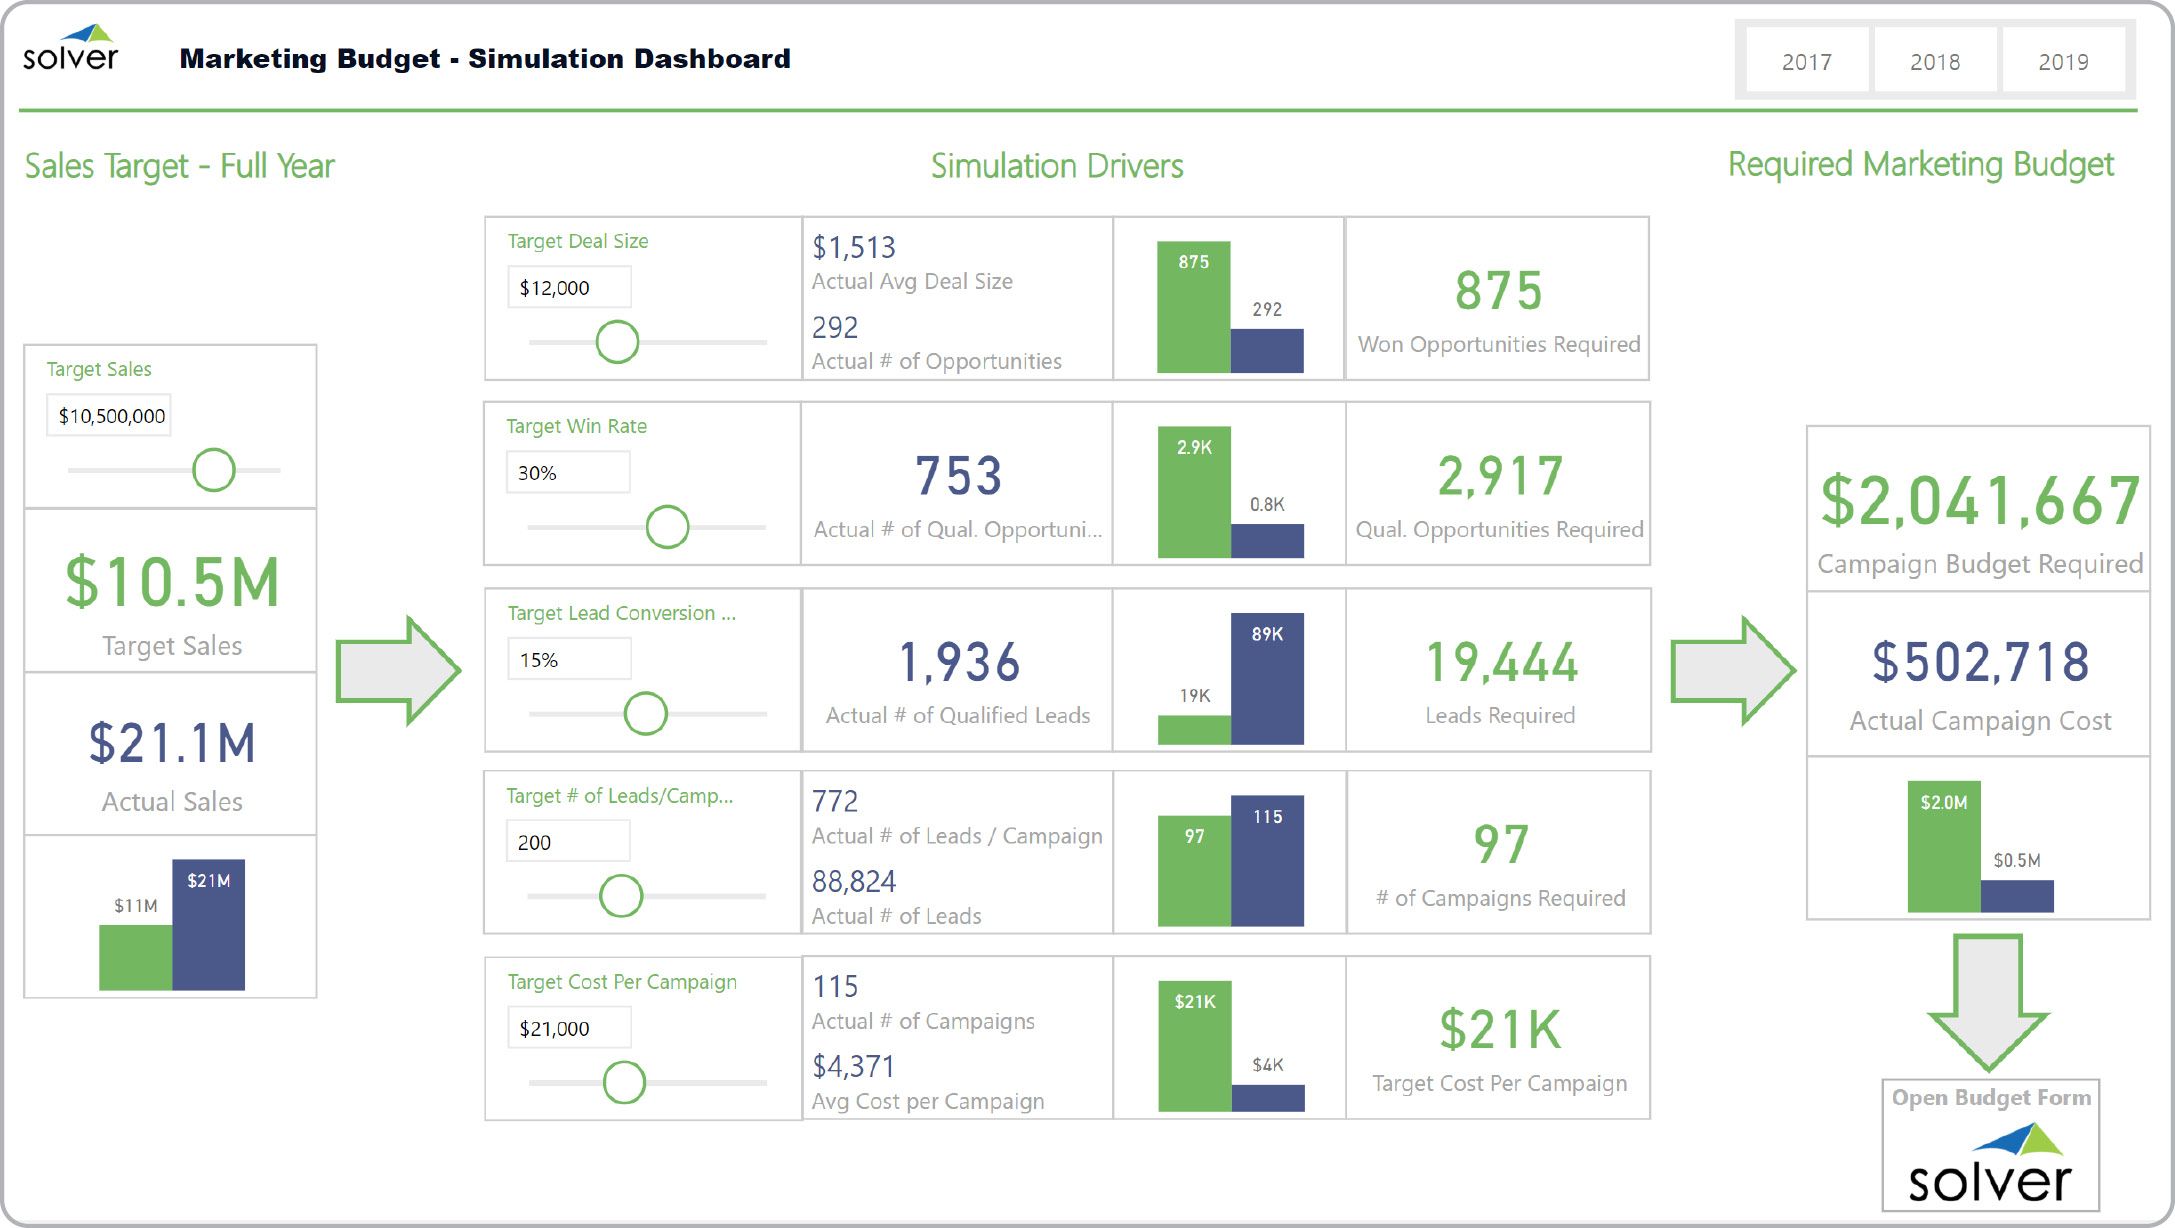
Campaign Simulation
Power BI dashboard uses sliders to change drivers for leads, win ratio, and more to derive the campaign budget.
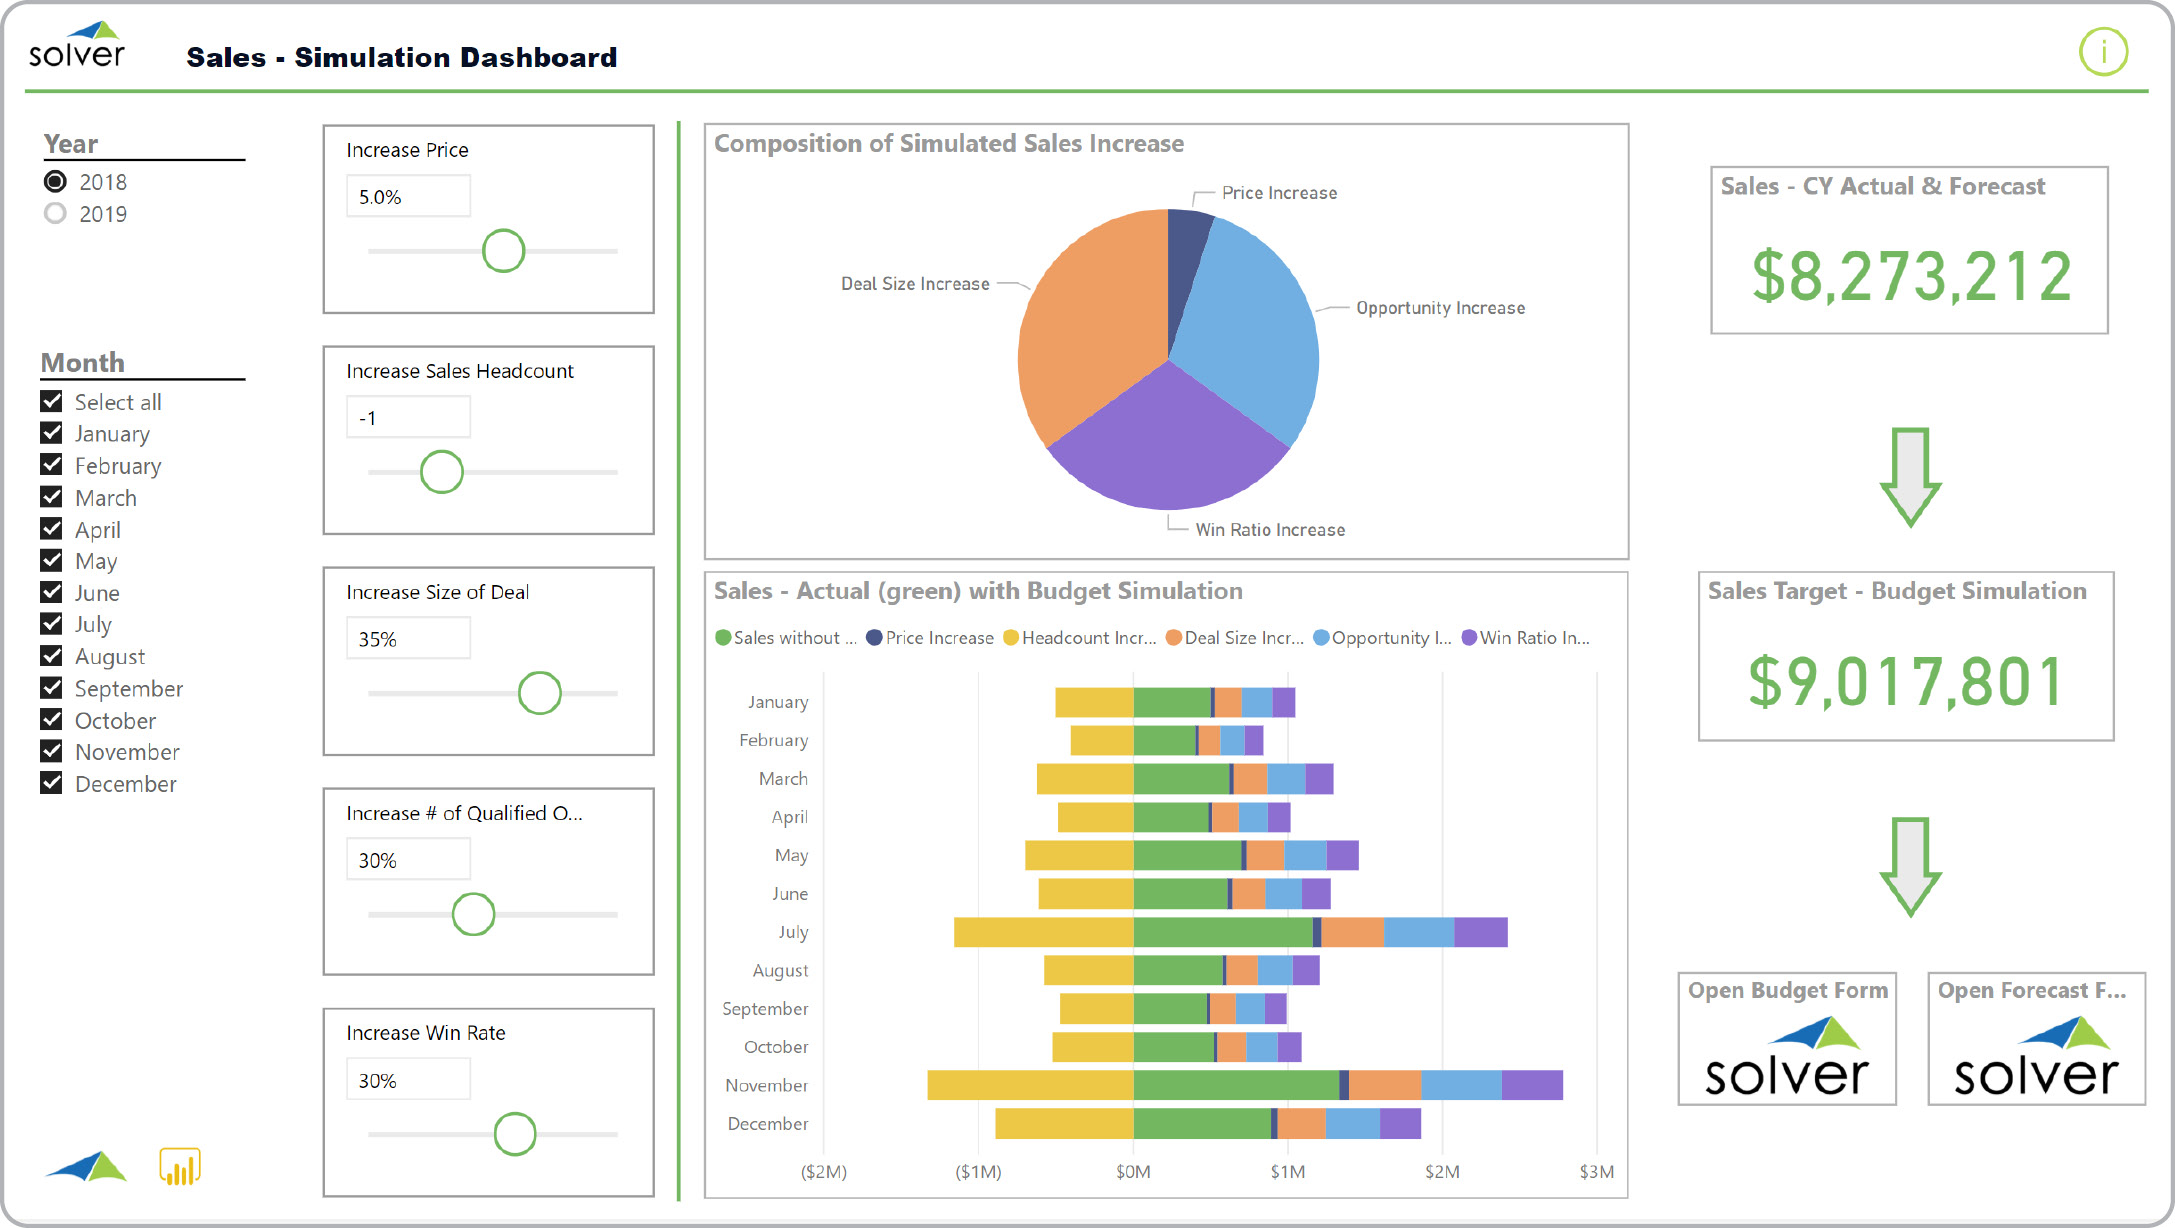
Sales Simulation
Power BI dashboard showing estimated sales by using sliders to change drivers such as quantity, win ratio, price, and more.
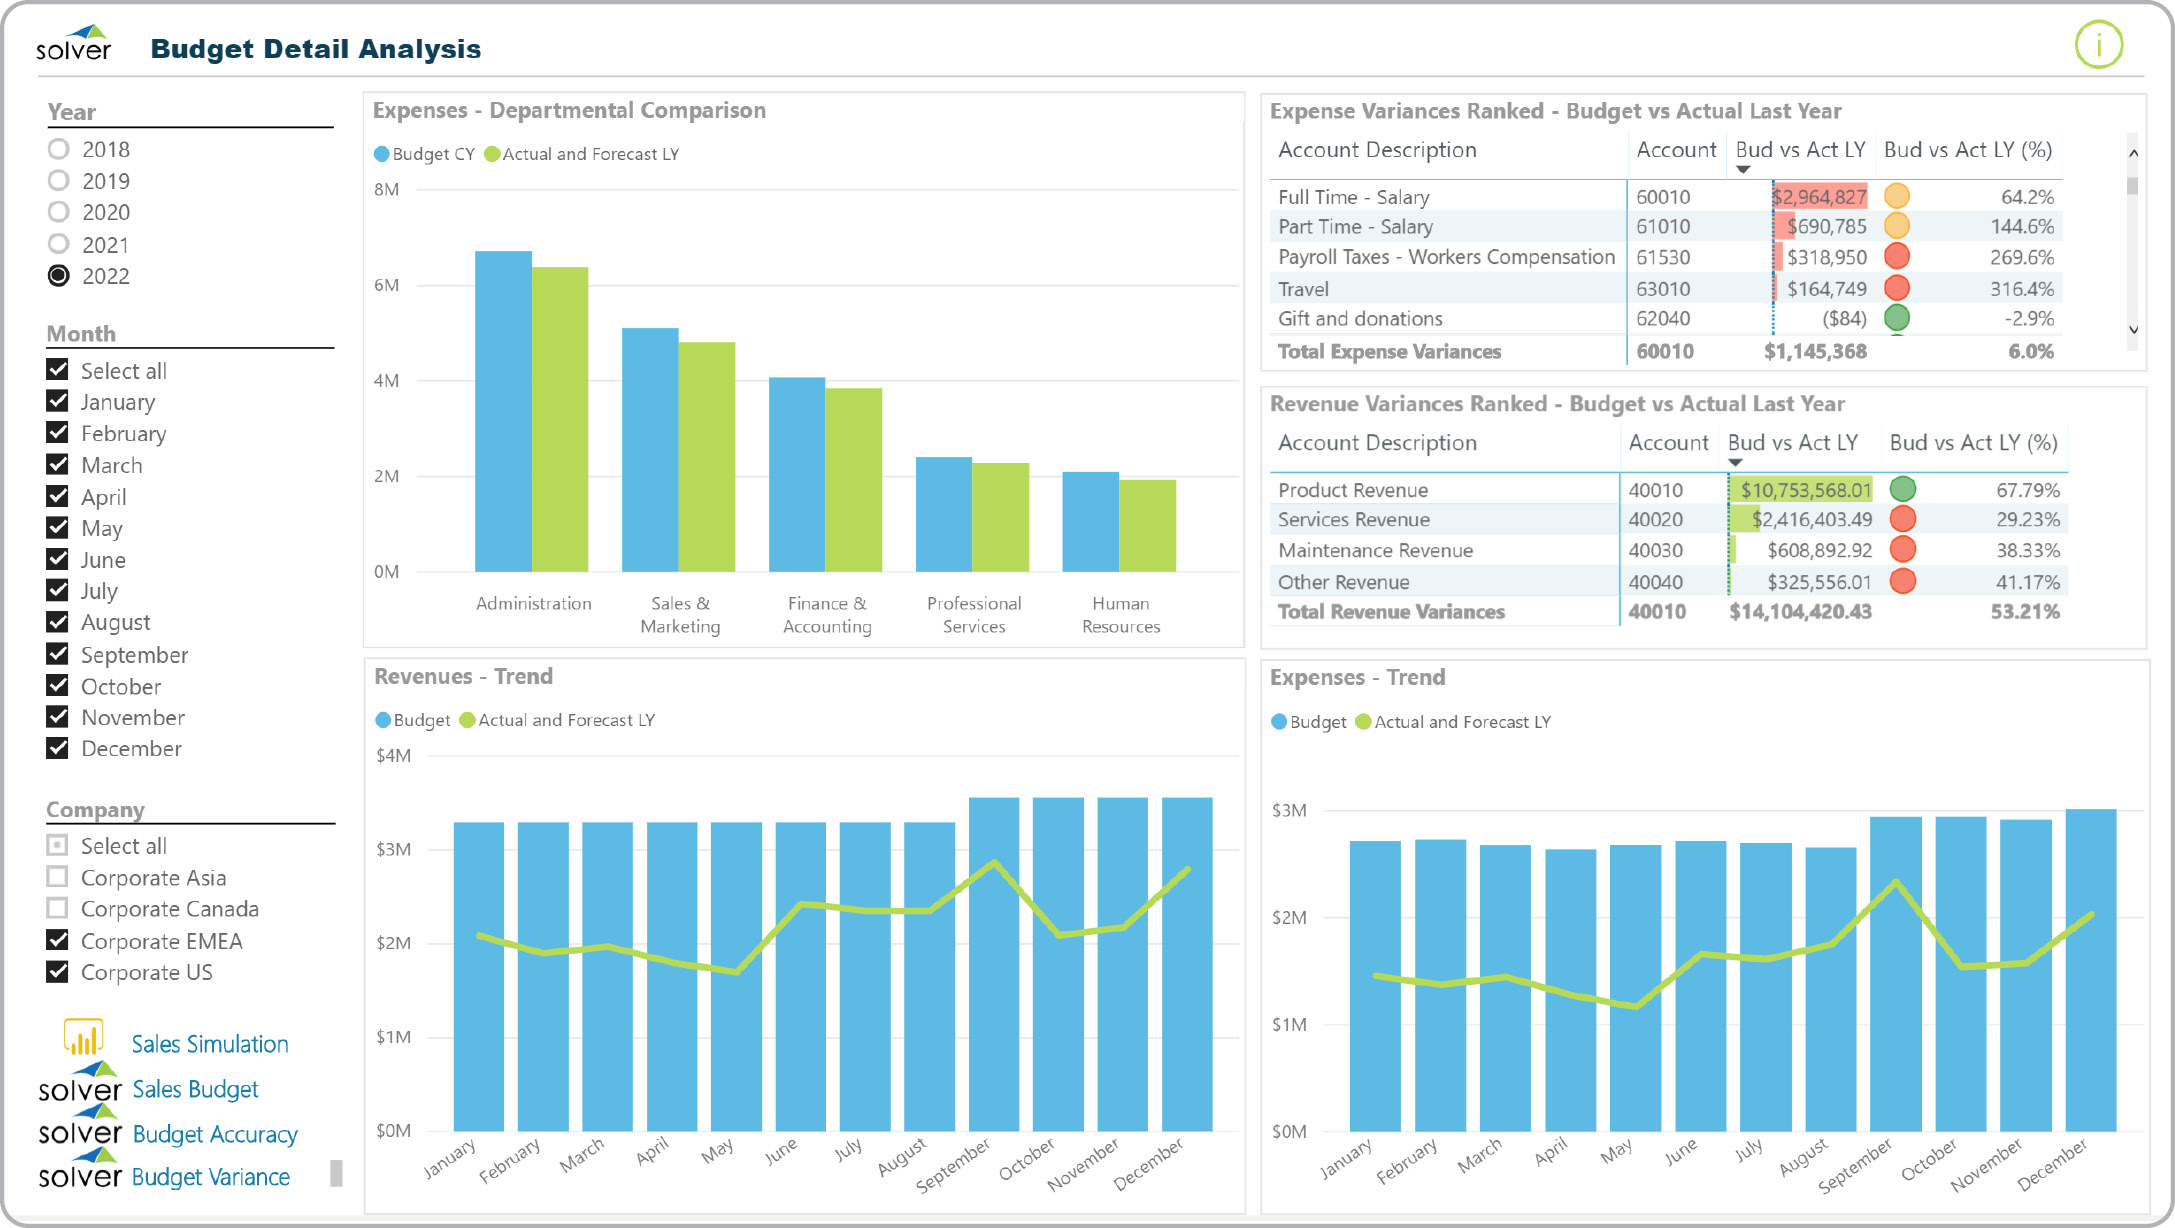
Budget Detail Dashboard
Power BI dashboard showing simulation of cash flow with sliders where the user can increase/decrease any component.
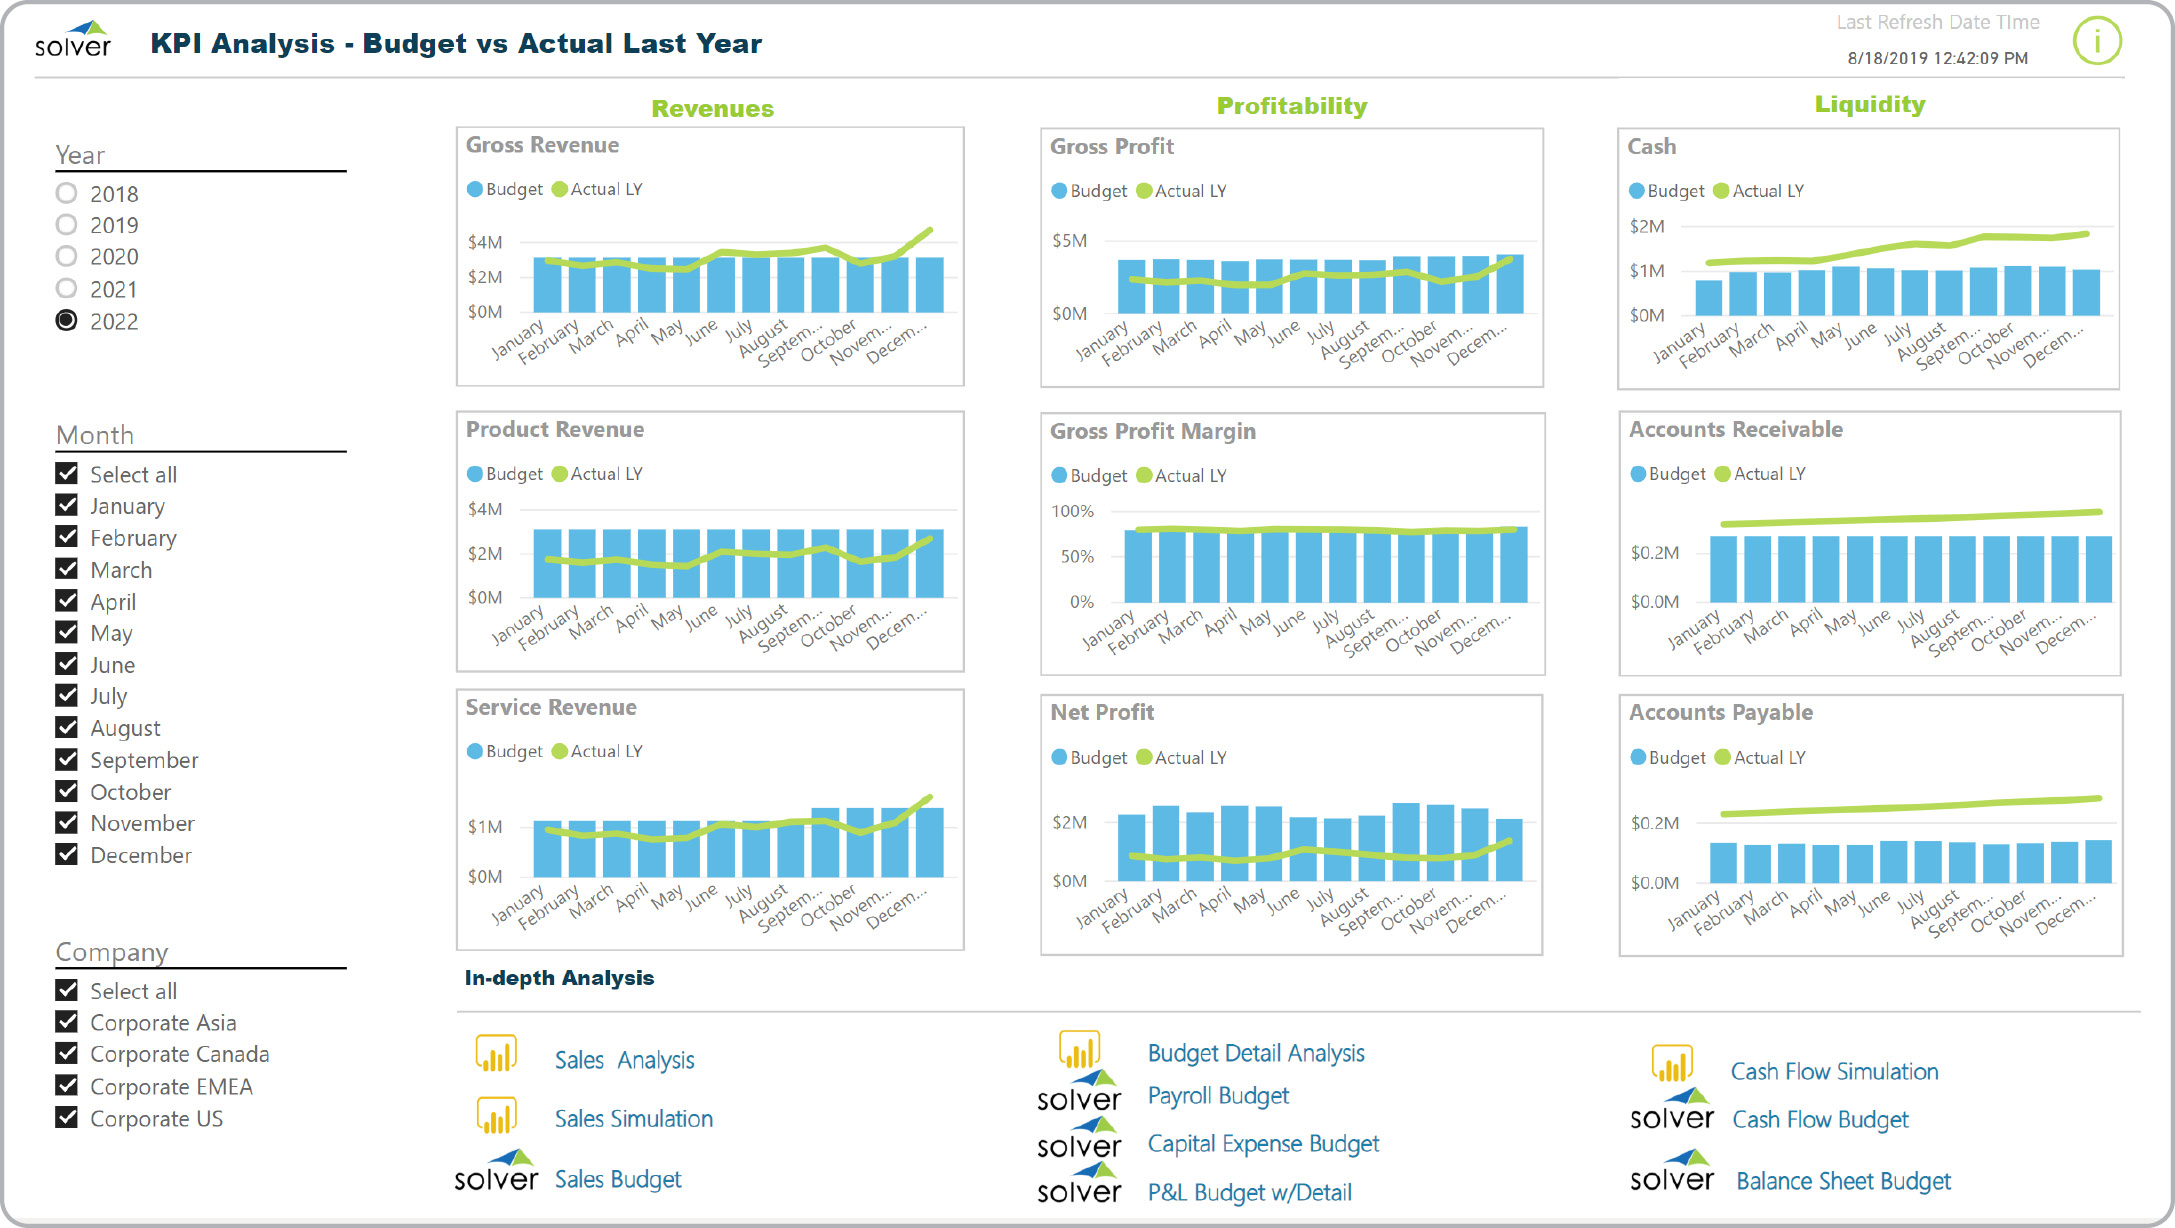
Budget Summary Dashboard
Power BI dashboard showing analysis of budgeted revenues, profit and liquidity.
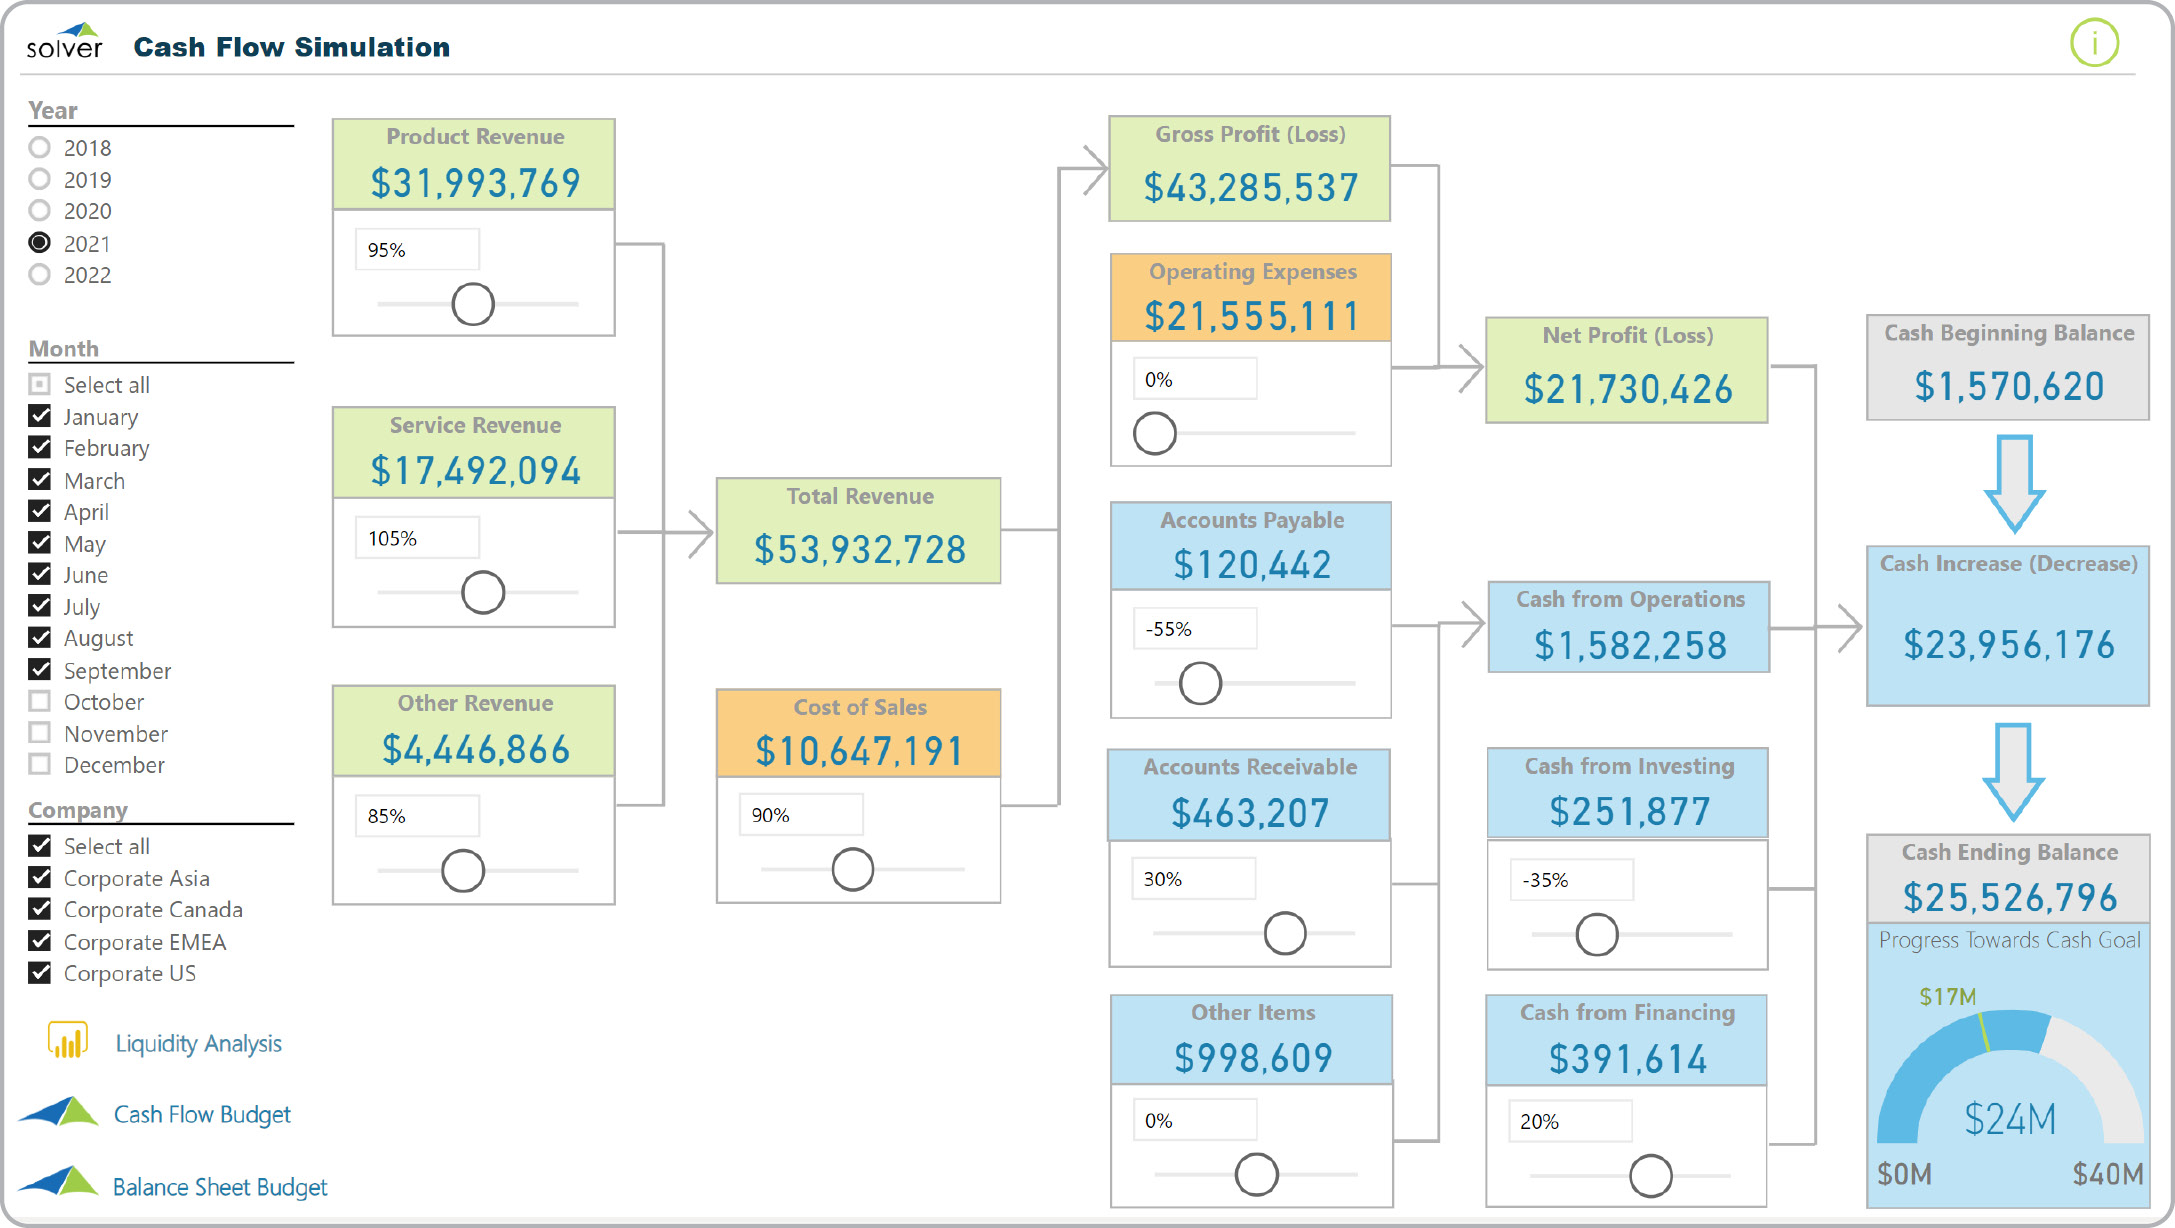
Cash Flow Simulation
Power BI dashboard showing simulation of cash flow with sliders where the user can increase/decrease any component.
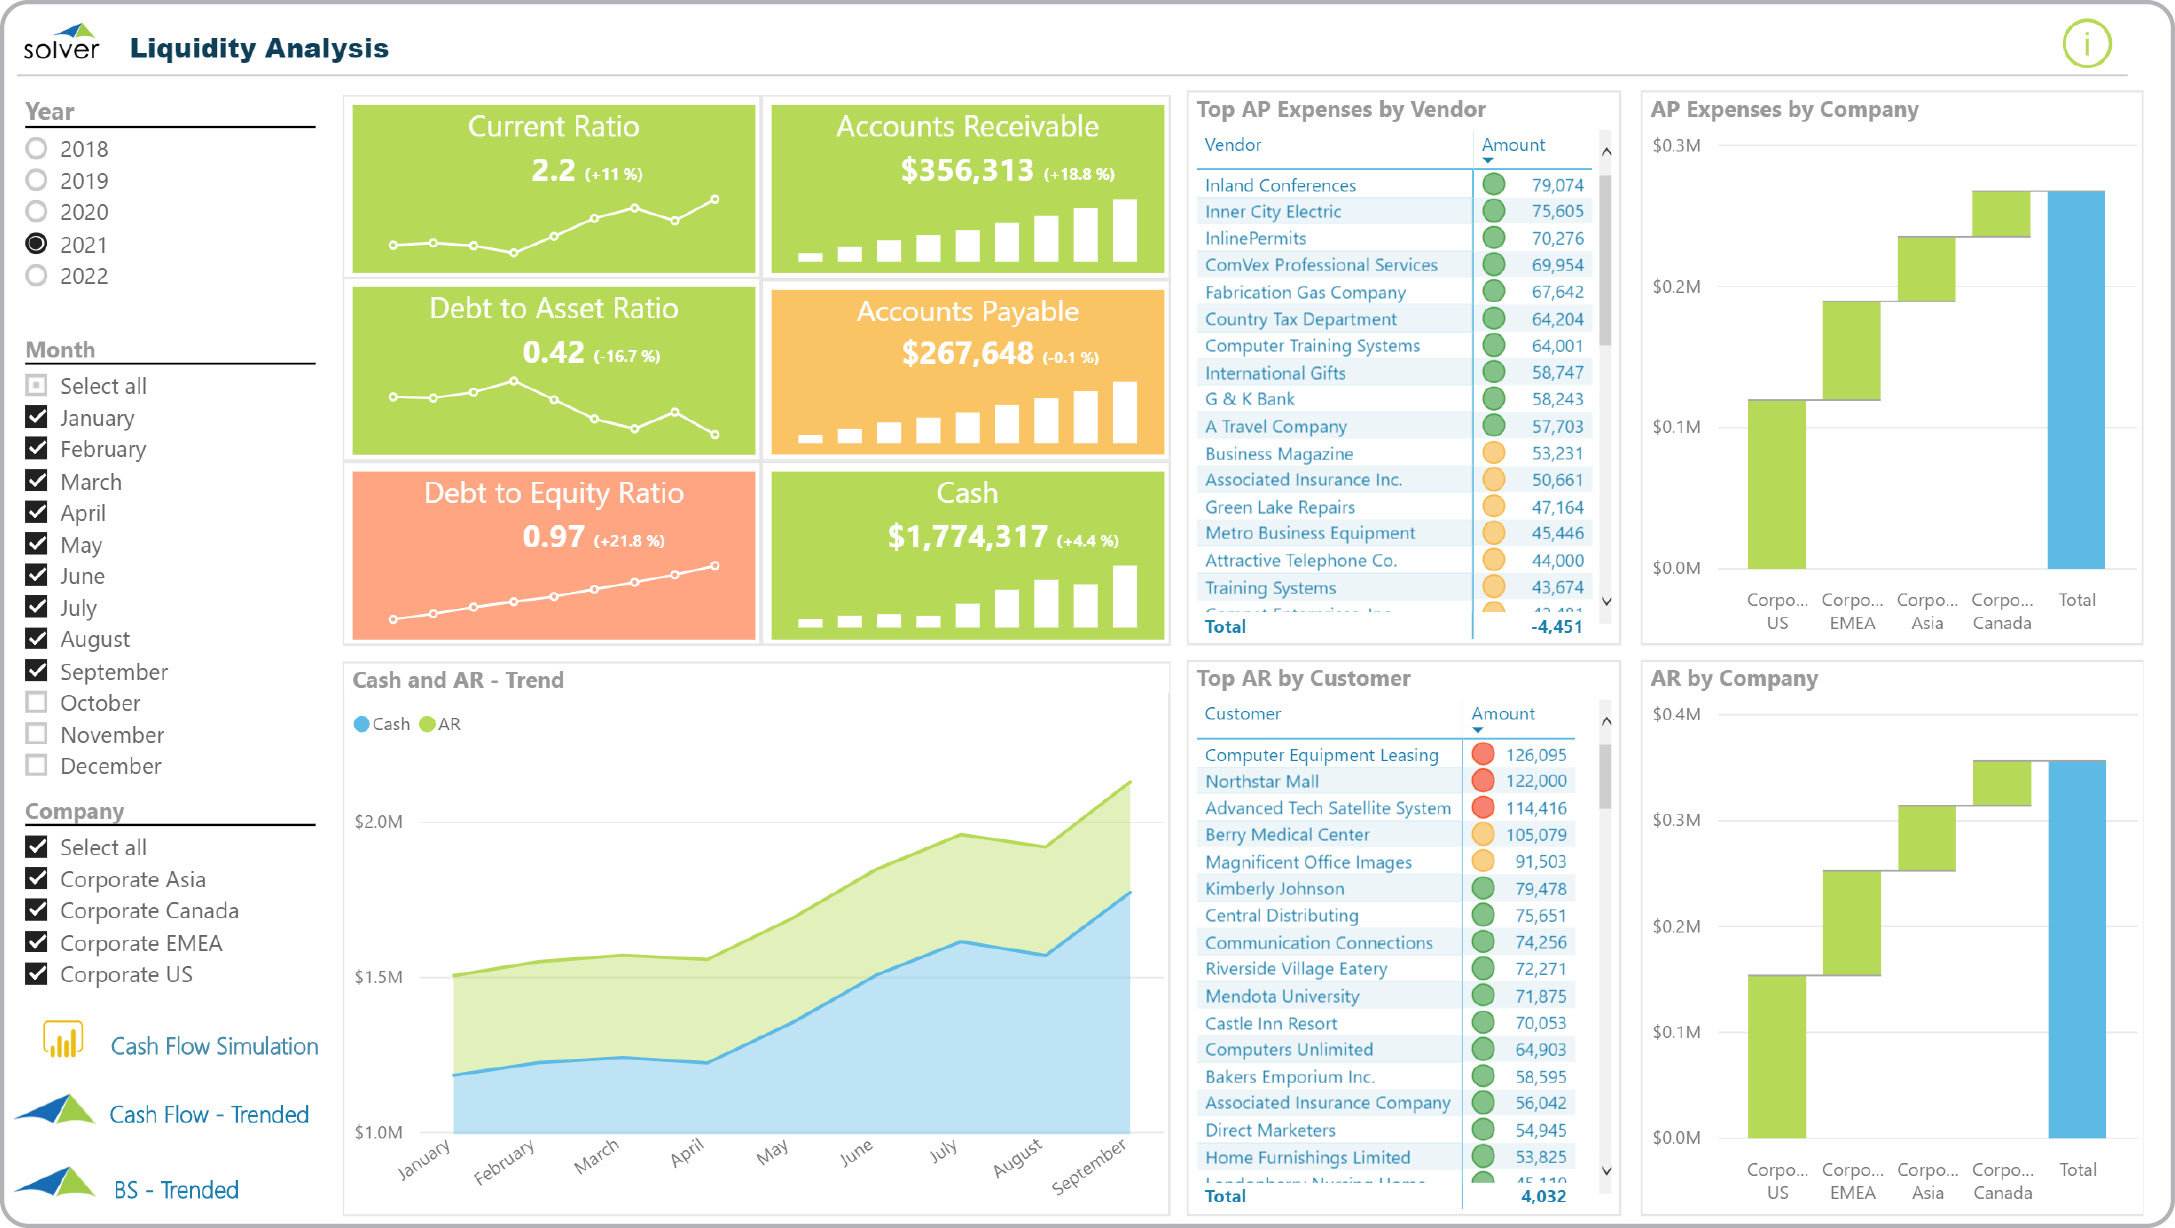
Liquidity Analysis
Power BI dashboard showing analysis of AR, AP and Cash with ranked lists and trends.
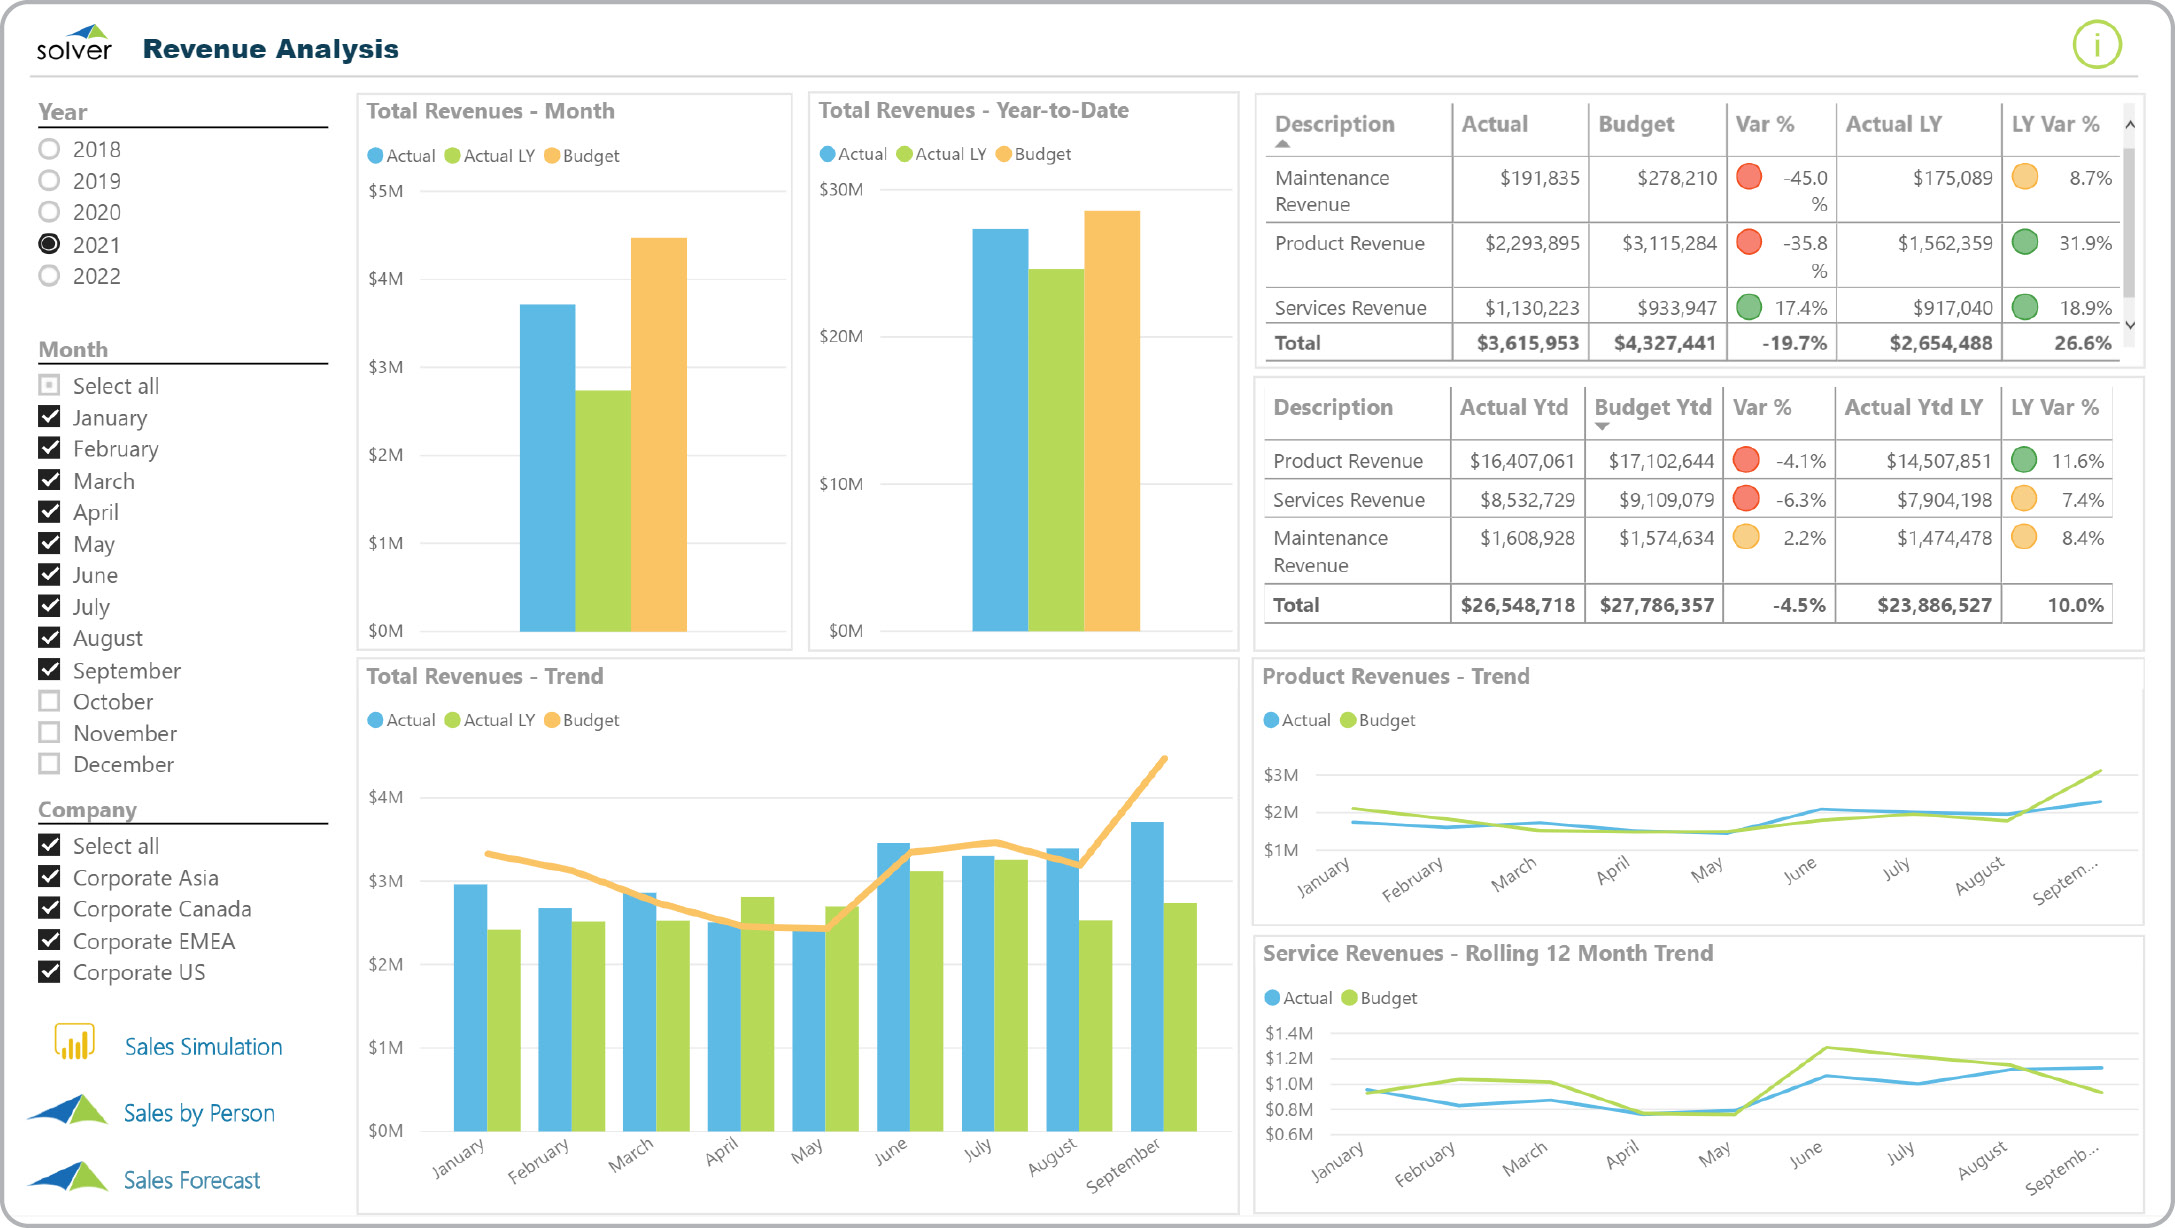
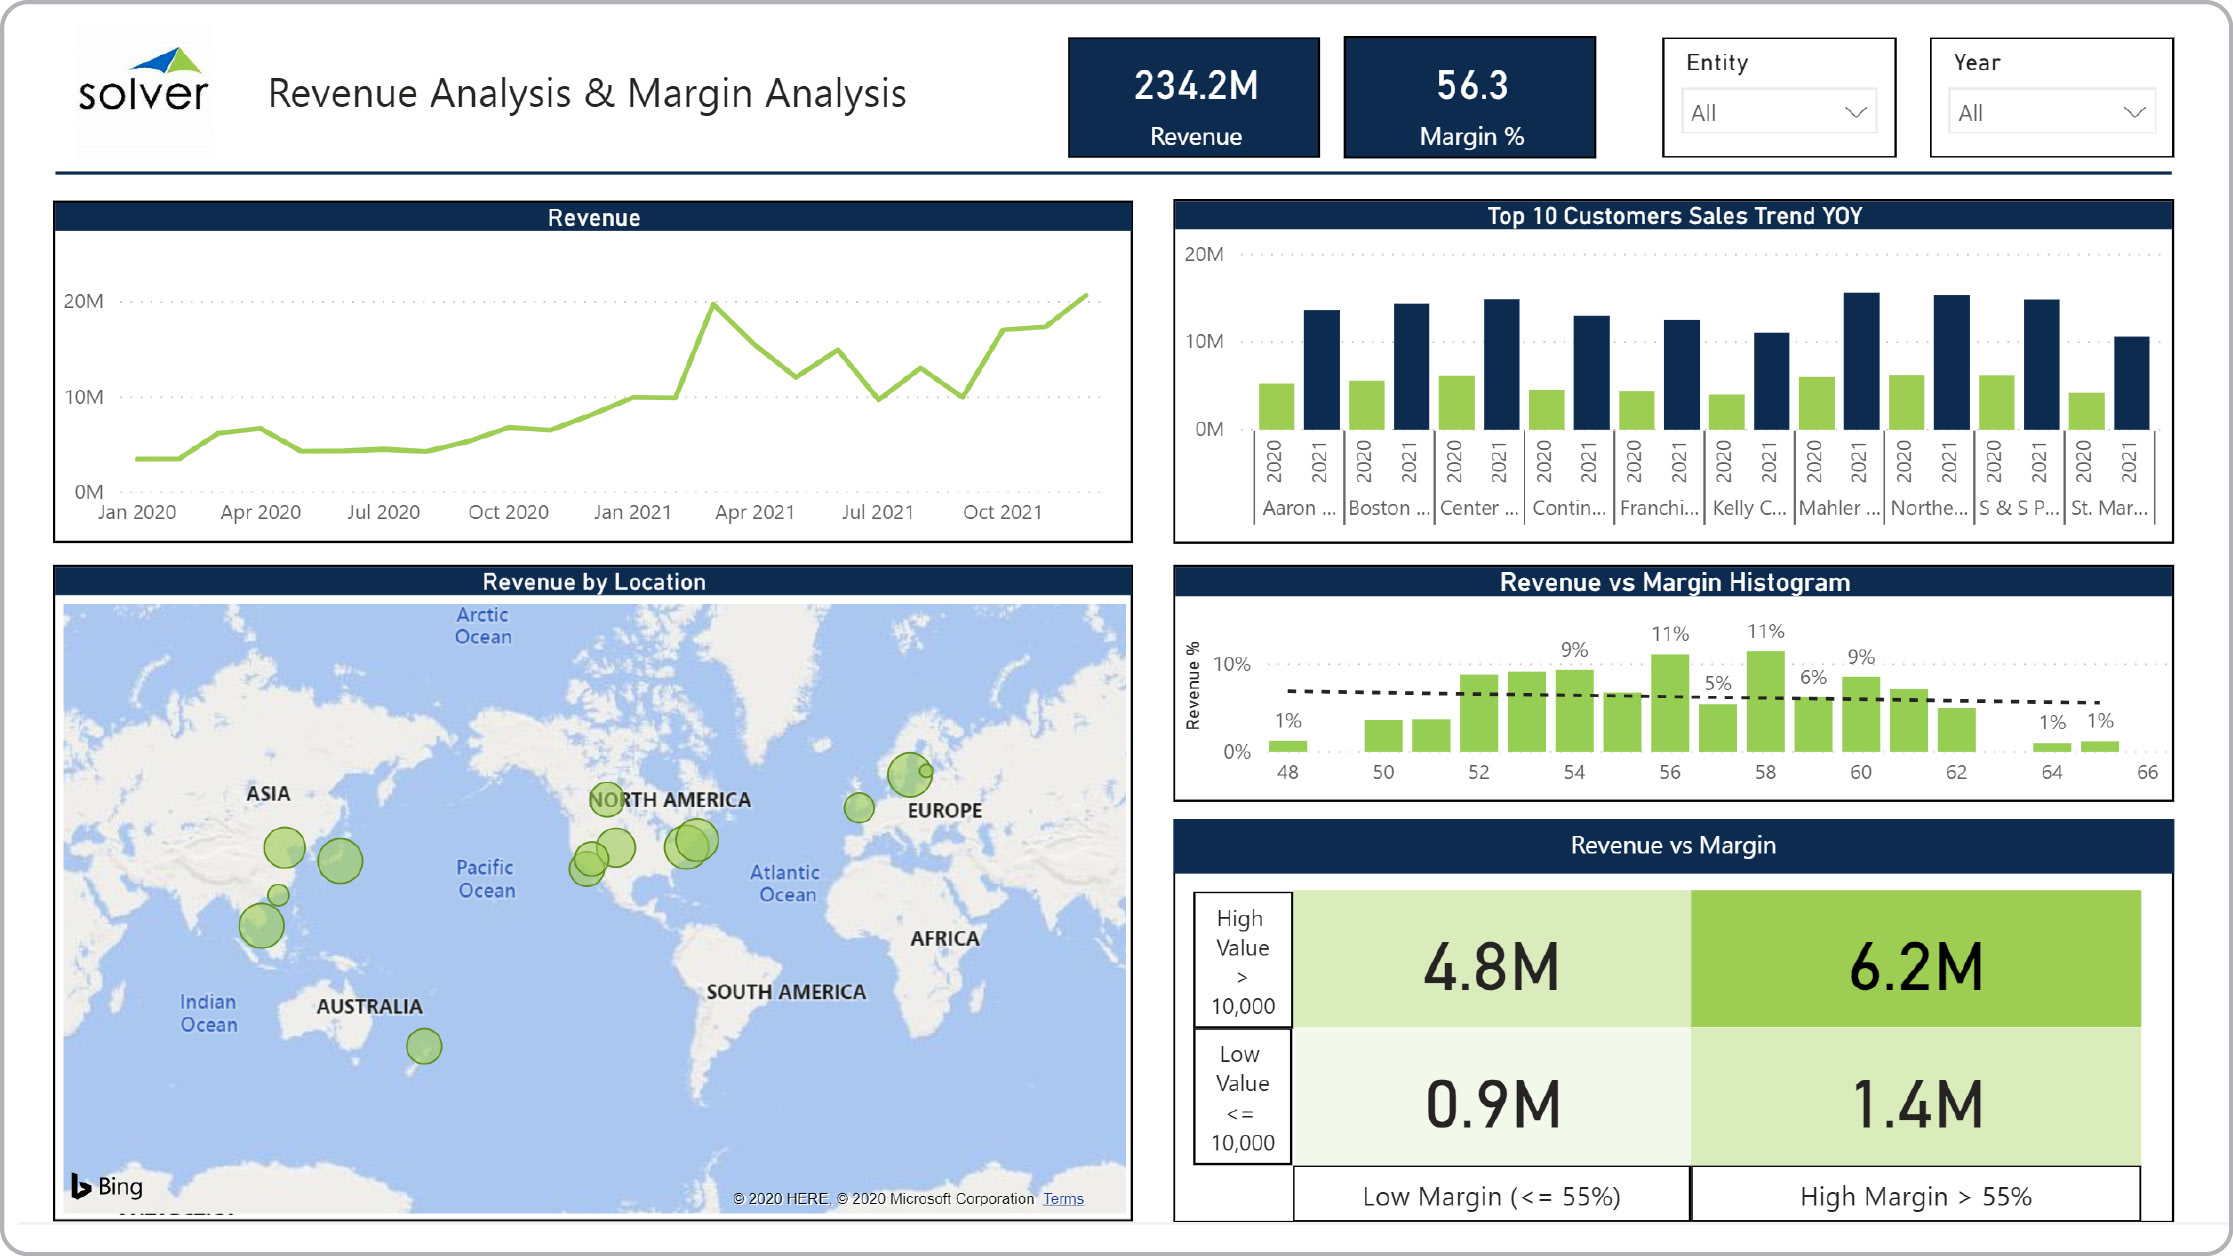
Revenue Analysis
Power BI dashboard showing analysis of actual and budget revenues by month and trended.
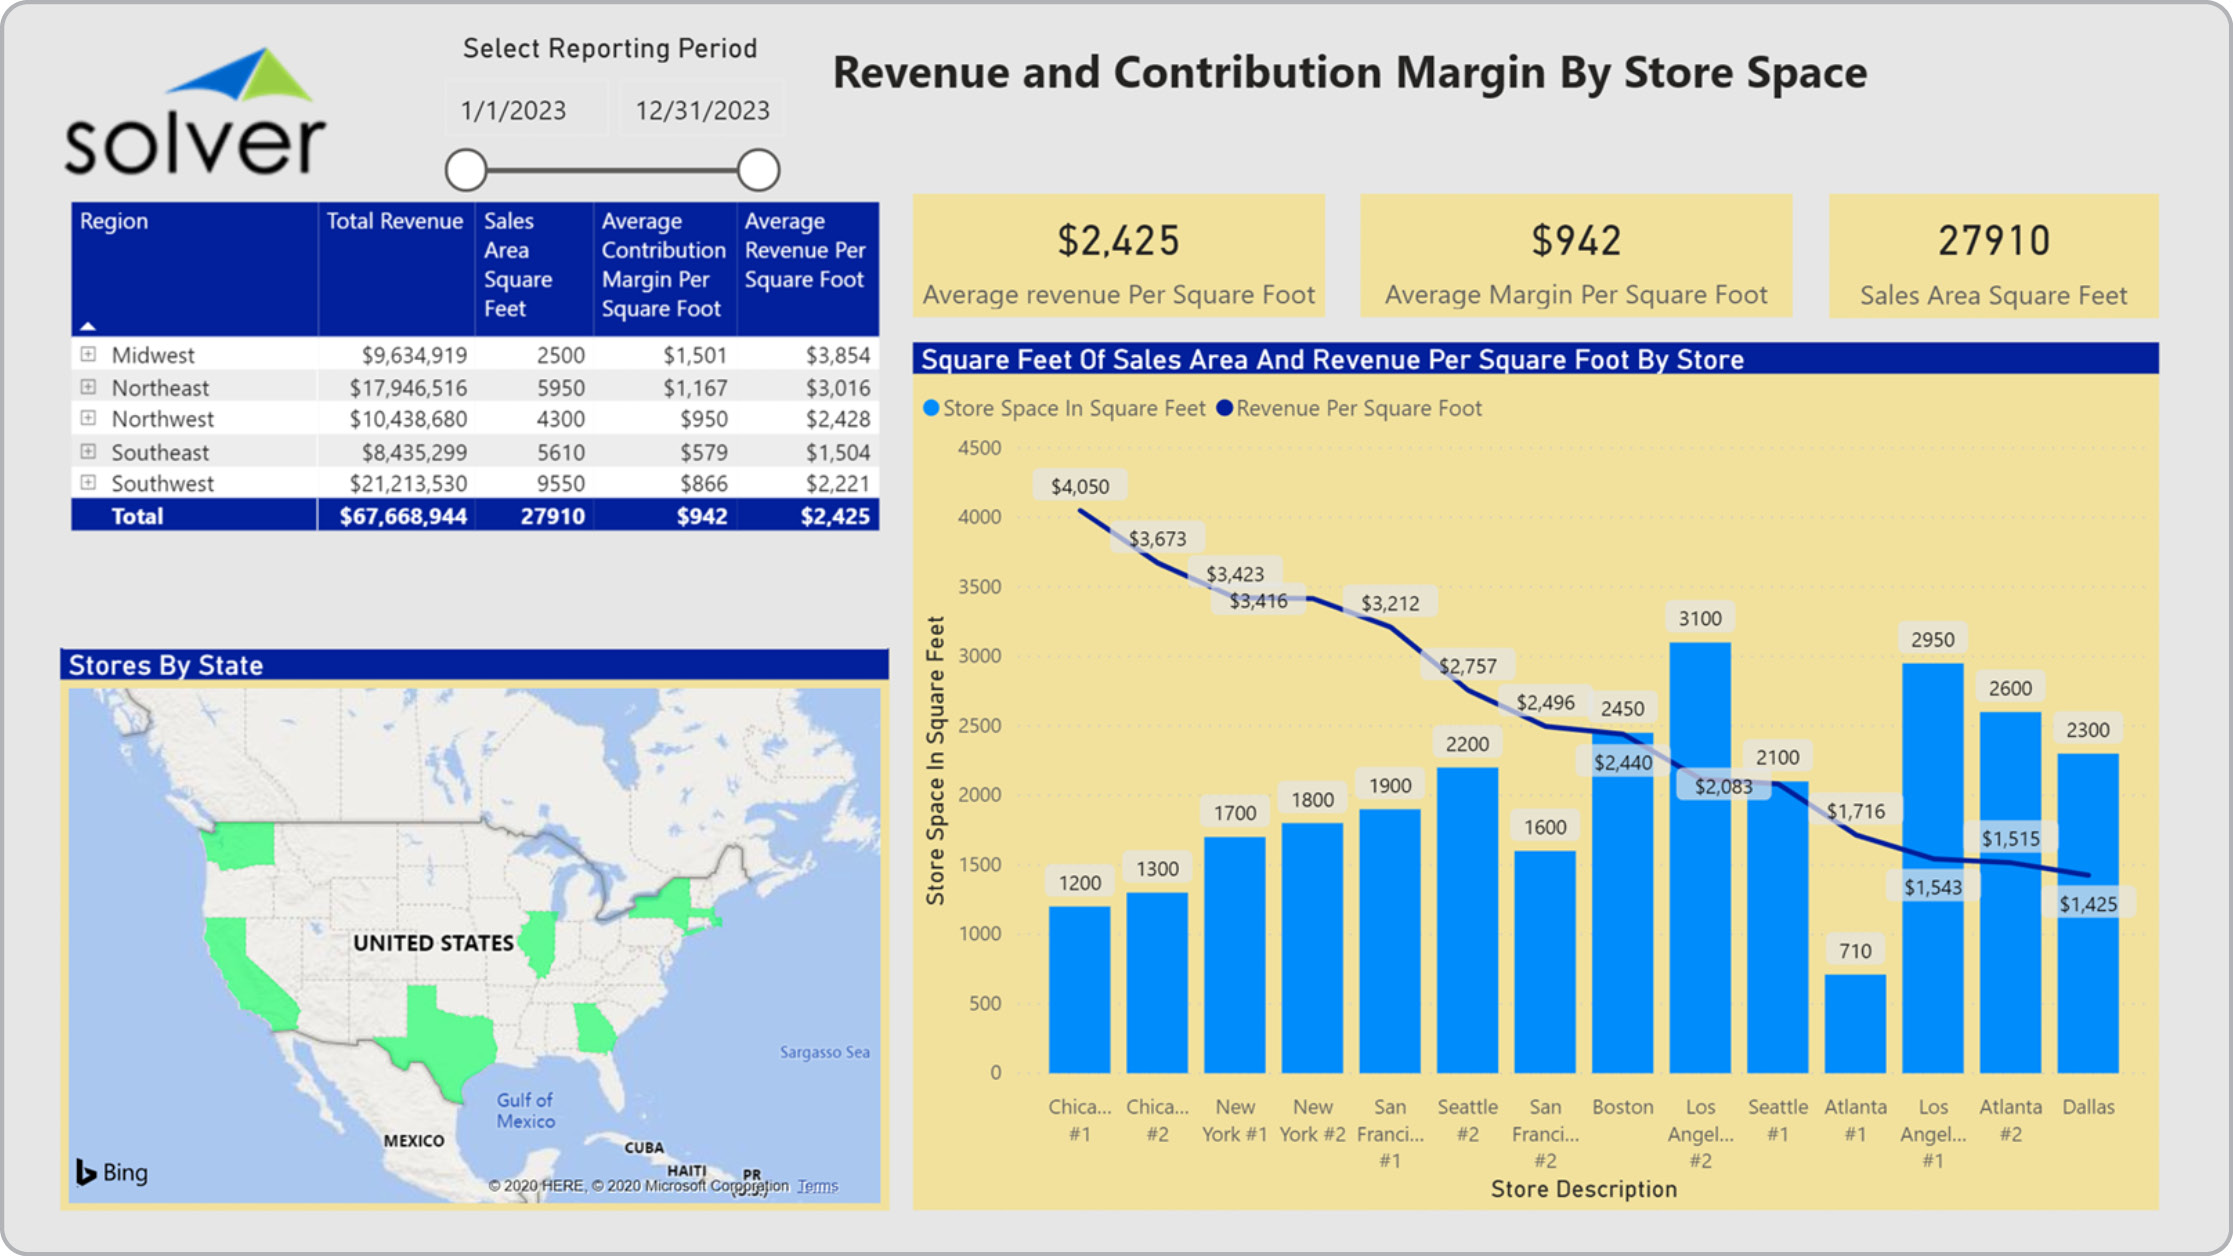
Retail – Revenue per Square Foot
Retail dashboard with analysis of revenue per square foot.
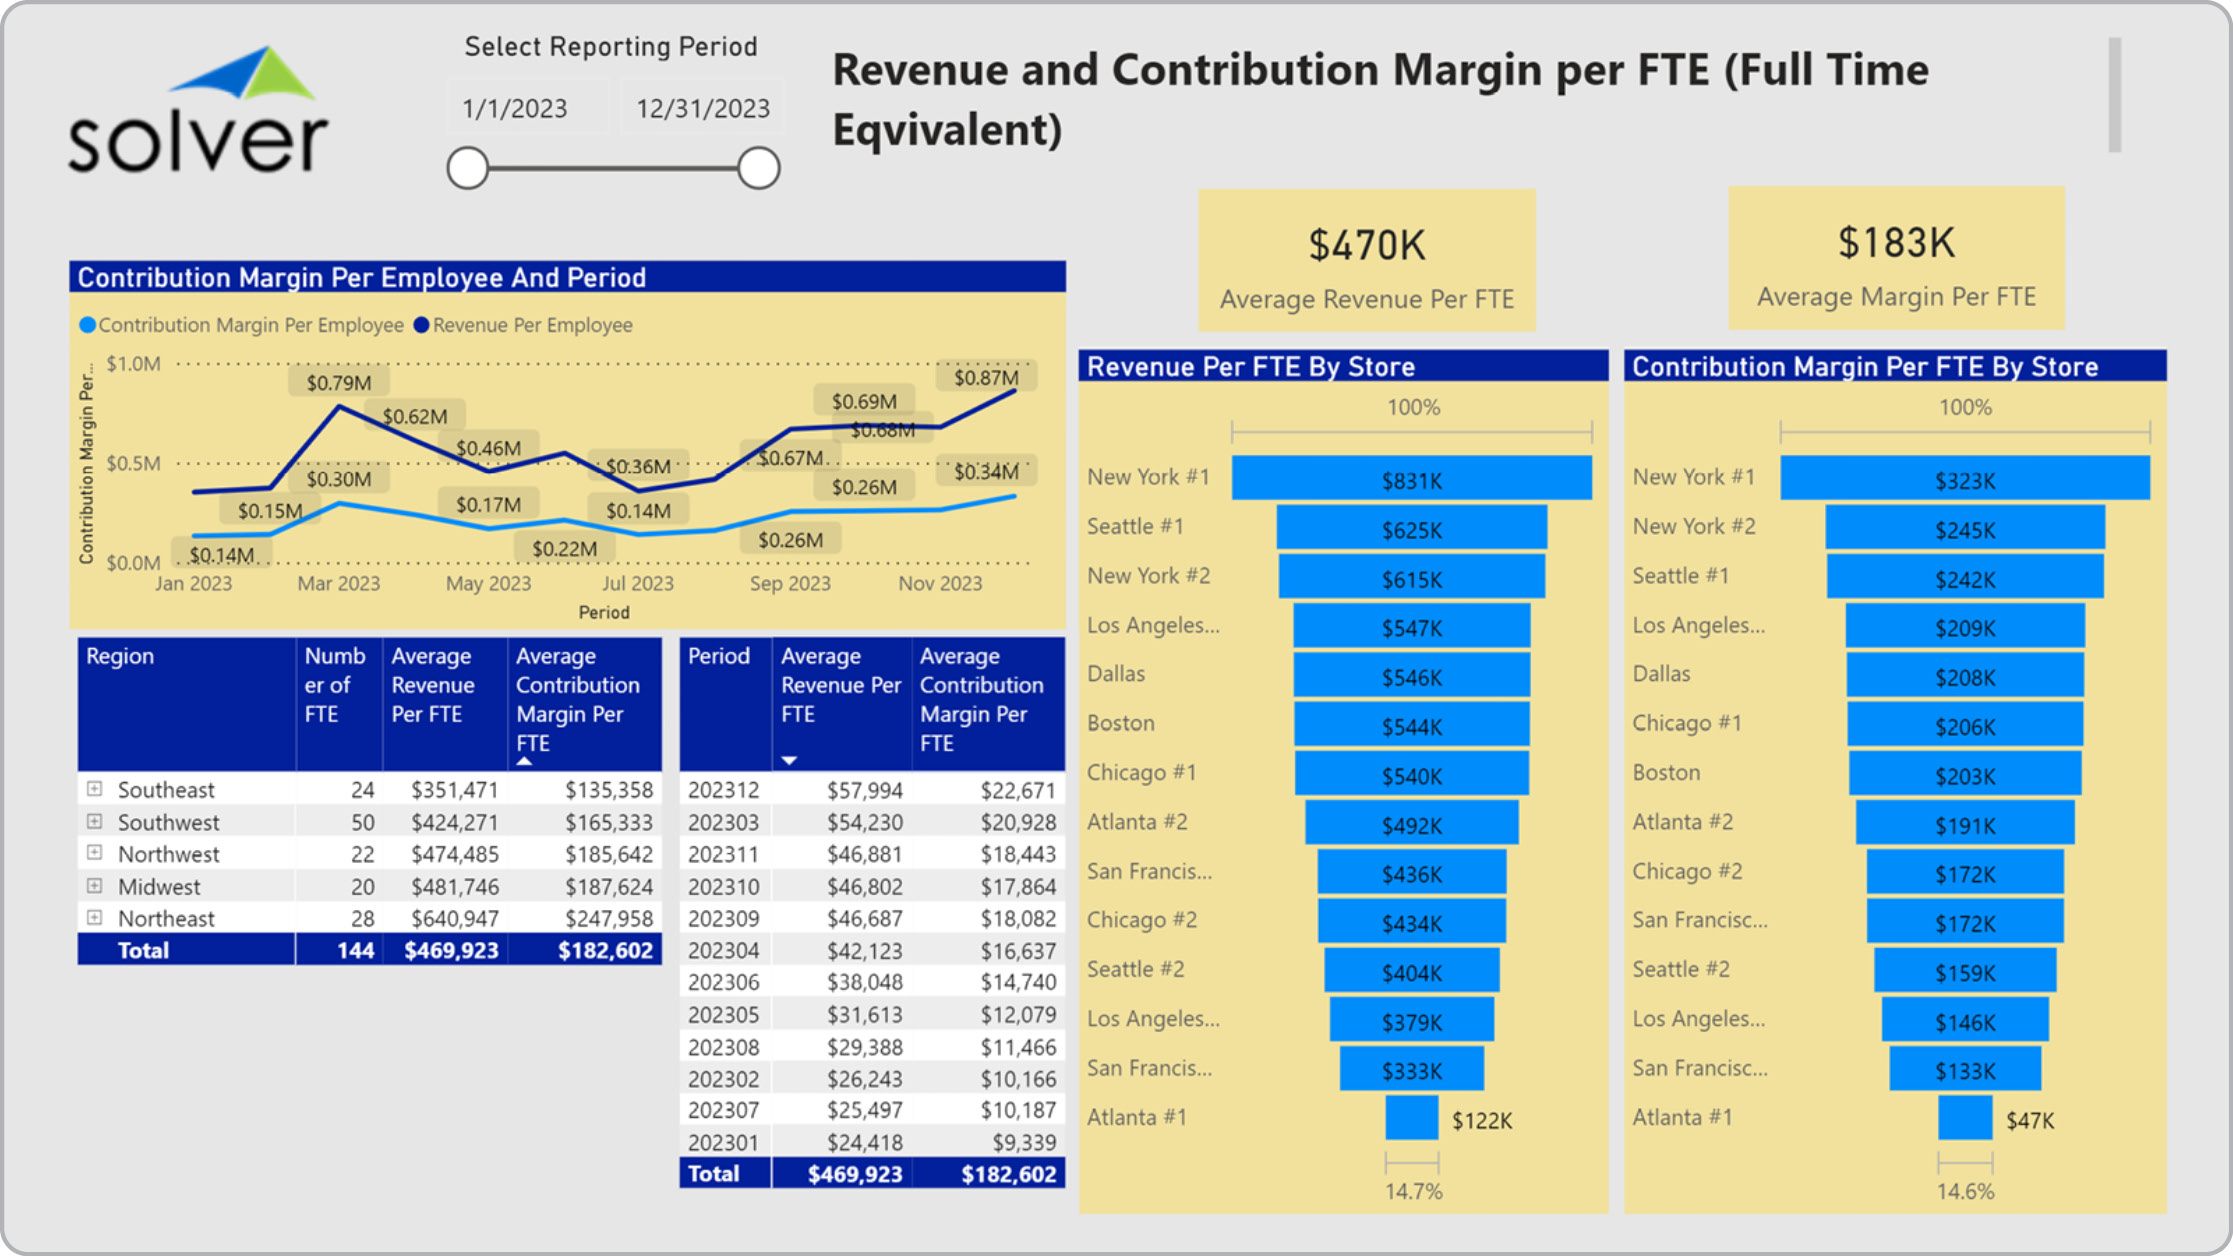
Retail – Revenue per FTE
Retail dashboard with analysis of revenue and contribution margin per employee (FTE).
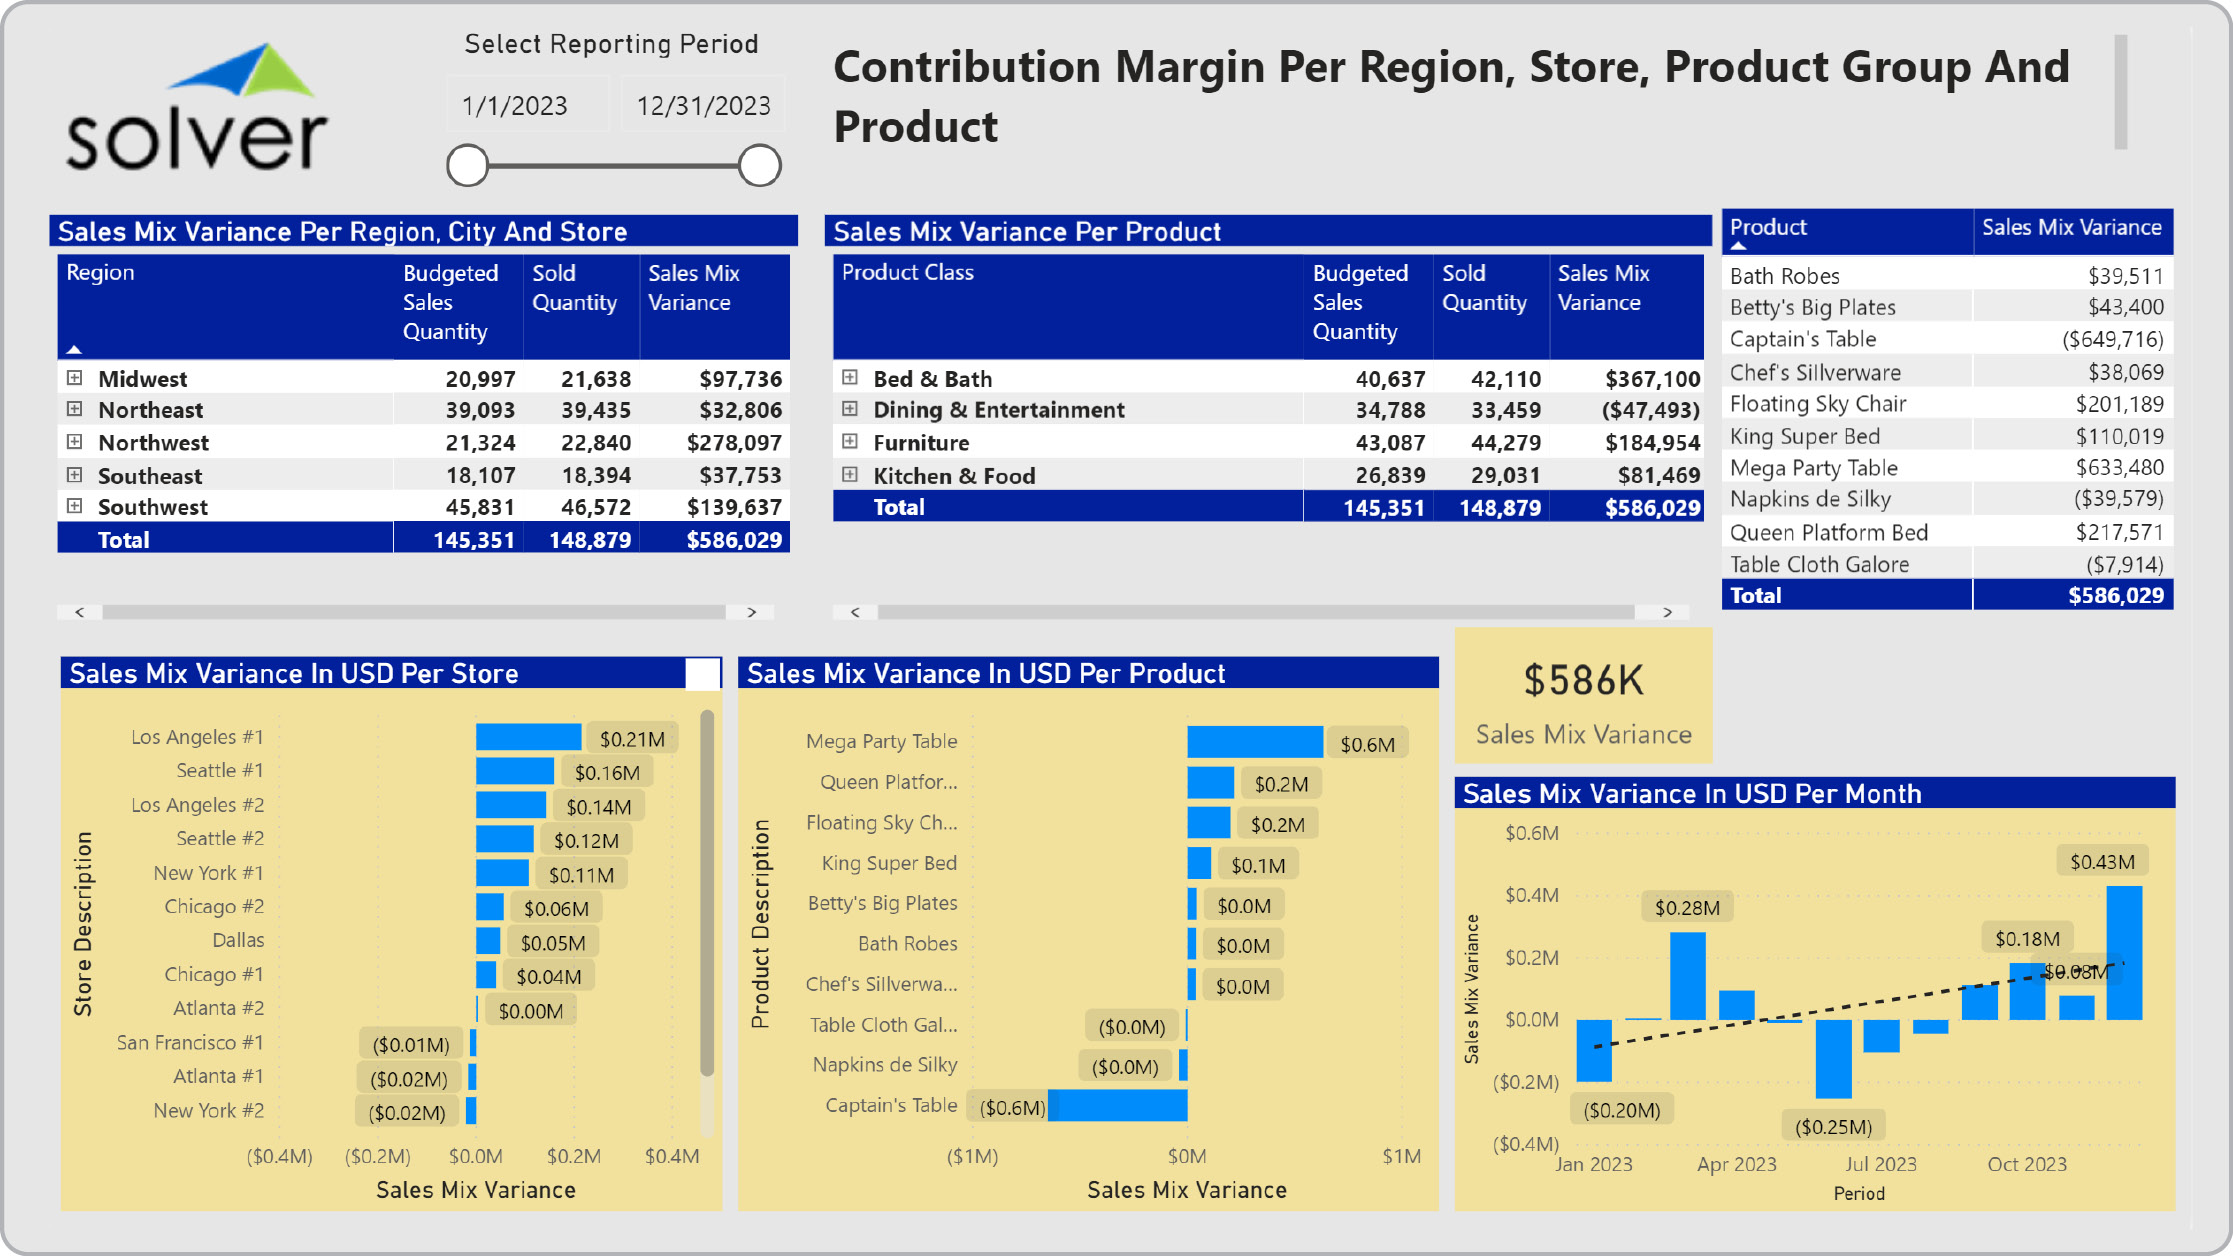
Retail – Sales Mix
Retail dashboard with analysis of volume and price per region, store and product.
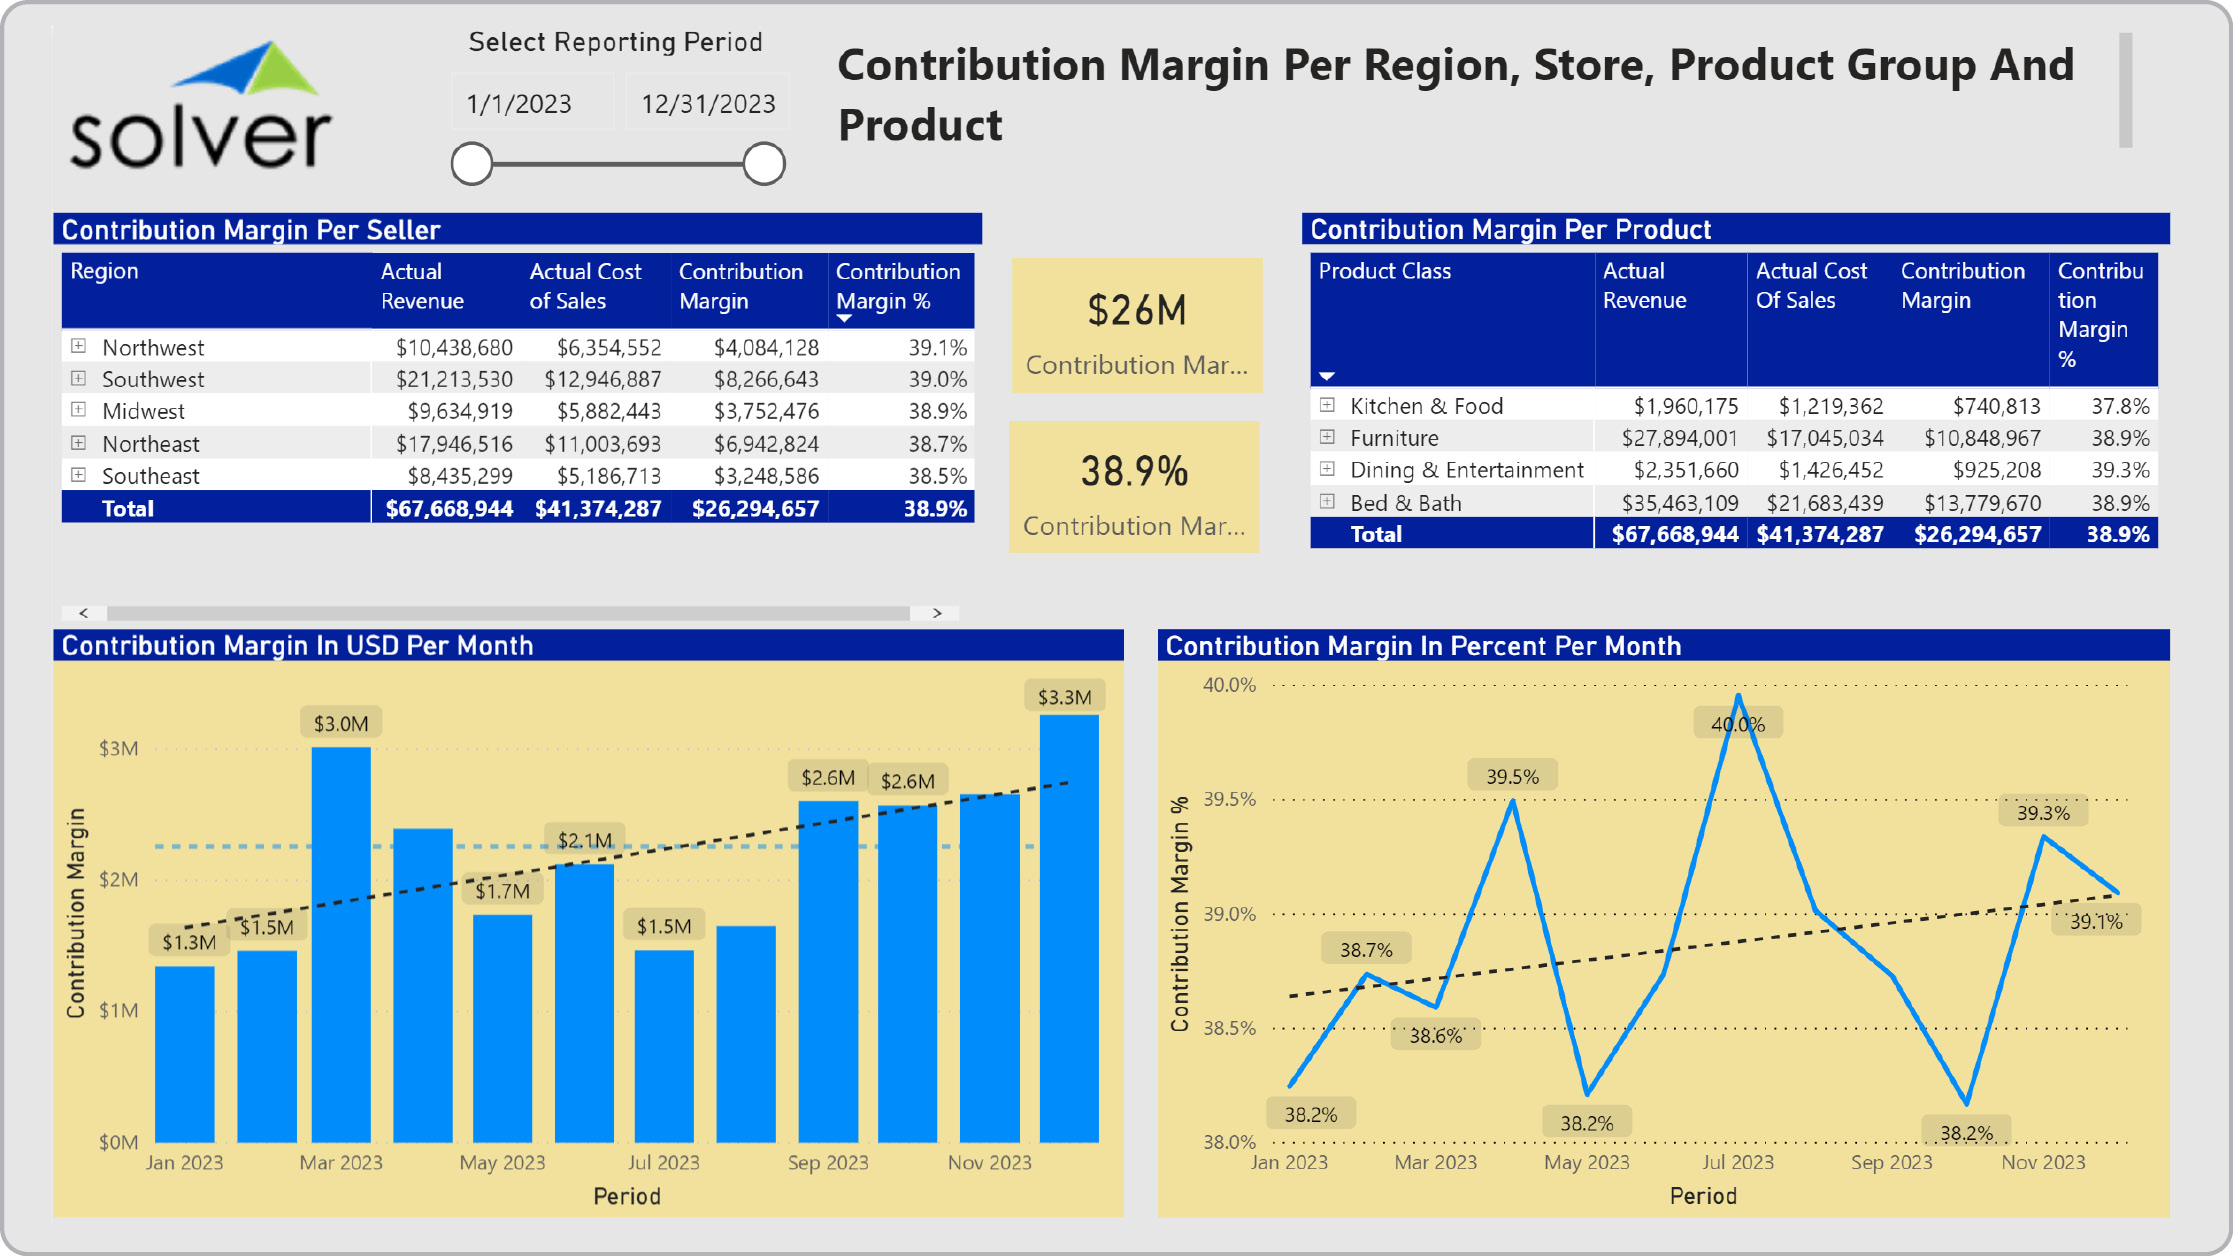
Retail – Contribution Margin
Retail dashboard with analysis of volume and price per region, store and product.
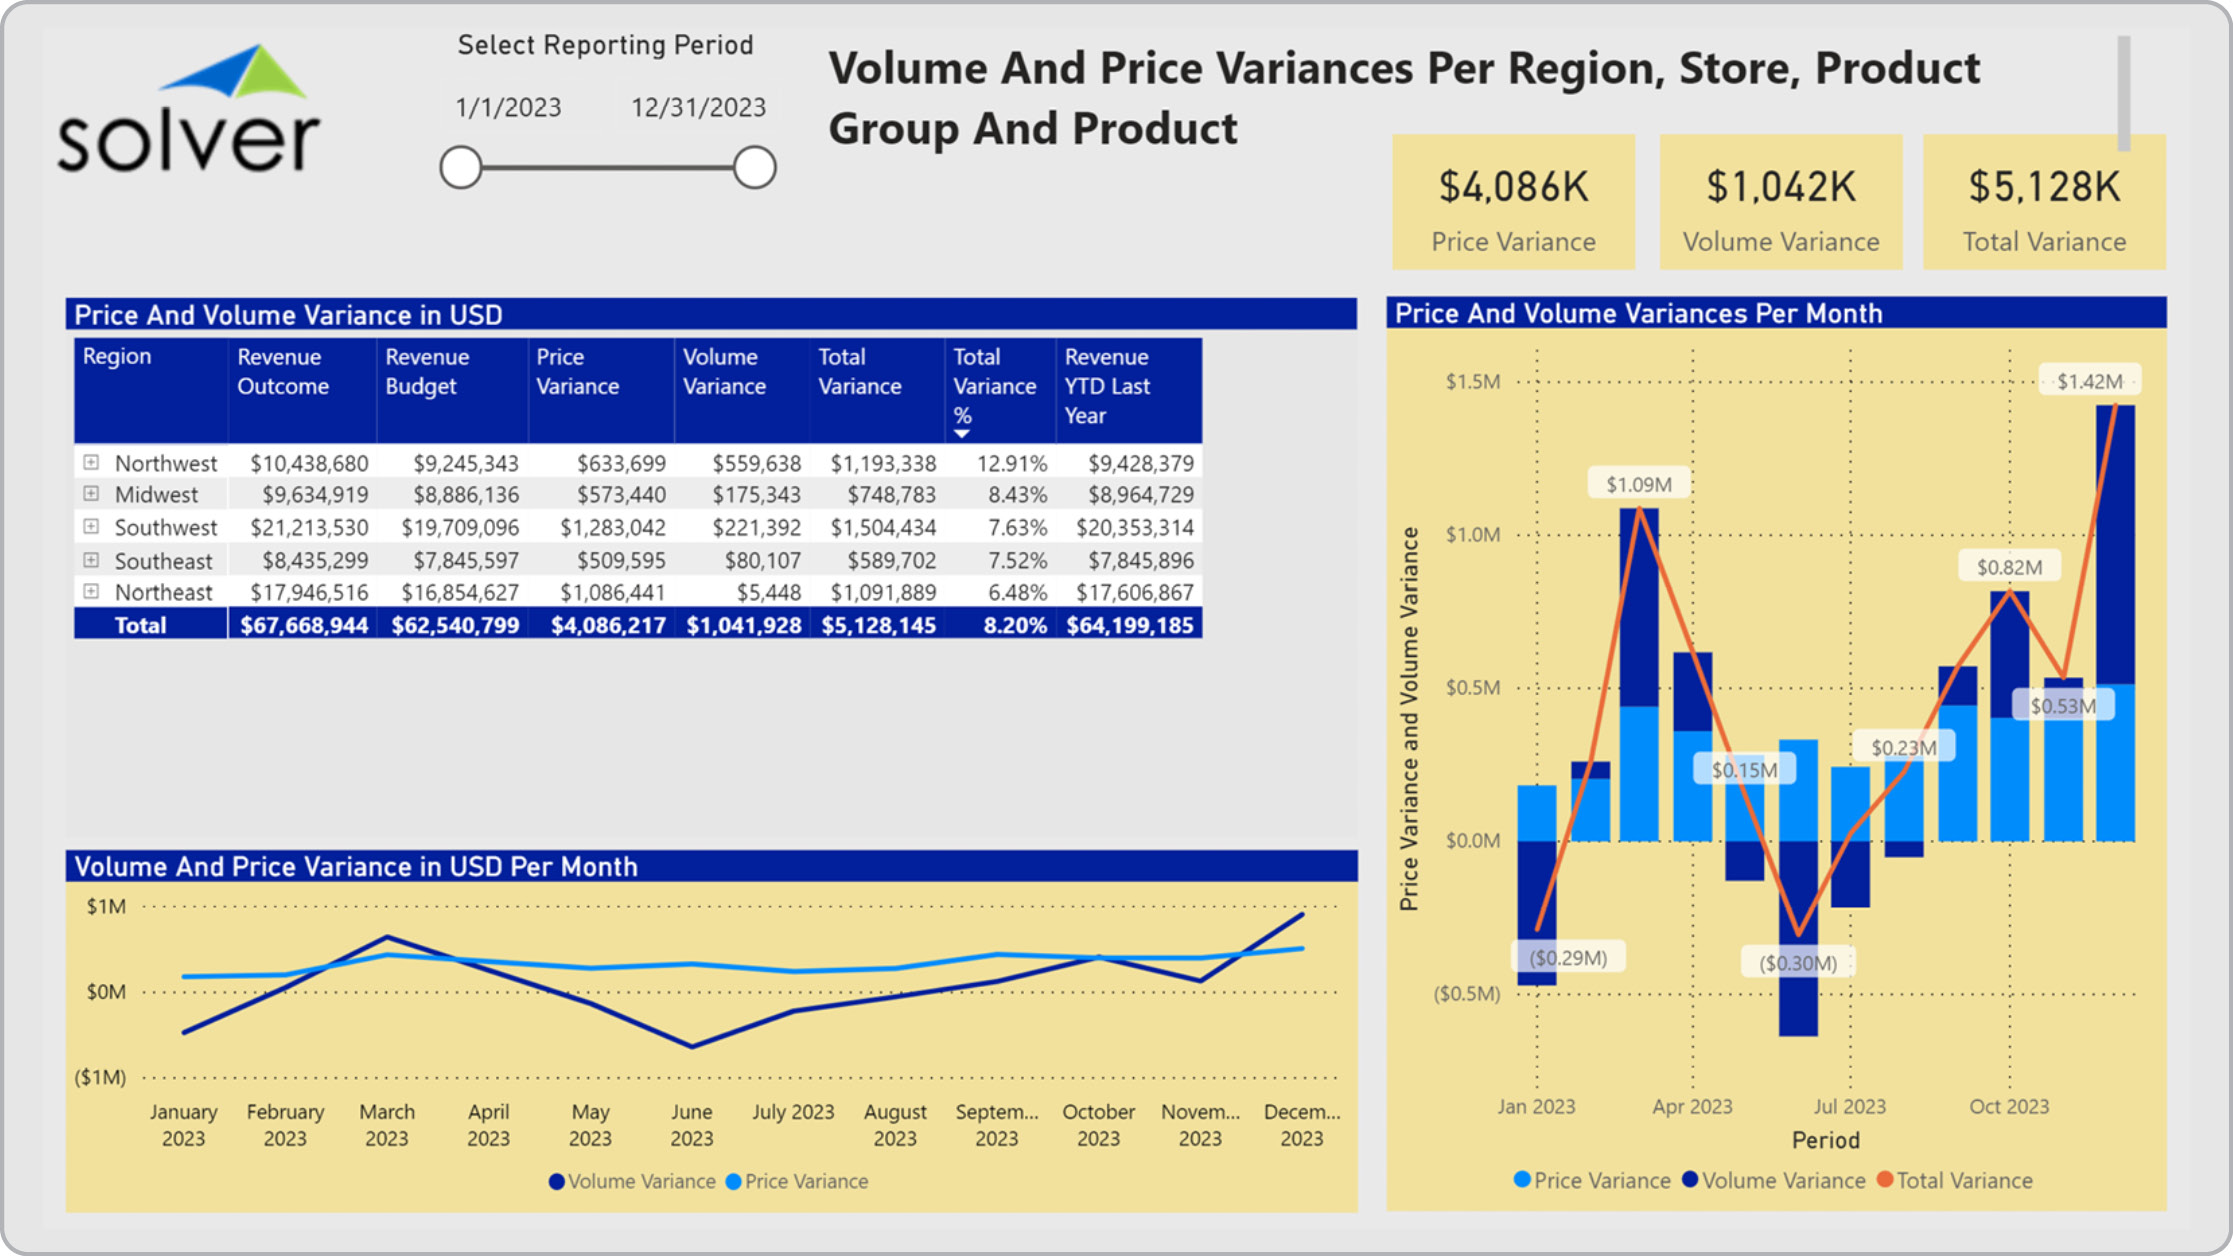
Retail – Volume & Price per Region and Store
Retail dashboard with analysis of sales mix per region, store and product.
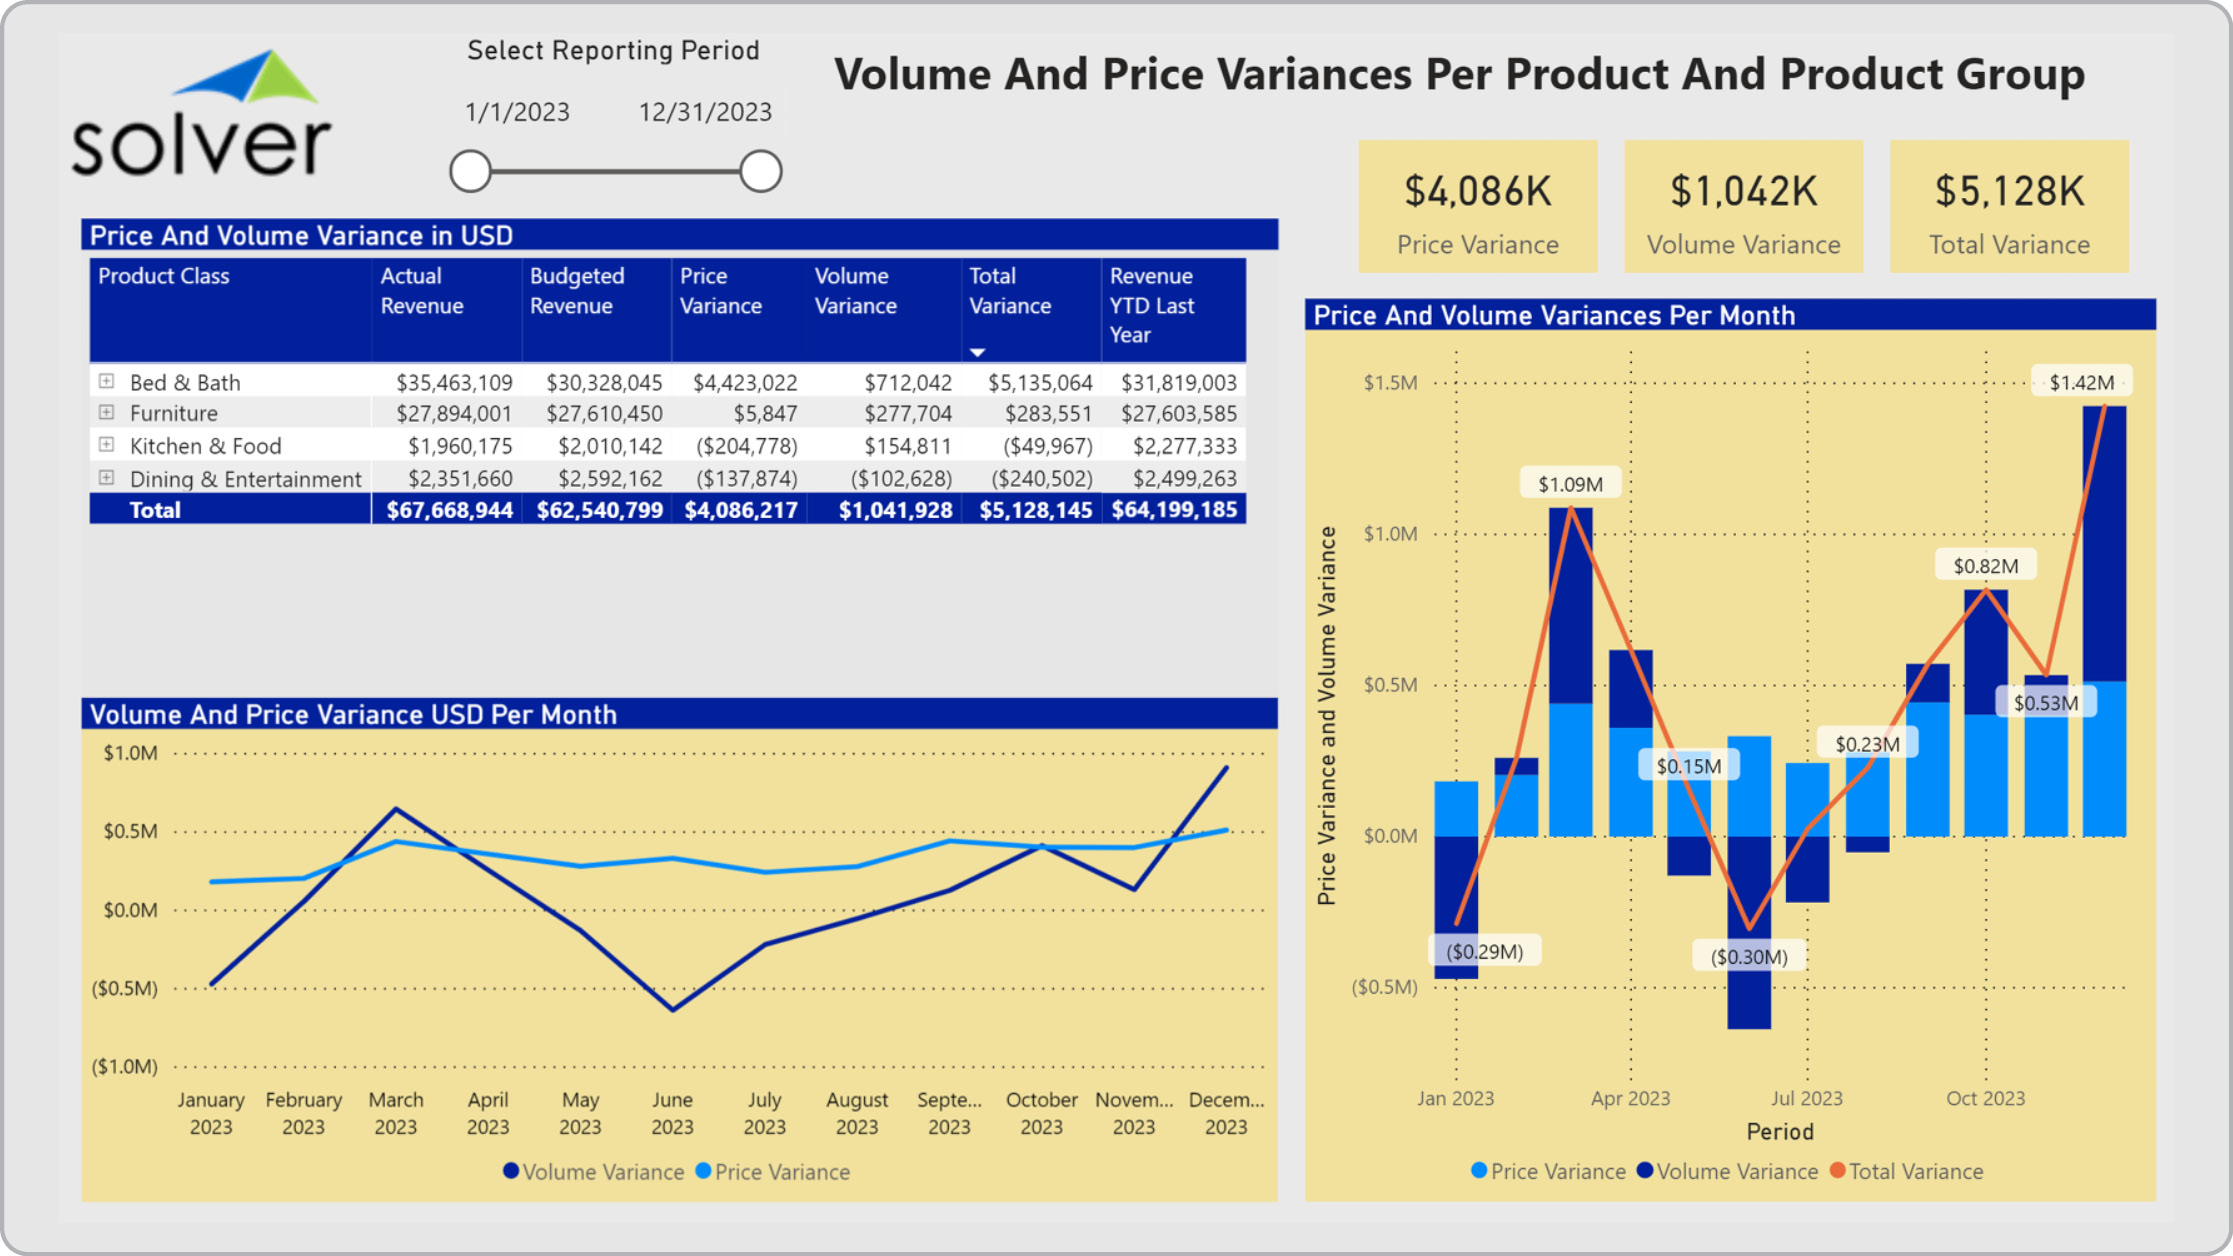
Retail – Volume & Price per Product
Retail dashboard with revenue per product analysis.
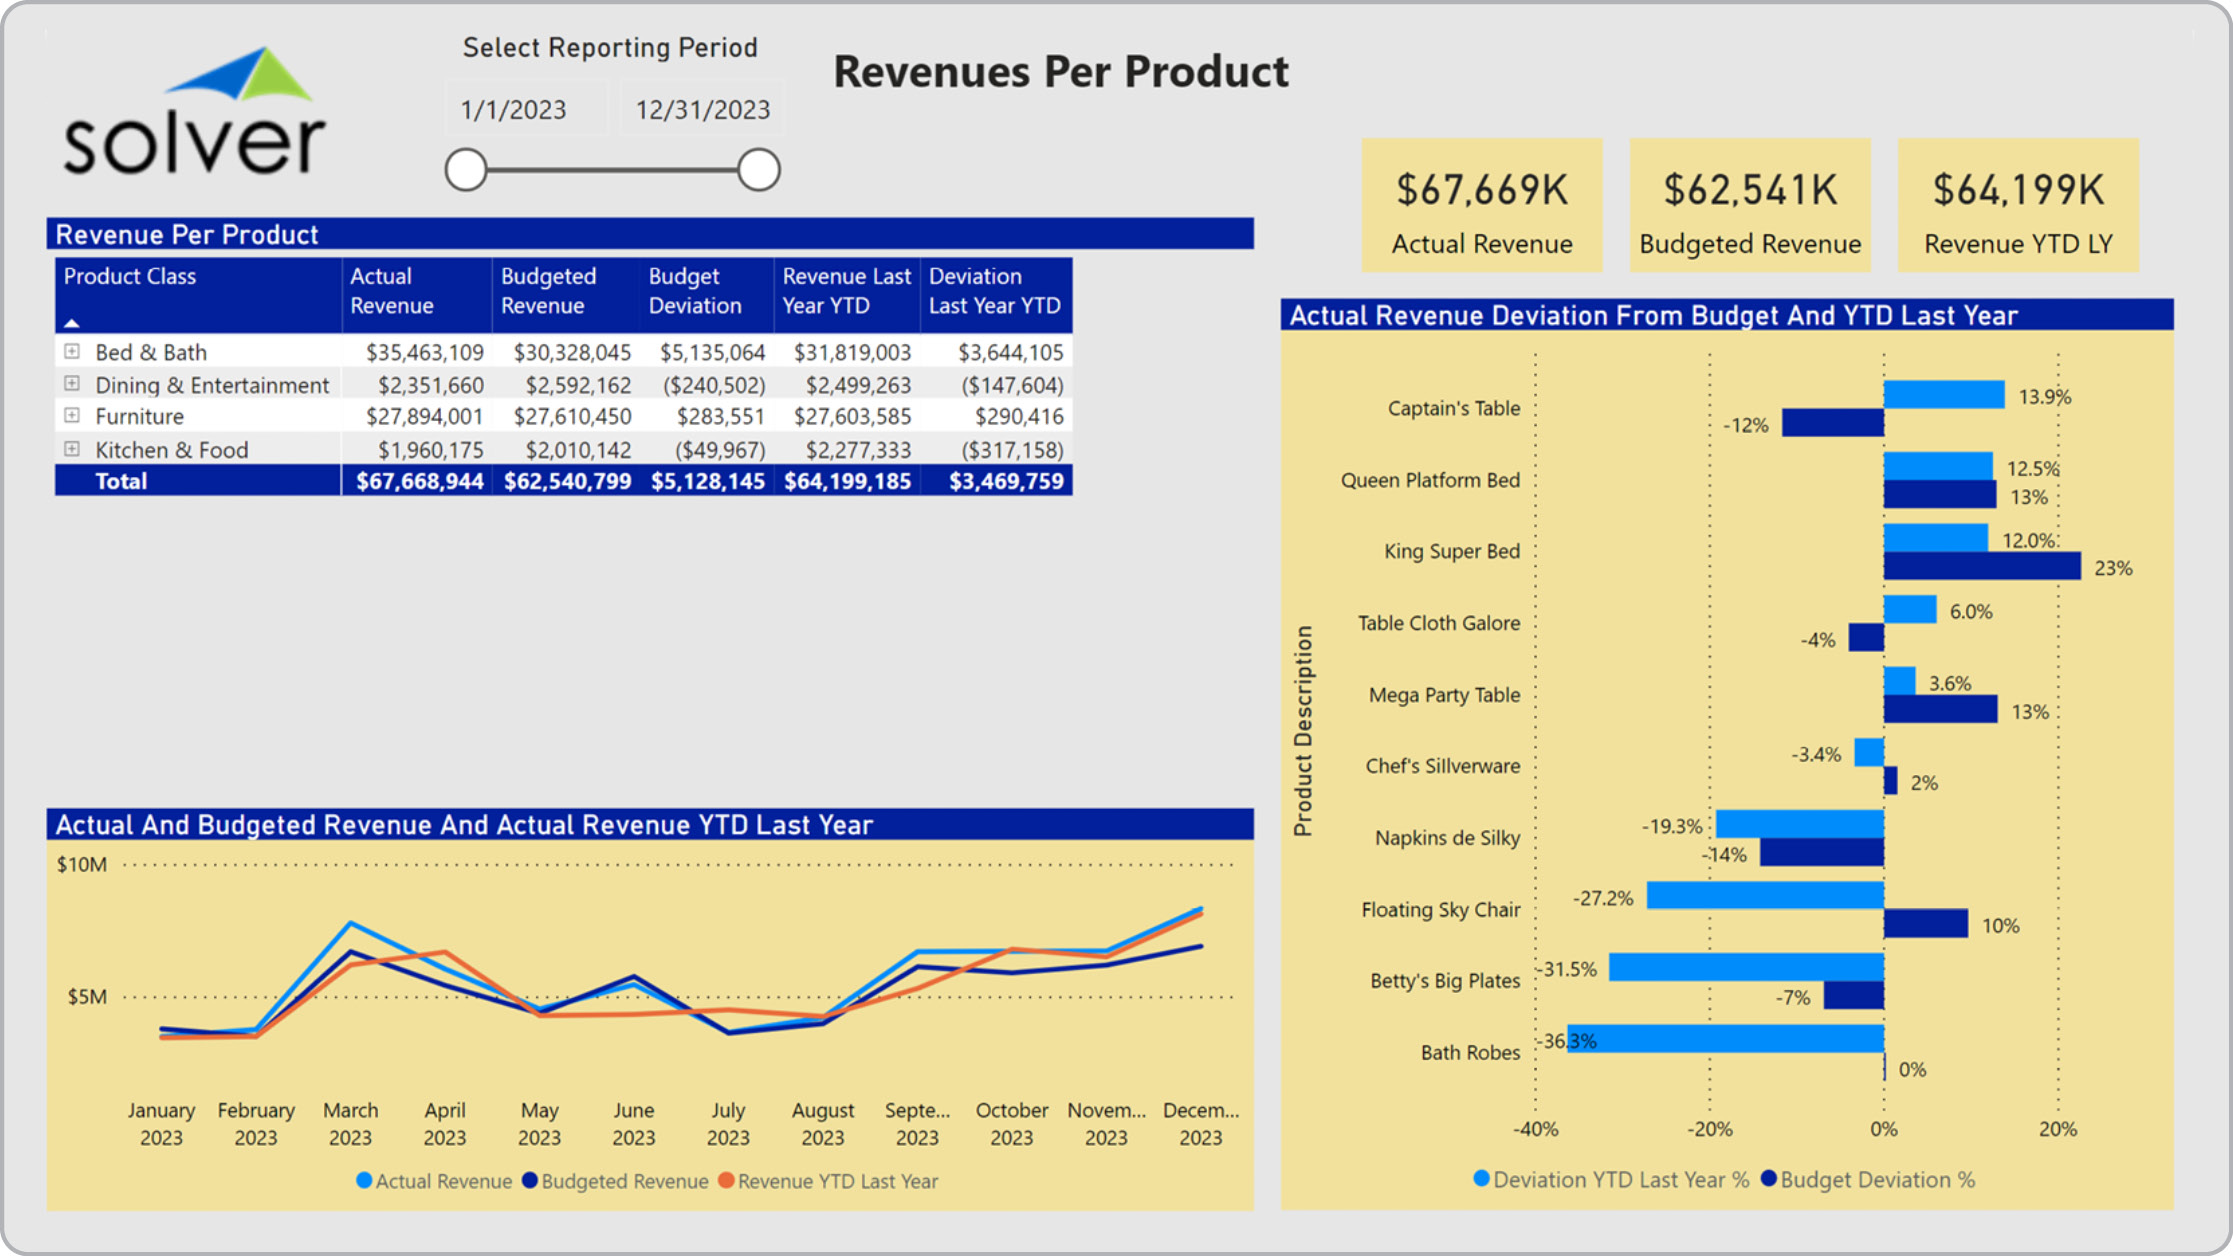
Retail – Revenues per Product
Retail dashboard with revenue per product analysis.
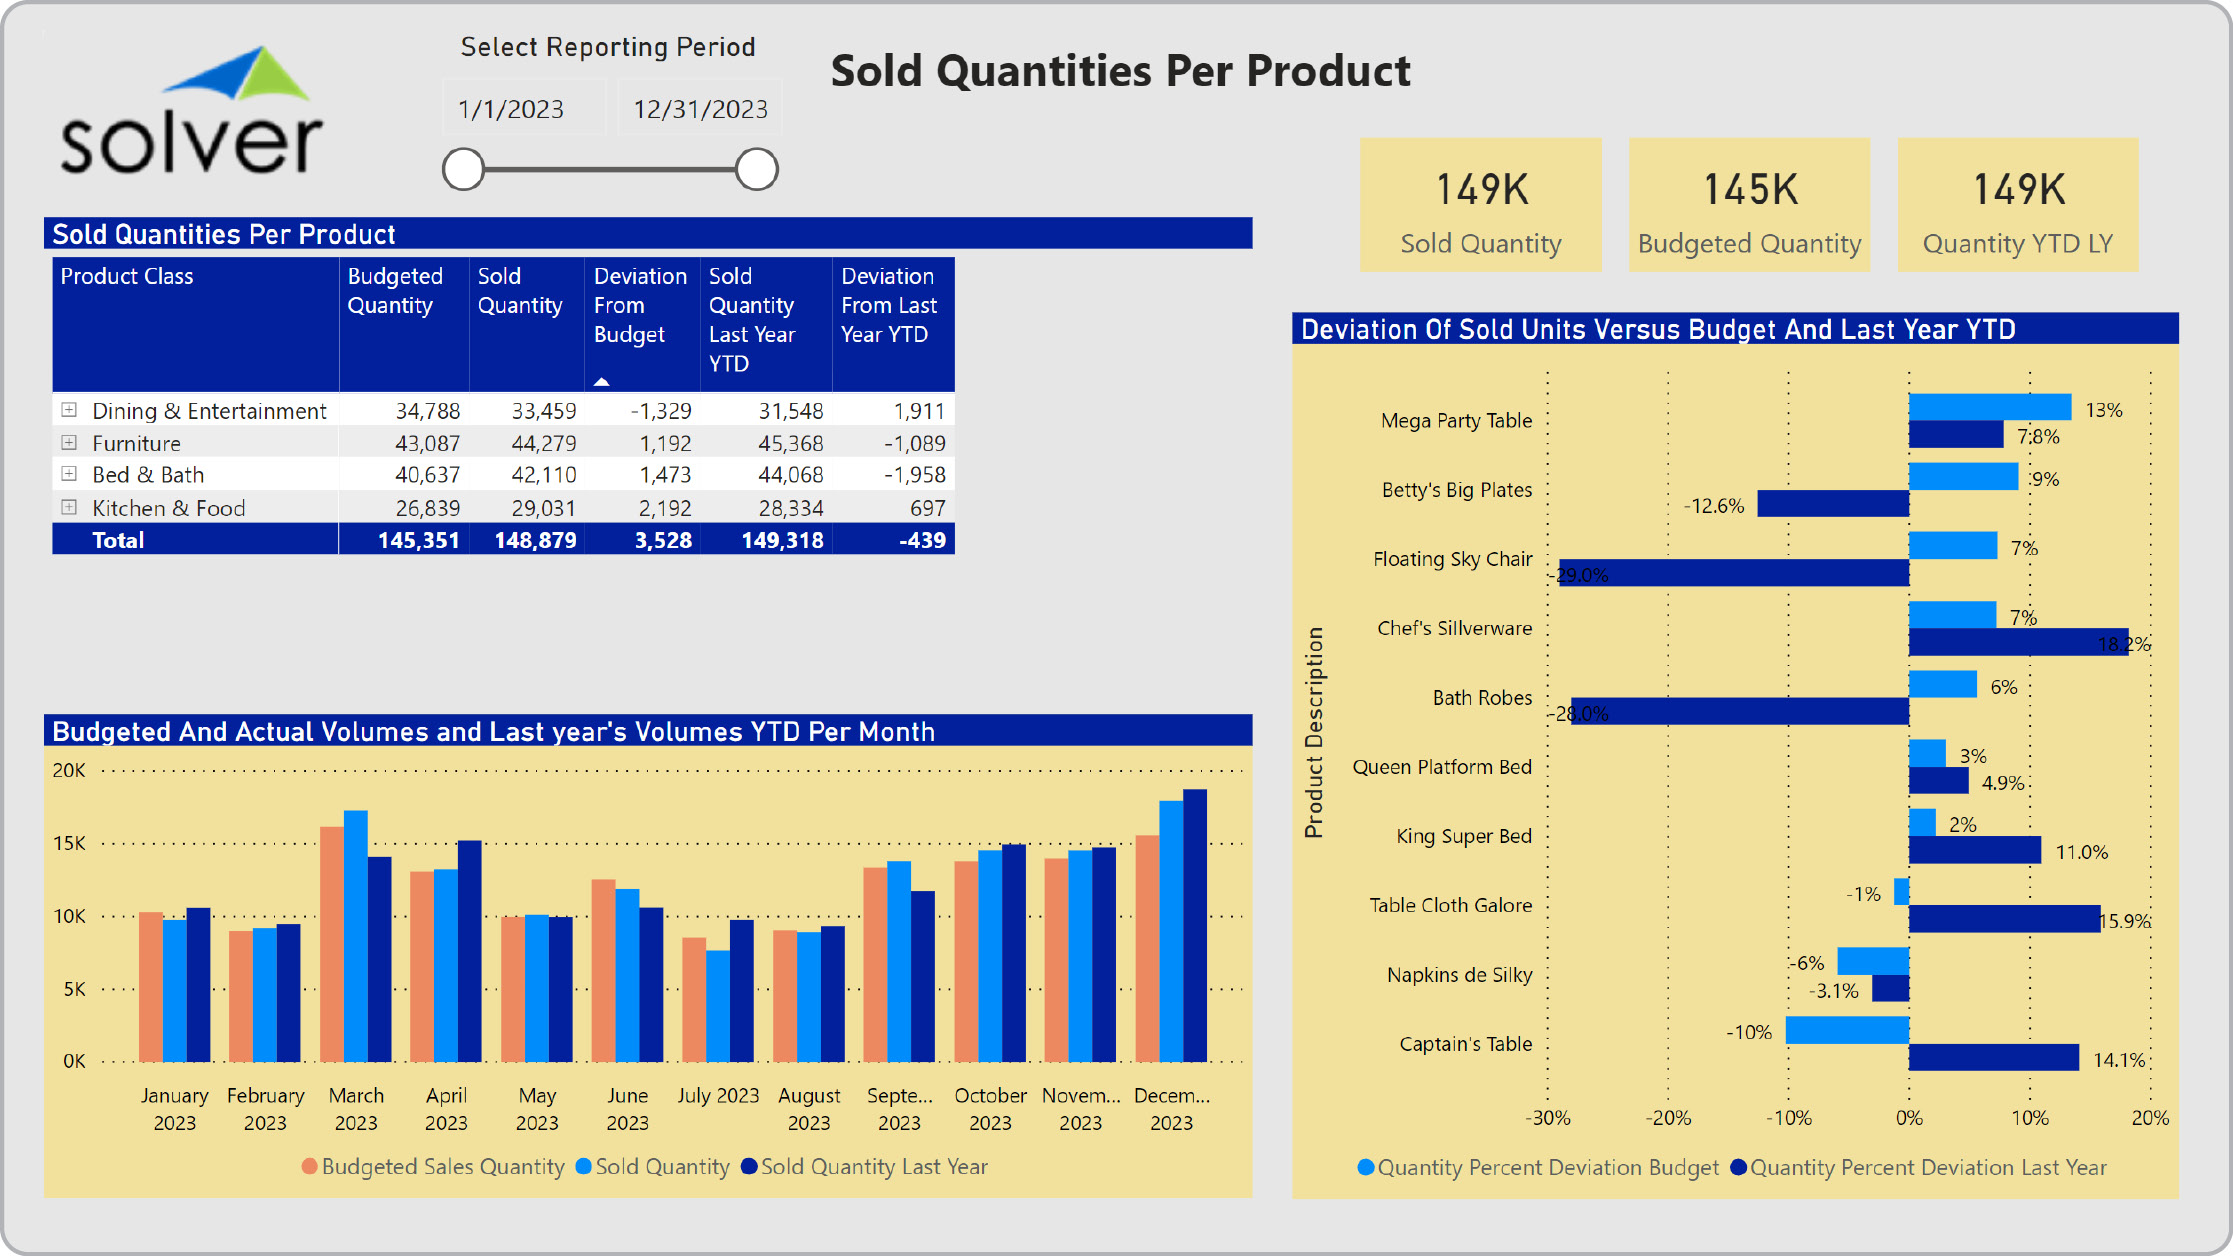
Retail – Sold Quantities per Product
Retail dashboard with sold quantities per product analysis.
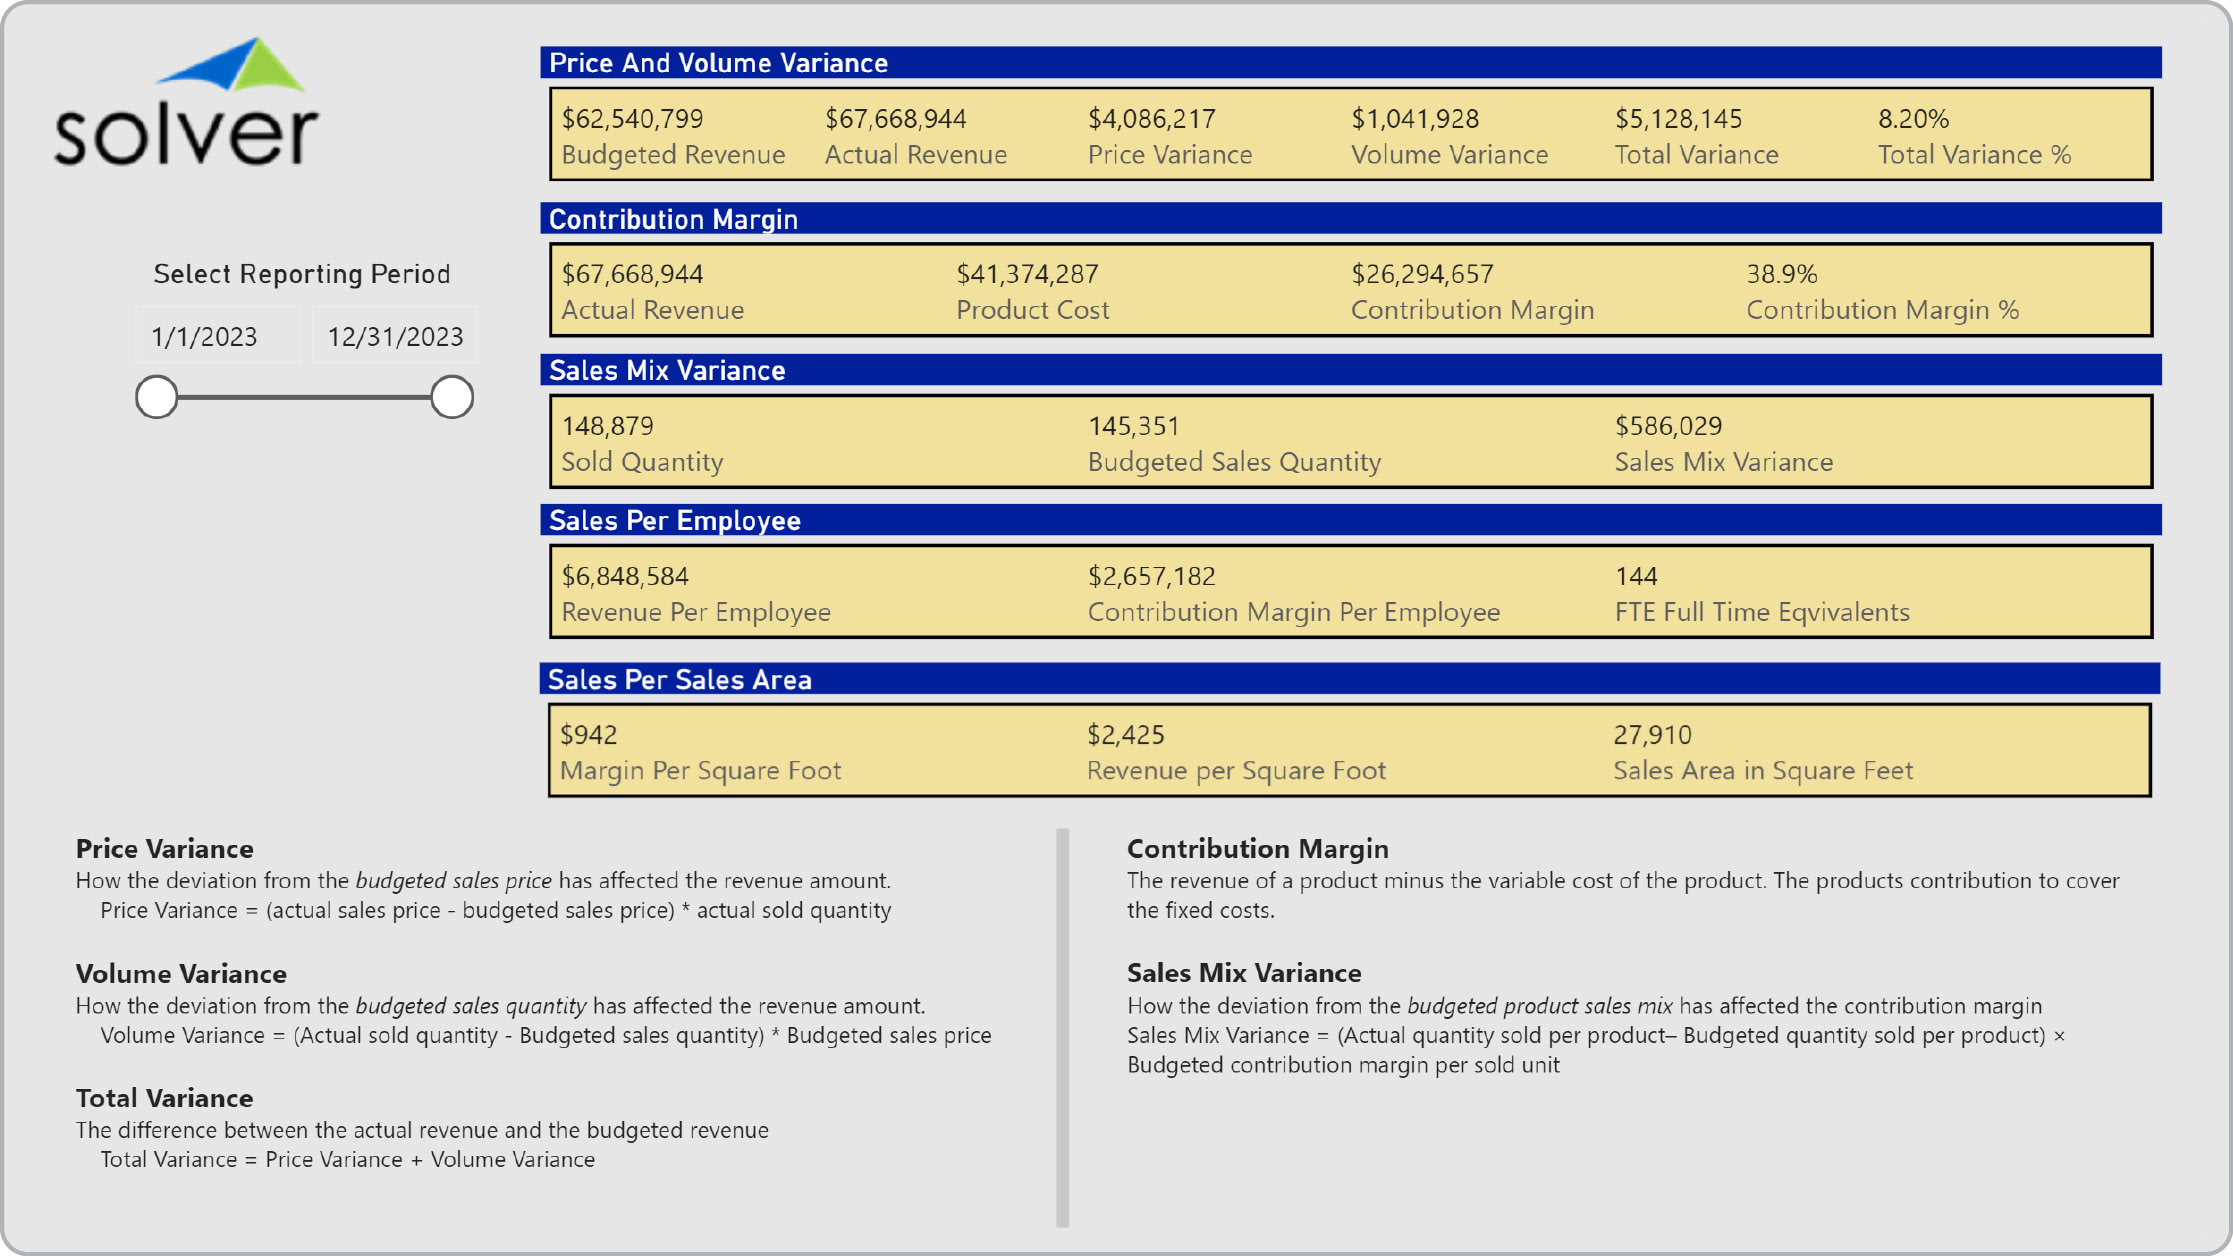
Retail – Price and Volume Variance
Retail dashboard with price and volume variance analysis.
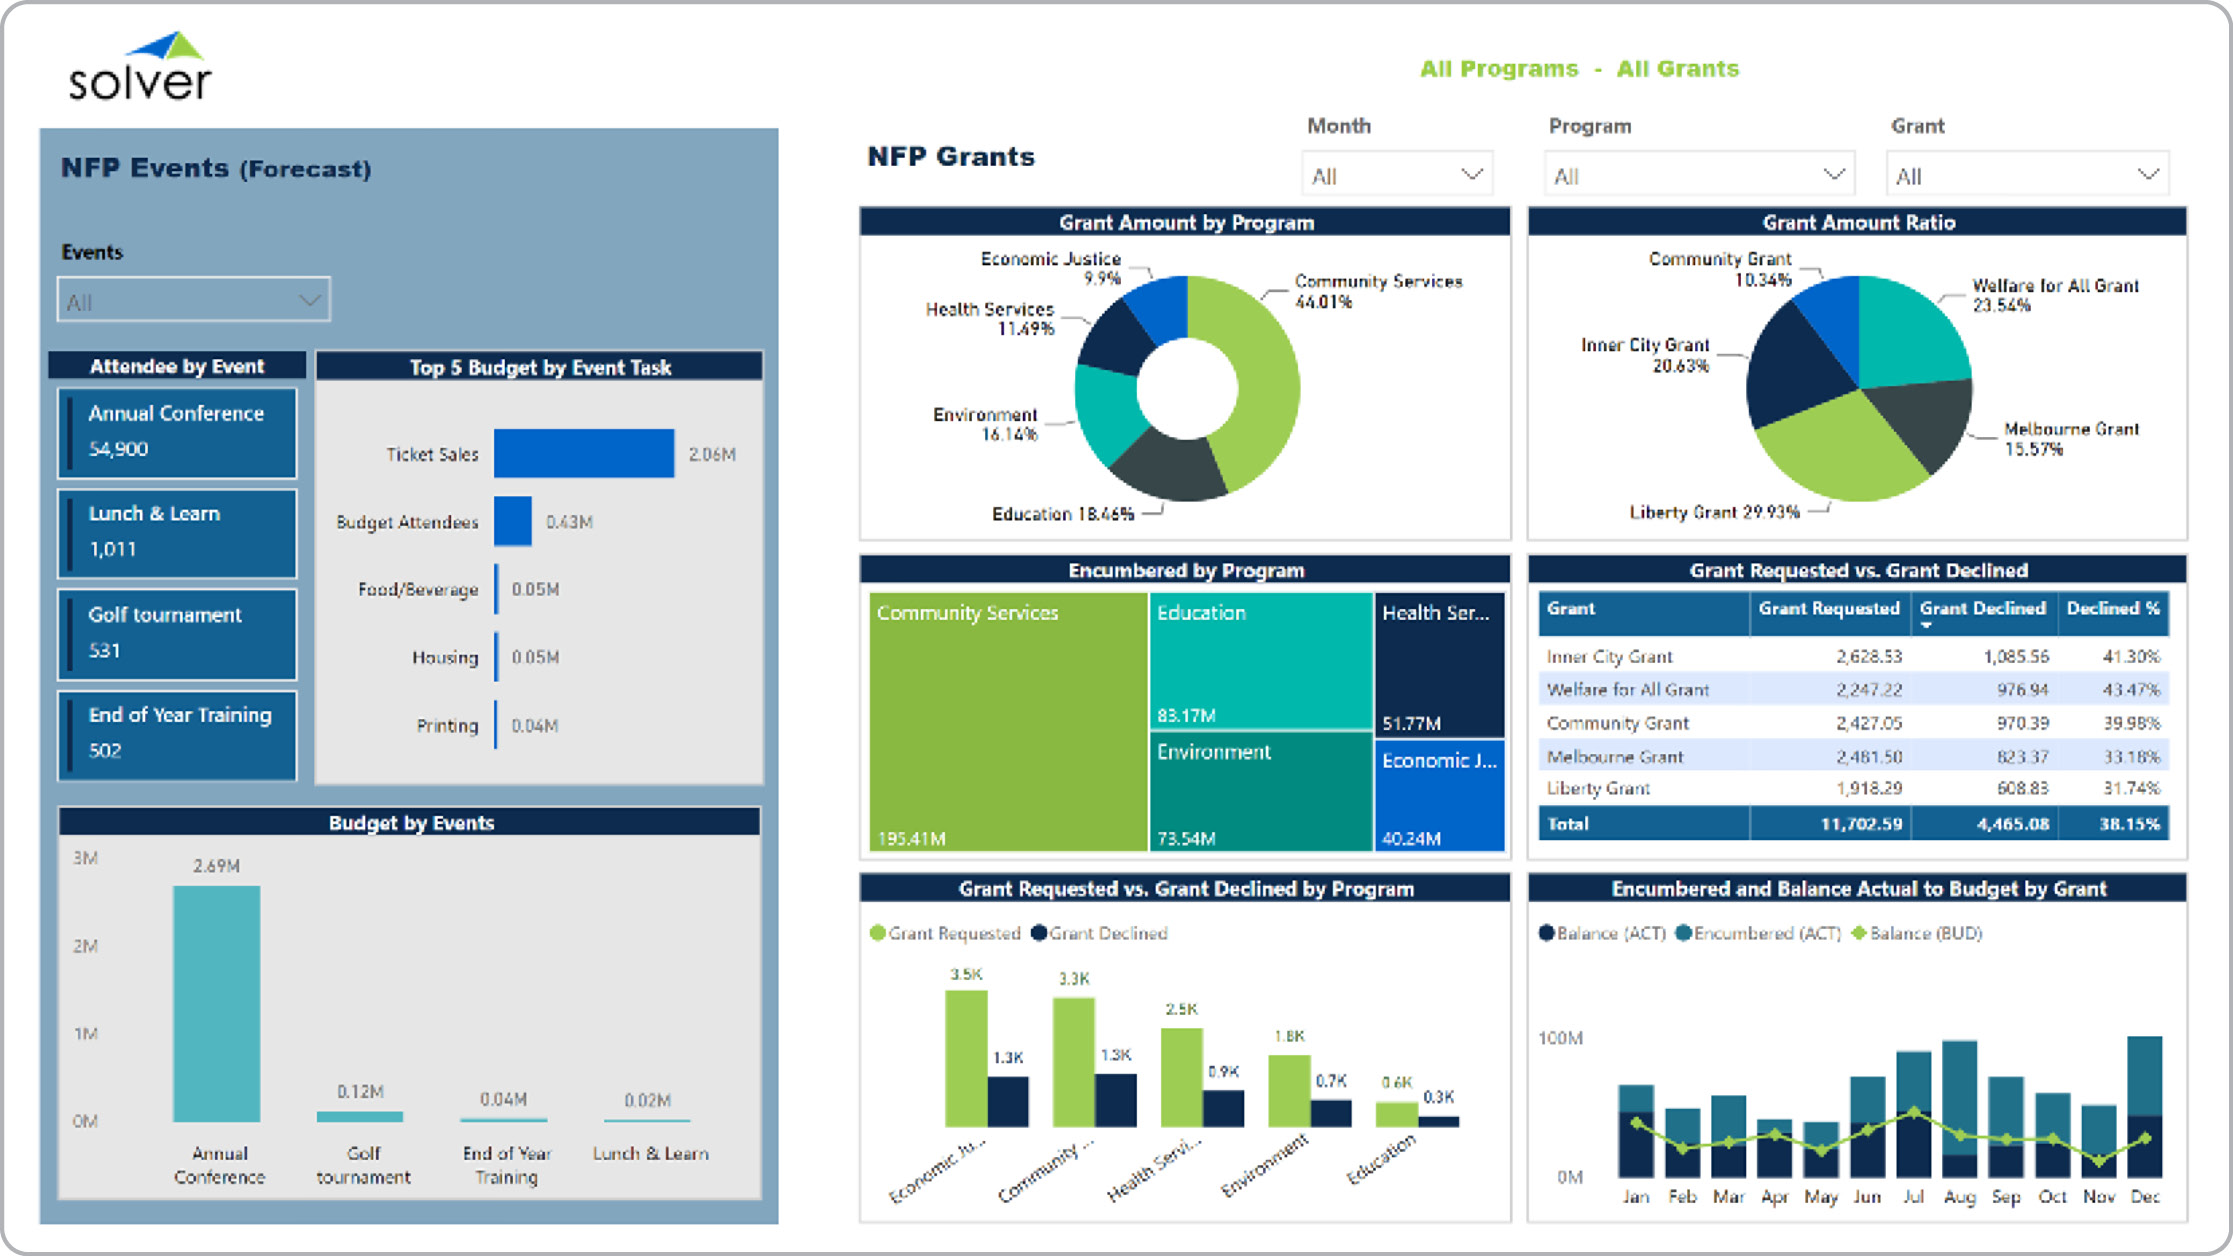
Nonprofit – Events and Grants Dashboard
Nonprofit grants and events dashboard example.
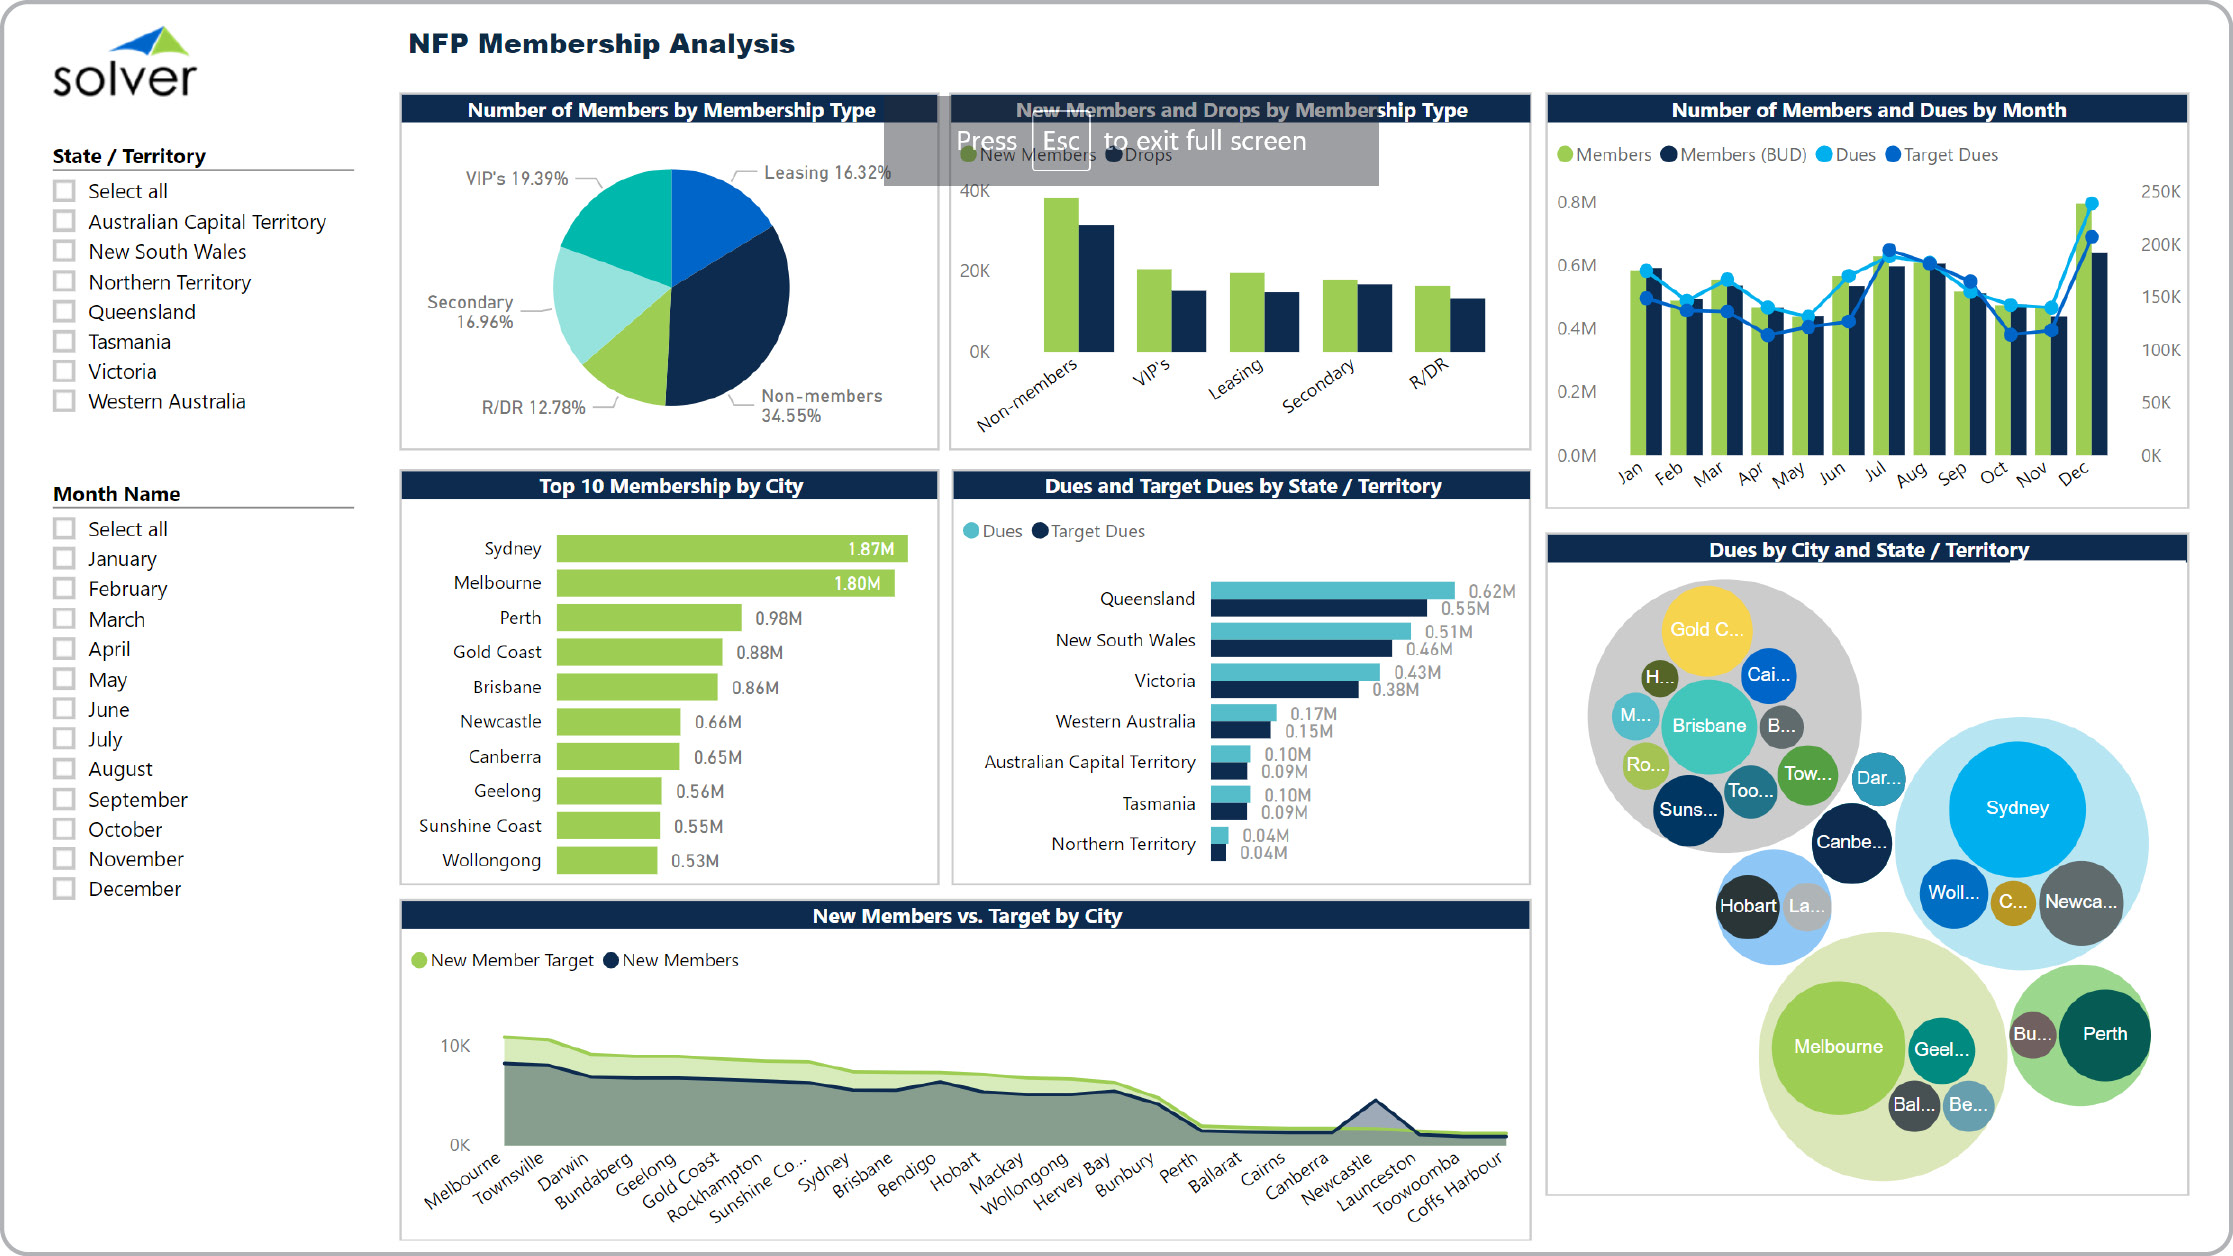
Nonprofit – Membership Dashboard
Nonprofit membership dashboard example.
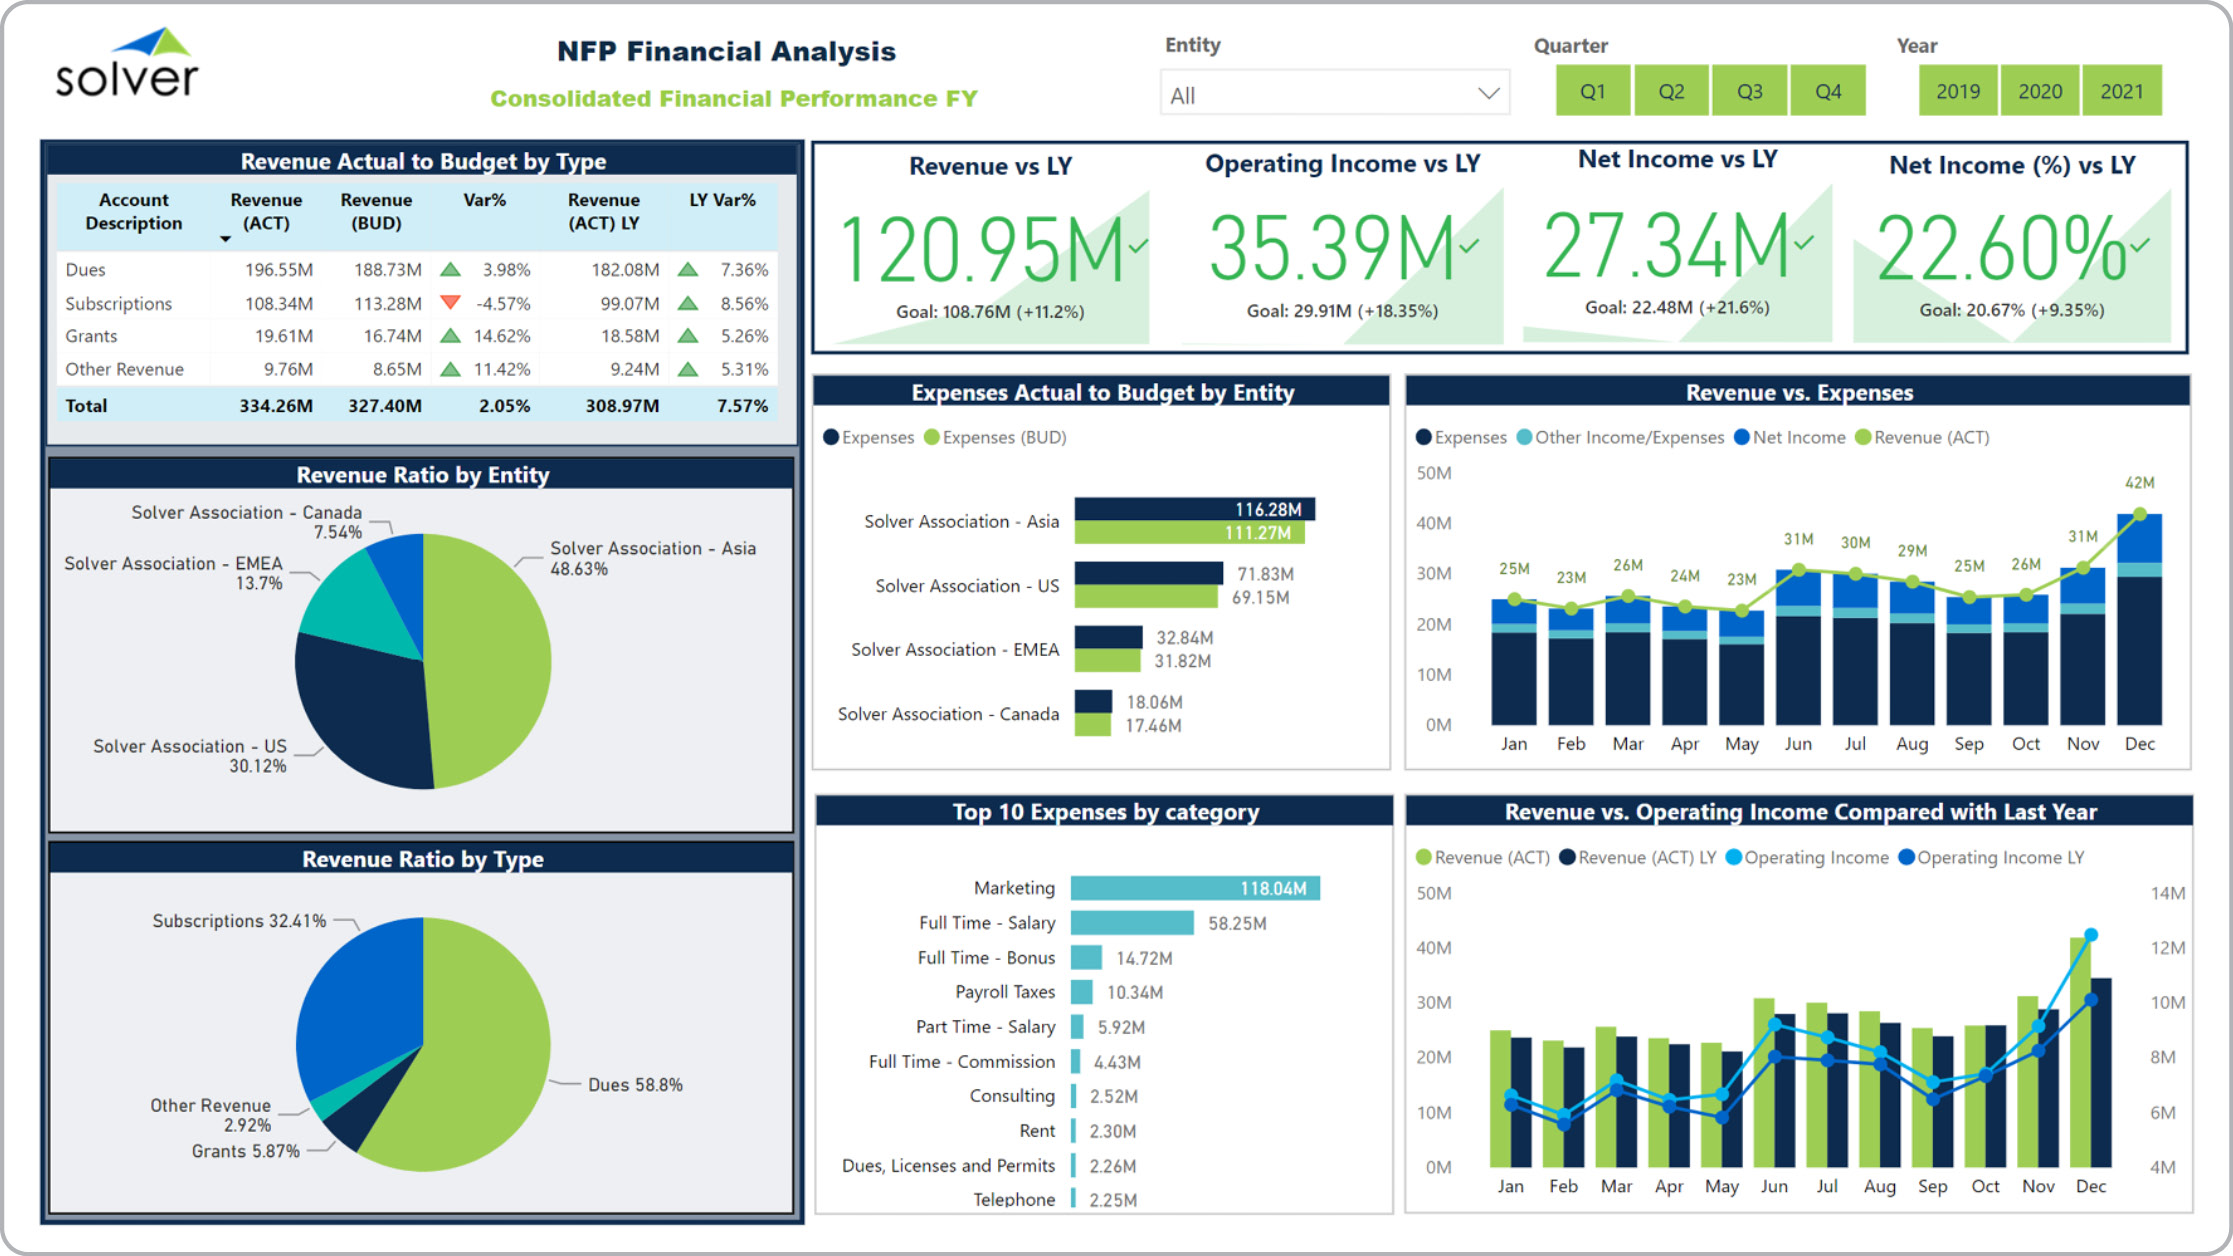
Nonprofit – Financial Dashboard
Nonprofit financial dashboard example.
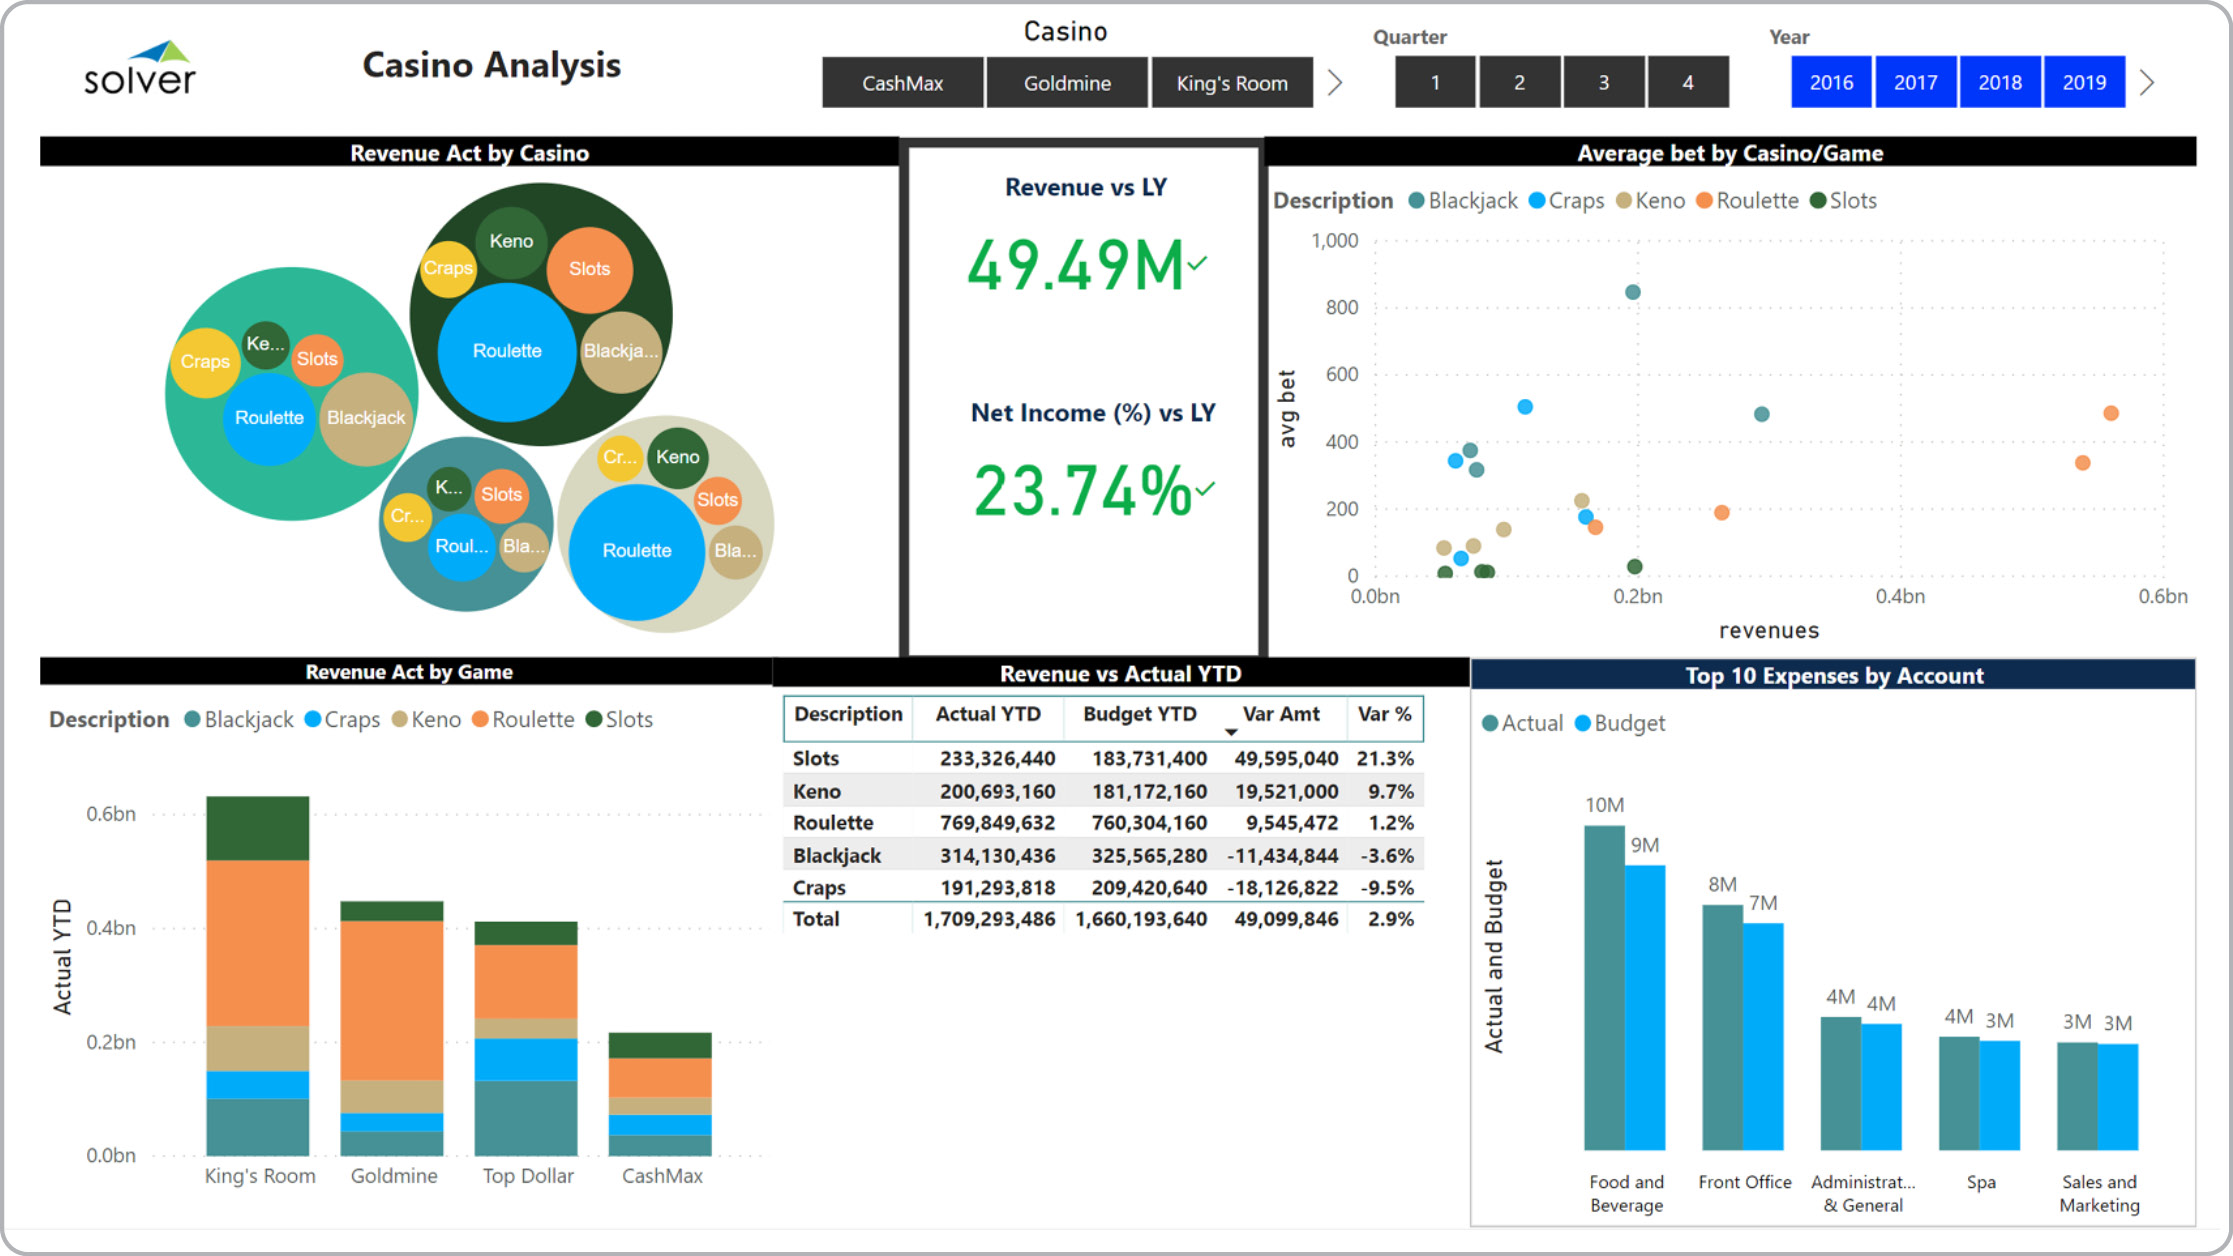
Hospitality – Casino Analysis
Power BI dashboard showing casino game and casino analysis.
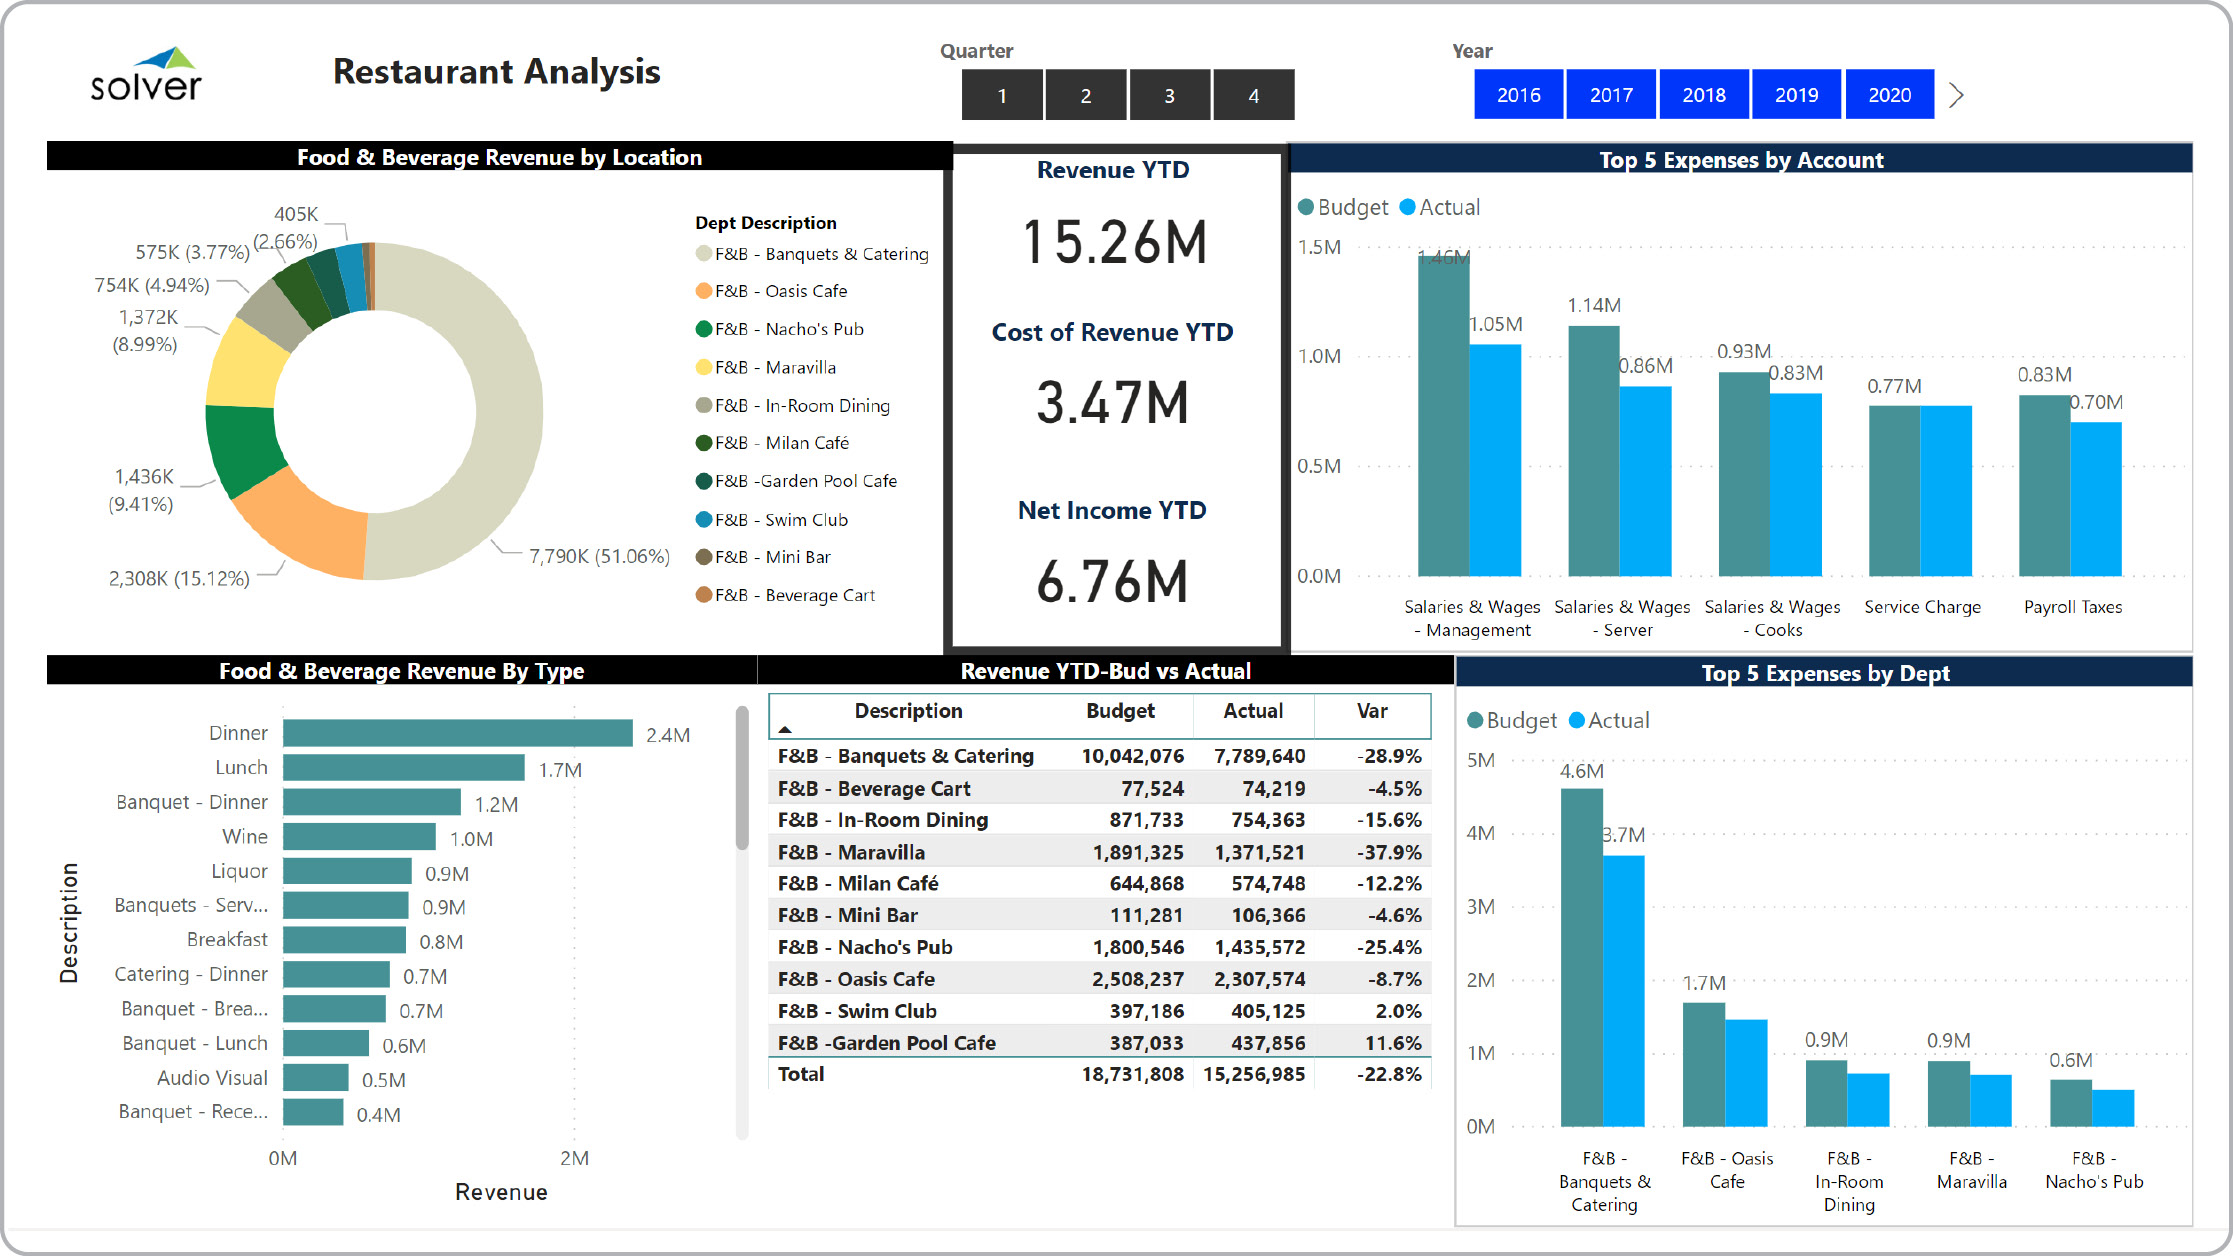
Hospitality – Restaurant Analysis
Power BI dashboard showing food & beverage analysis.
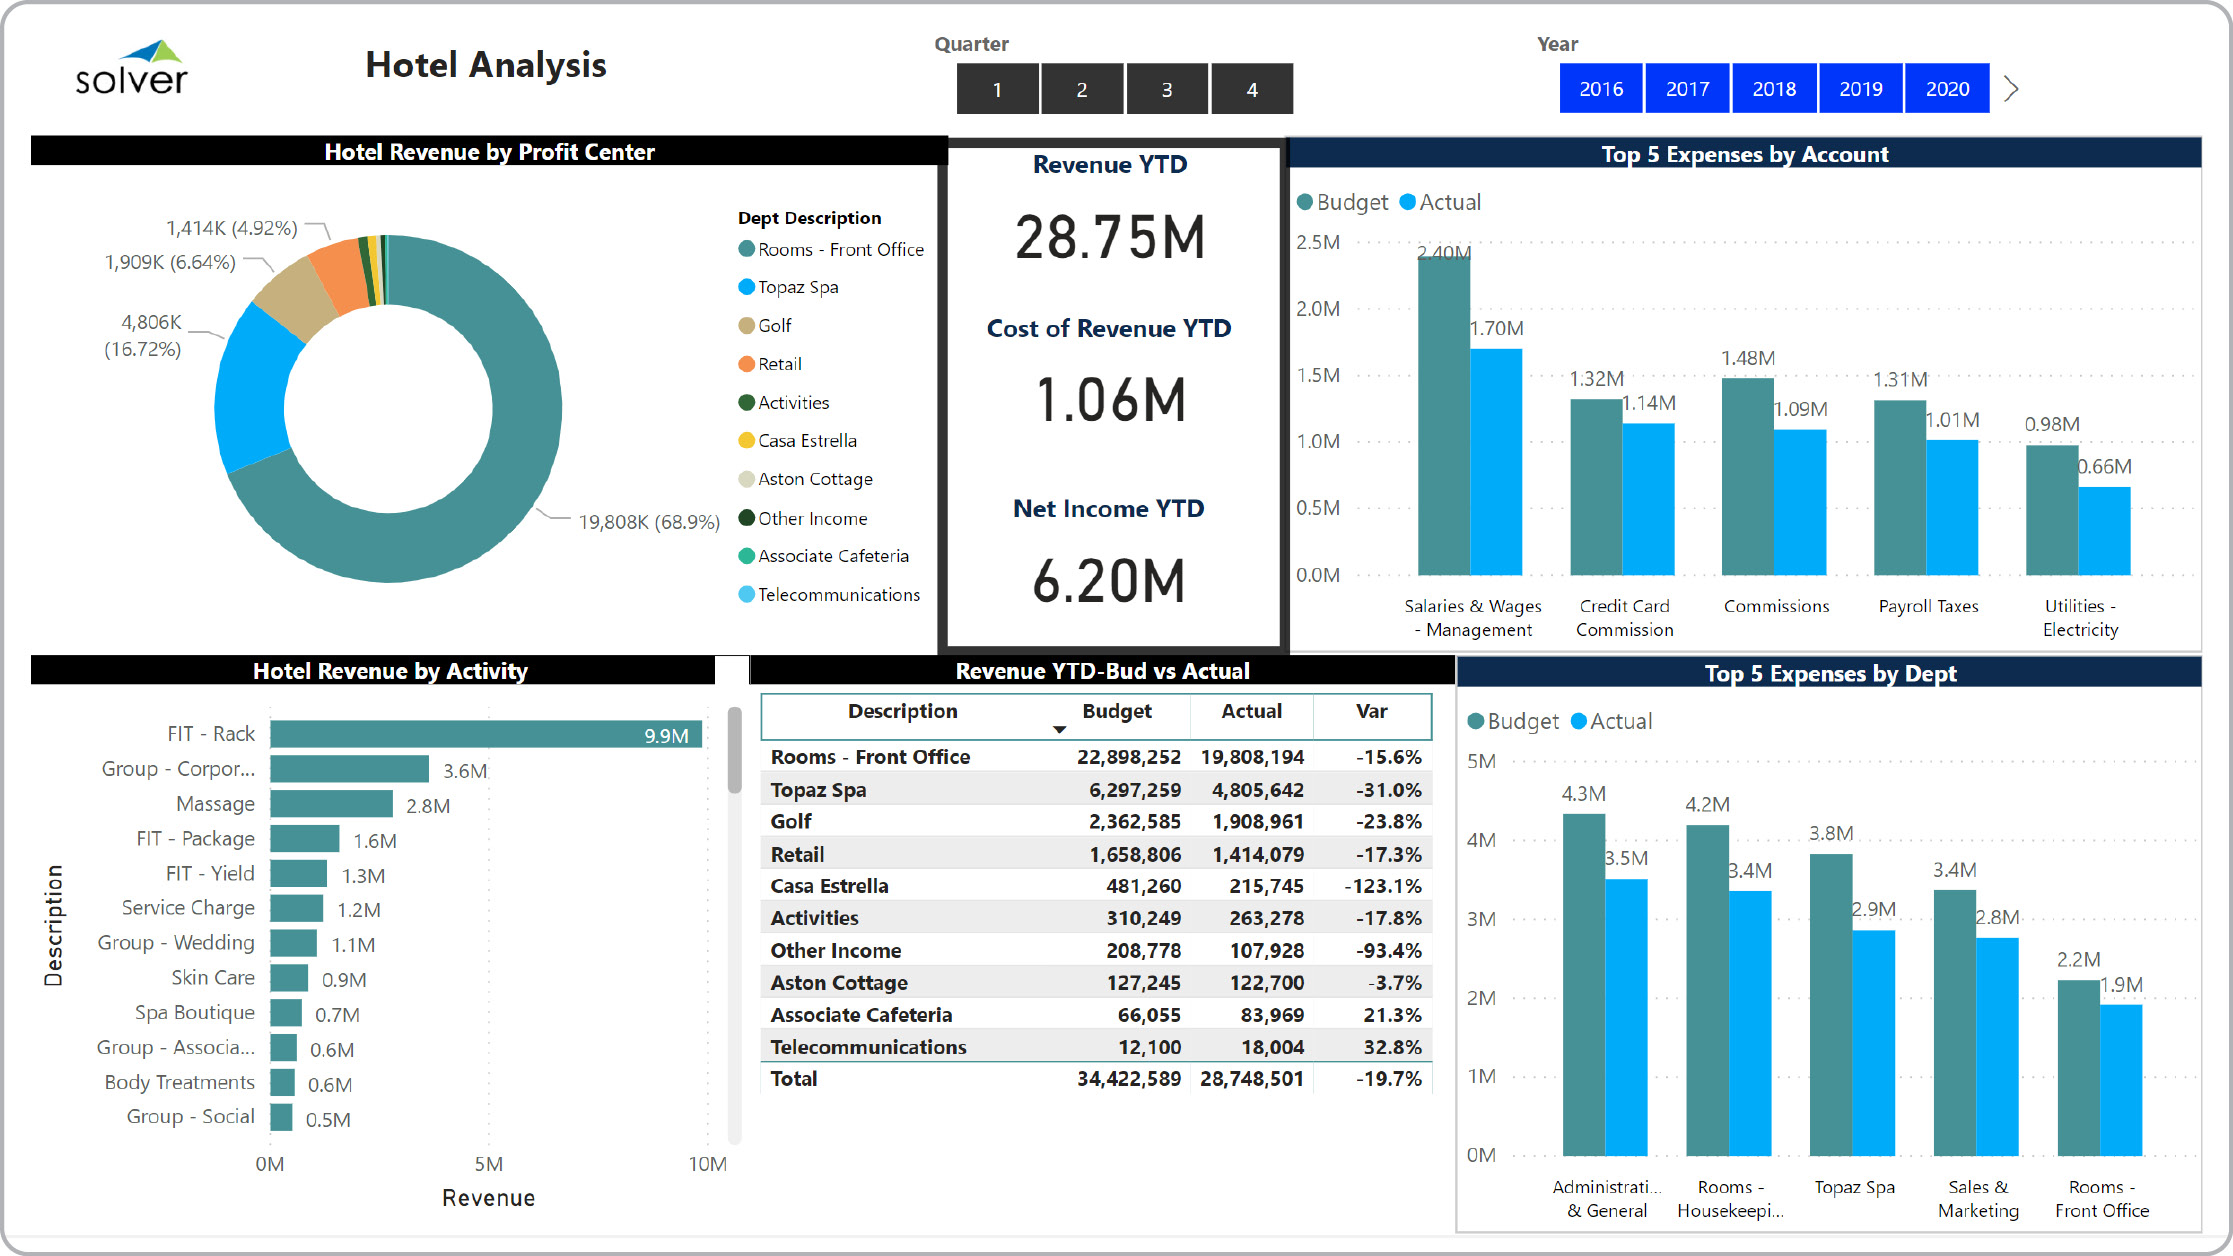
Hospitality – Hotel Analysis
Power BI dashboard showing revenue and expense analysis.
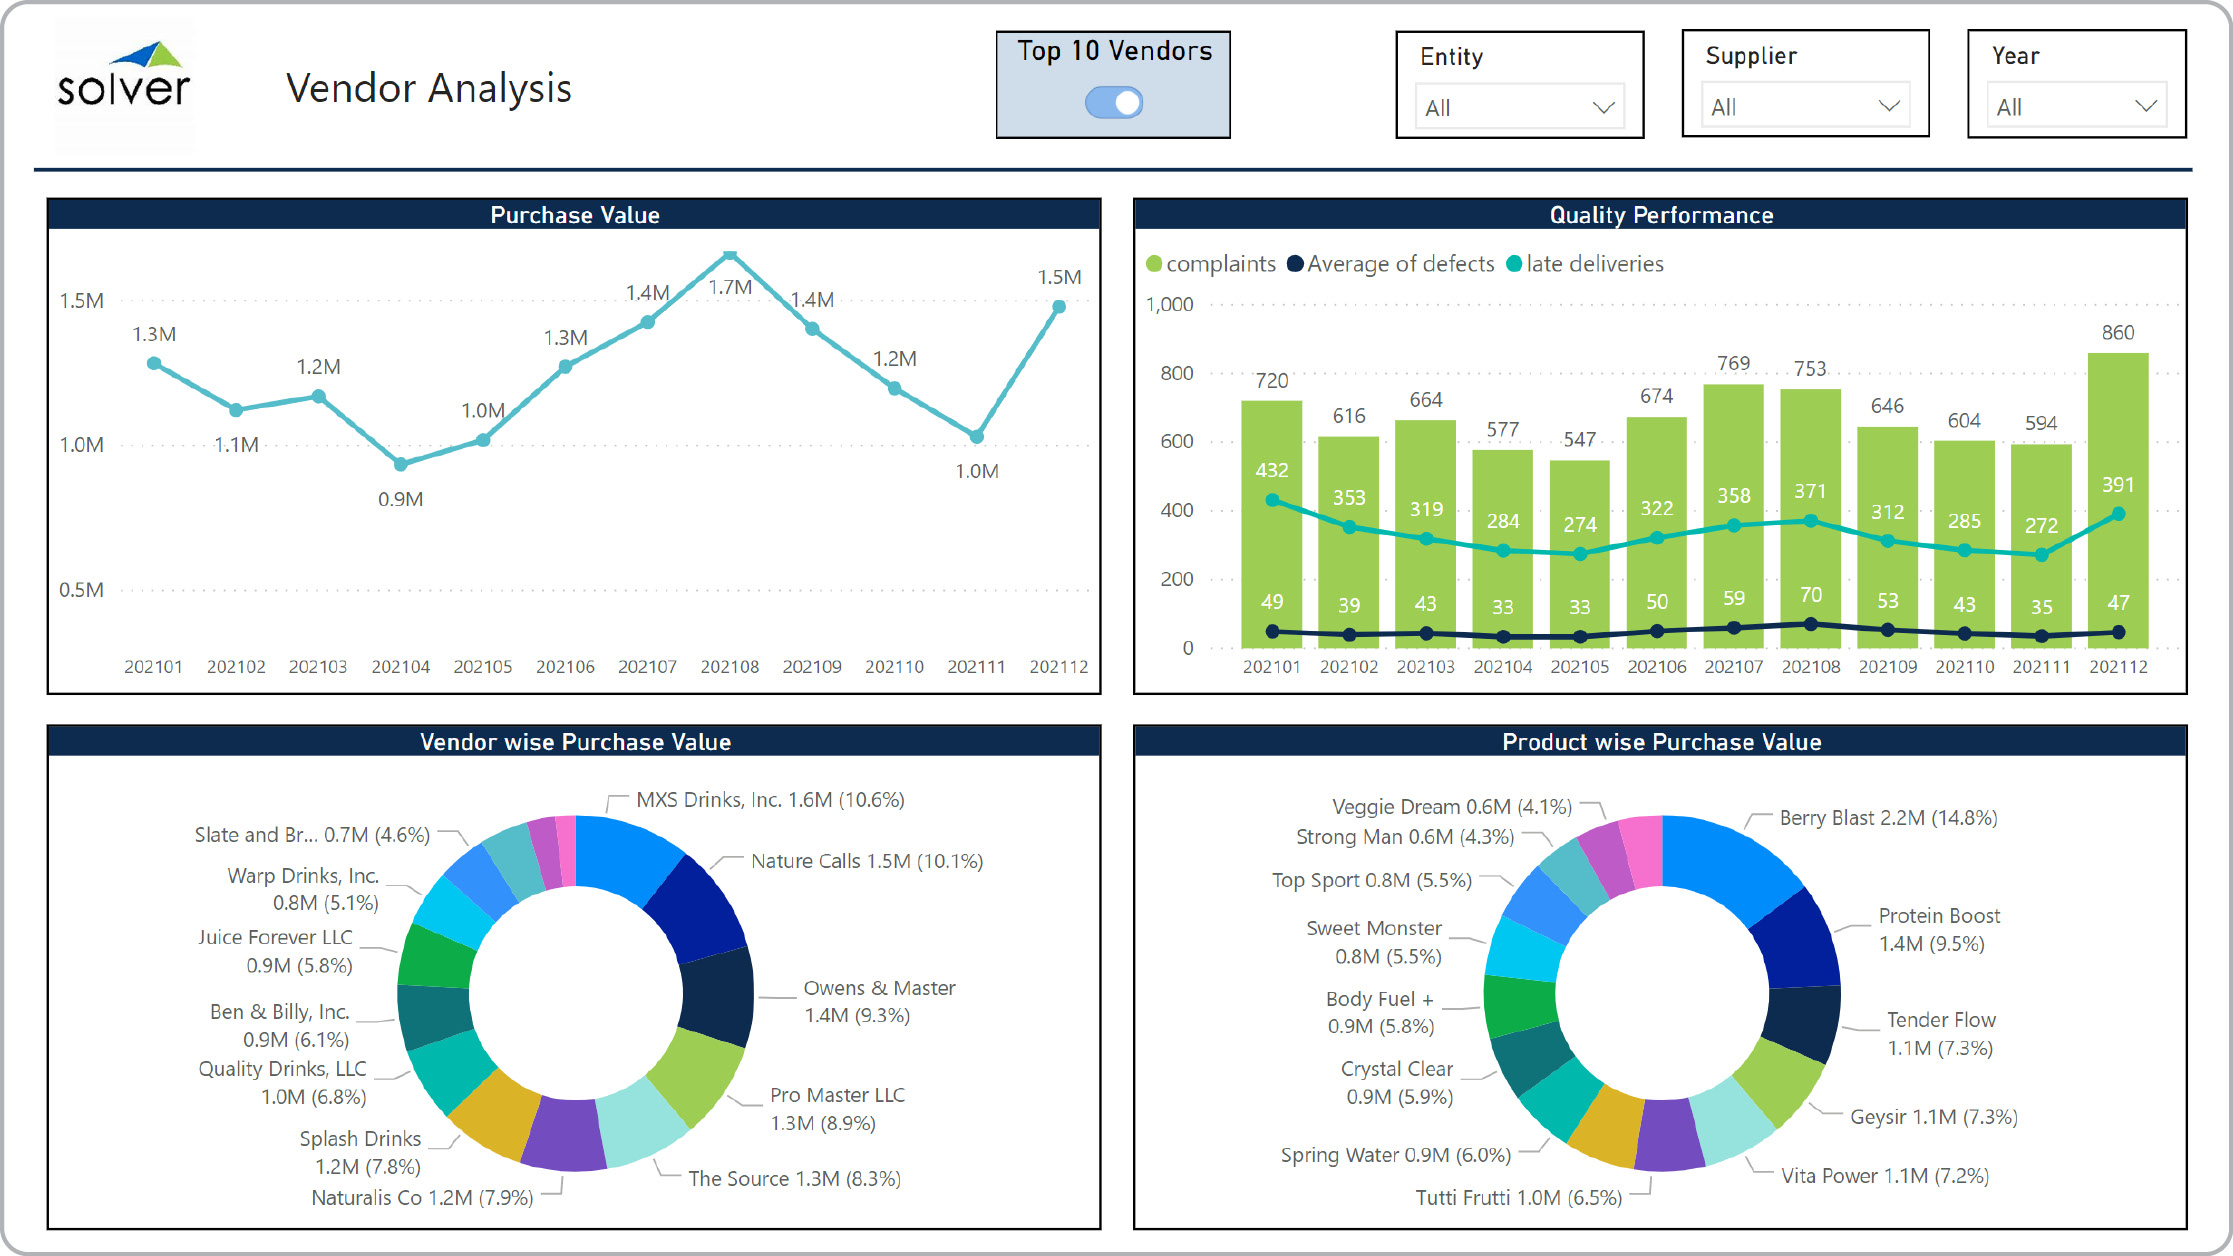
Distribution – Vendor Analysis
Power BI dashboard with vendor analysis.
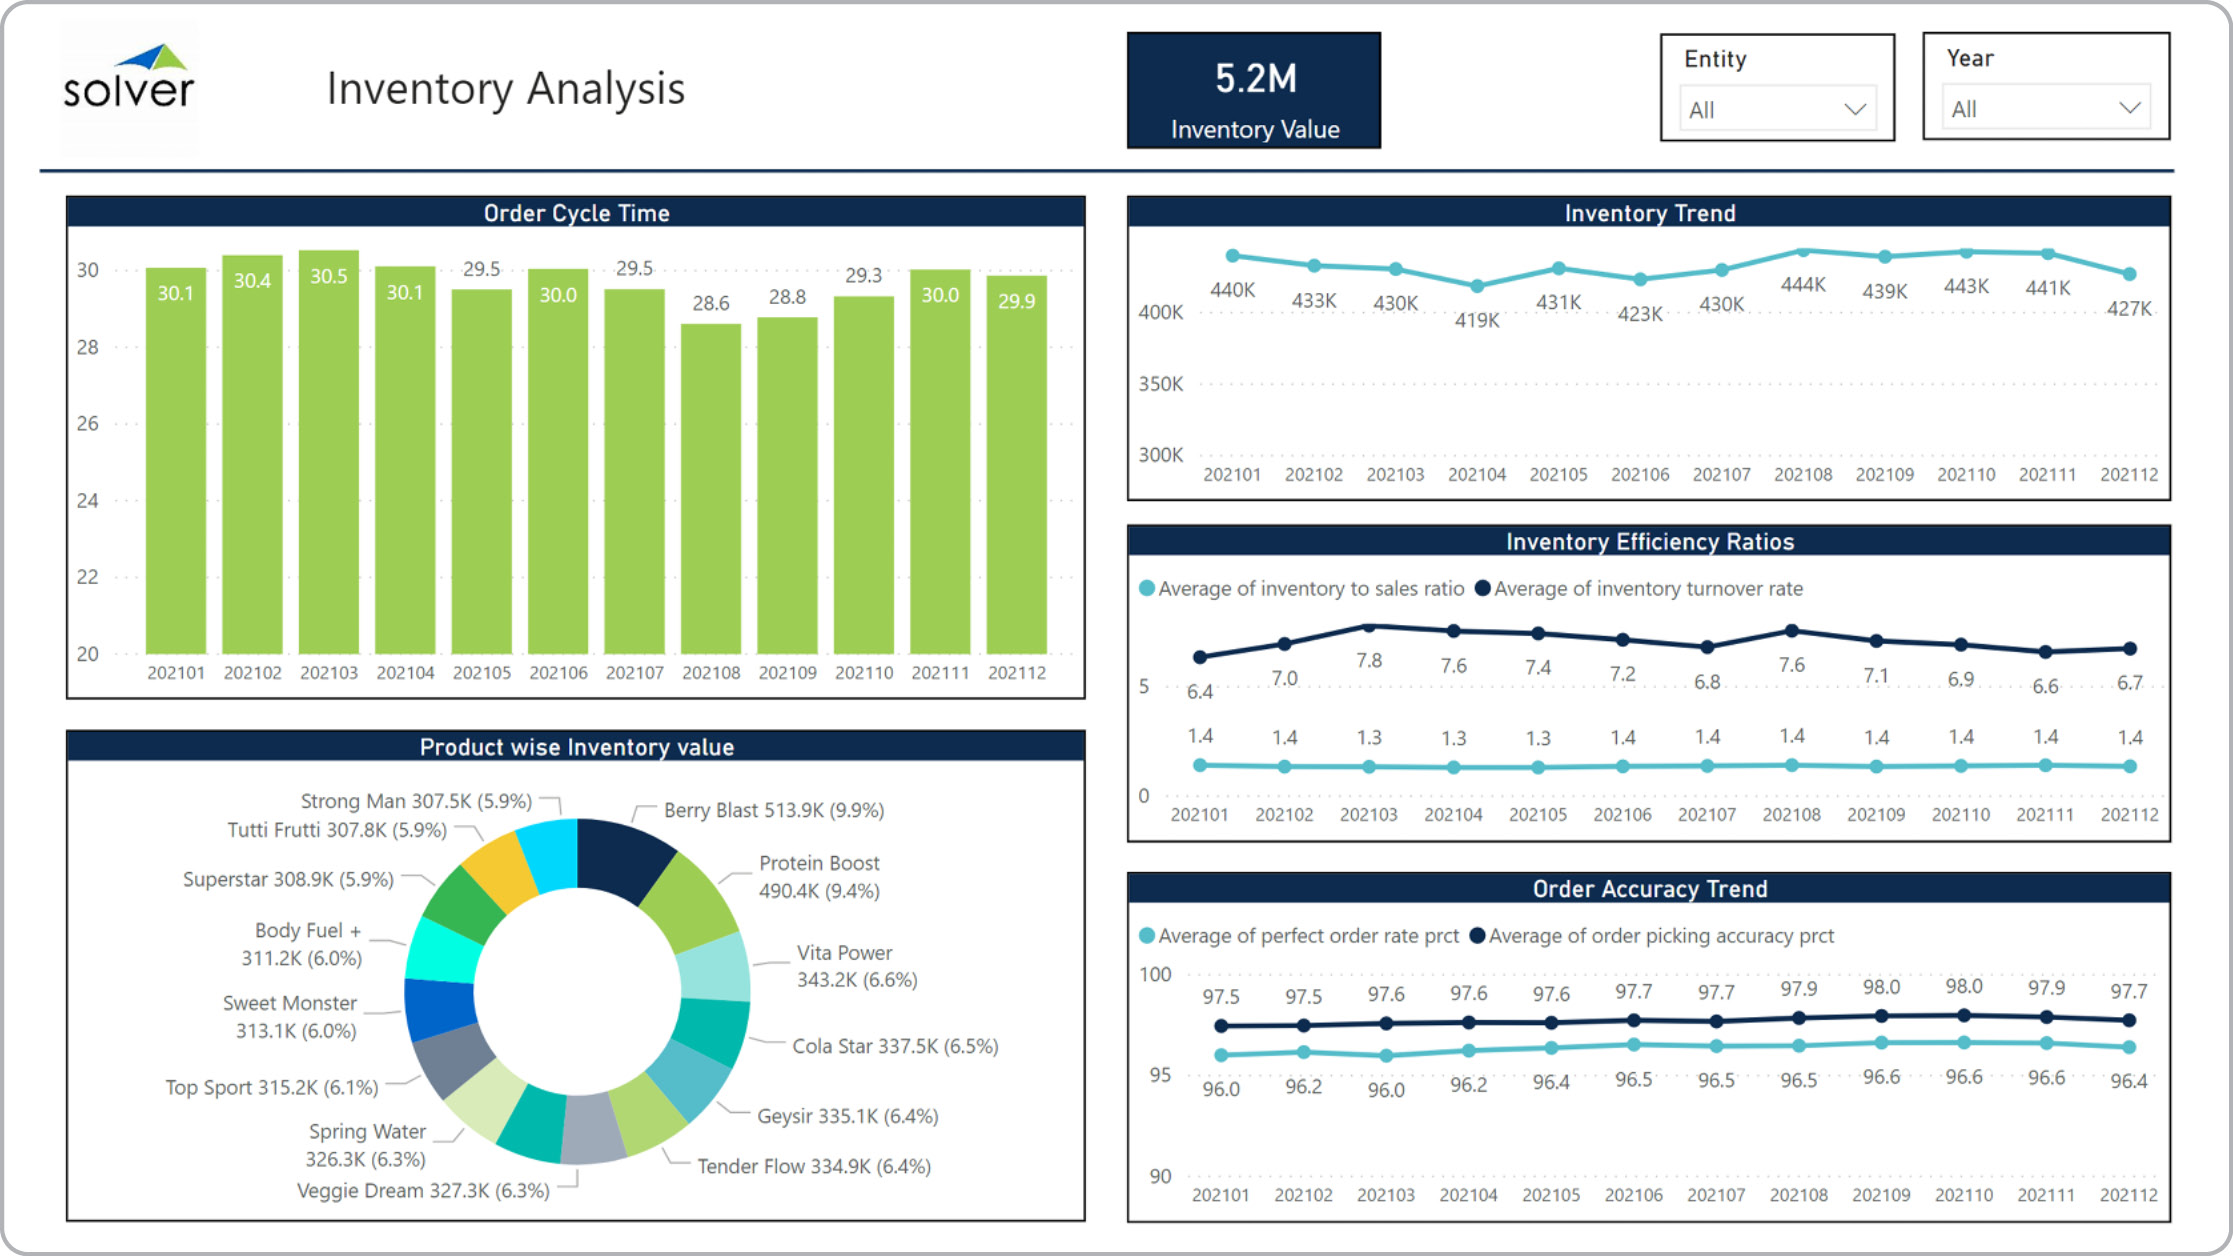
Distribution – Inventory Analysis
Power BI dashboard showing inventory analysis.
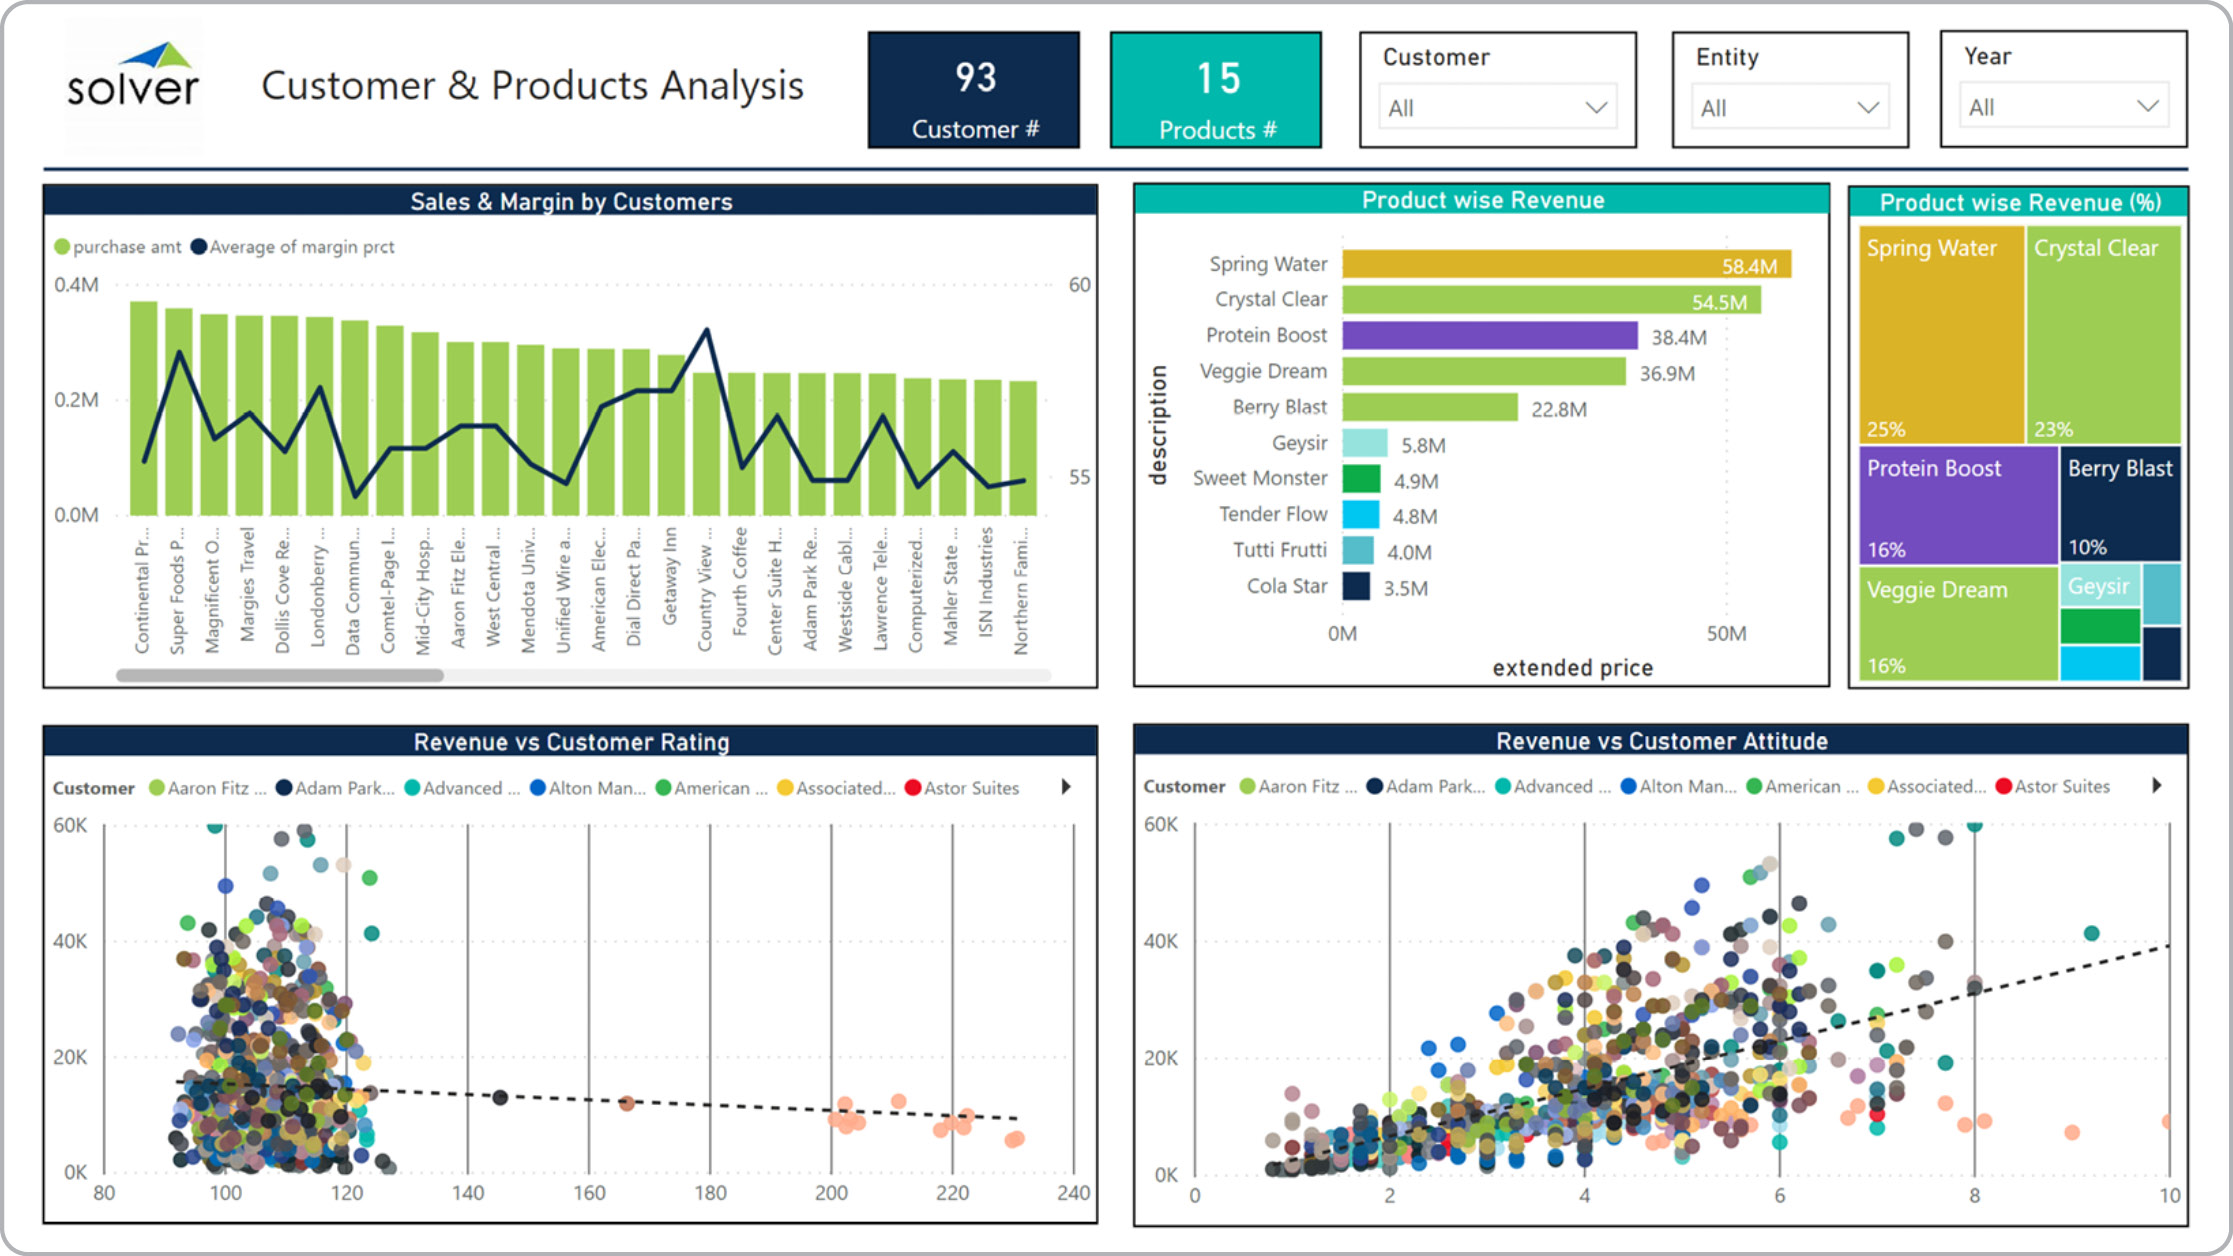
Distribution – Customer and Product Analysis
Power BI dashboard showing customer and product analysis.
Distribution – Revenue and Margin Analysis
Power BI dashboard showing revenue and margin analysis.
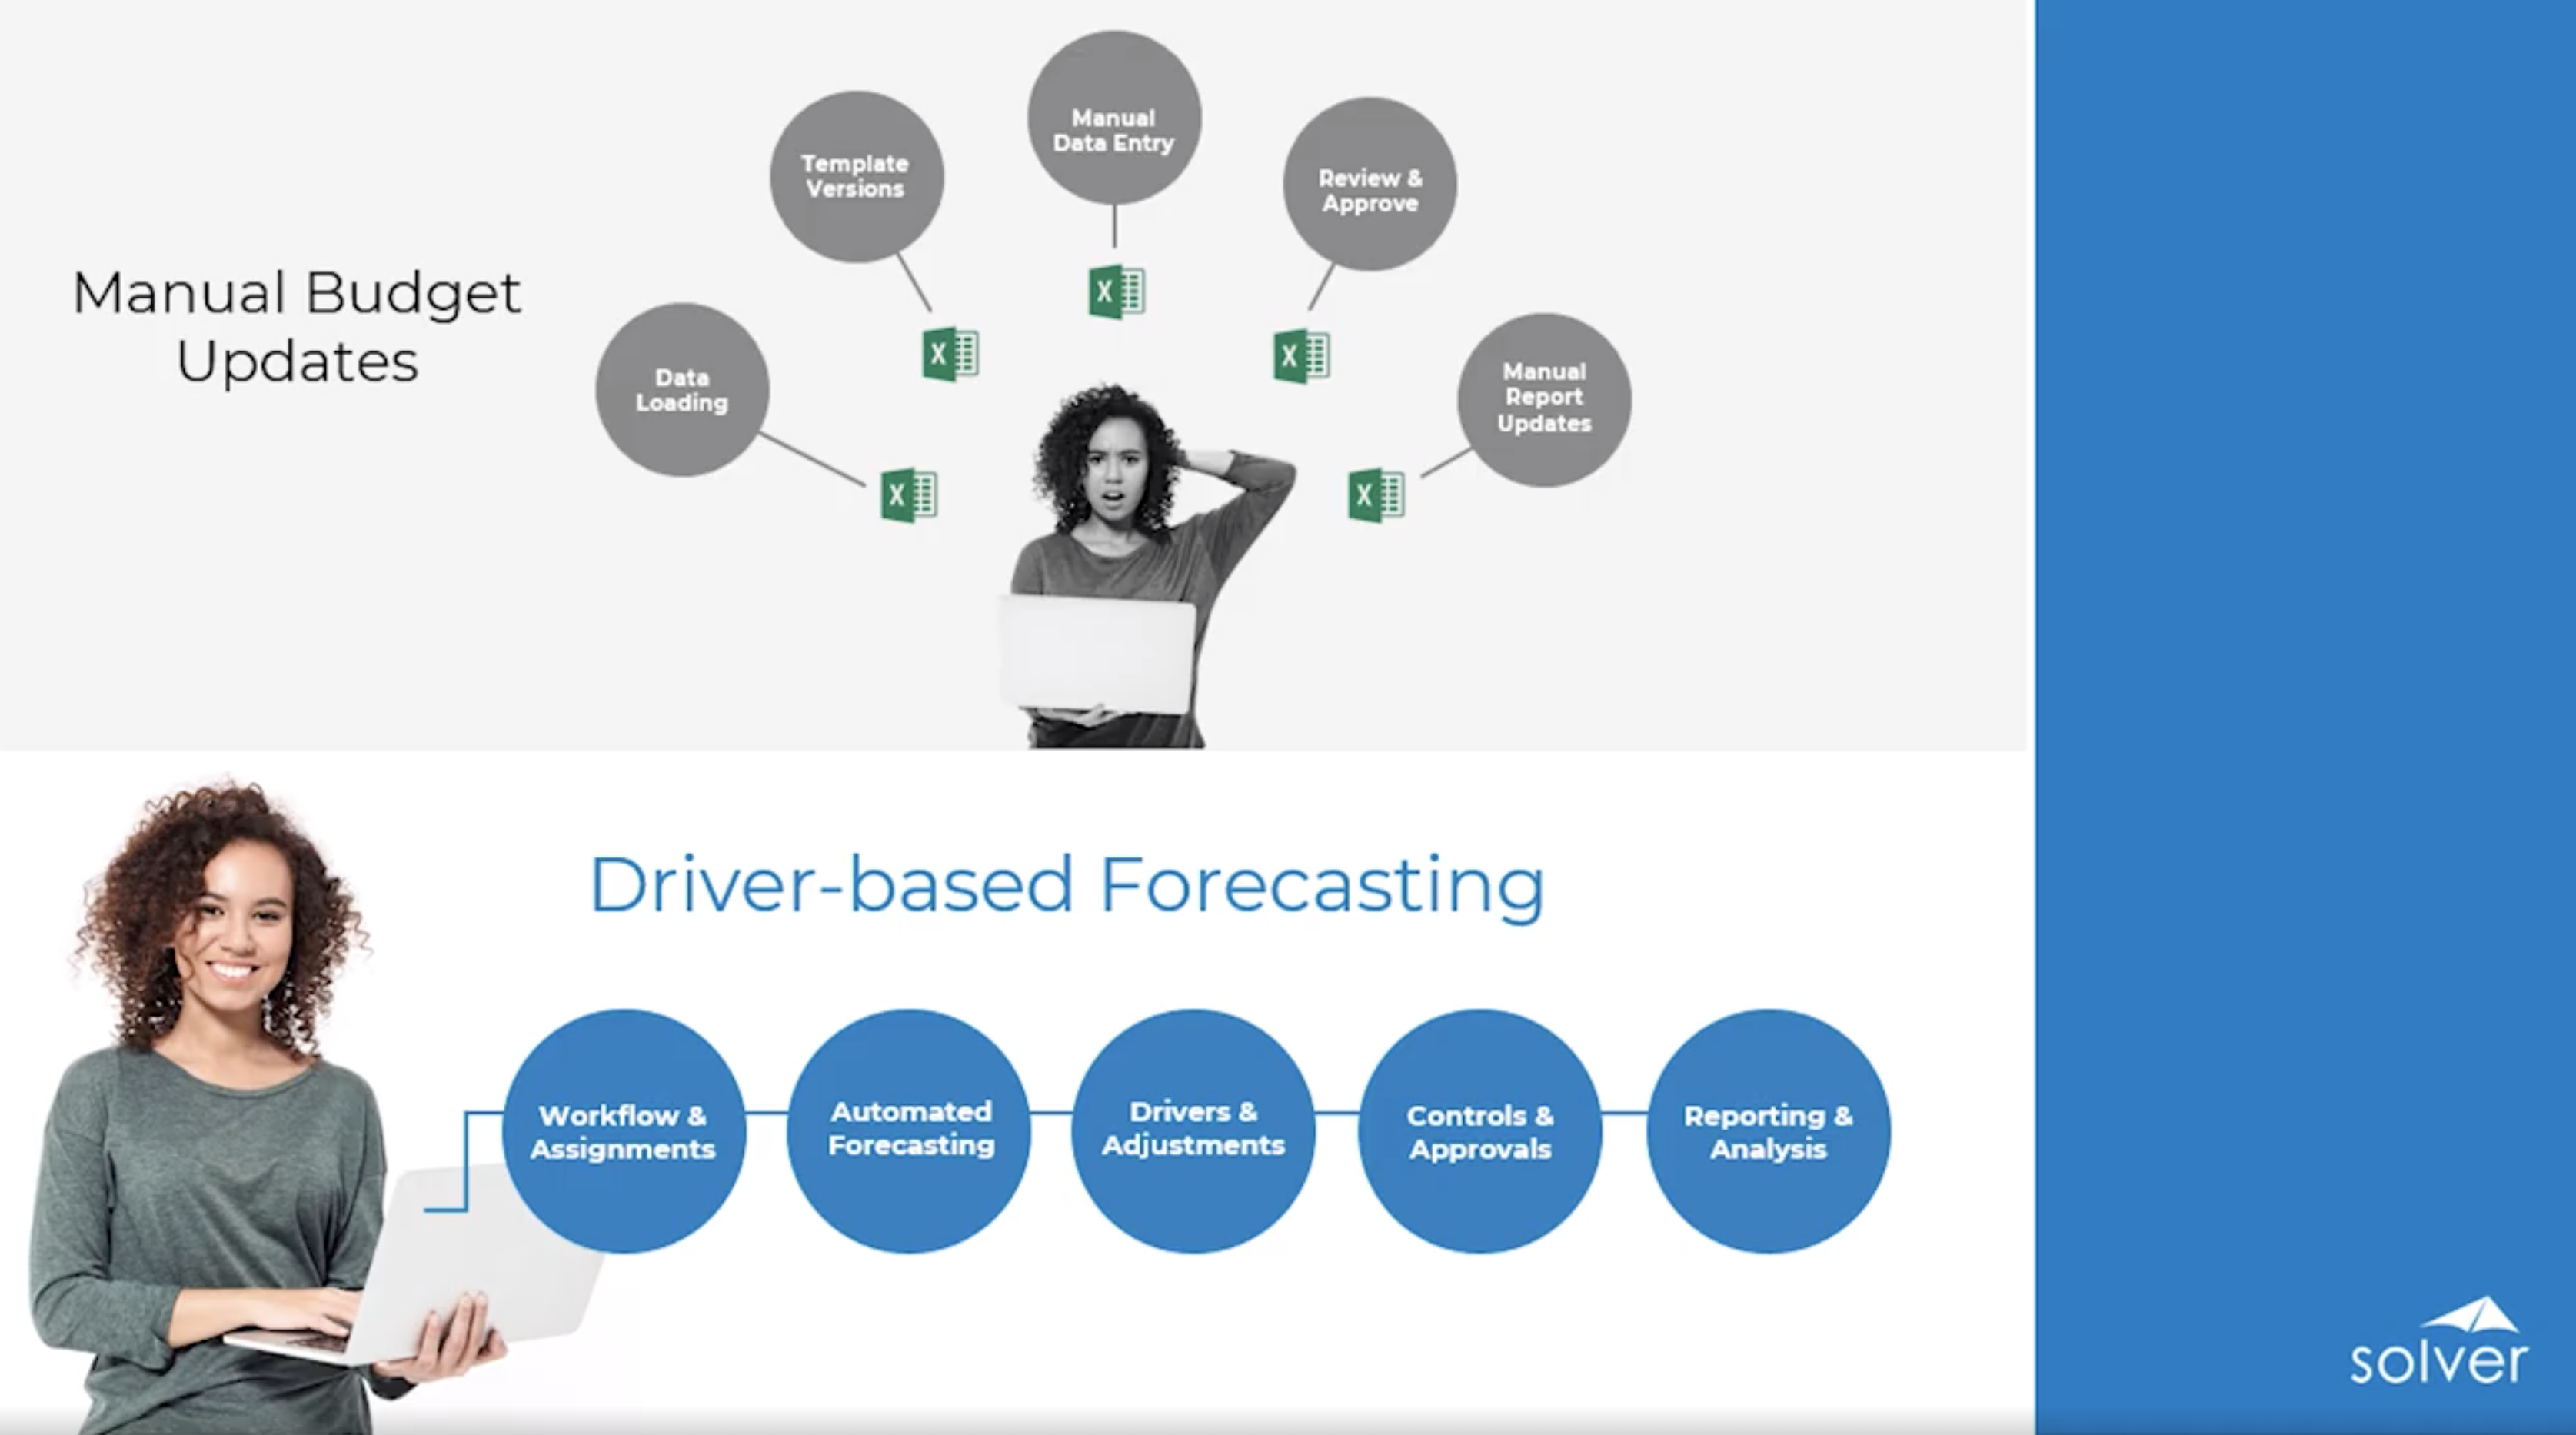
Driver-Based Forecasting
With a driver-based forecast model, companies can quickly gain near real-time visibility into projected performance and model the outcomes of different business and economic scenarios.

Multi-Scenario Forecasting
Forecasting and comparing multiple different scenarios.
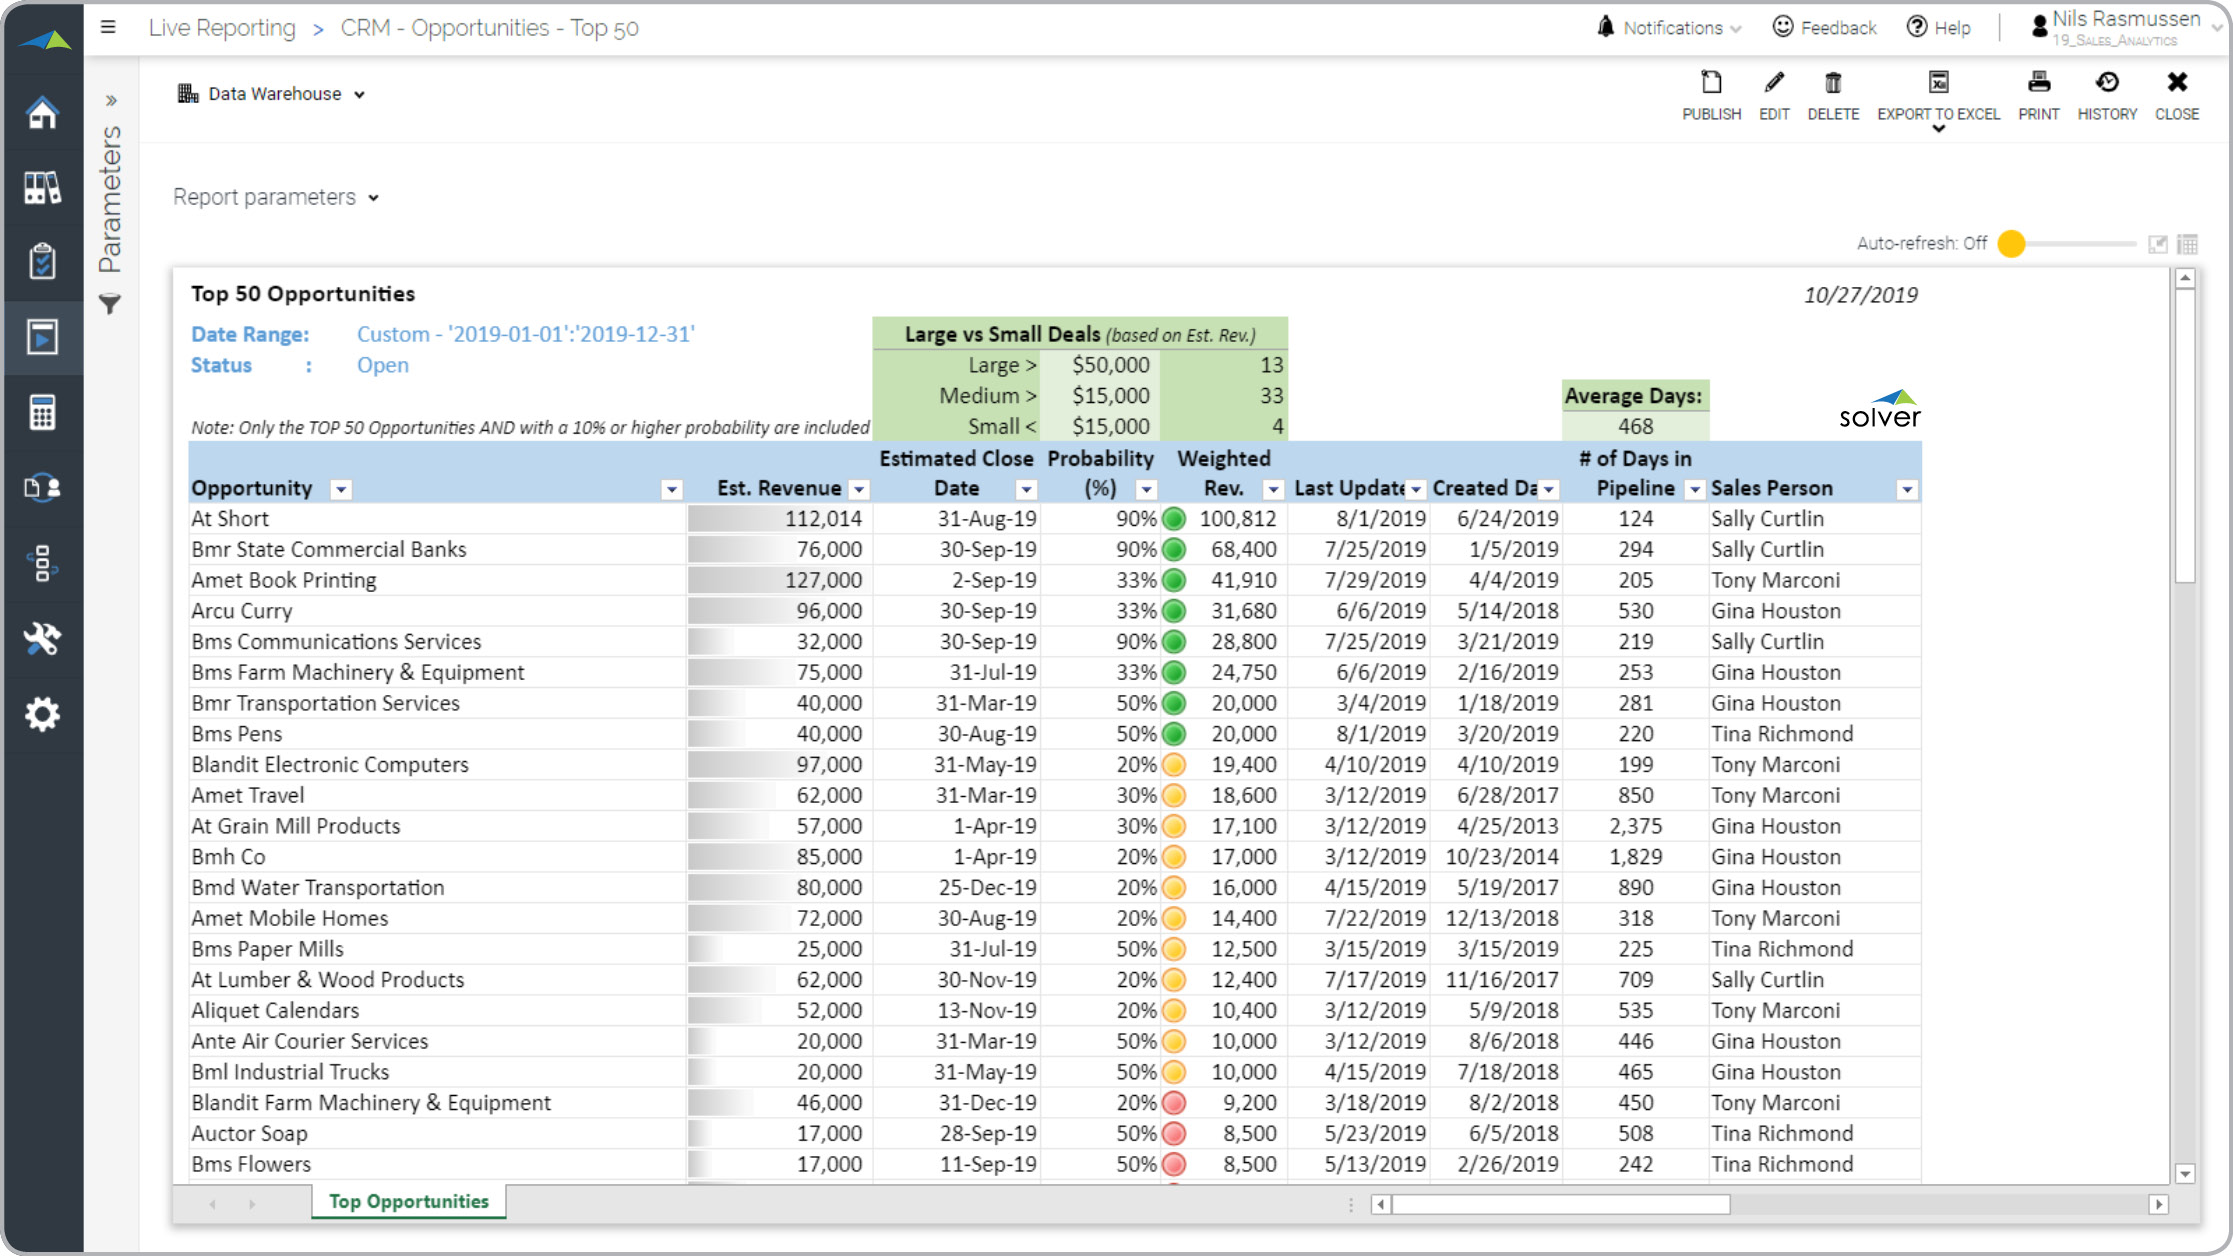
Top Opportunities
Report shows Top 50 opportunities ranked and counted by size and probability.
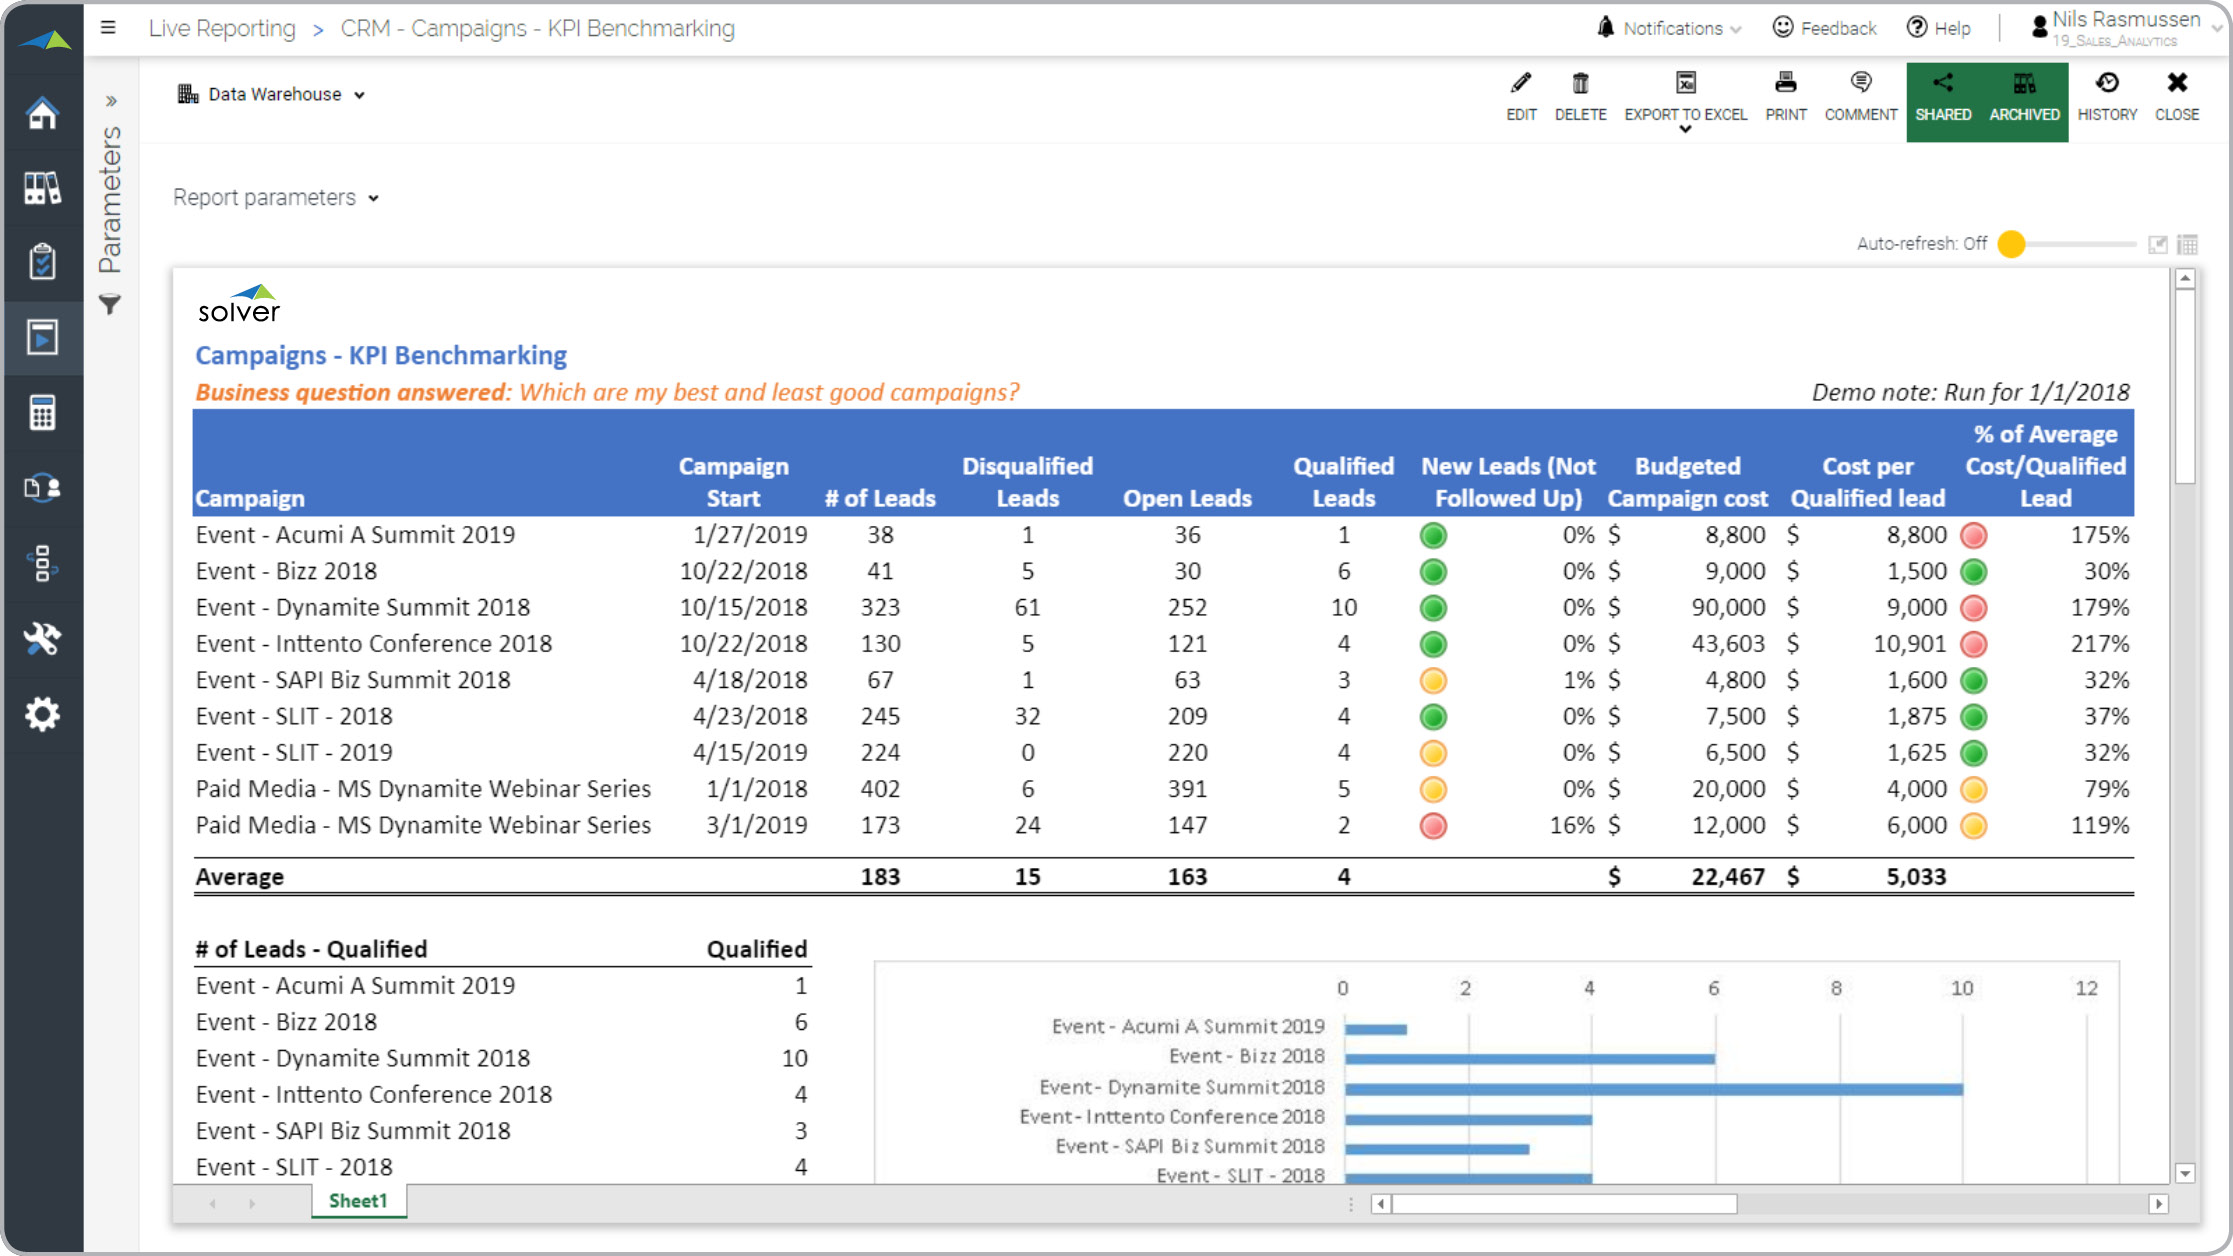
Marketing Campaign Analysis
Report providing analysis of marketing campaign efficiency based on CRM data.
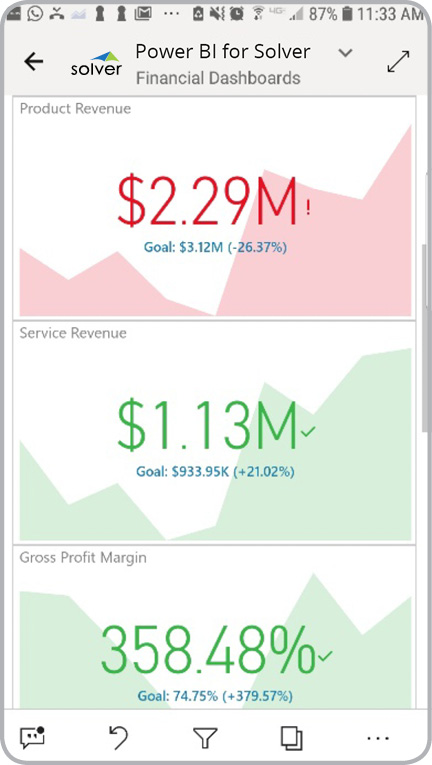
Mobile – Revenue KPIs
Power BI dashboard showing revenue and margin KPIs on mobile app.
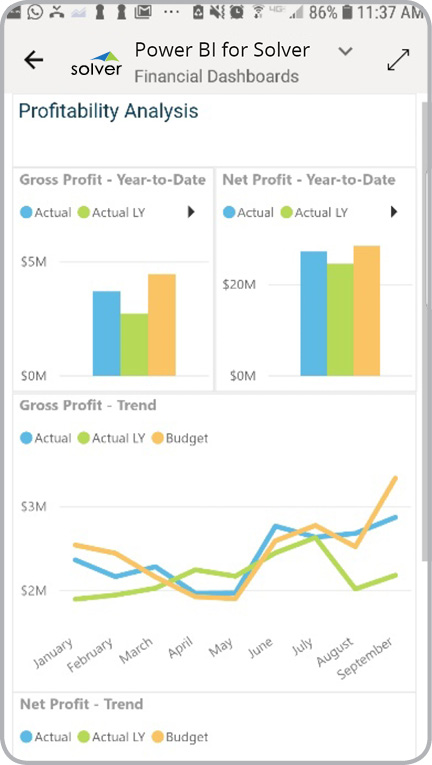
Mobile – Profitability KPIs
Power BI dashboard showing profit and margin KPIs on mobile app.
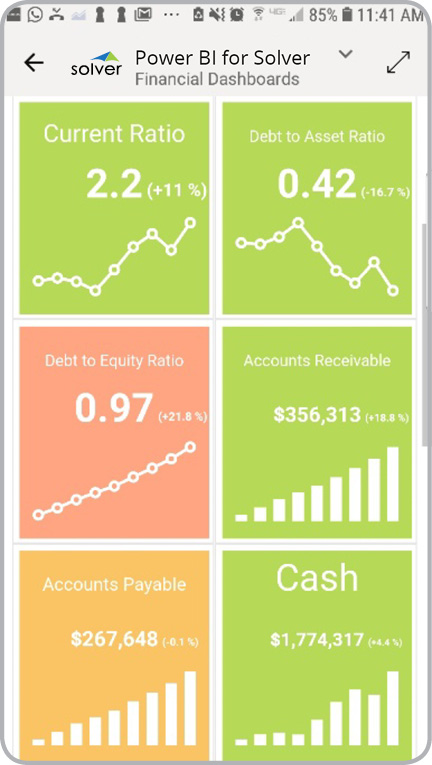
Mobile – Financial KPIs
Power BI dashboard showing financial KPIs on mobile app.
Sales Dashboard
Power BI dashboard with focus on sales metrics.
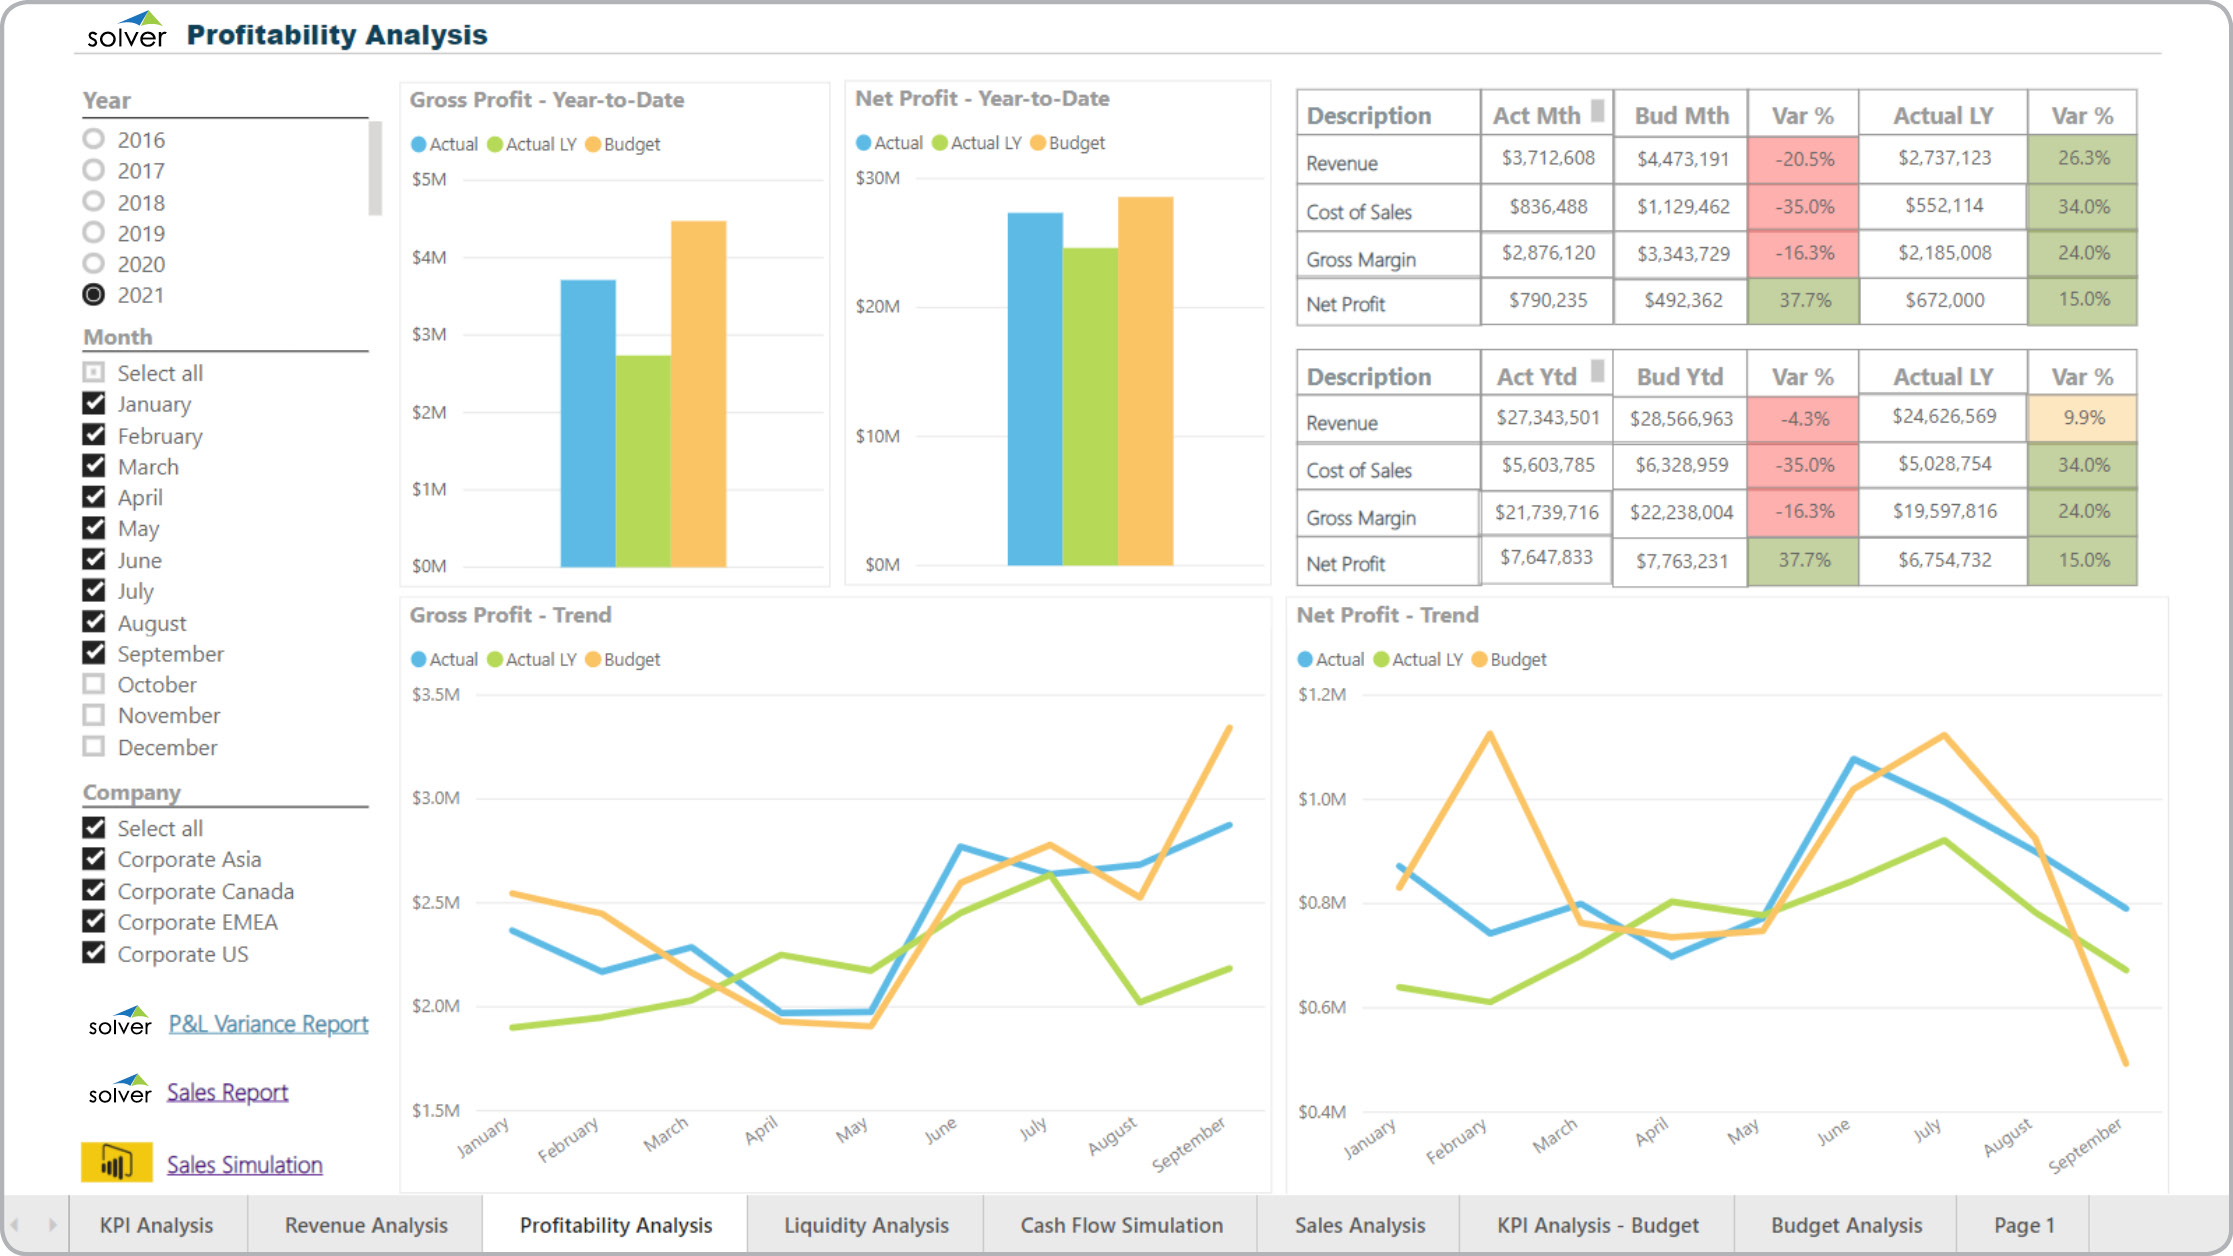
Profitability Dashboard
Power BI dashboard with focus on profitability and related trends and variances.
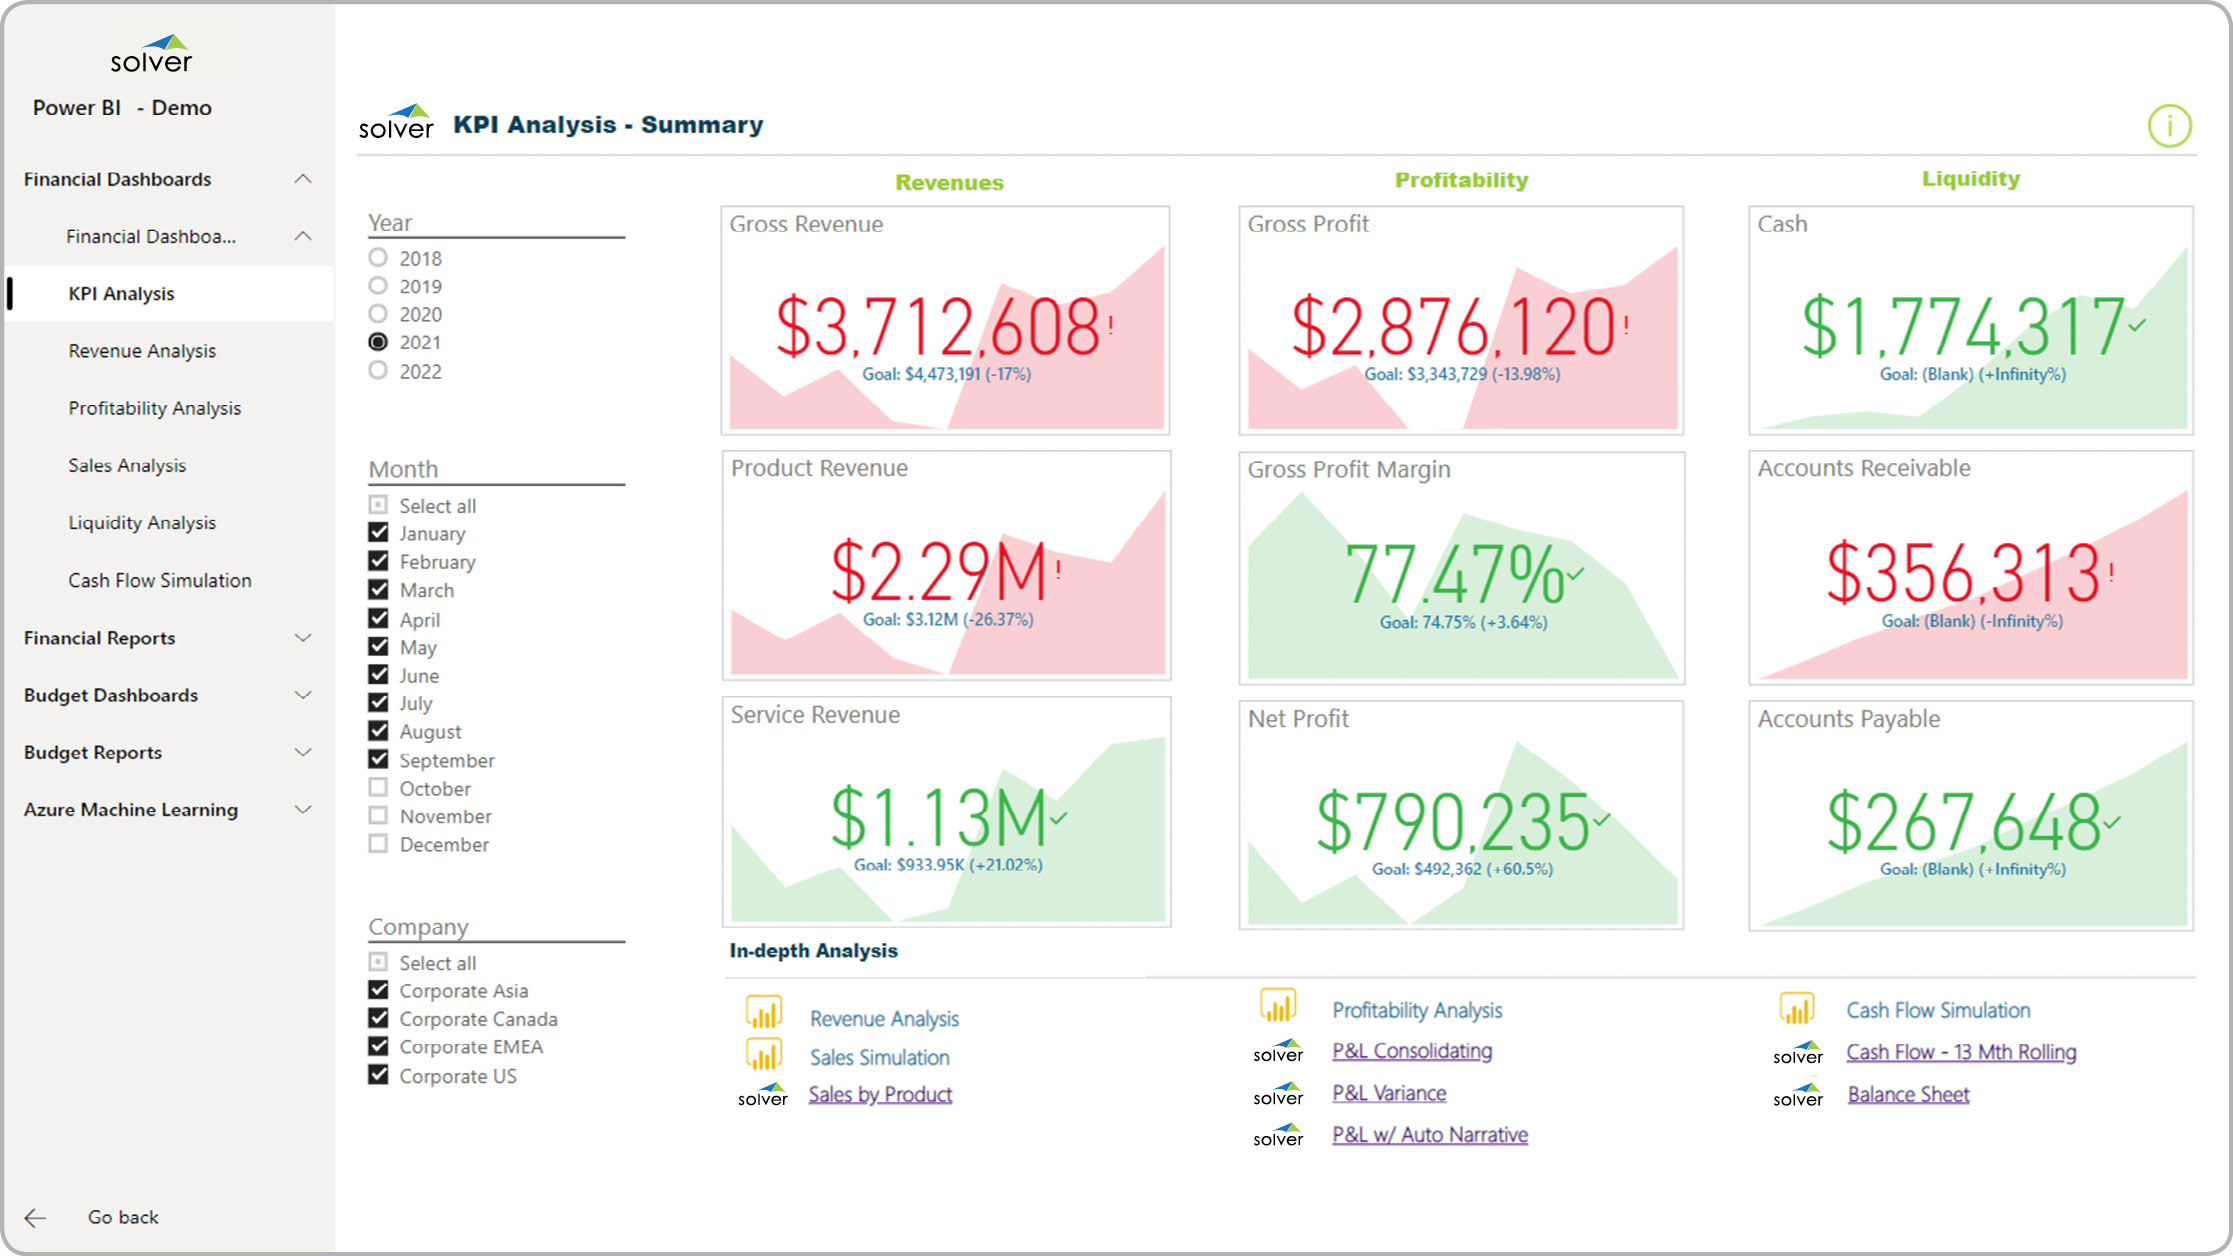
KPI Dashboard
Power BI dashboard with financial KPIs and direct links to financial reports in Solver.
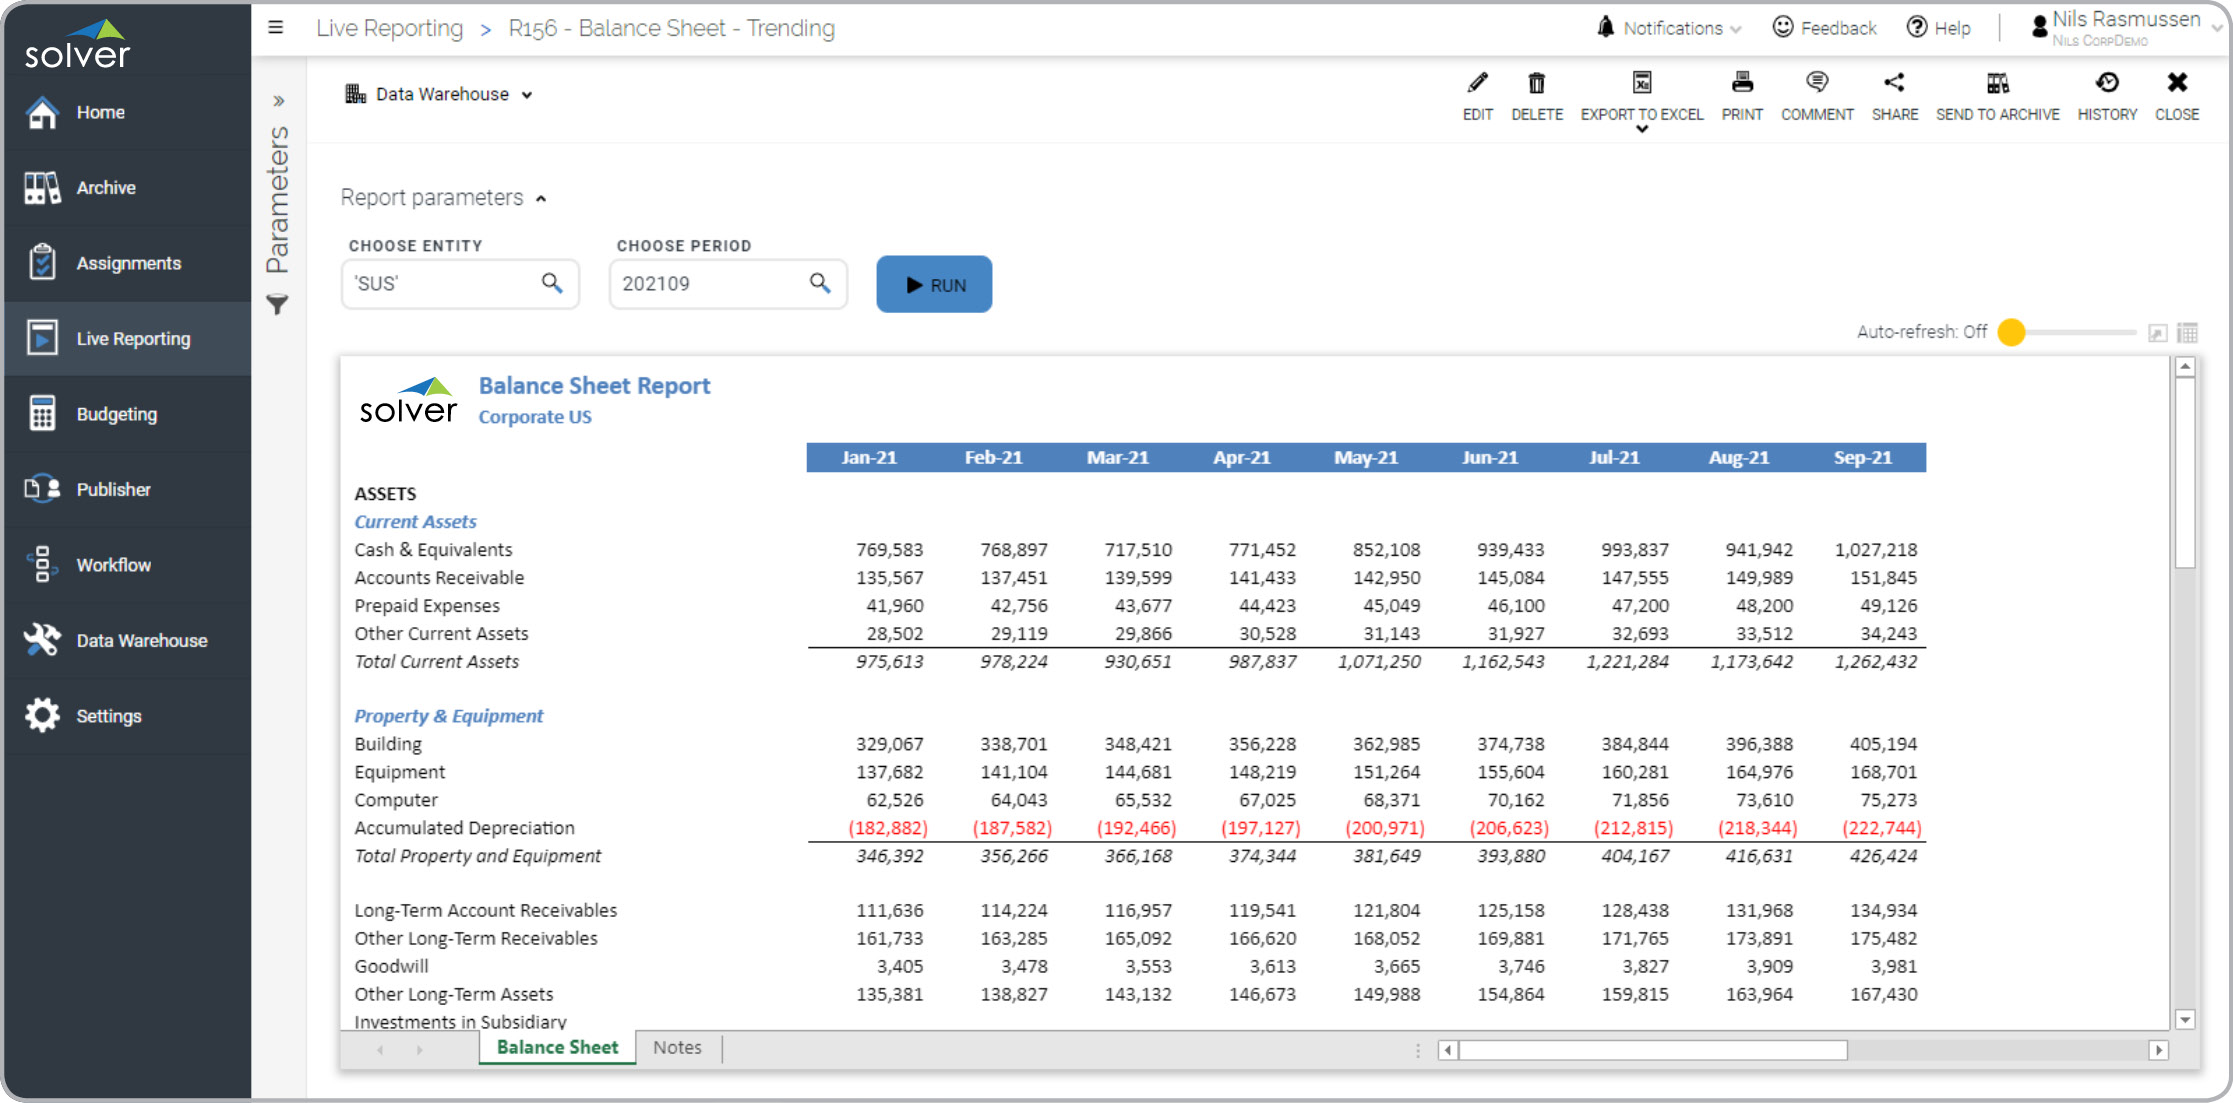
Balance Sheet – Trended
Balance Sheet report that dynamically lists months across up to the current period.
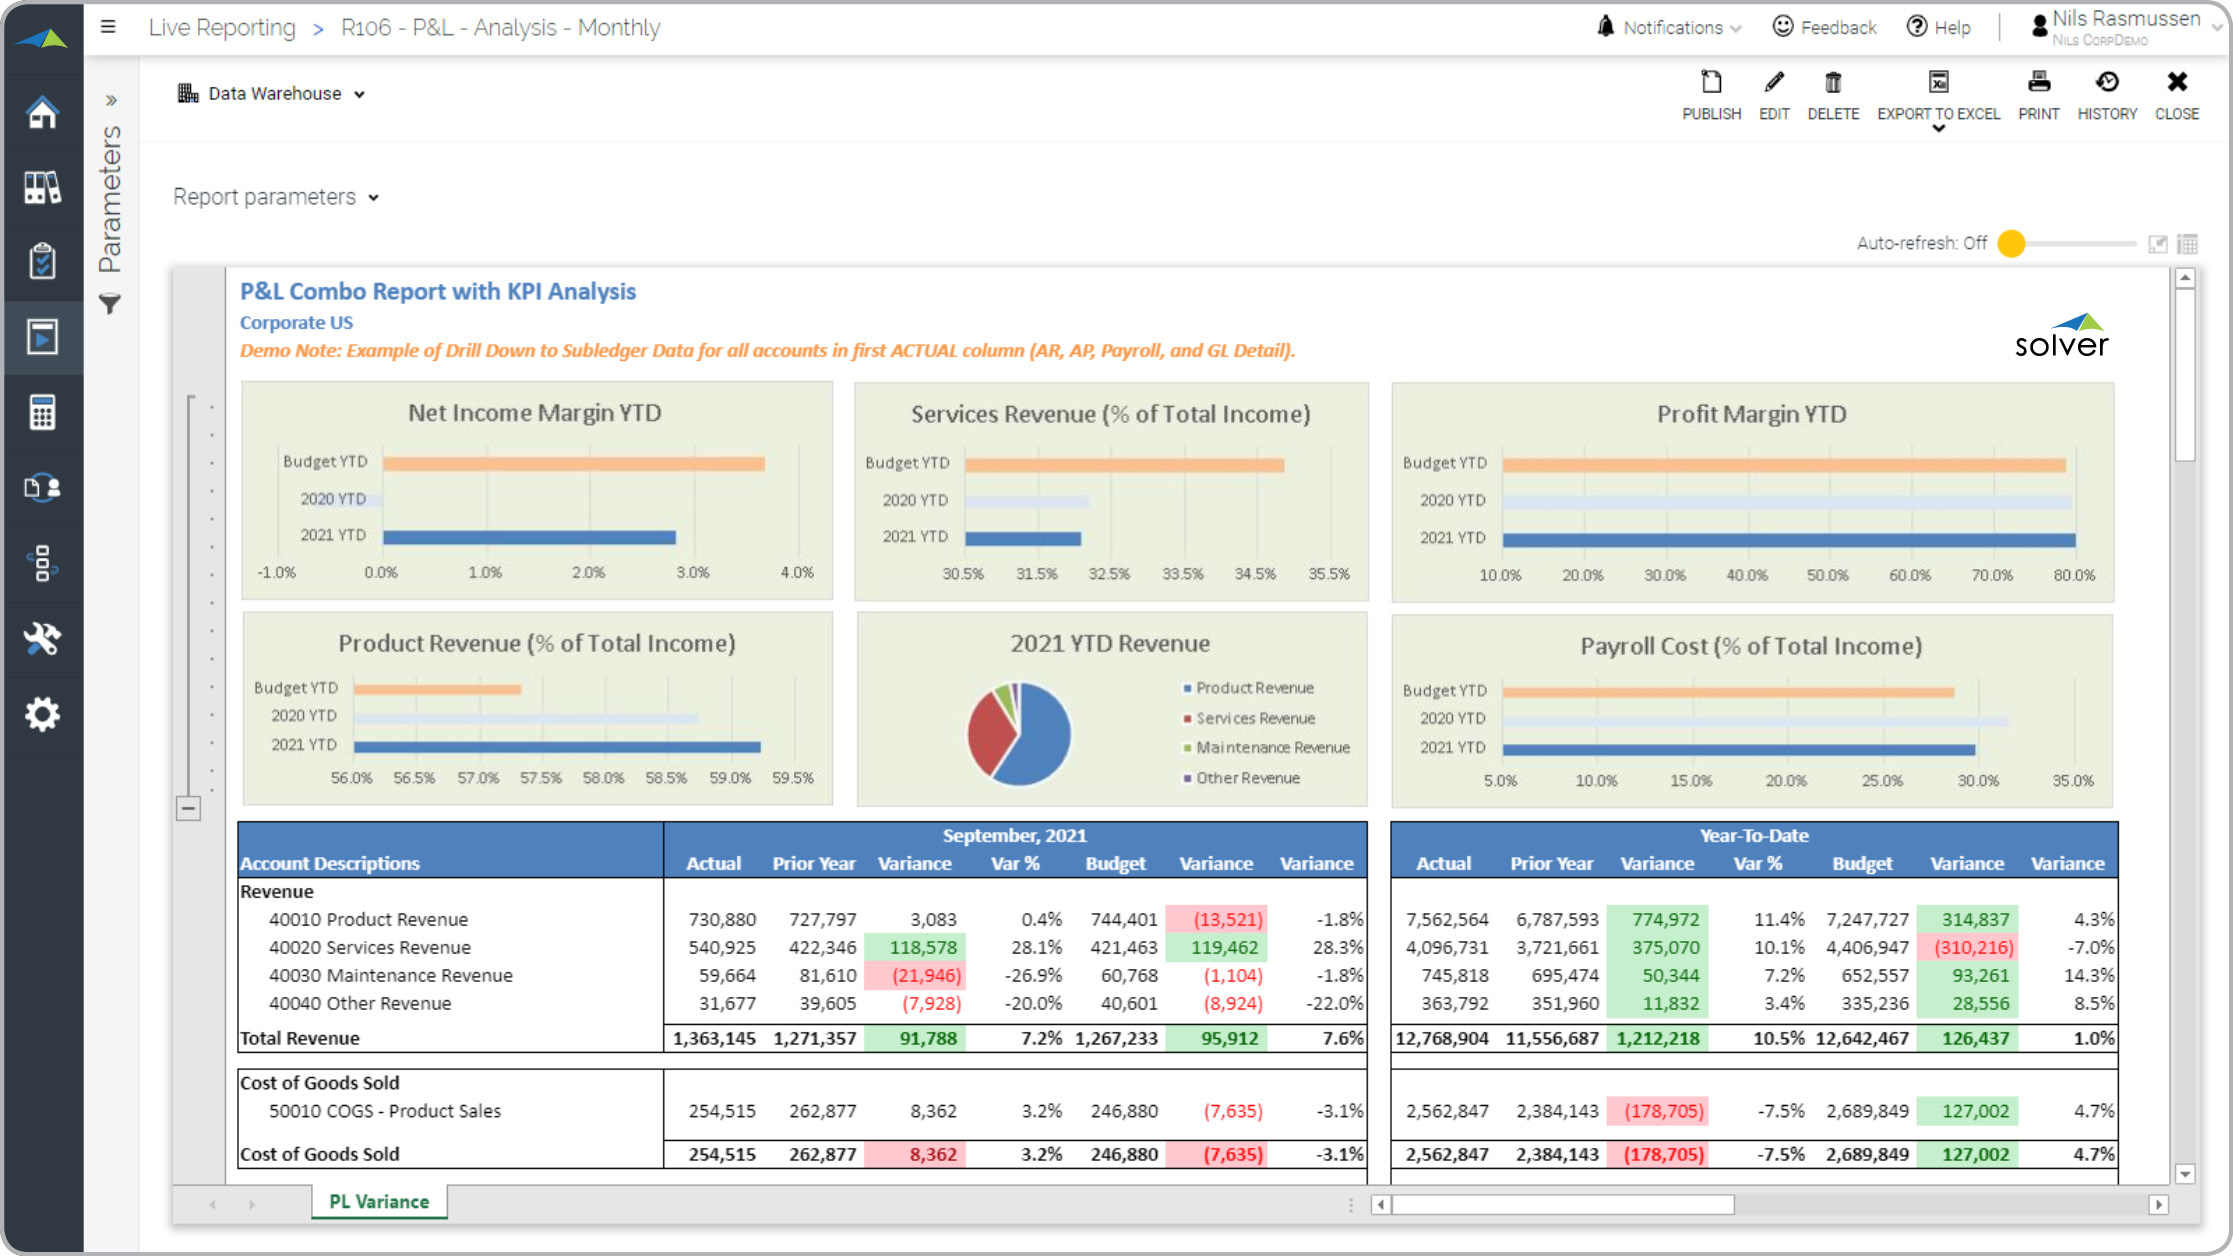
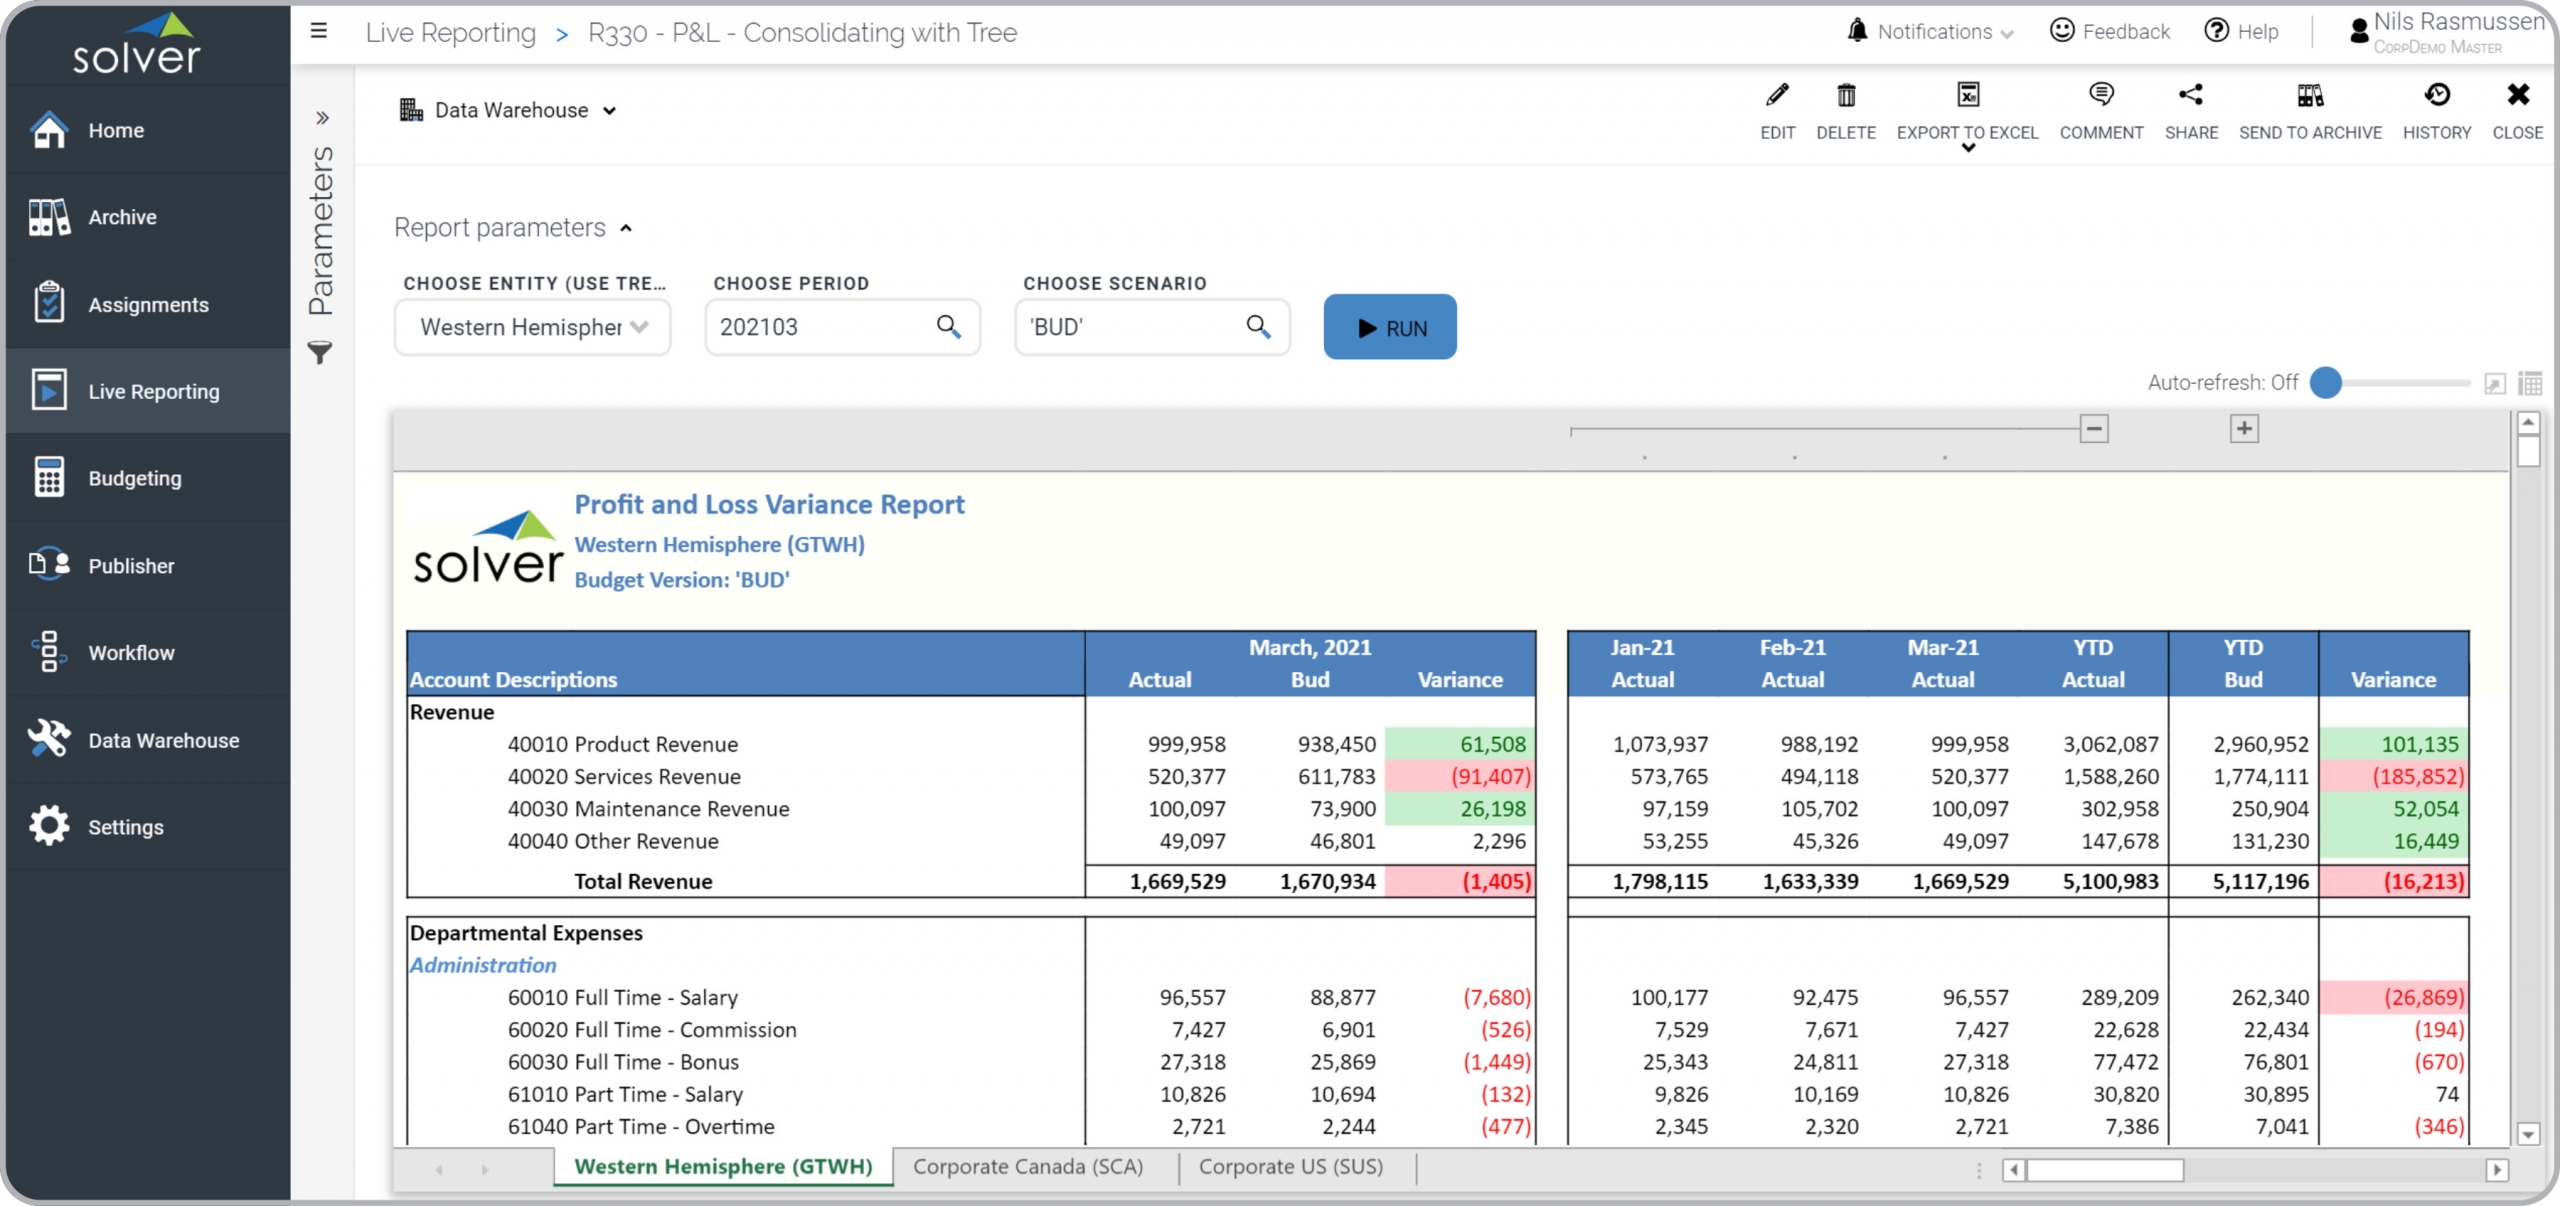
P&L Variance Report
P&L report with actual, budget, last year and variances.
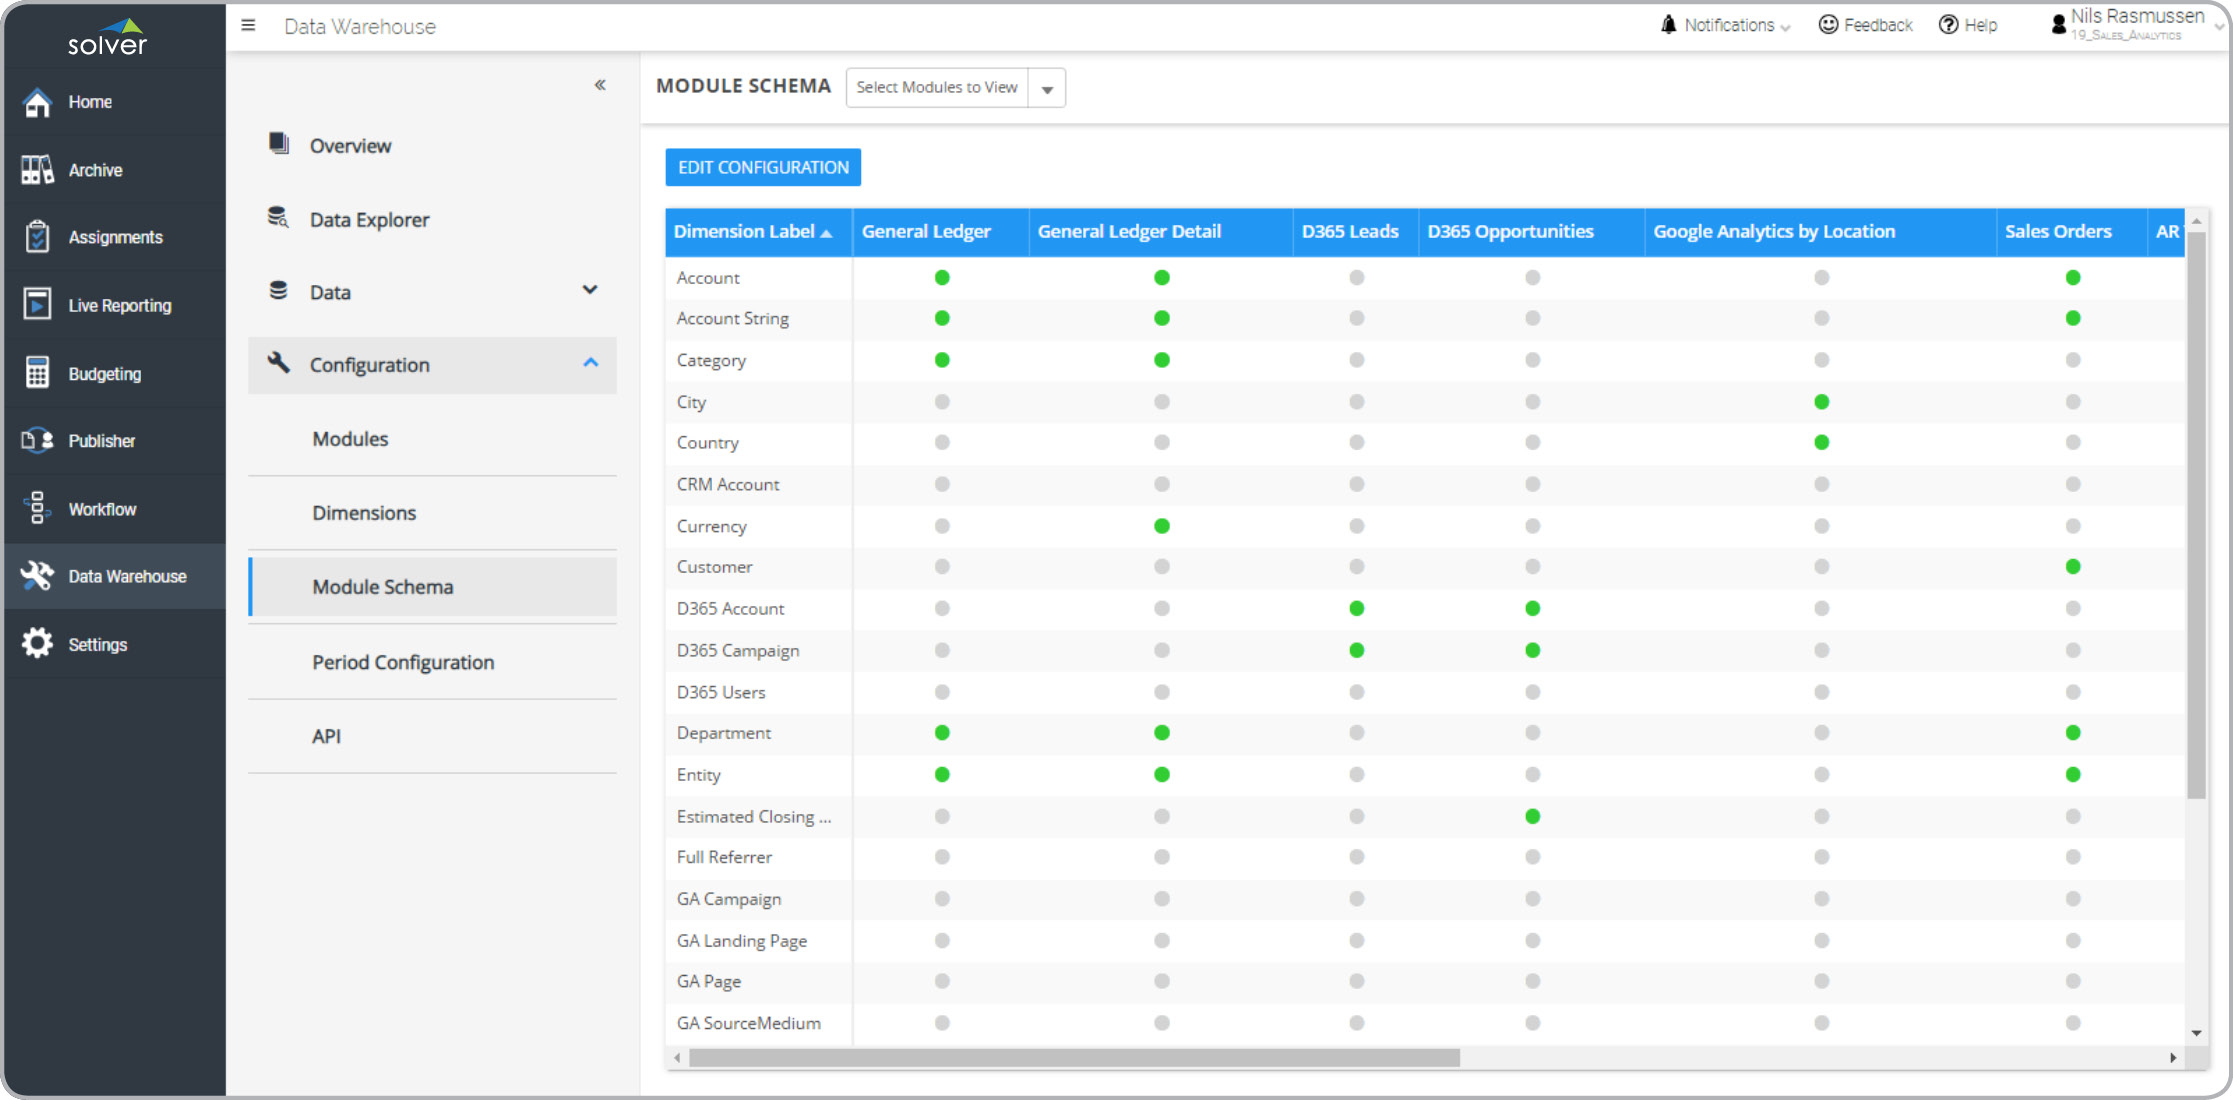
Data Warehouse Schema
Data Warehouse schema where modules and dimensions can be managed.
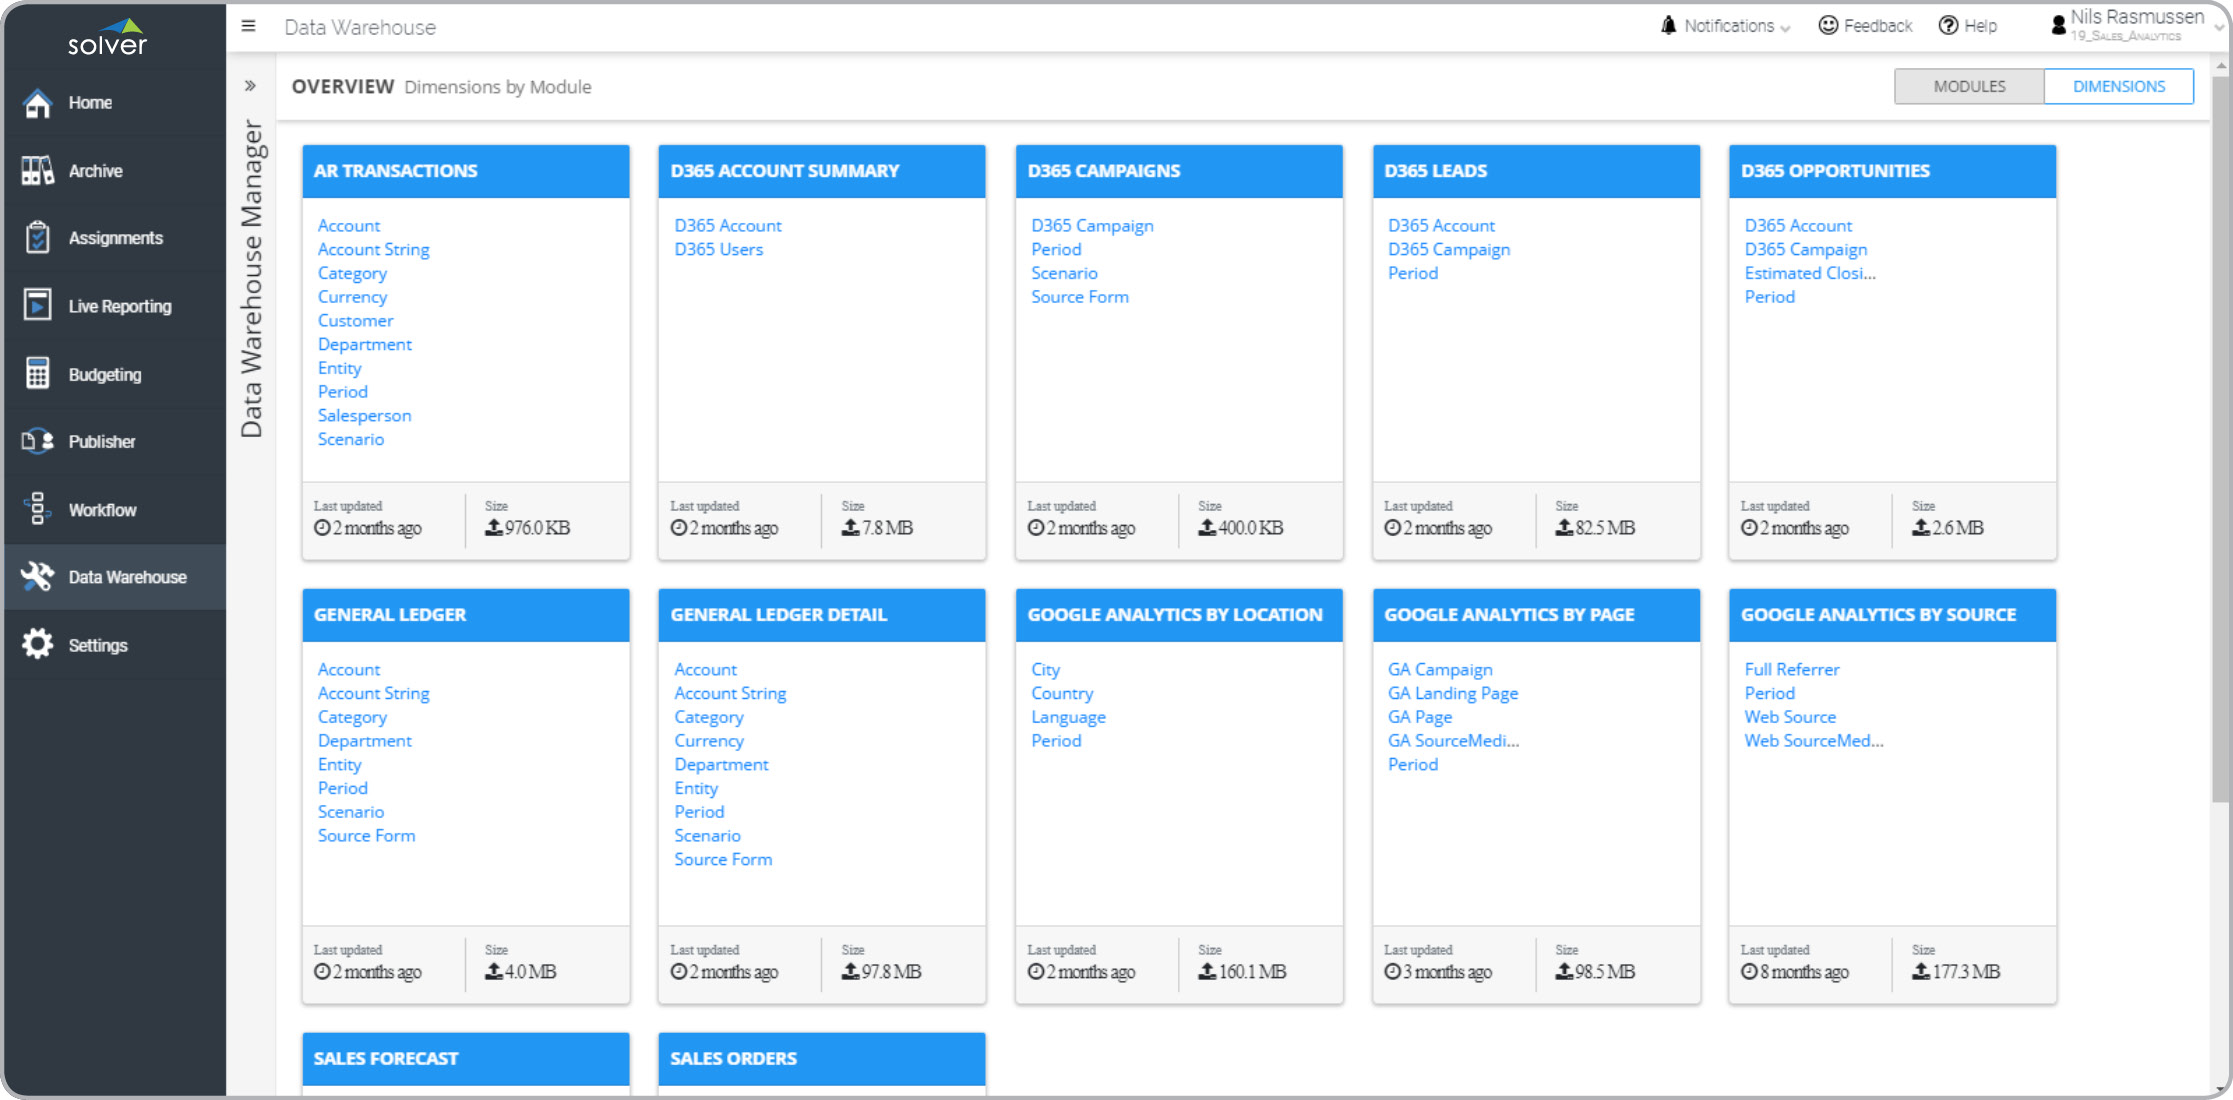
Solver Data Warehouse Modules
Example of user-defined modules in the Data Warehouse.
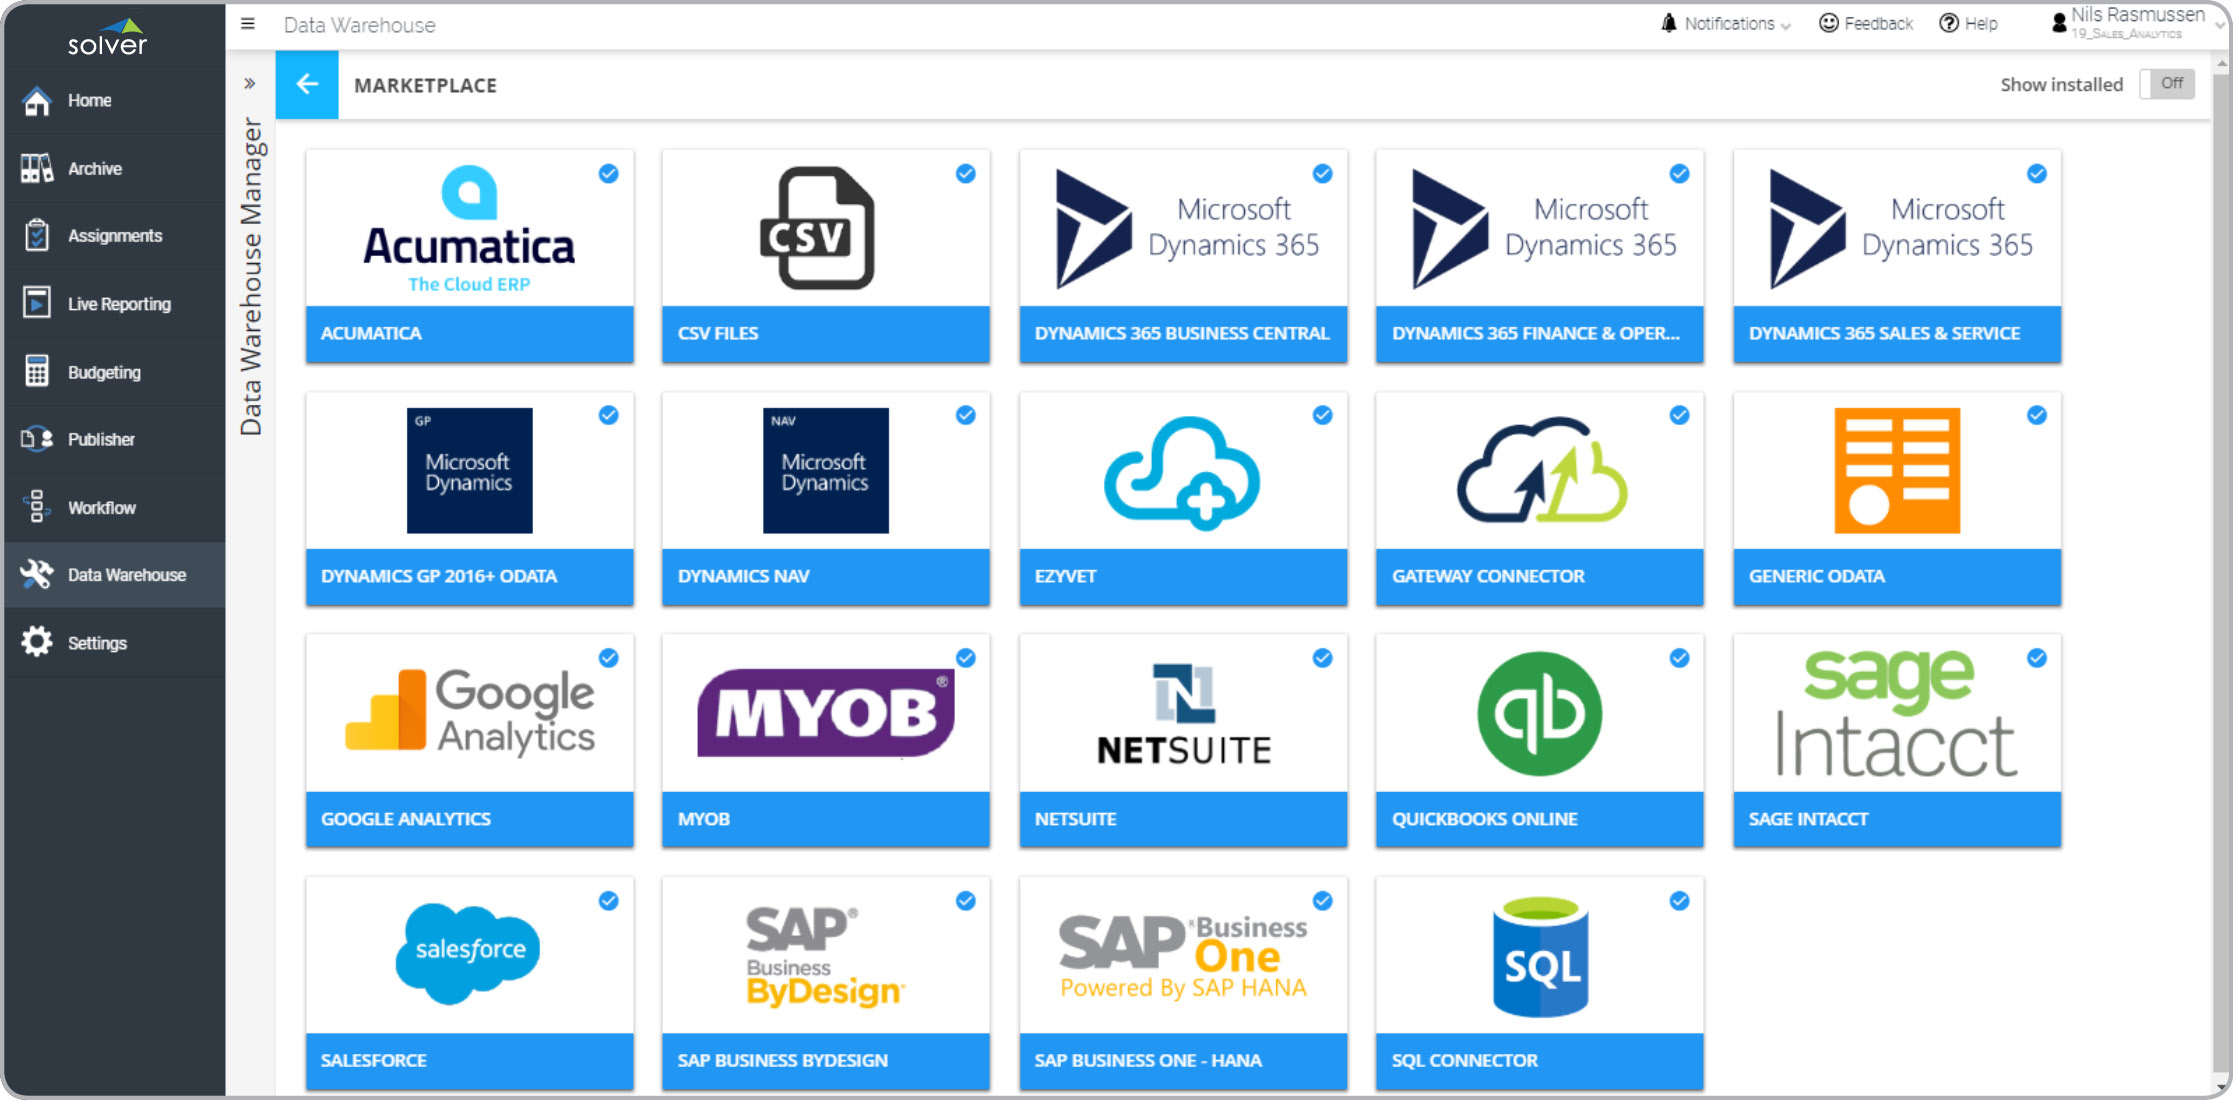
Data Warehouse Connectors
Example of some of the data source connectors in the Data Warehouse.
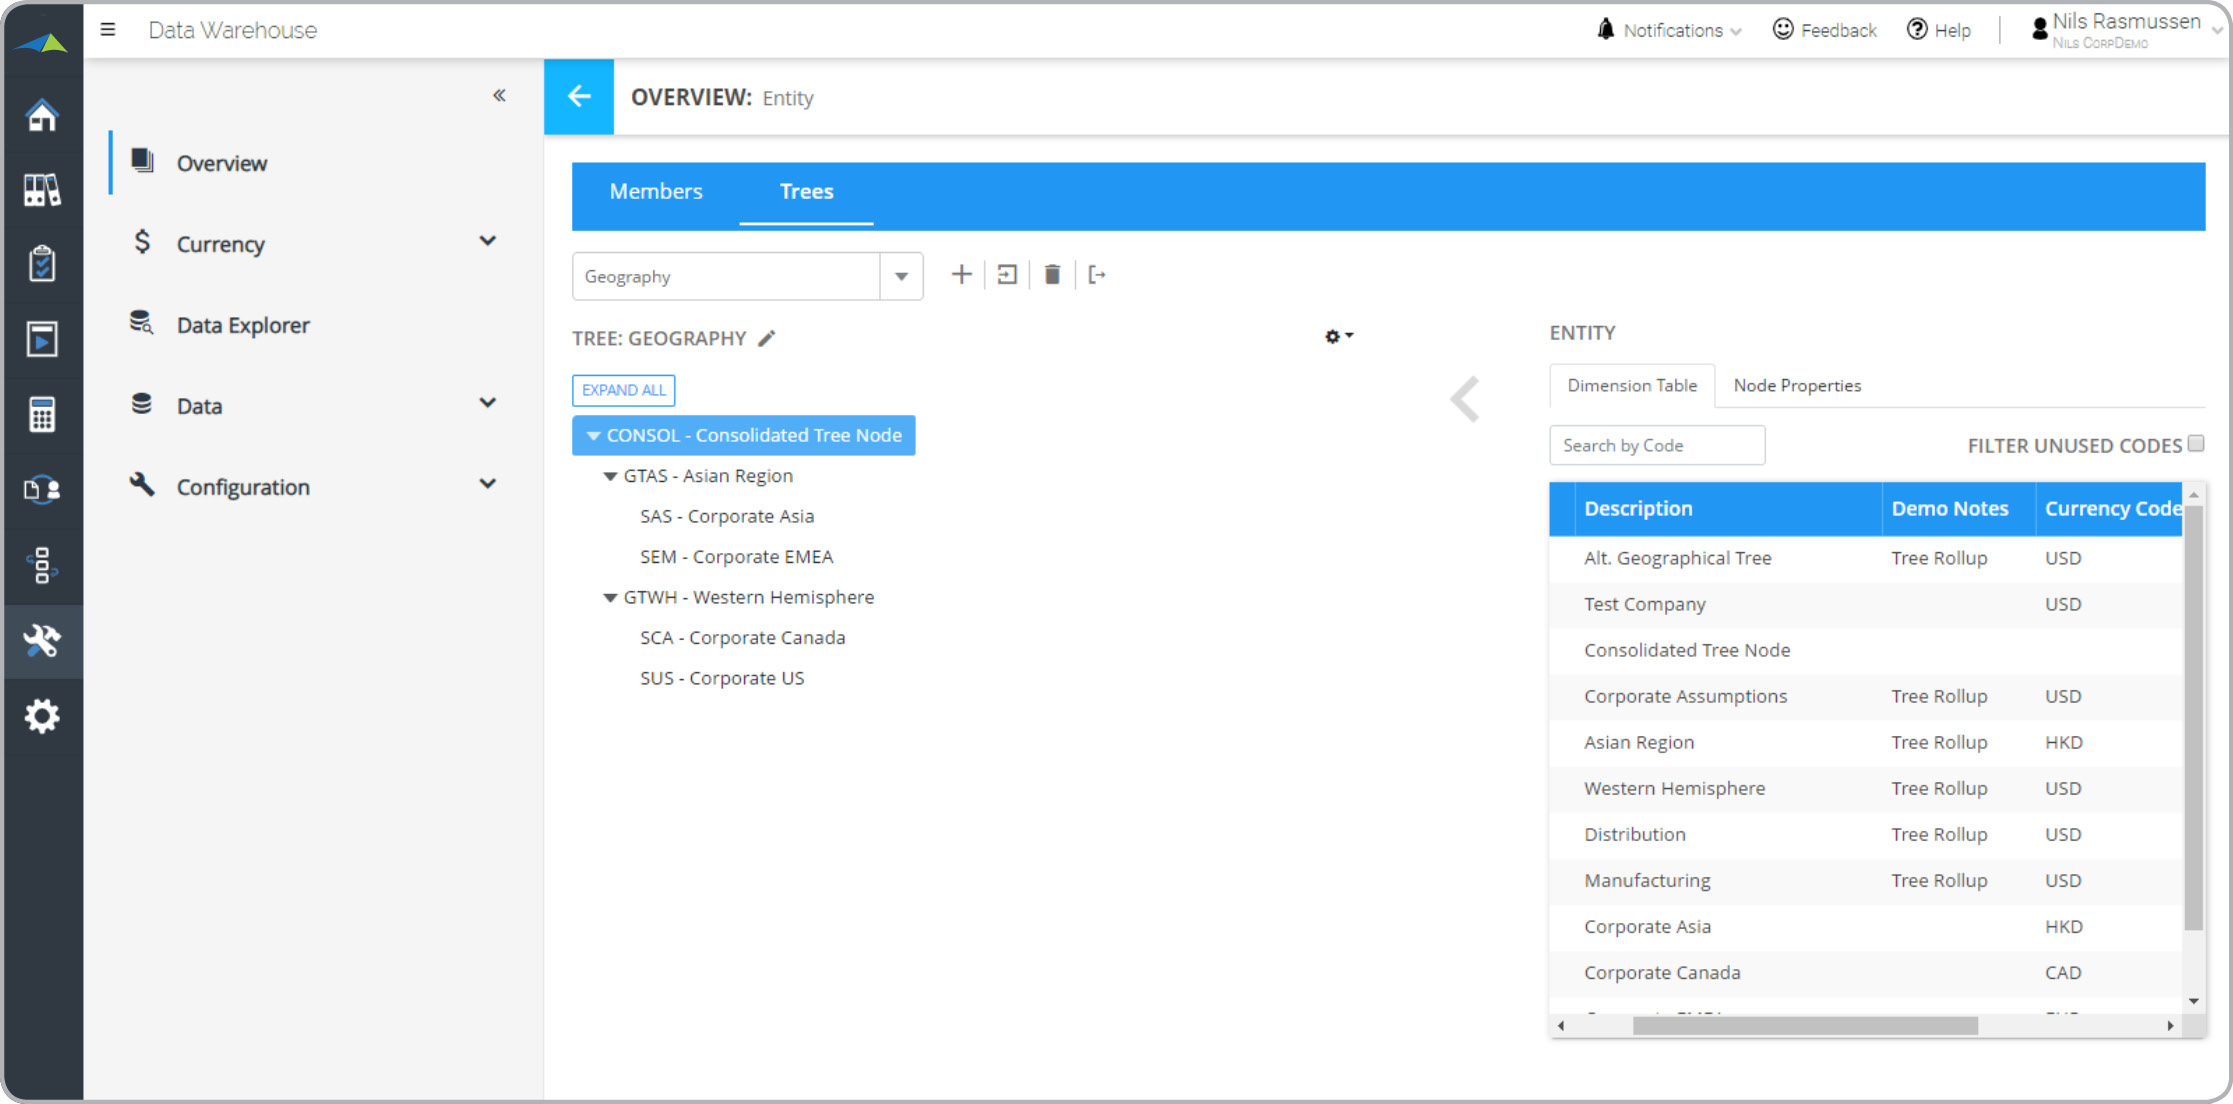
Consolidation Tree
Example of company tree structure used in reports to consolidate companies.
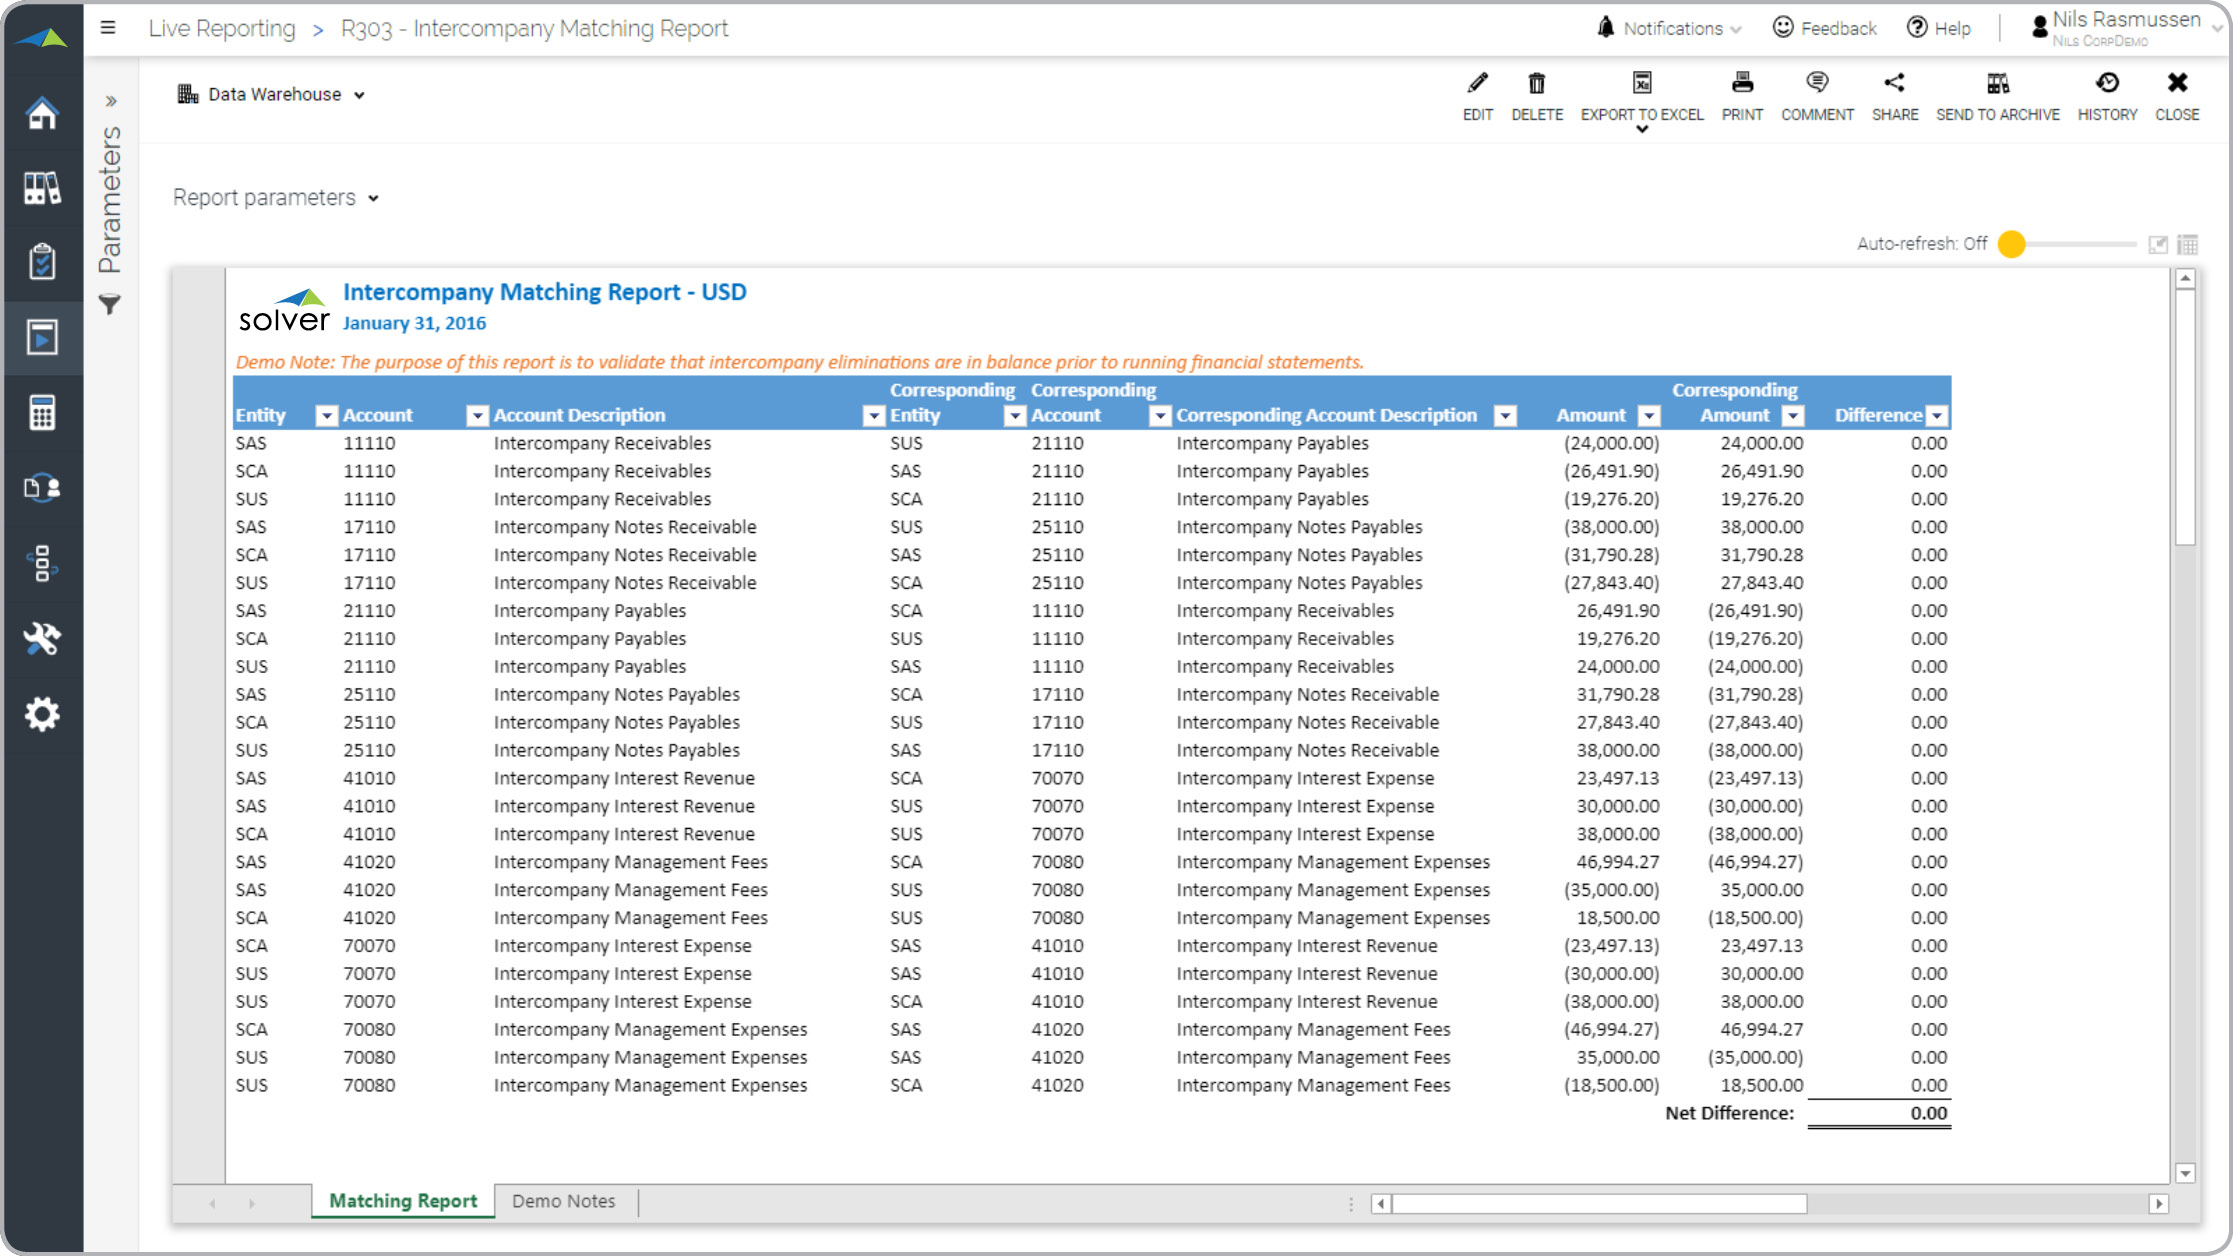
Intercompany Matching
Report that matches intercompany balances.
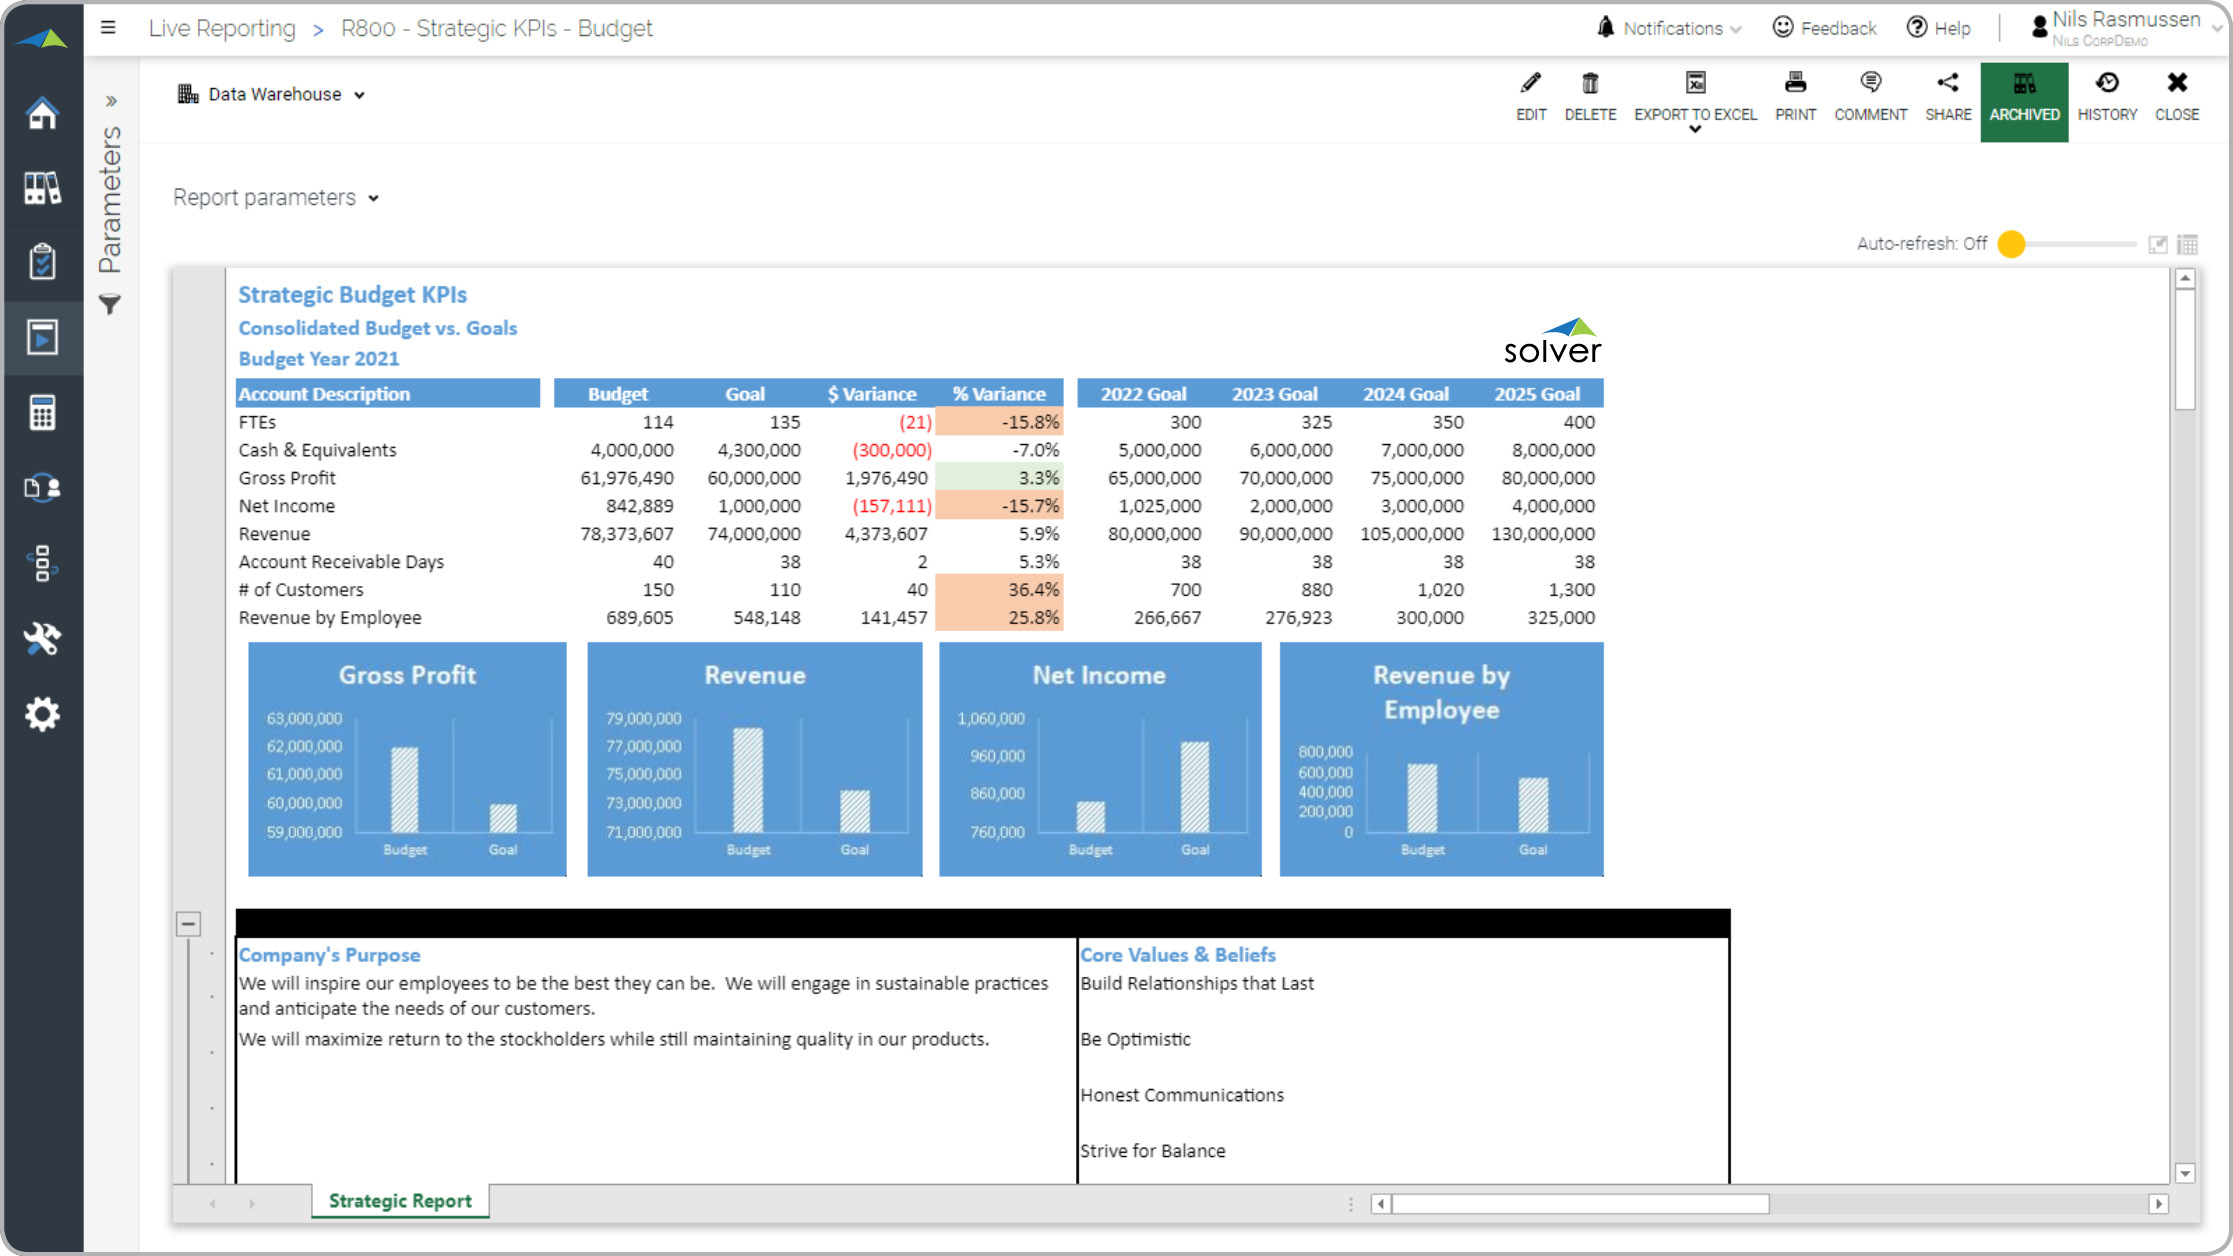
Budget KPI Report
KPI report for analysis of budgets vs strategic goals.
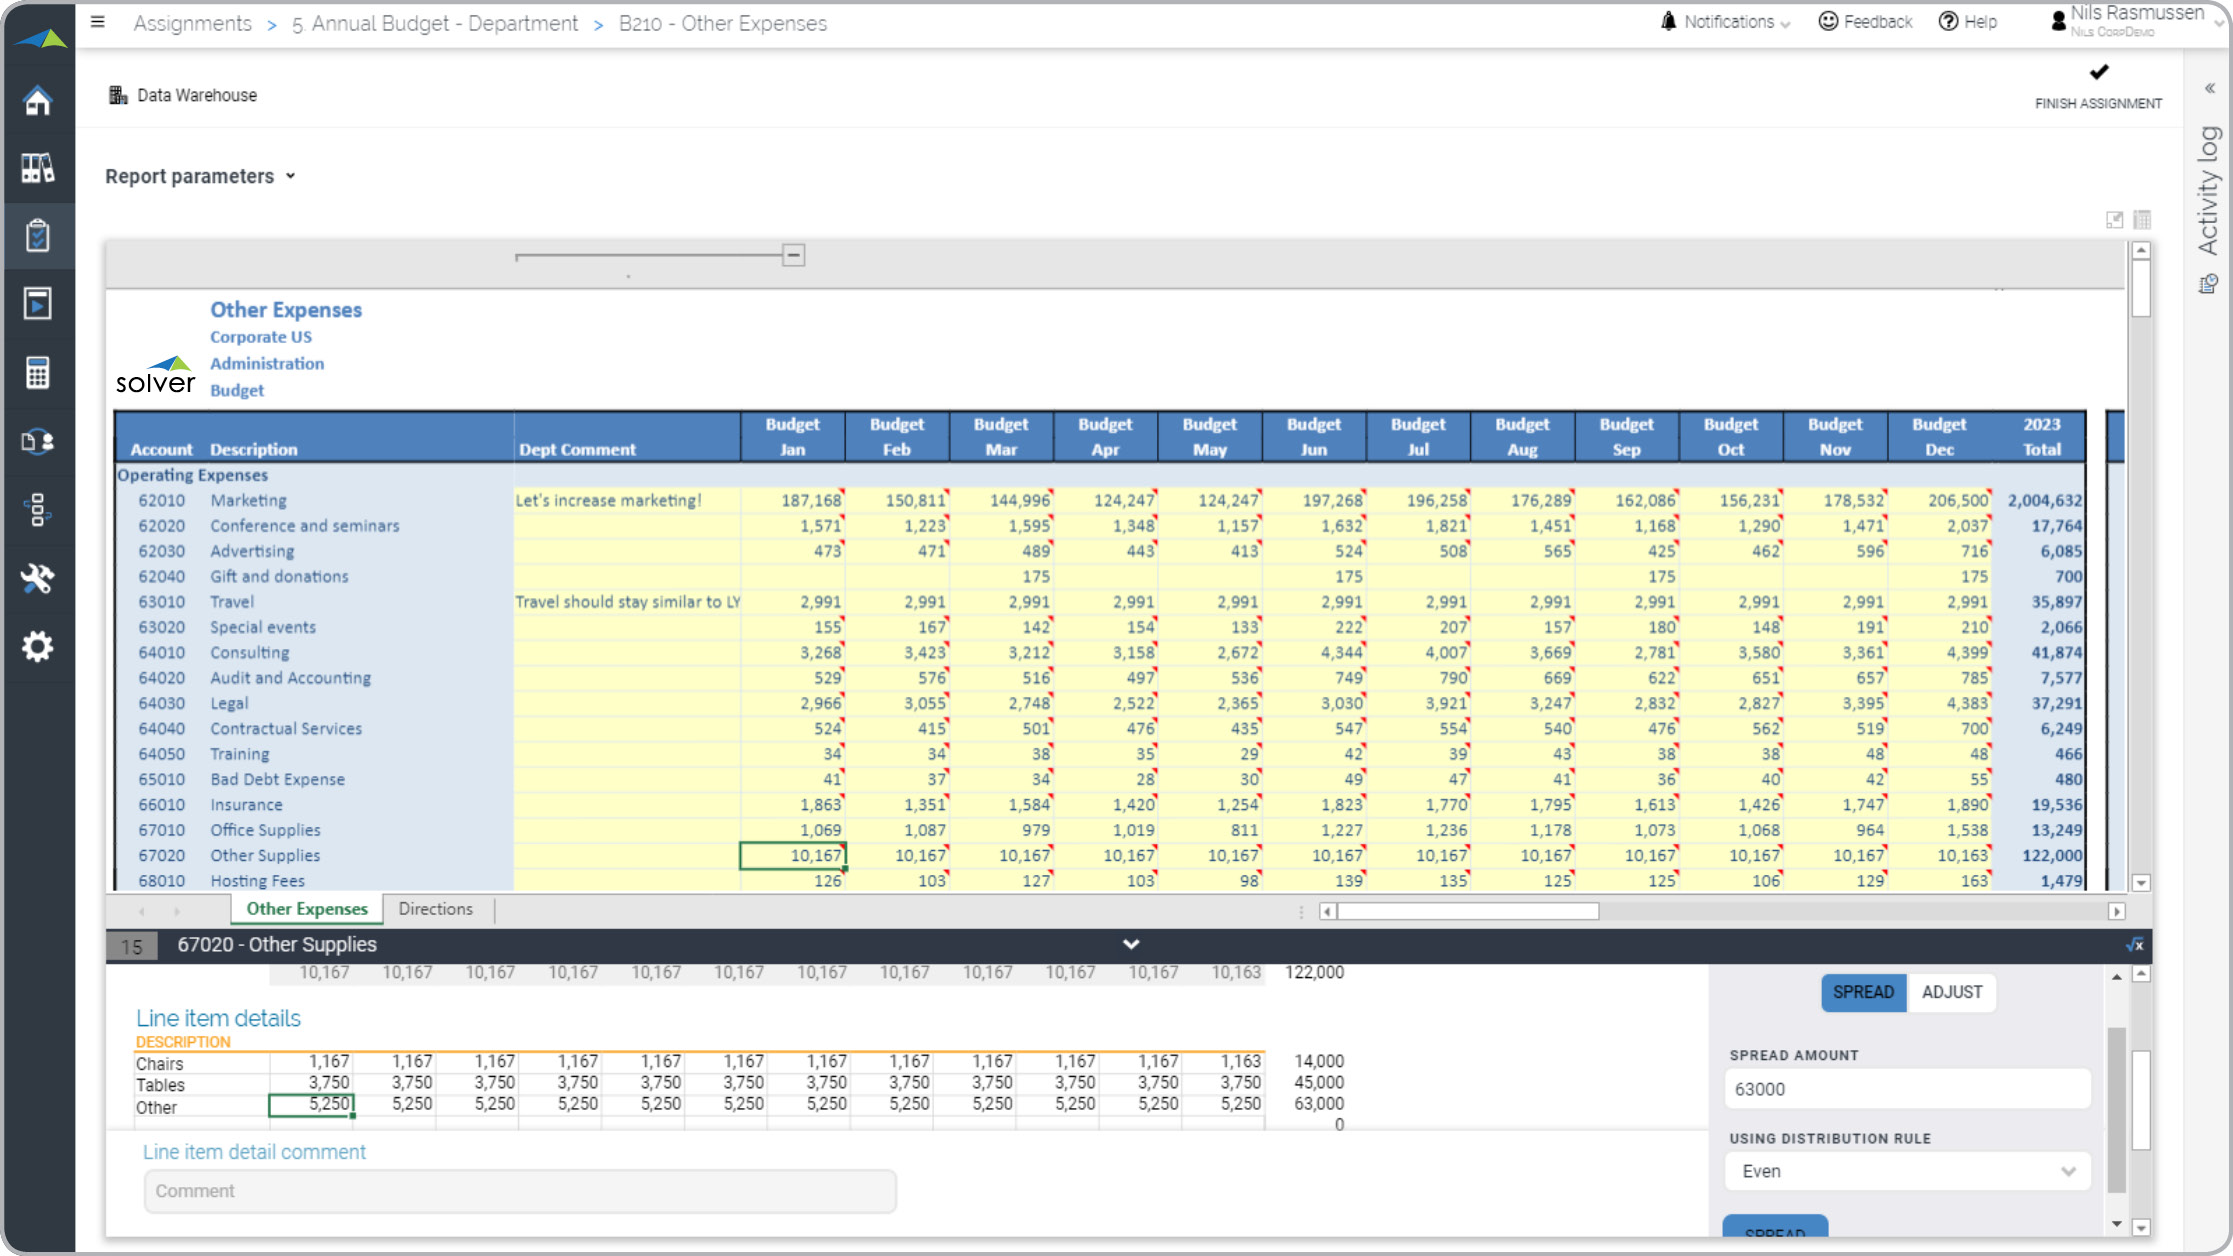
Expense Budget Form
Input of expenses at the GL account level, which includes line item detail, spreading, etc.
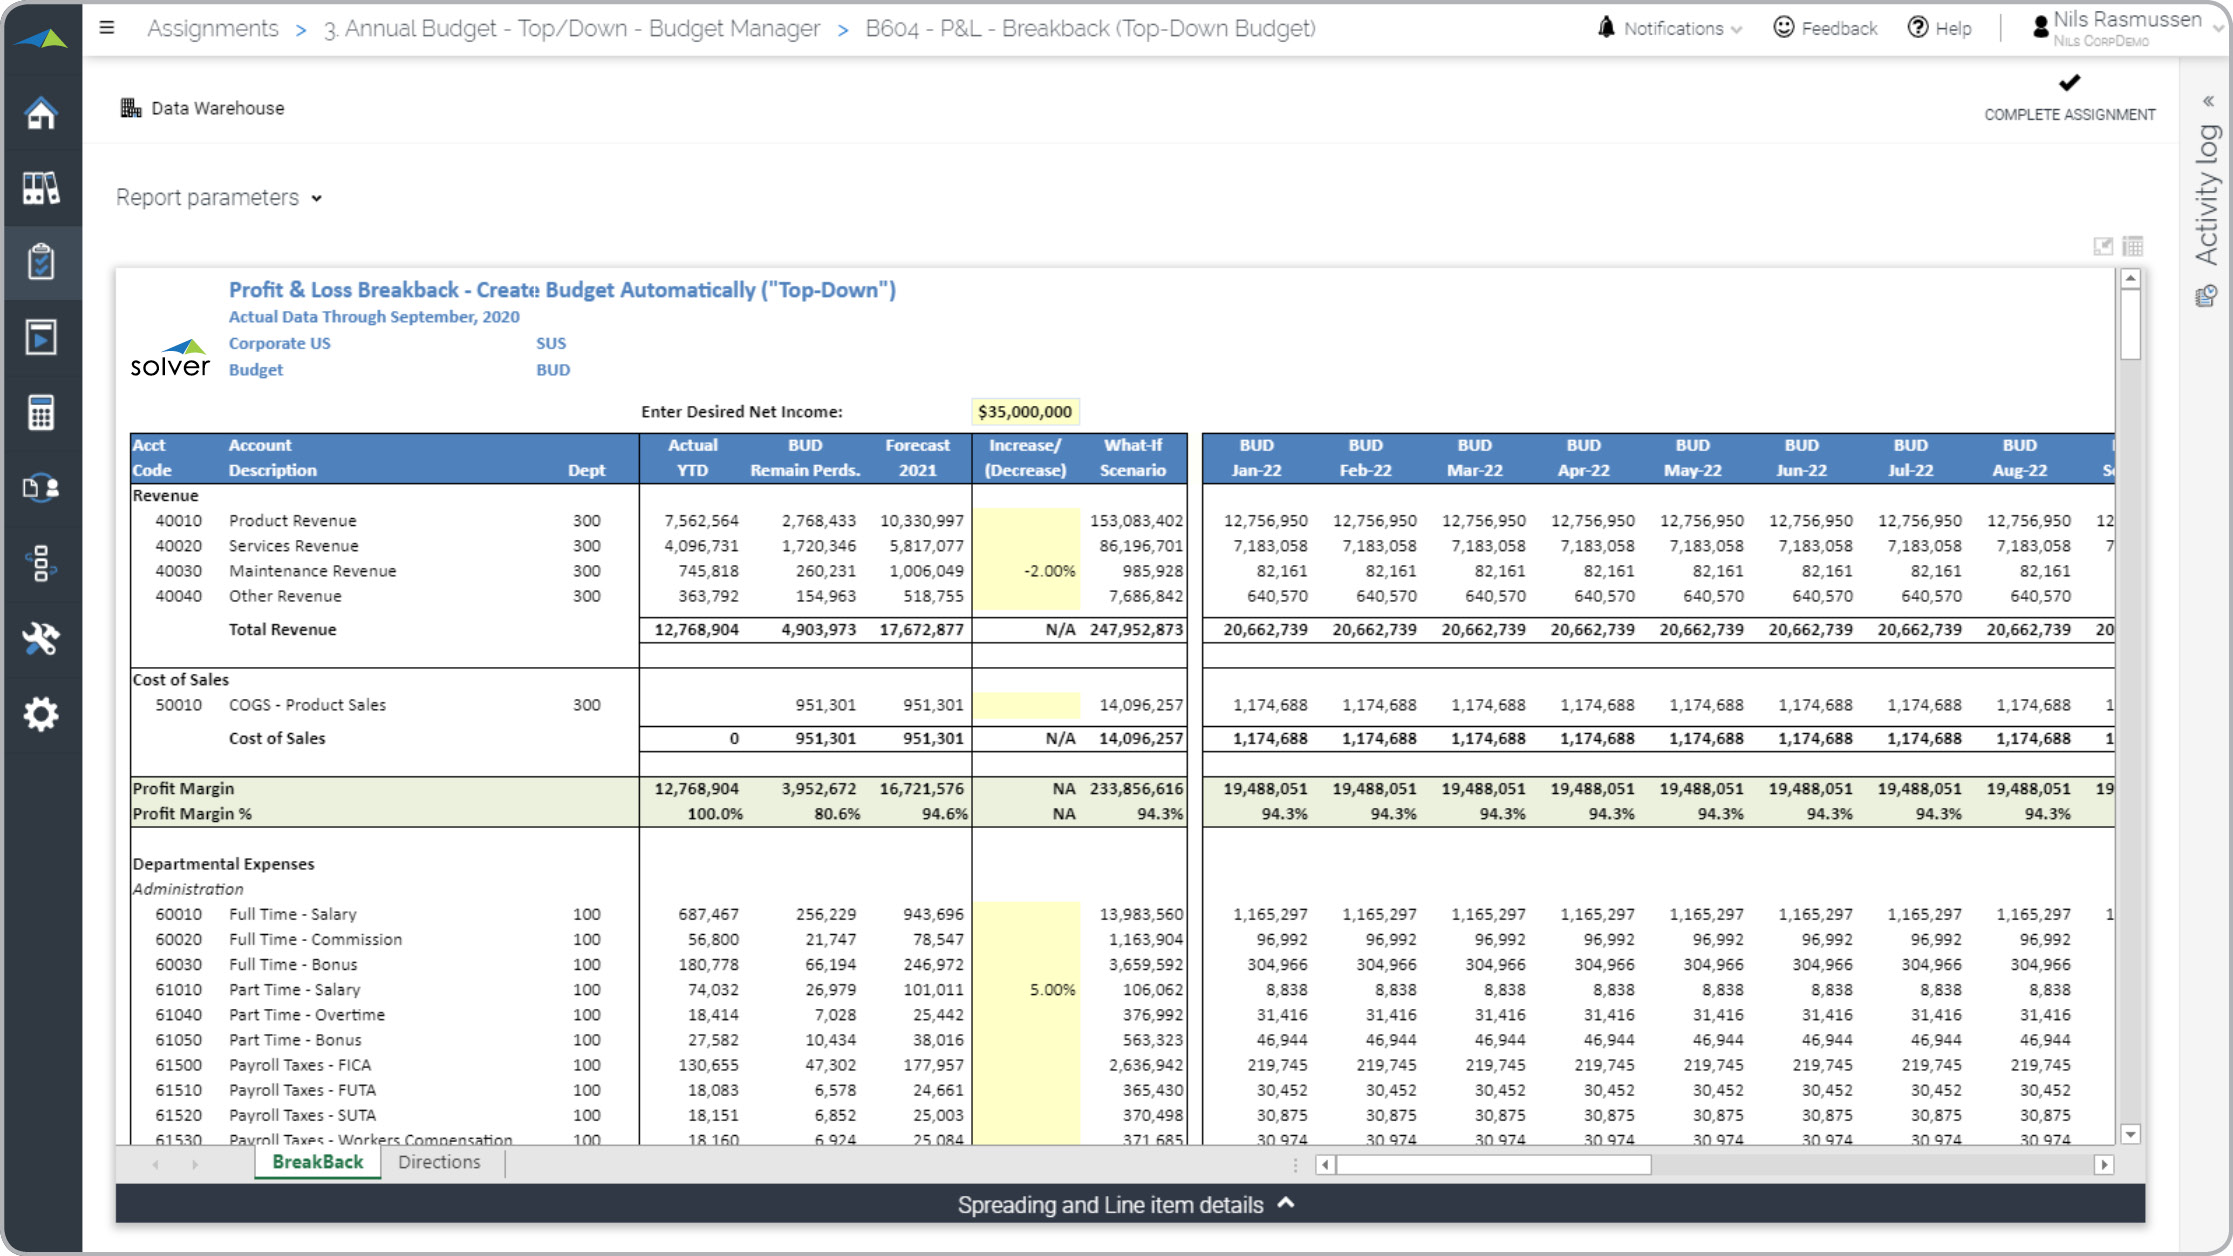
P&L Budget Form
Used for top-down budgets automatically generated based on input of target net income.
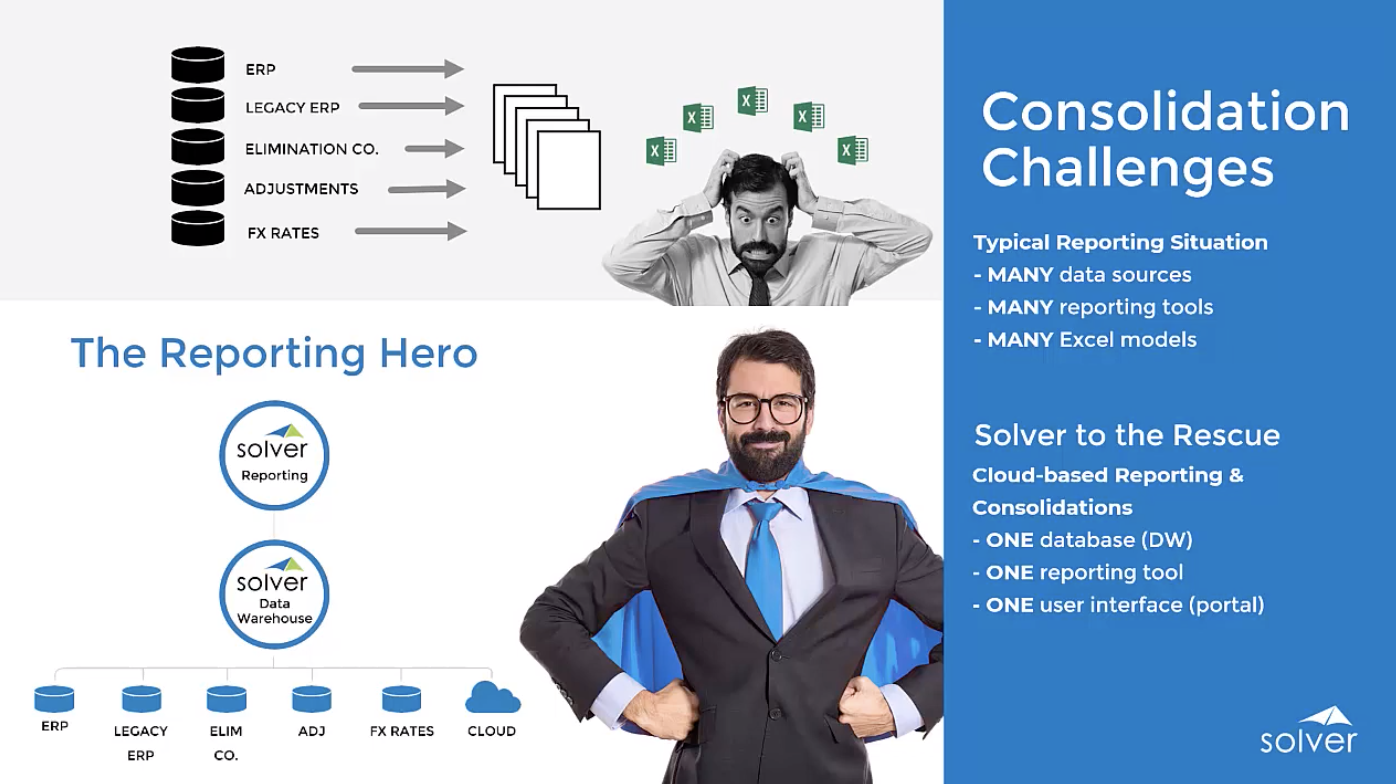
Consolidations Overview
Learn about consolidations, adjustments, eliminations & currency functionality.
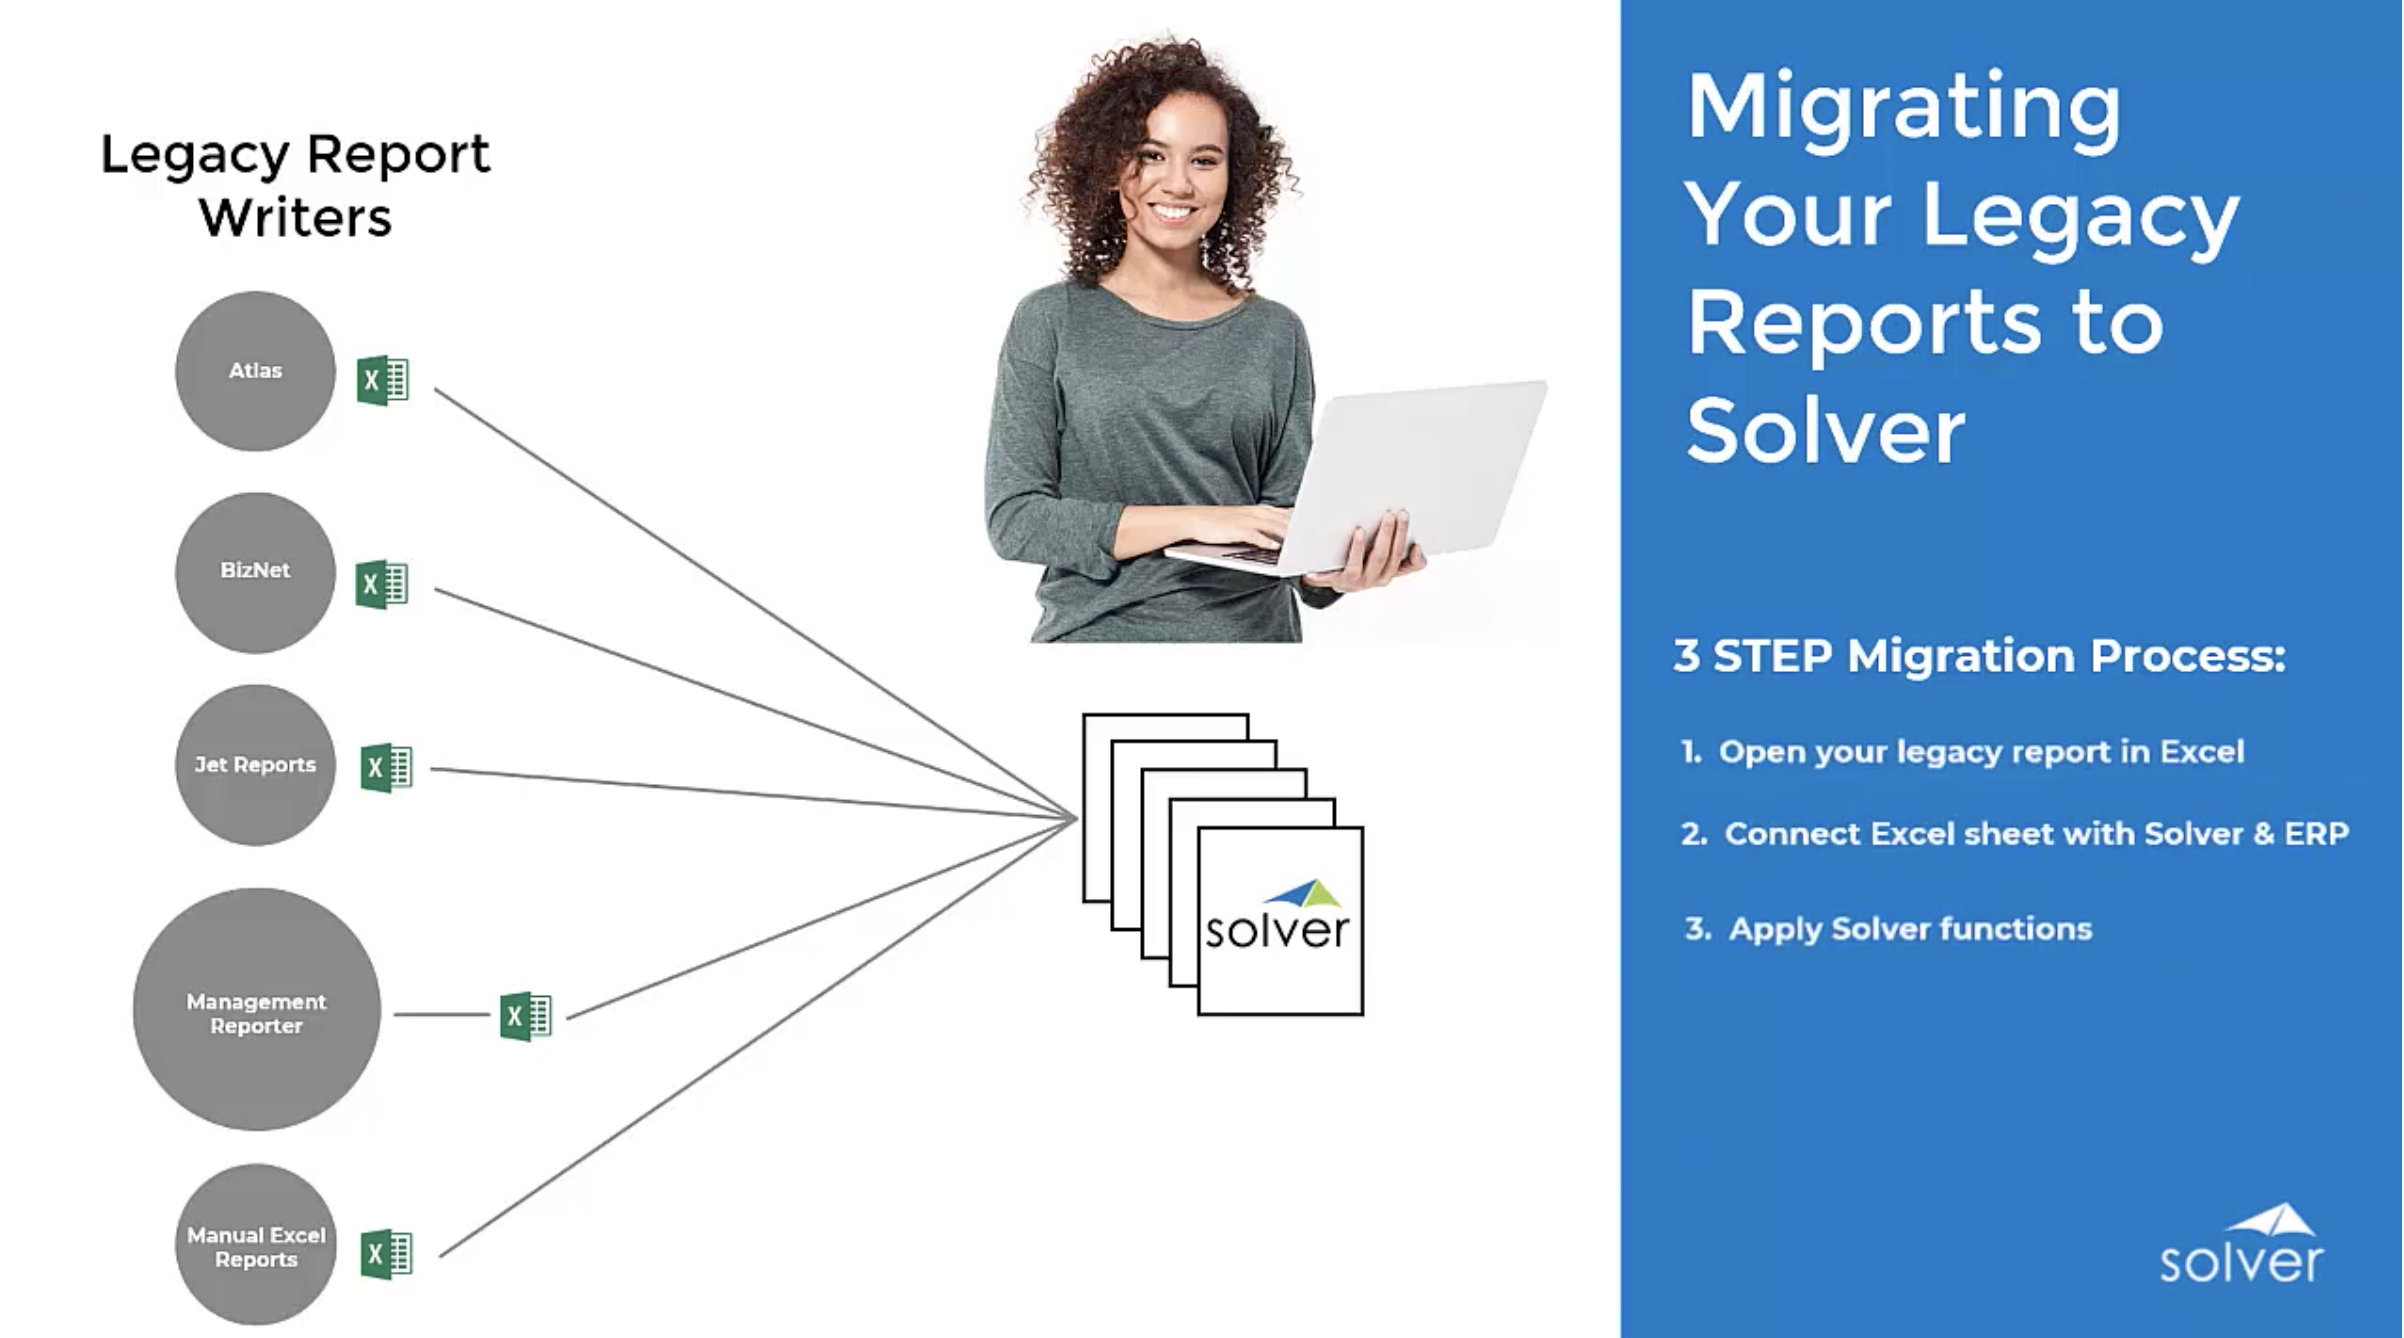
Reporting & Analysis – Migrating Reports from Other Report Writers
Example of migrating your legacy reports into Solver reports.
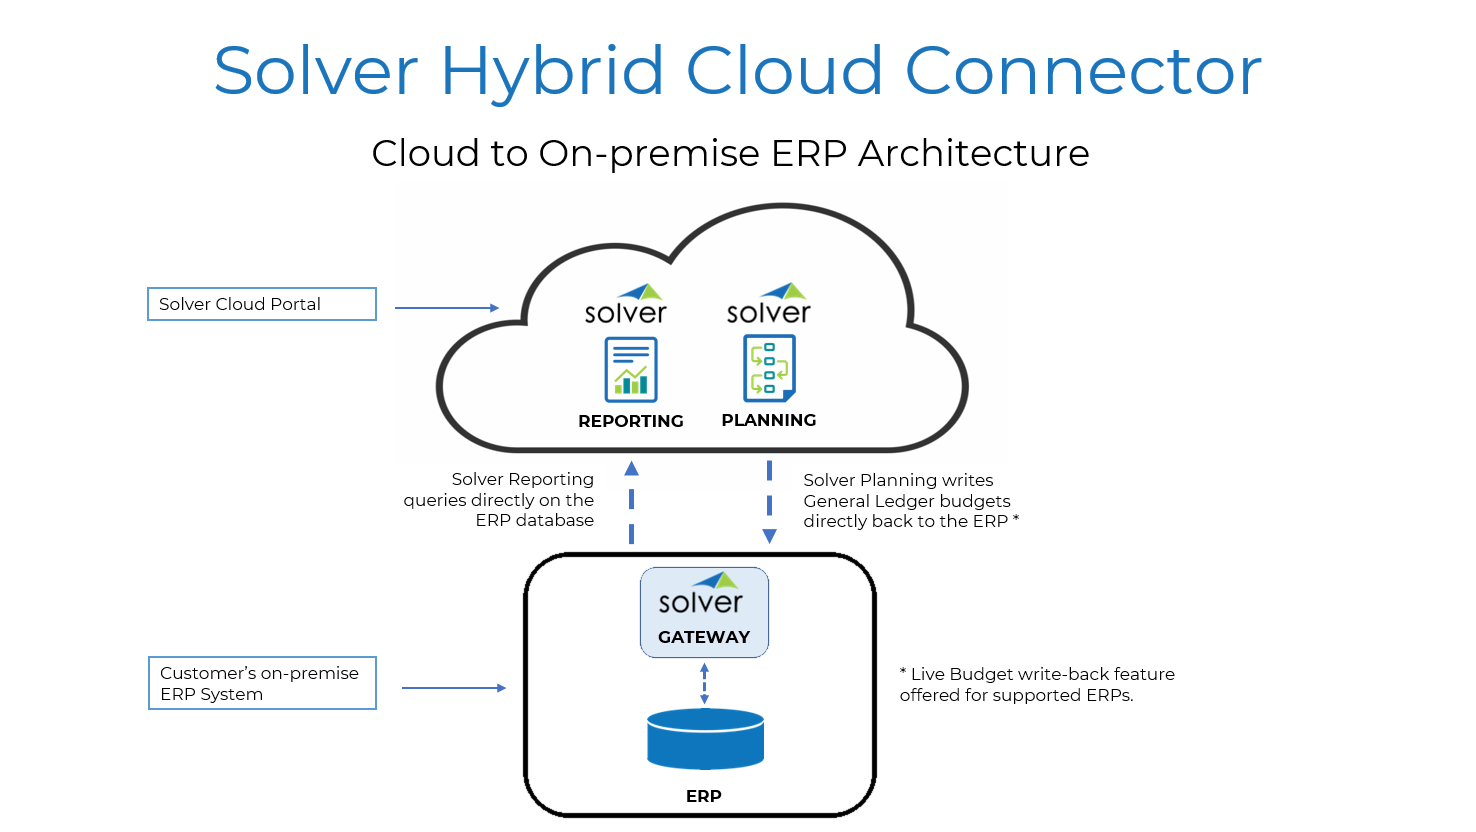
Hybrid Cloud Overview
Shows Solver Cloud with real-time reporting & budgeting for on-premise ERP system.
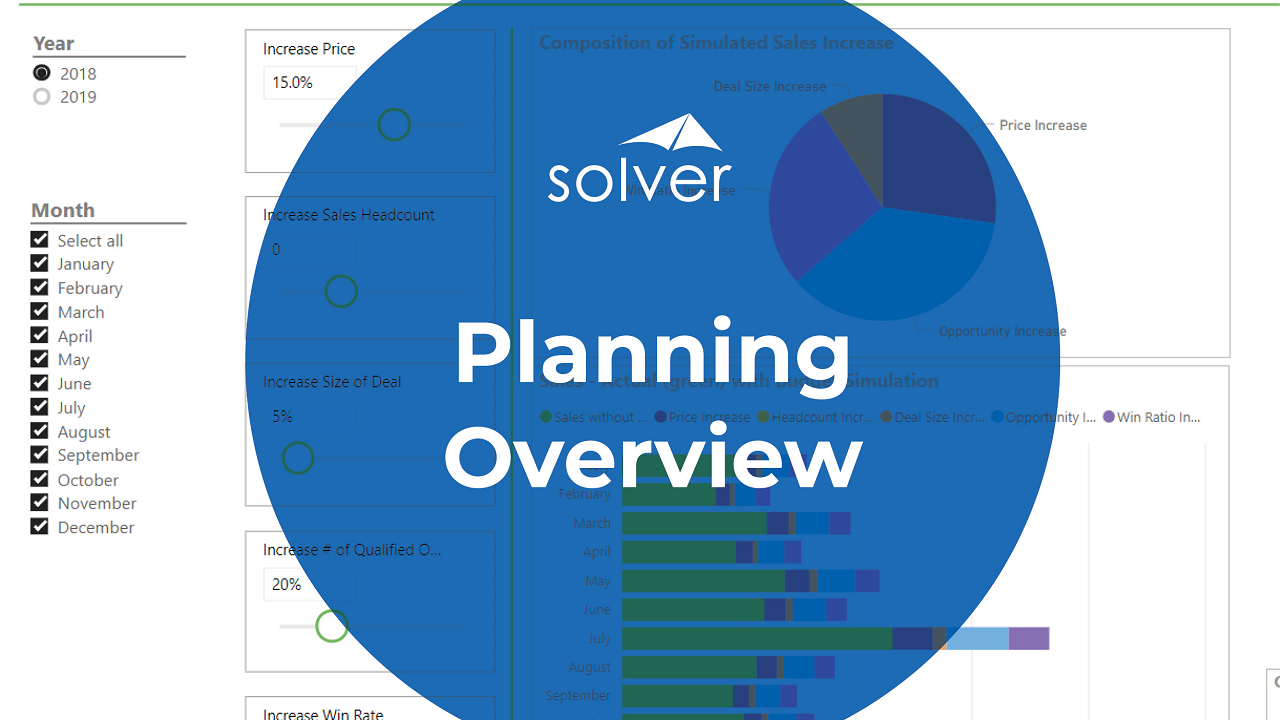
Planning – Input
Budget end-user overview.
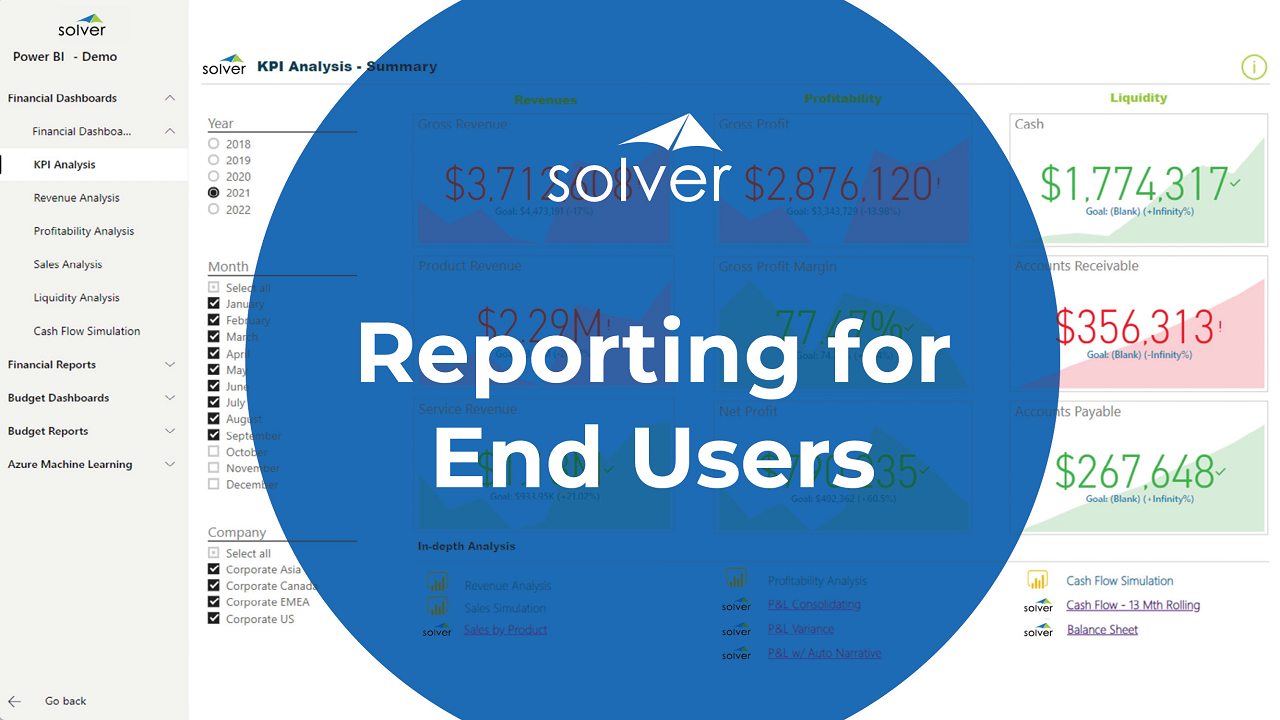
Reporting & Analysis – Overview
End-user overview of reporting and dashboards.
Reporting & Analysis – Power User
Power-user overview of reporting and dashboards.
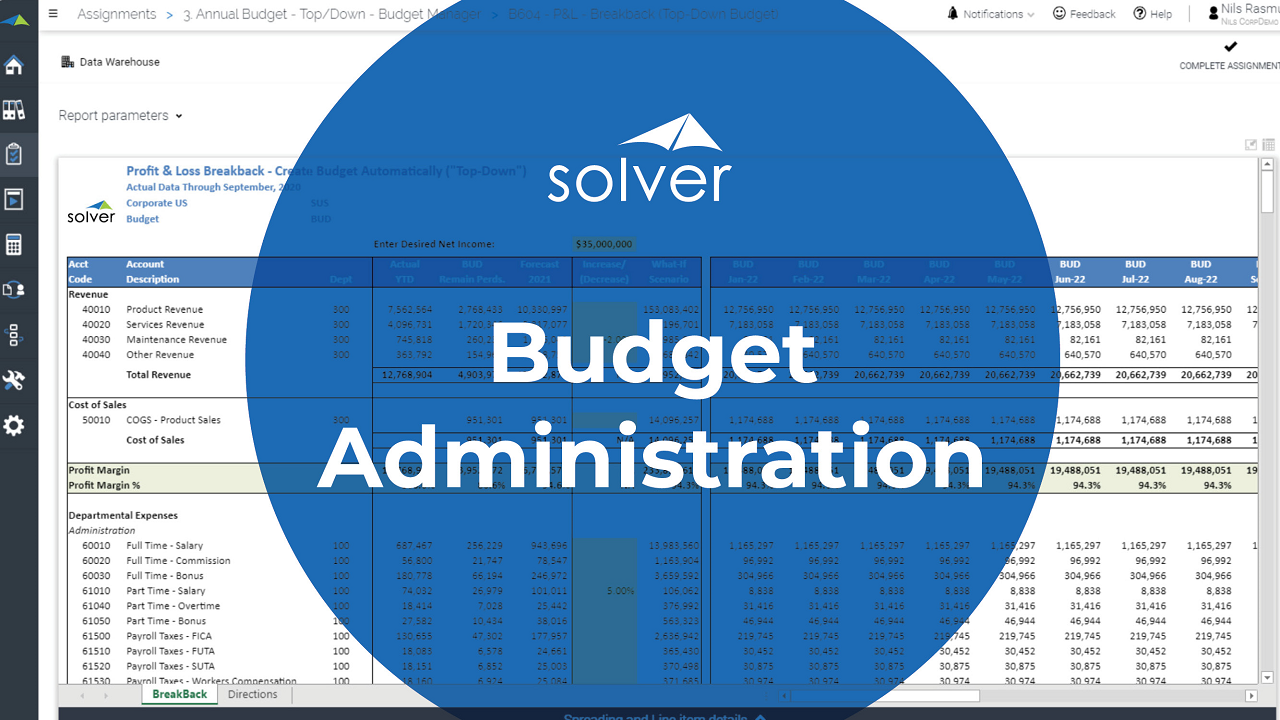
Planning – Budget Admin Overview
Budget administrator overview.
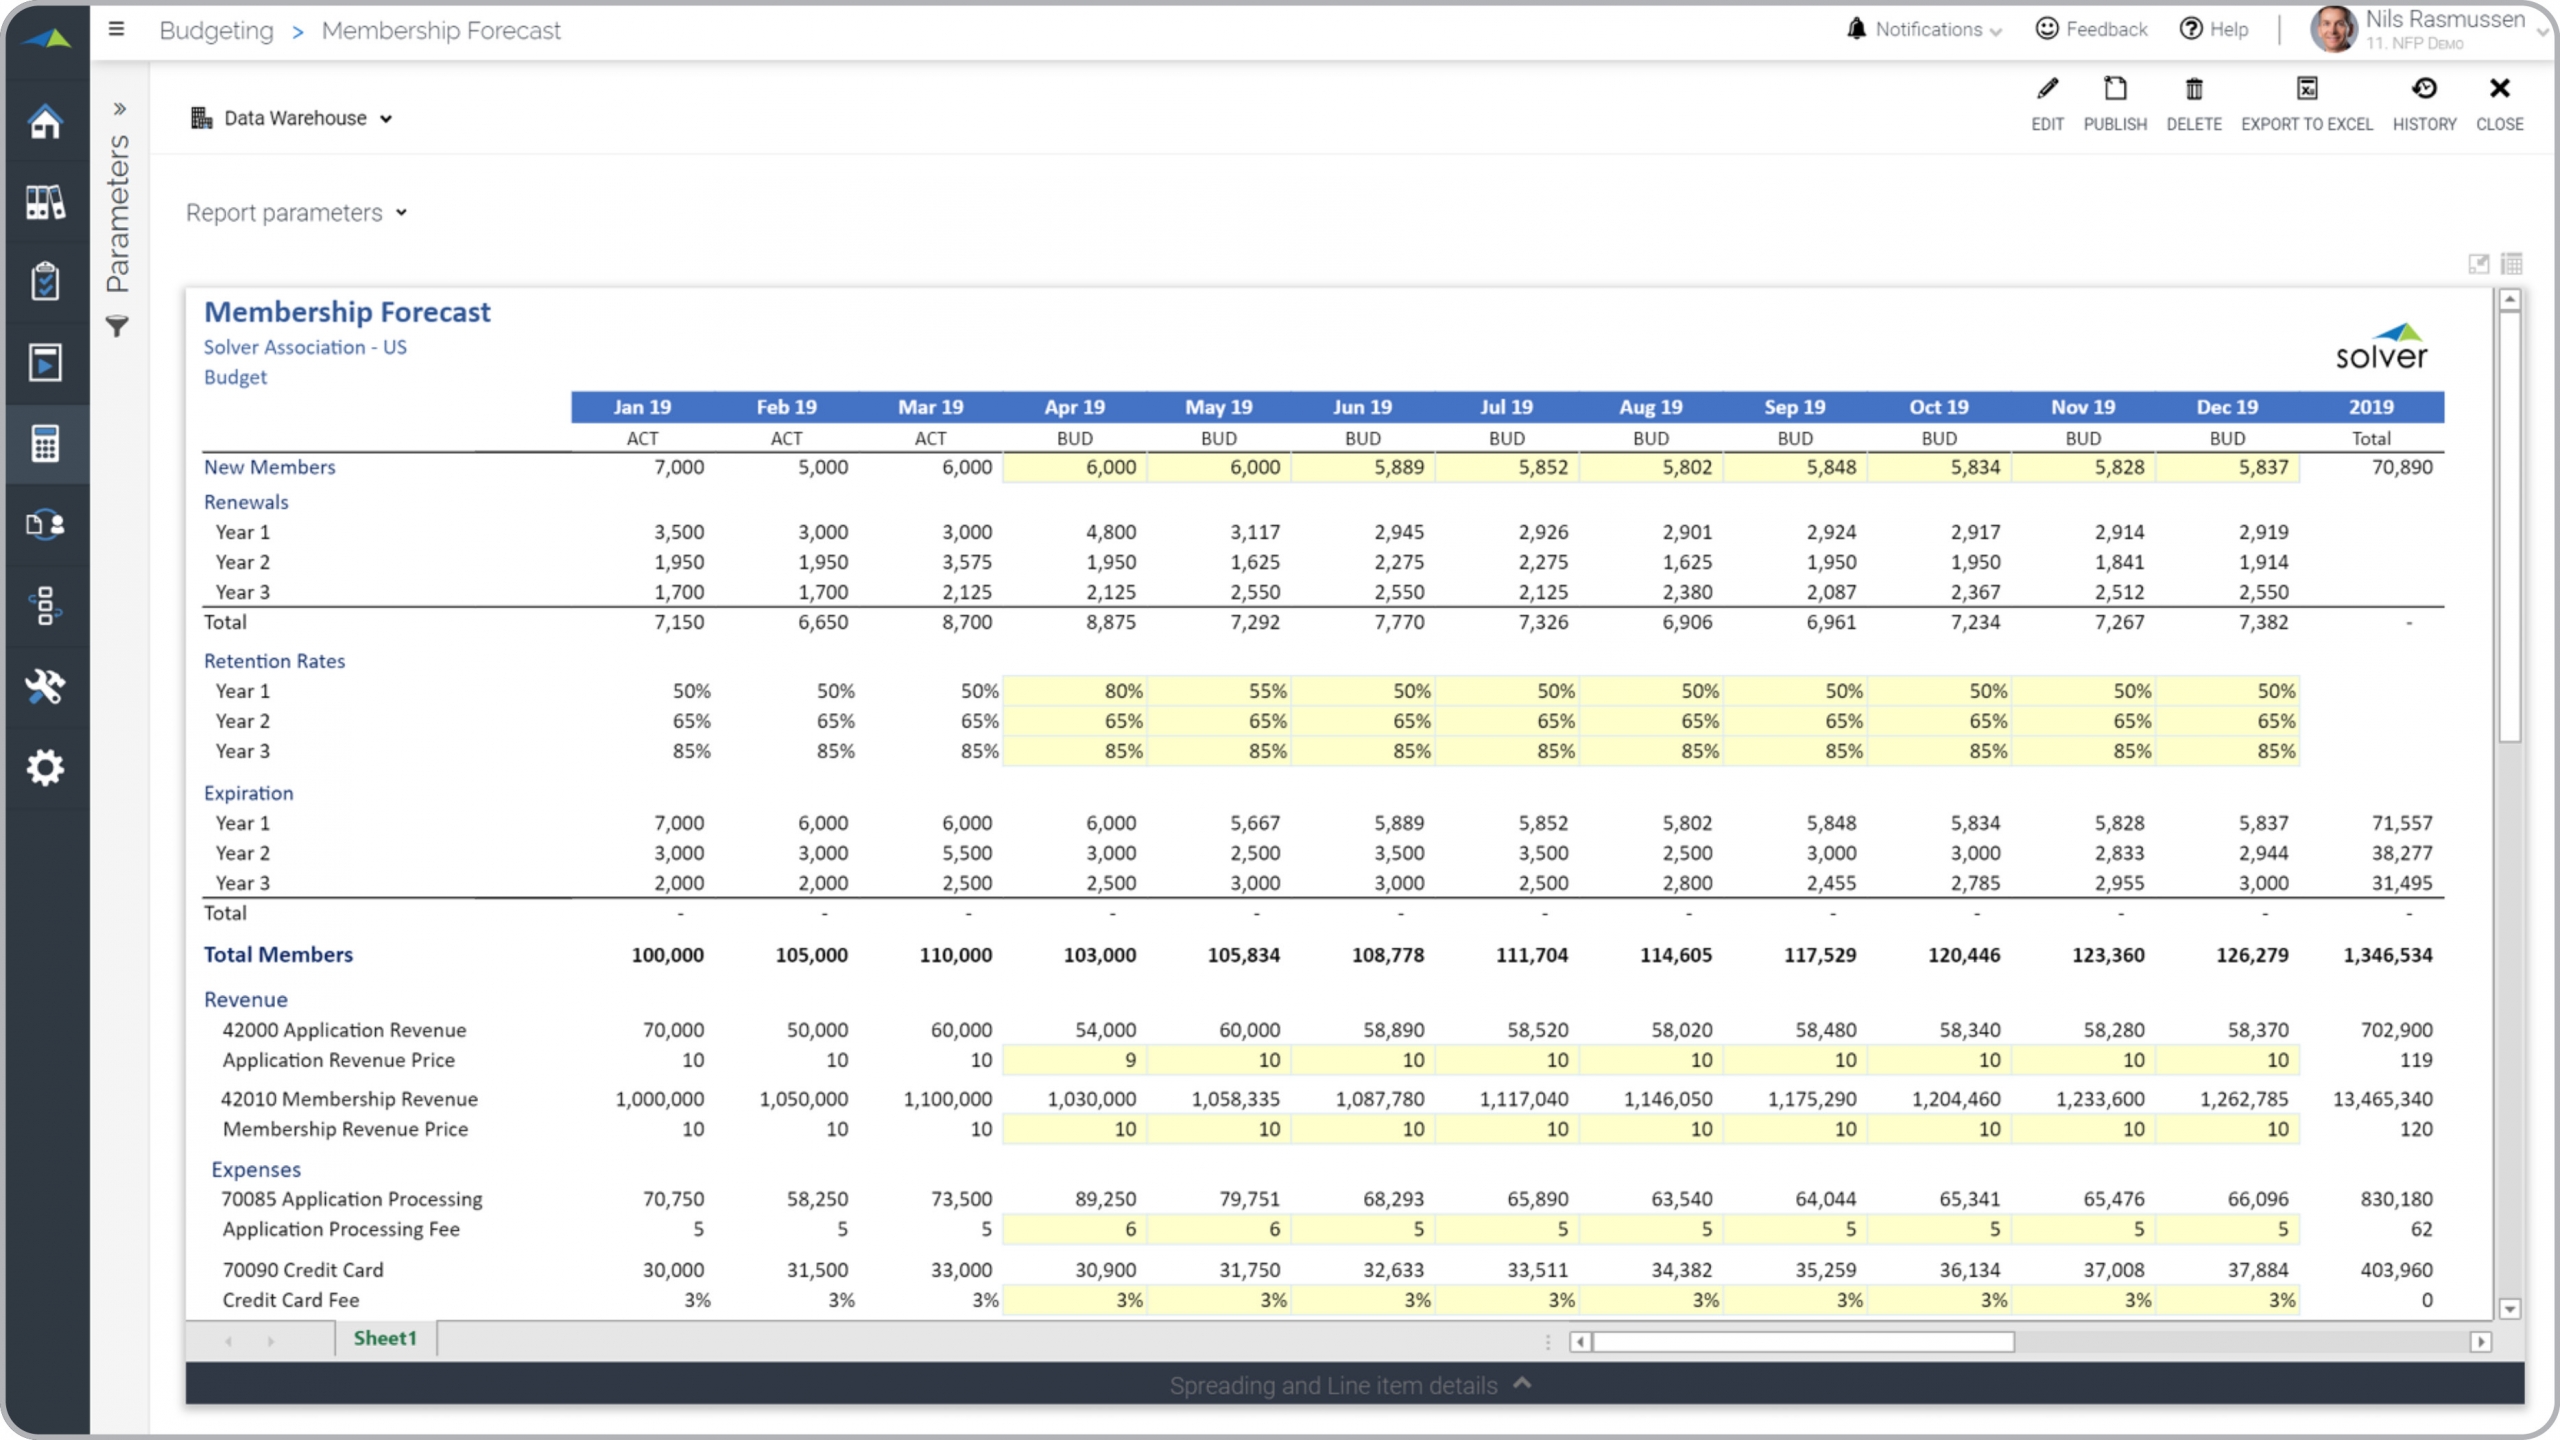
Nonprofit – Membership Forecast
Enter forecasted membership and related metrics for the remaining months of the year.
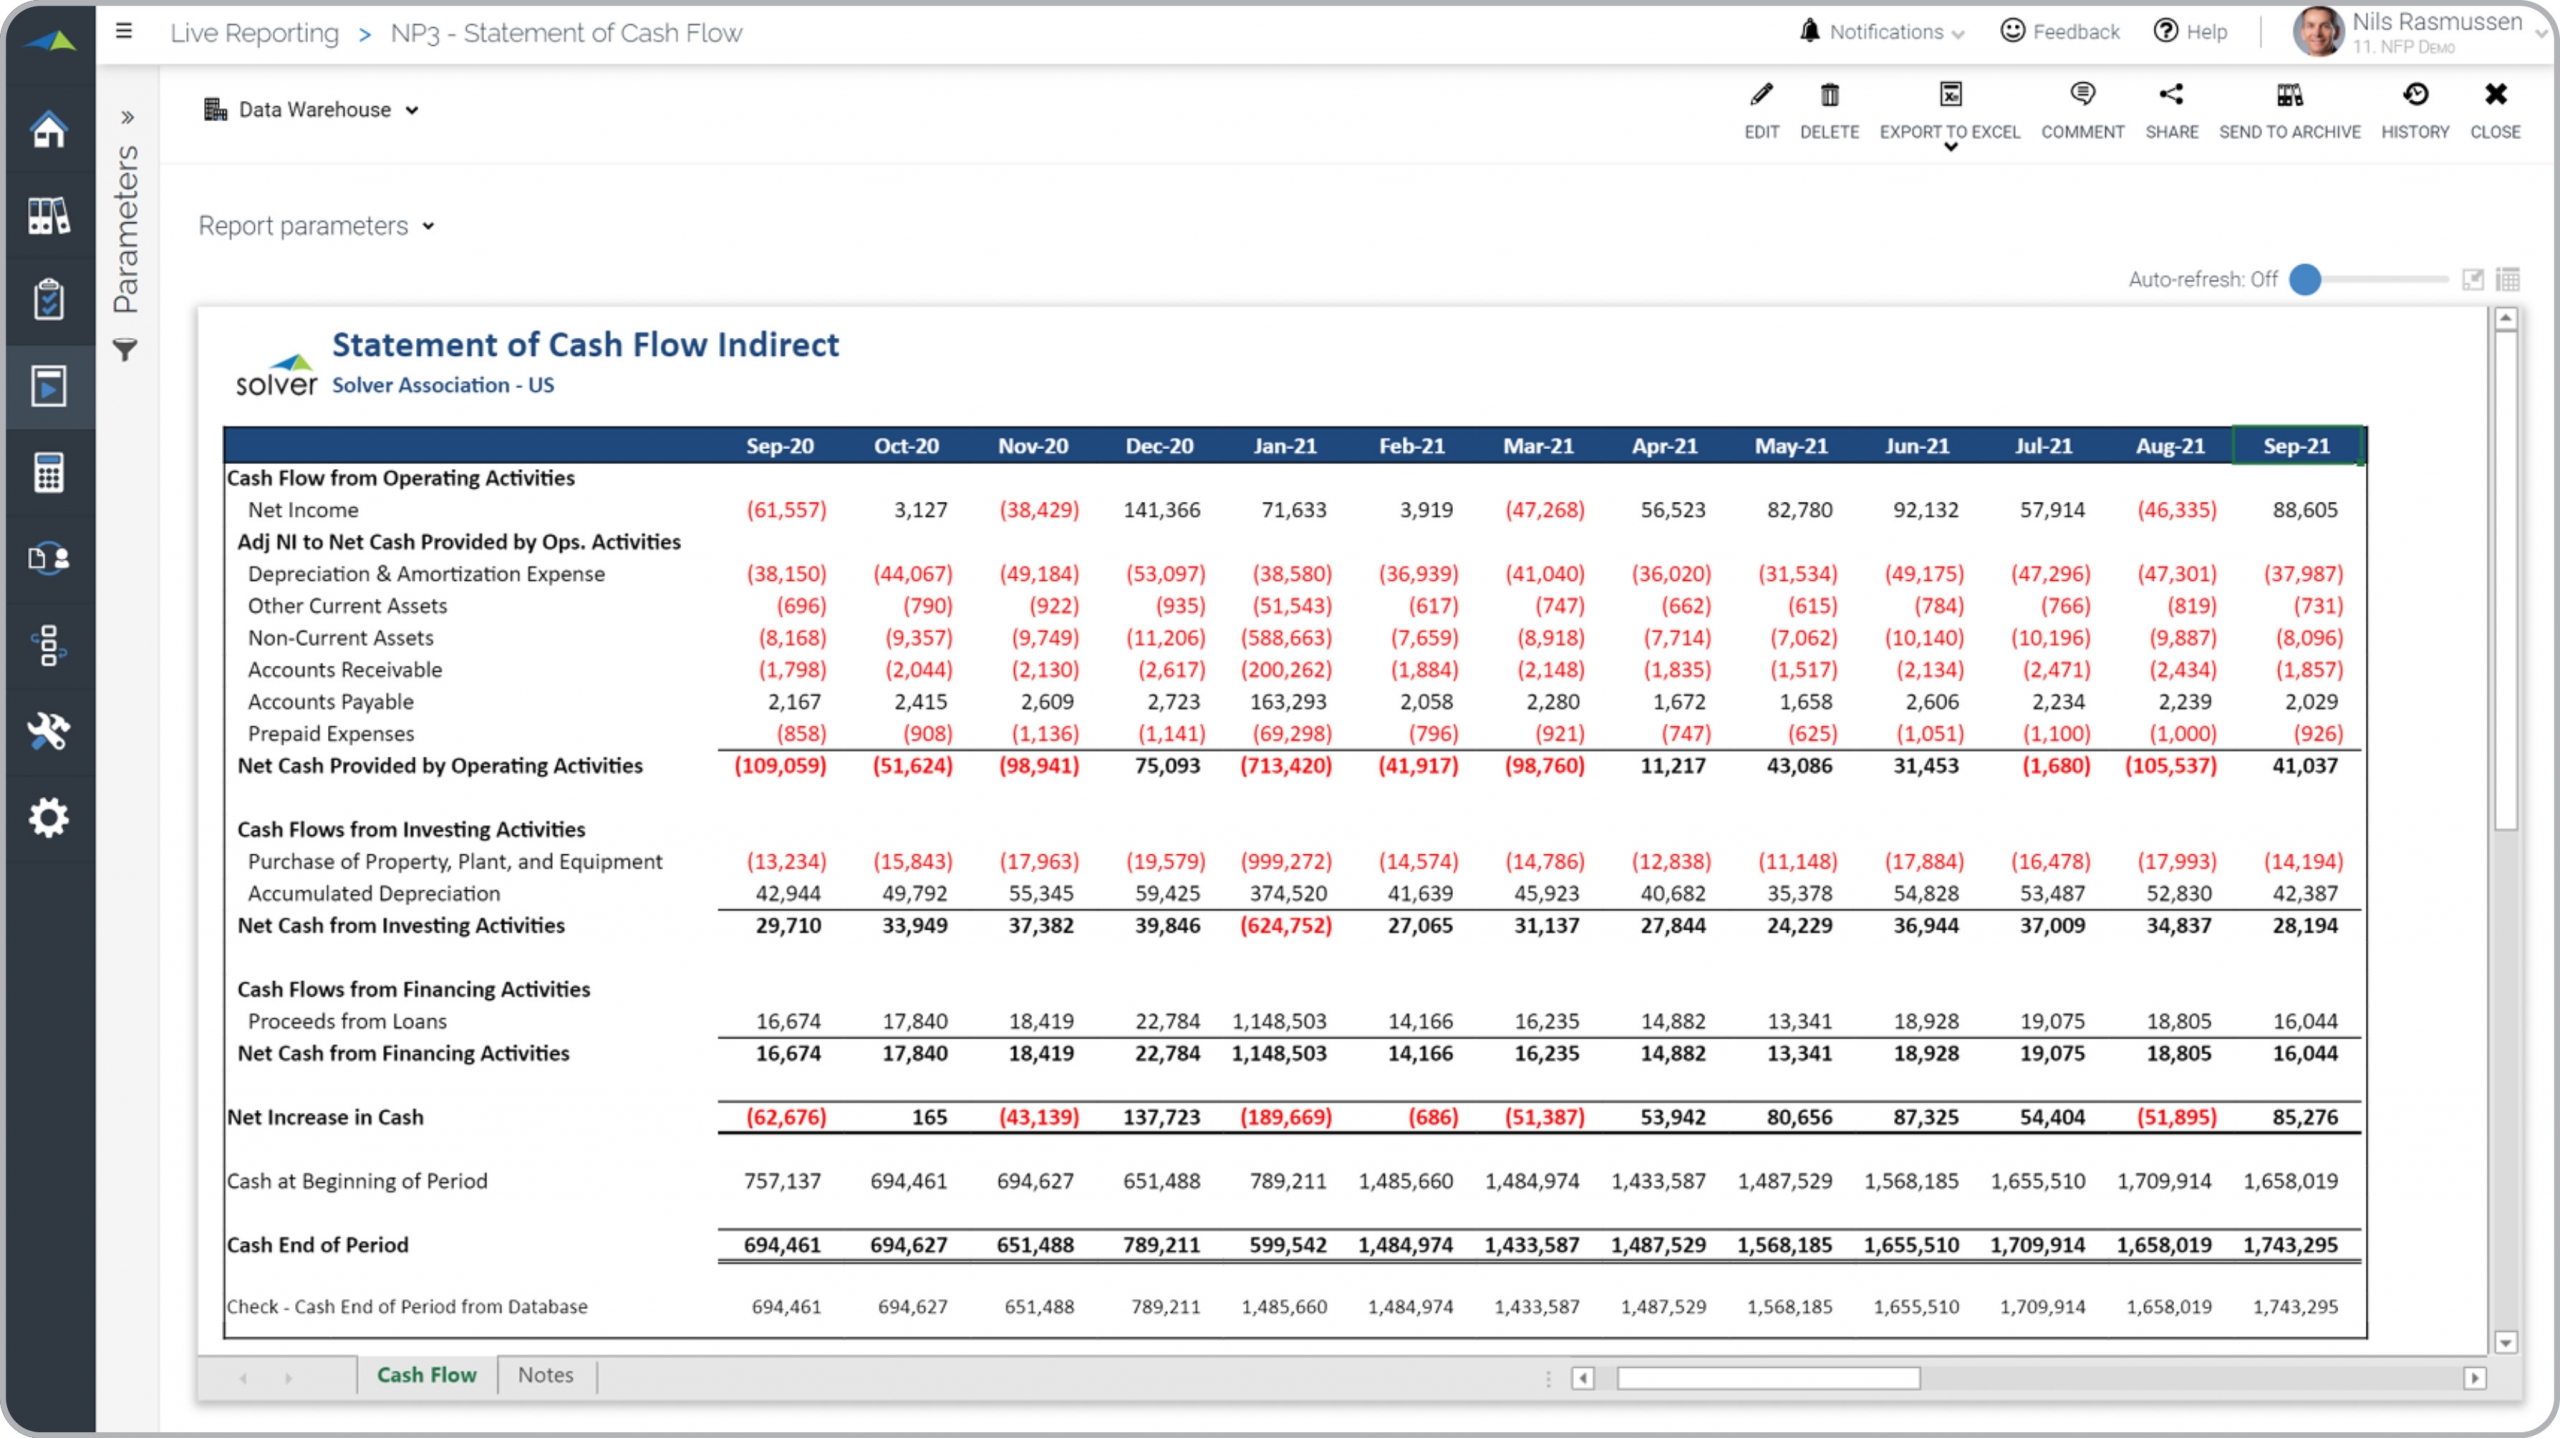
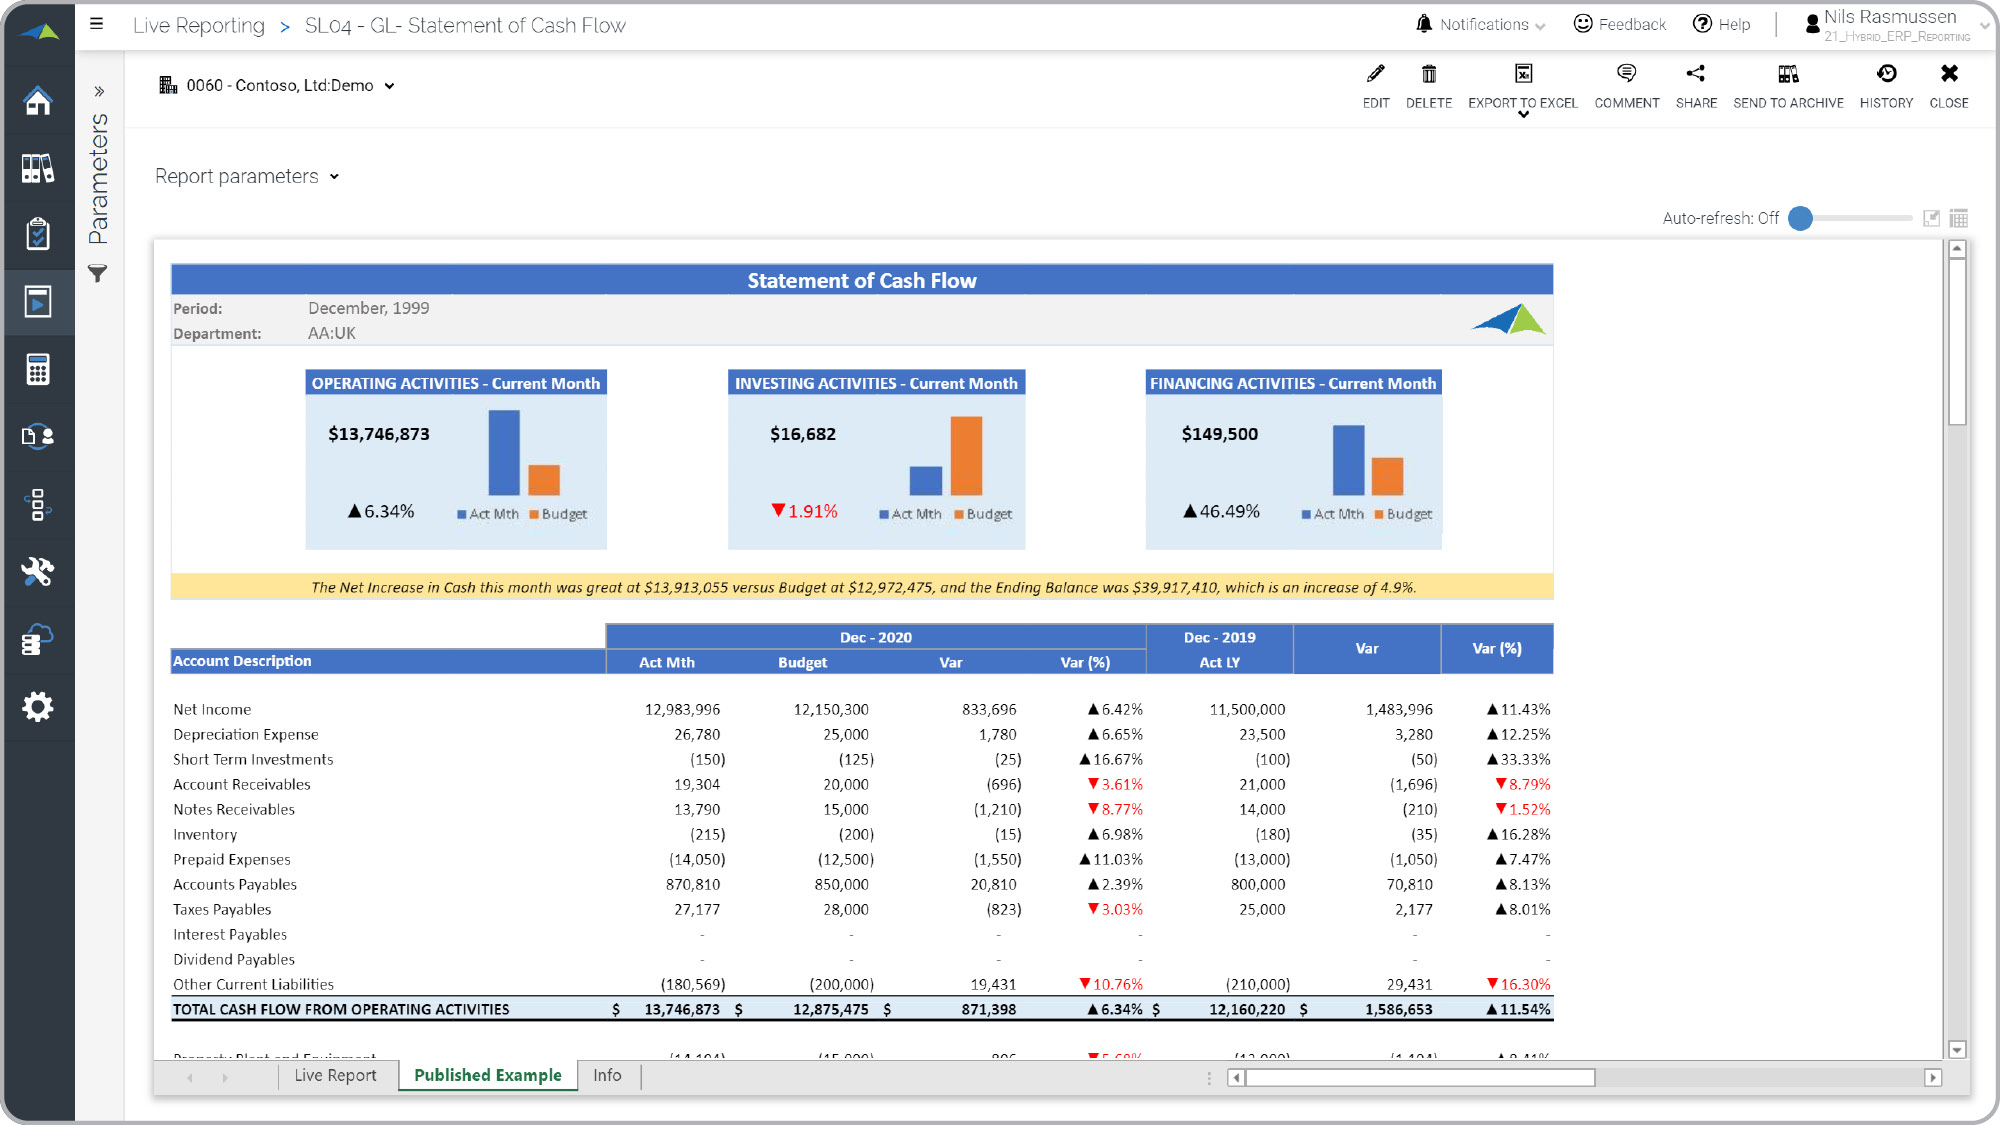
Nonprofit – Statement of Cash Flow
Detailed, rolling 13 month financial statement with cash inflows and outflows.
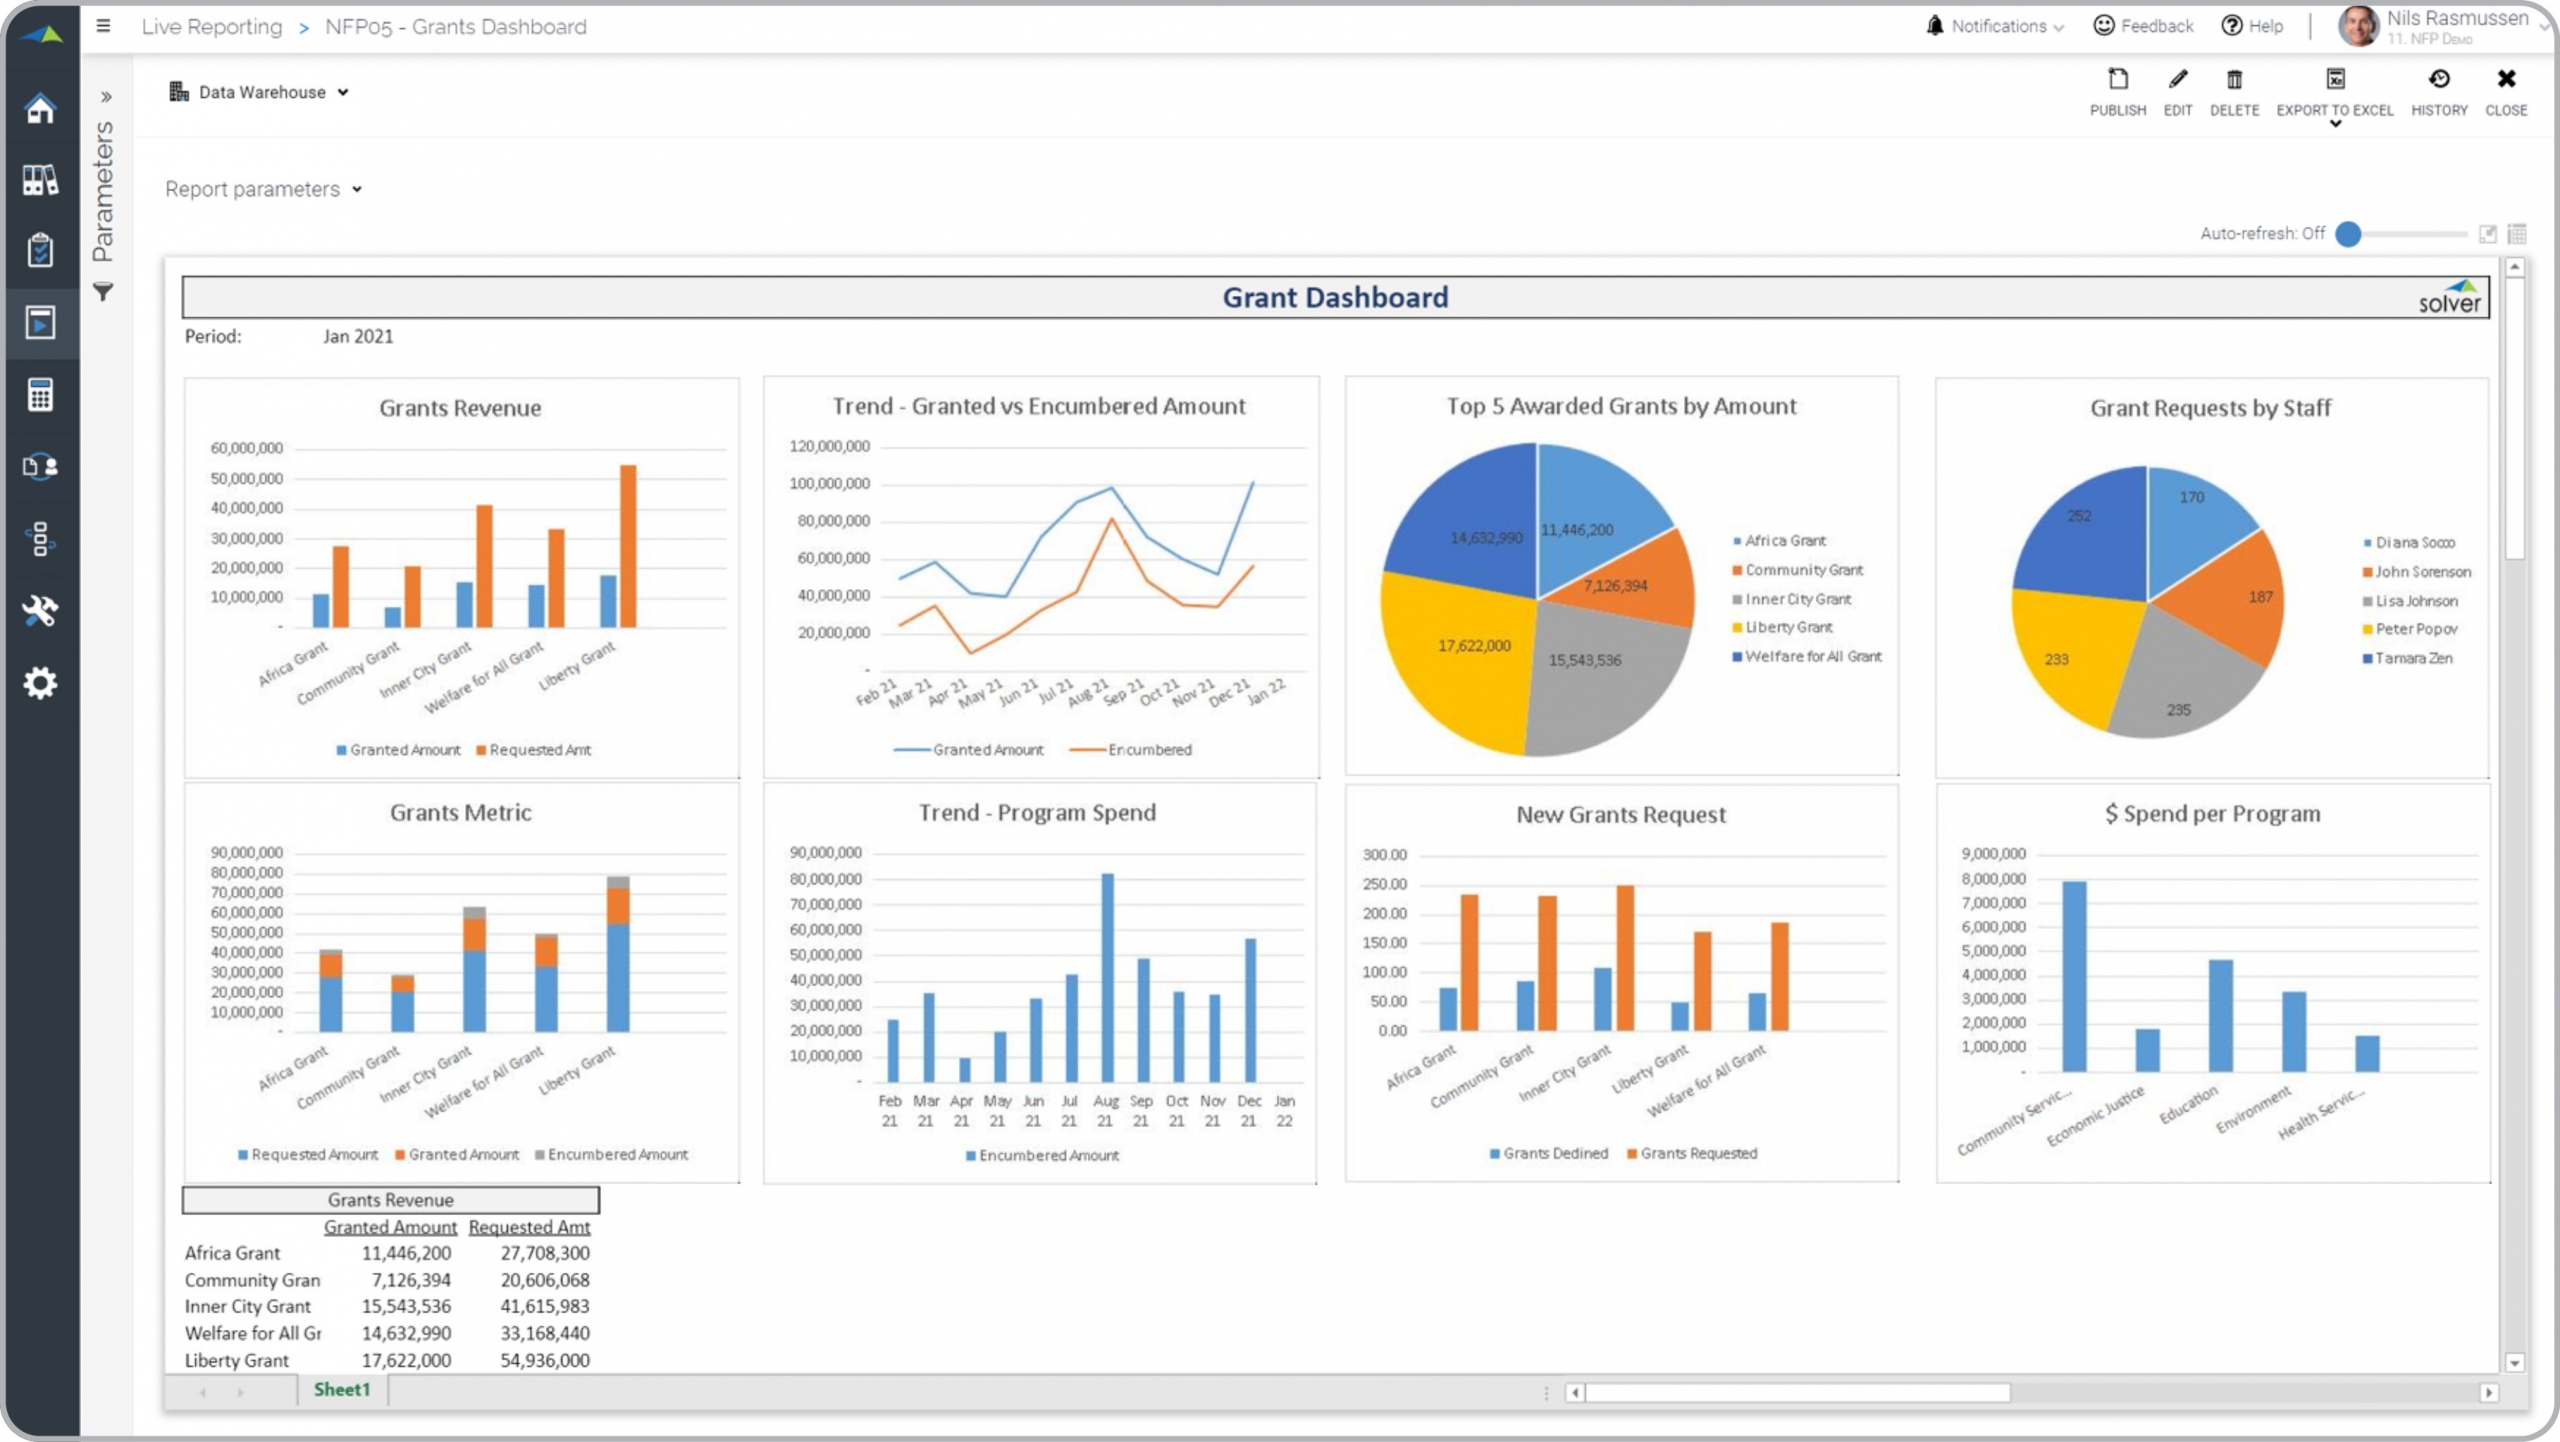
Nonprofit – Grant Dashboard
Analyze key metrics like grant revenue, encumbered and requested amounts, program spend.
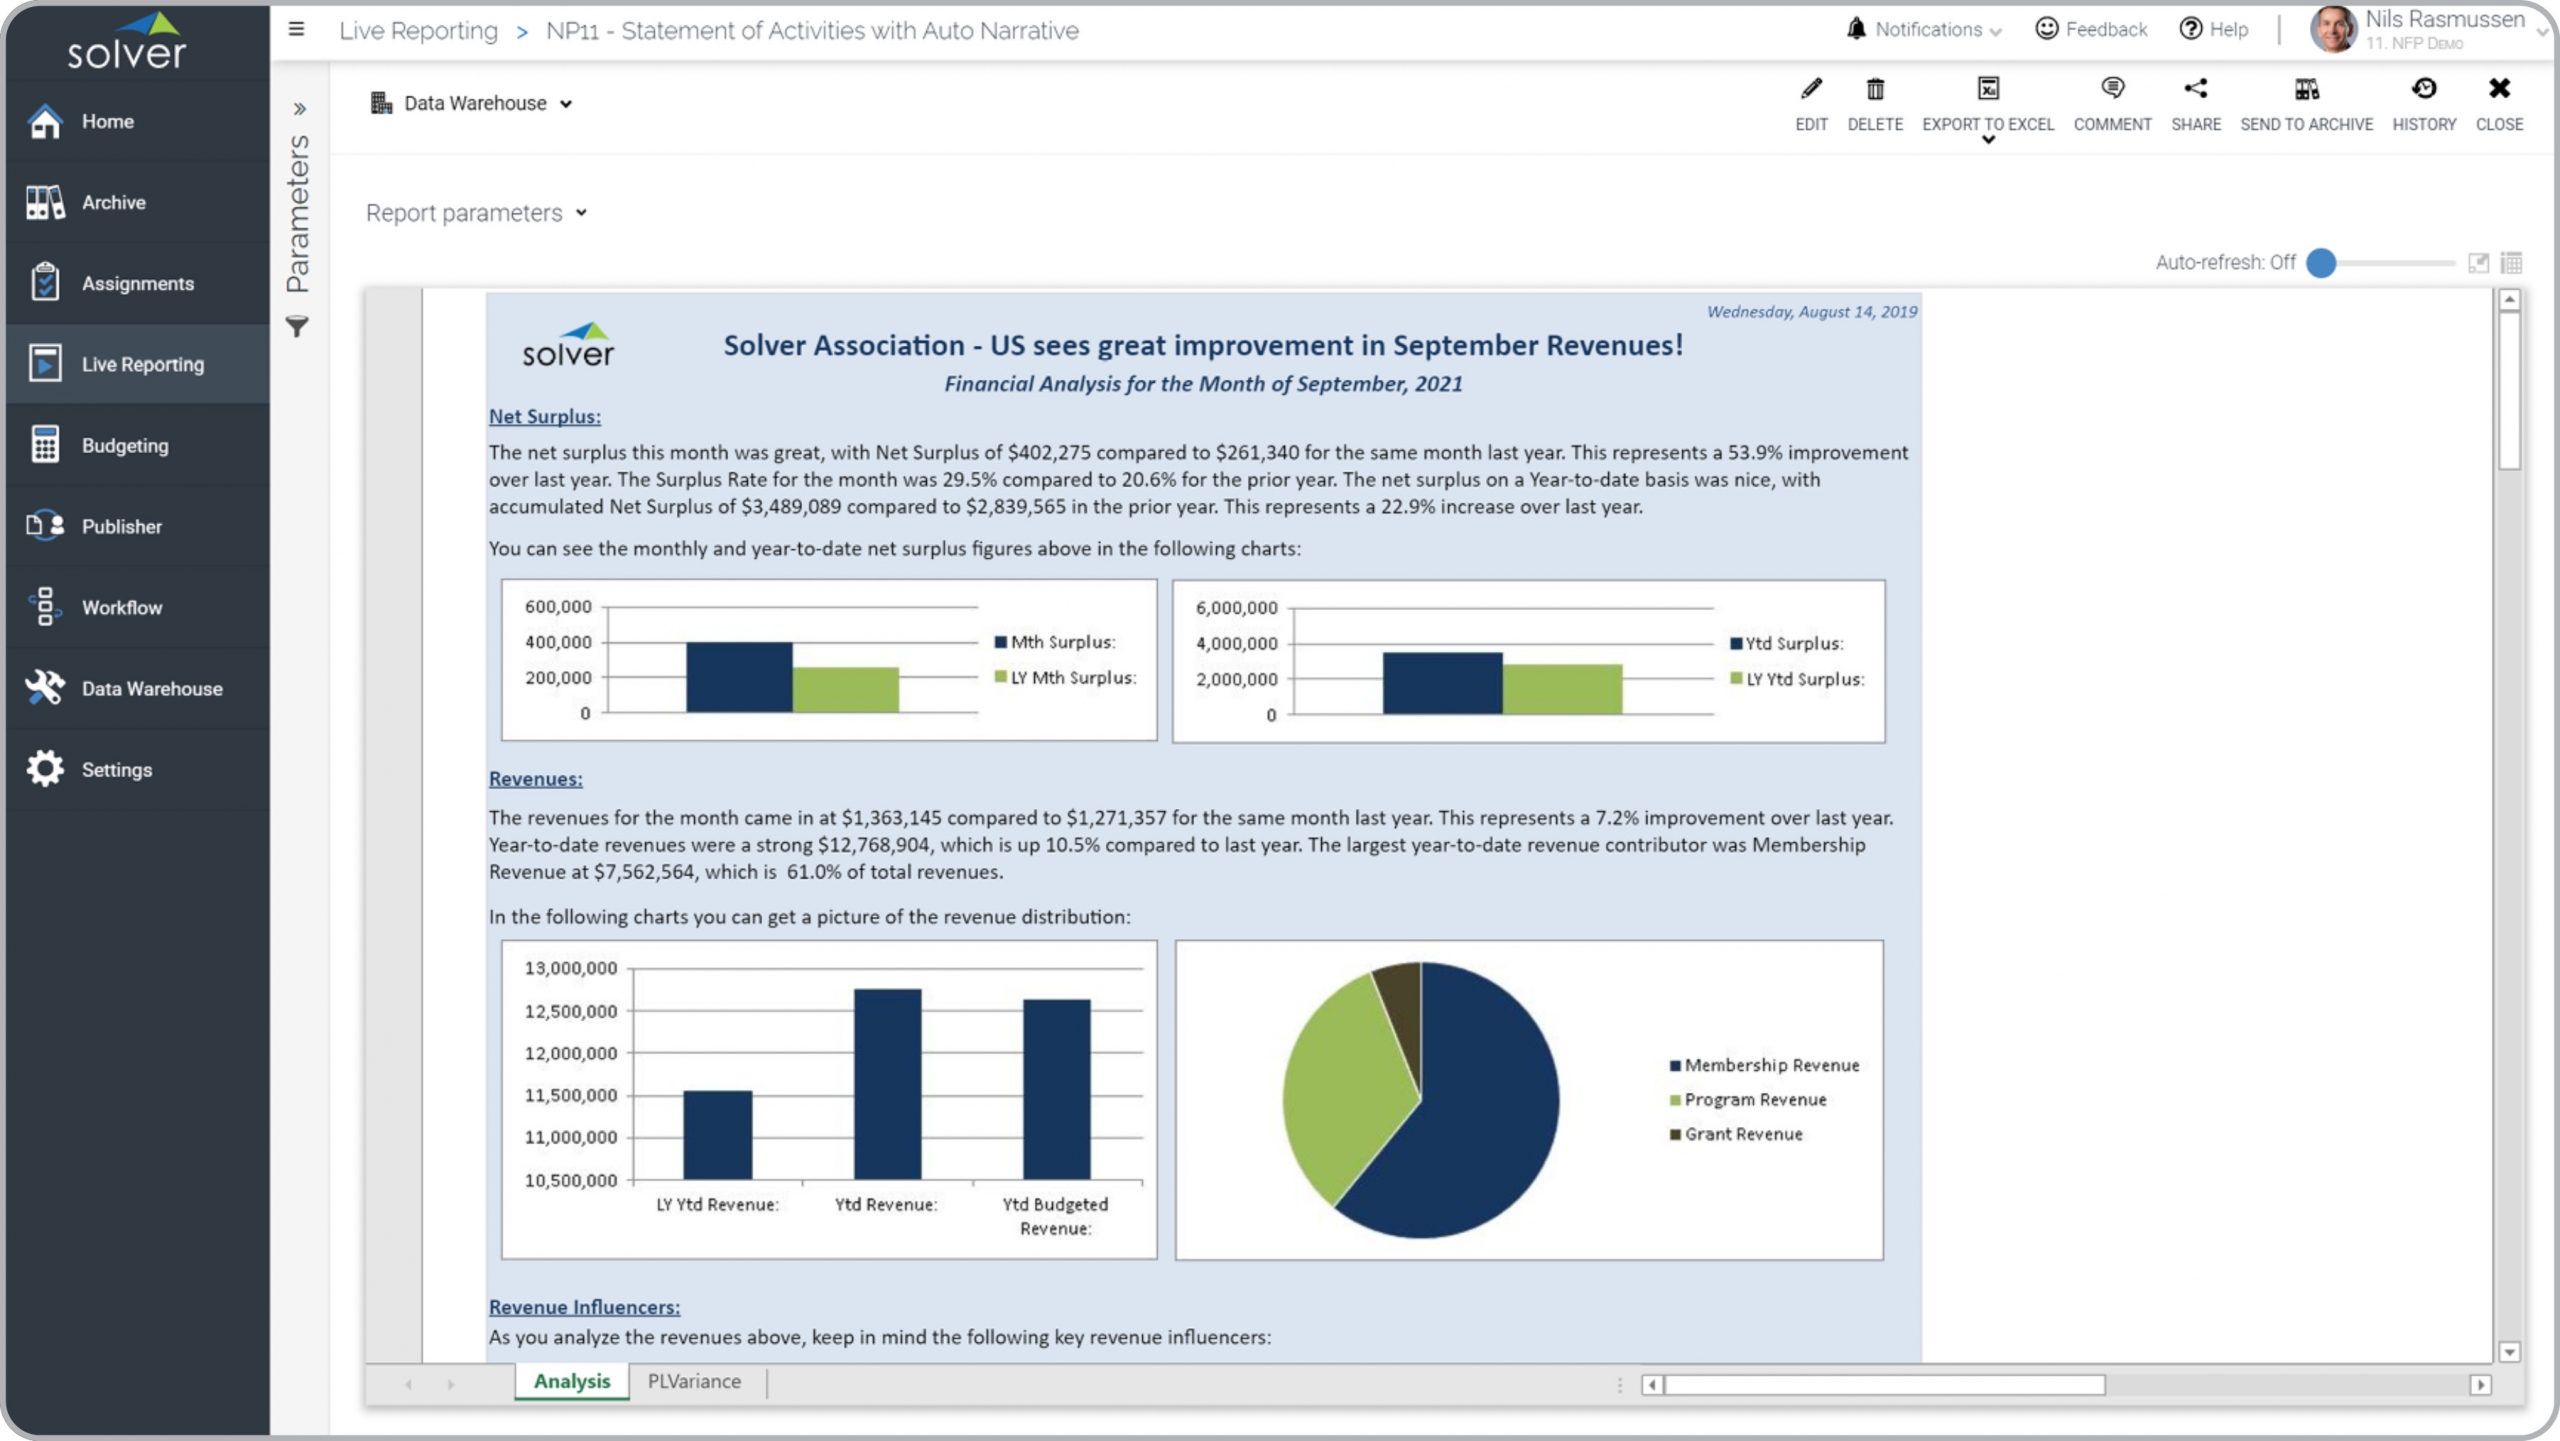
Nonprofit – Statement of Activities with Narrative
Detailed financial statement (on tab 2) with automatically narrated cover page (seen here).
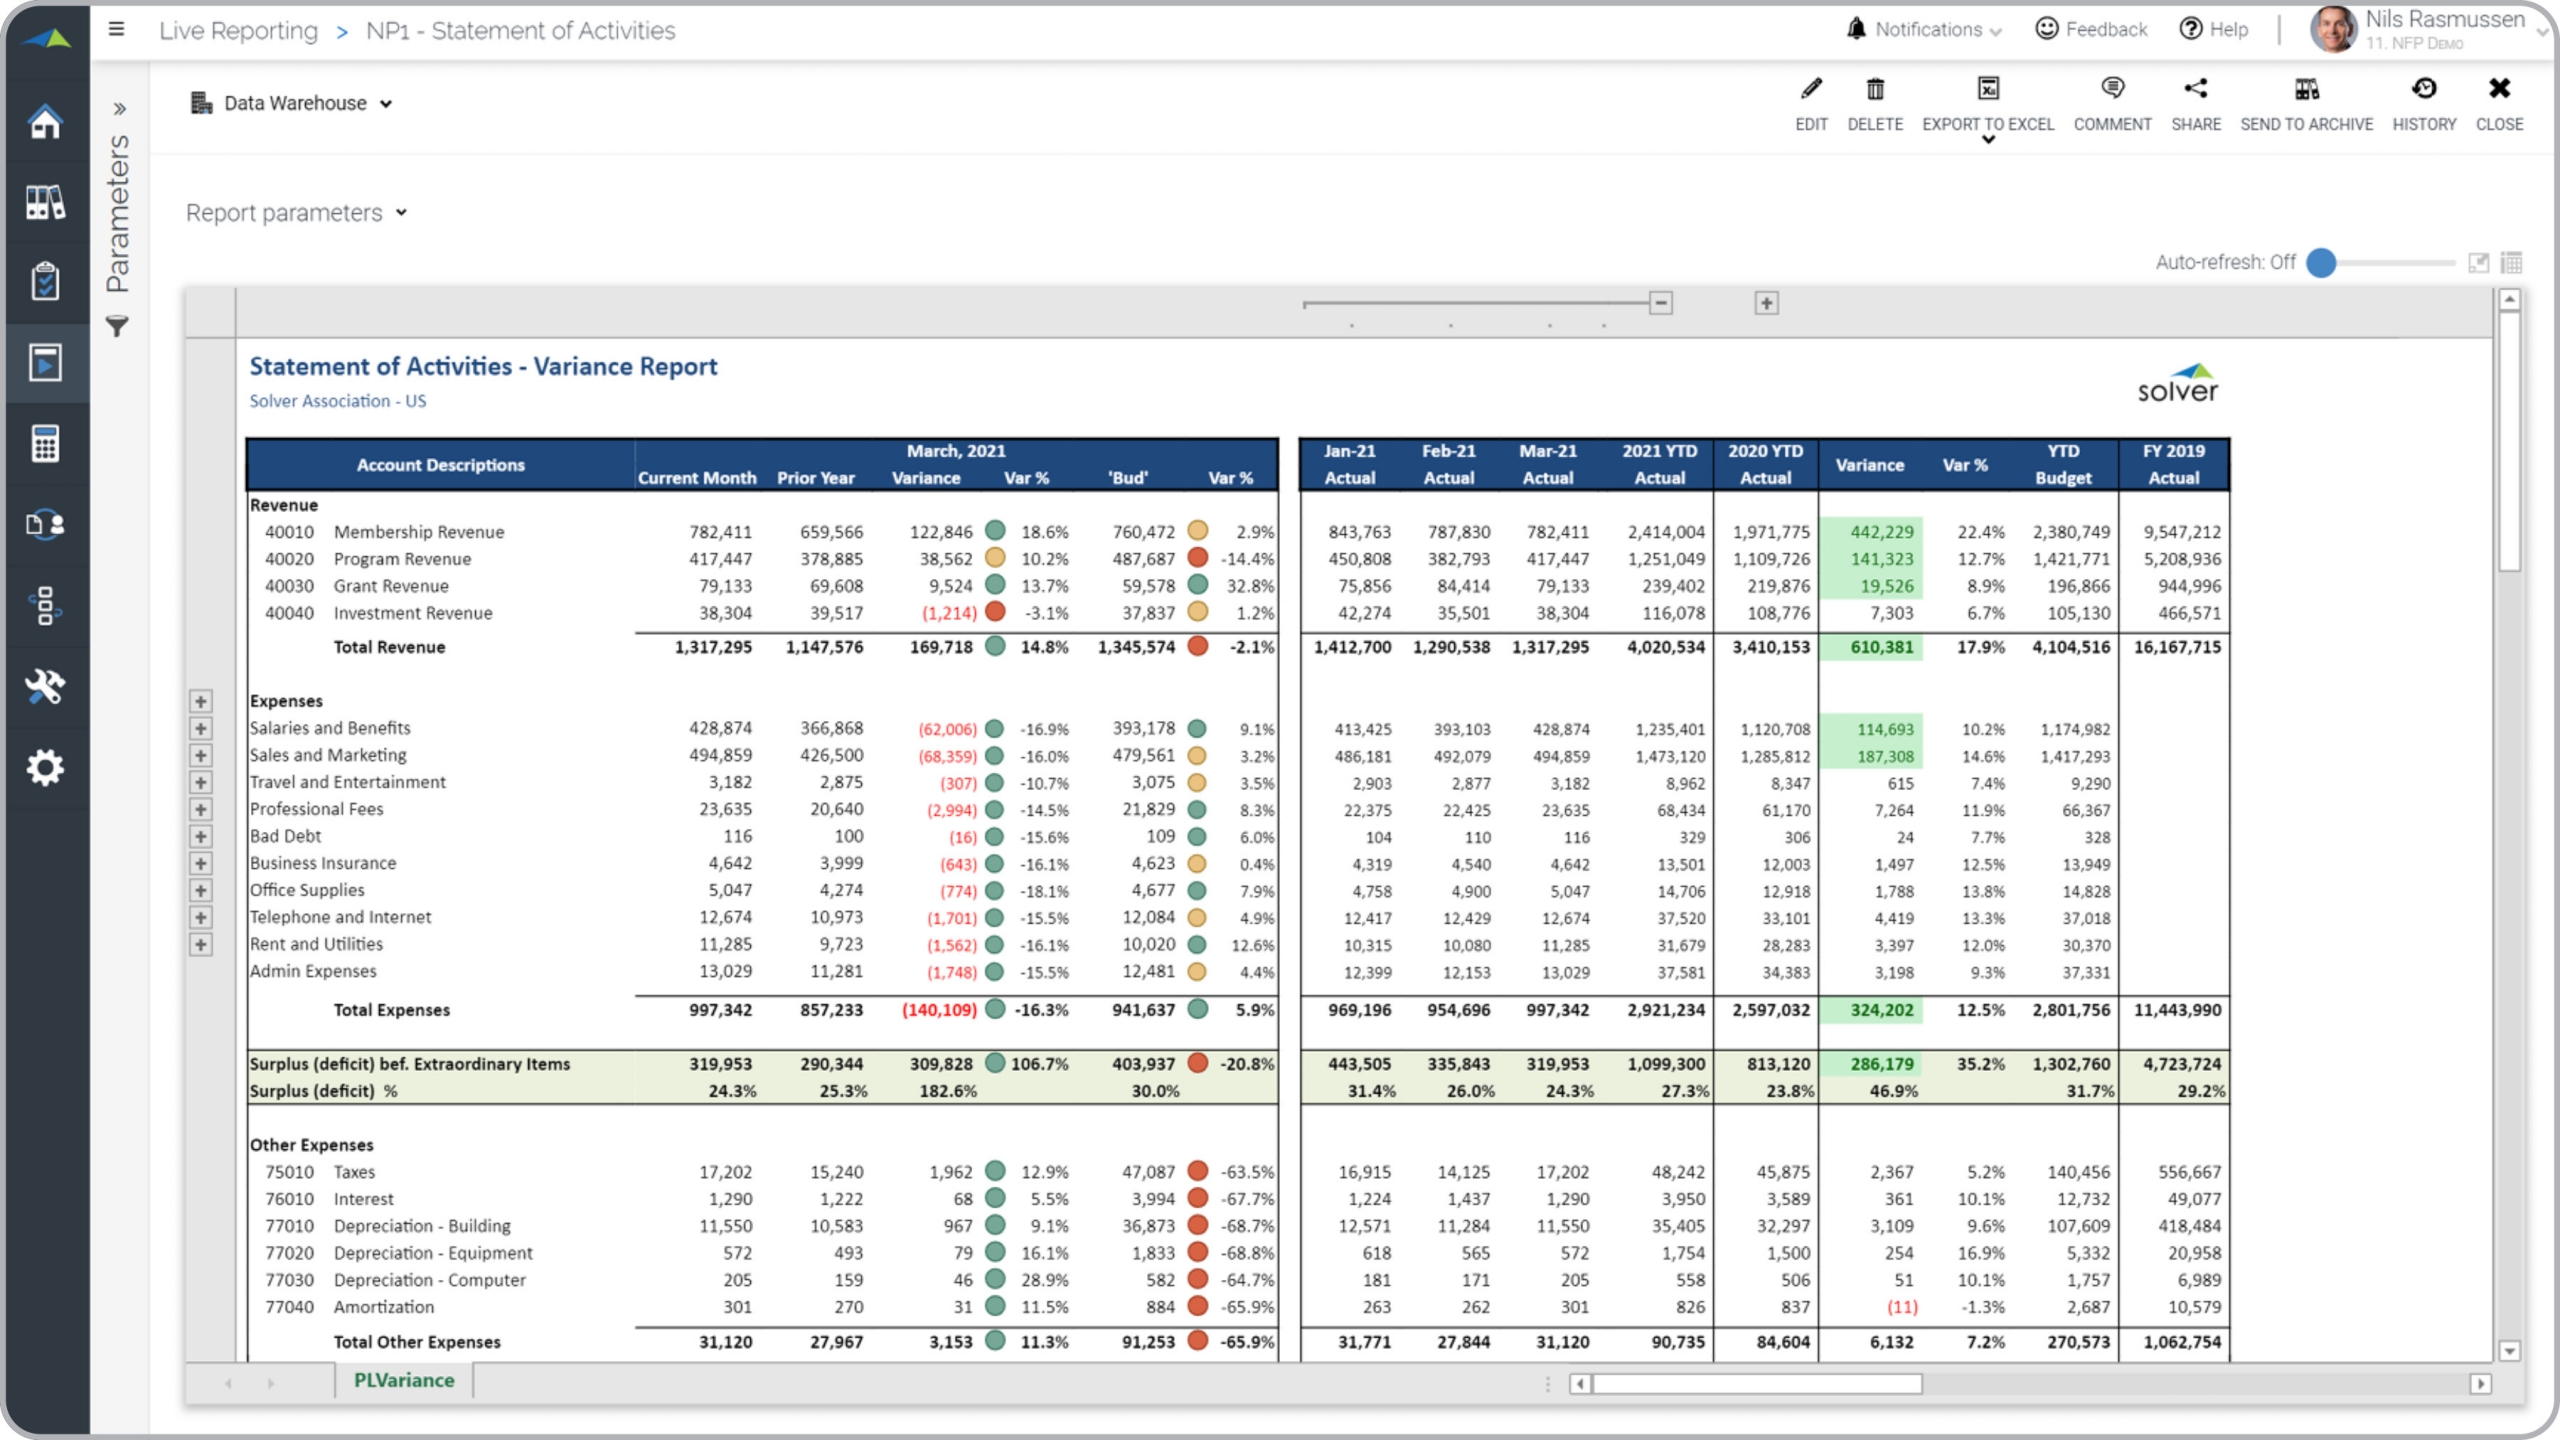
Nonprofit – Statement of Activities
Detailed financial statement with actual, budget and variances for revenues and expenses.
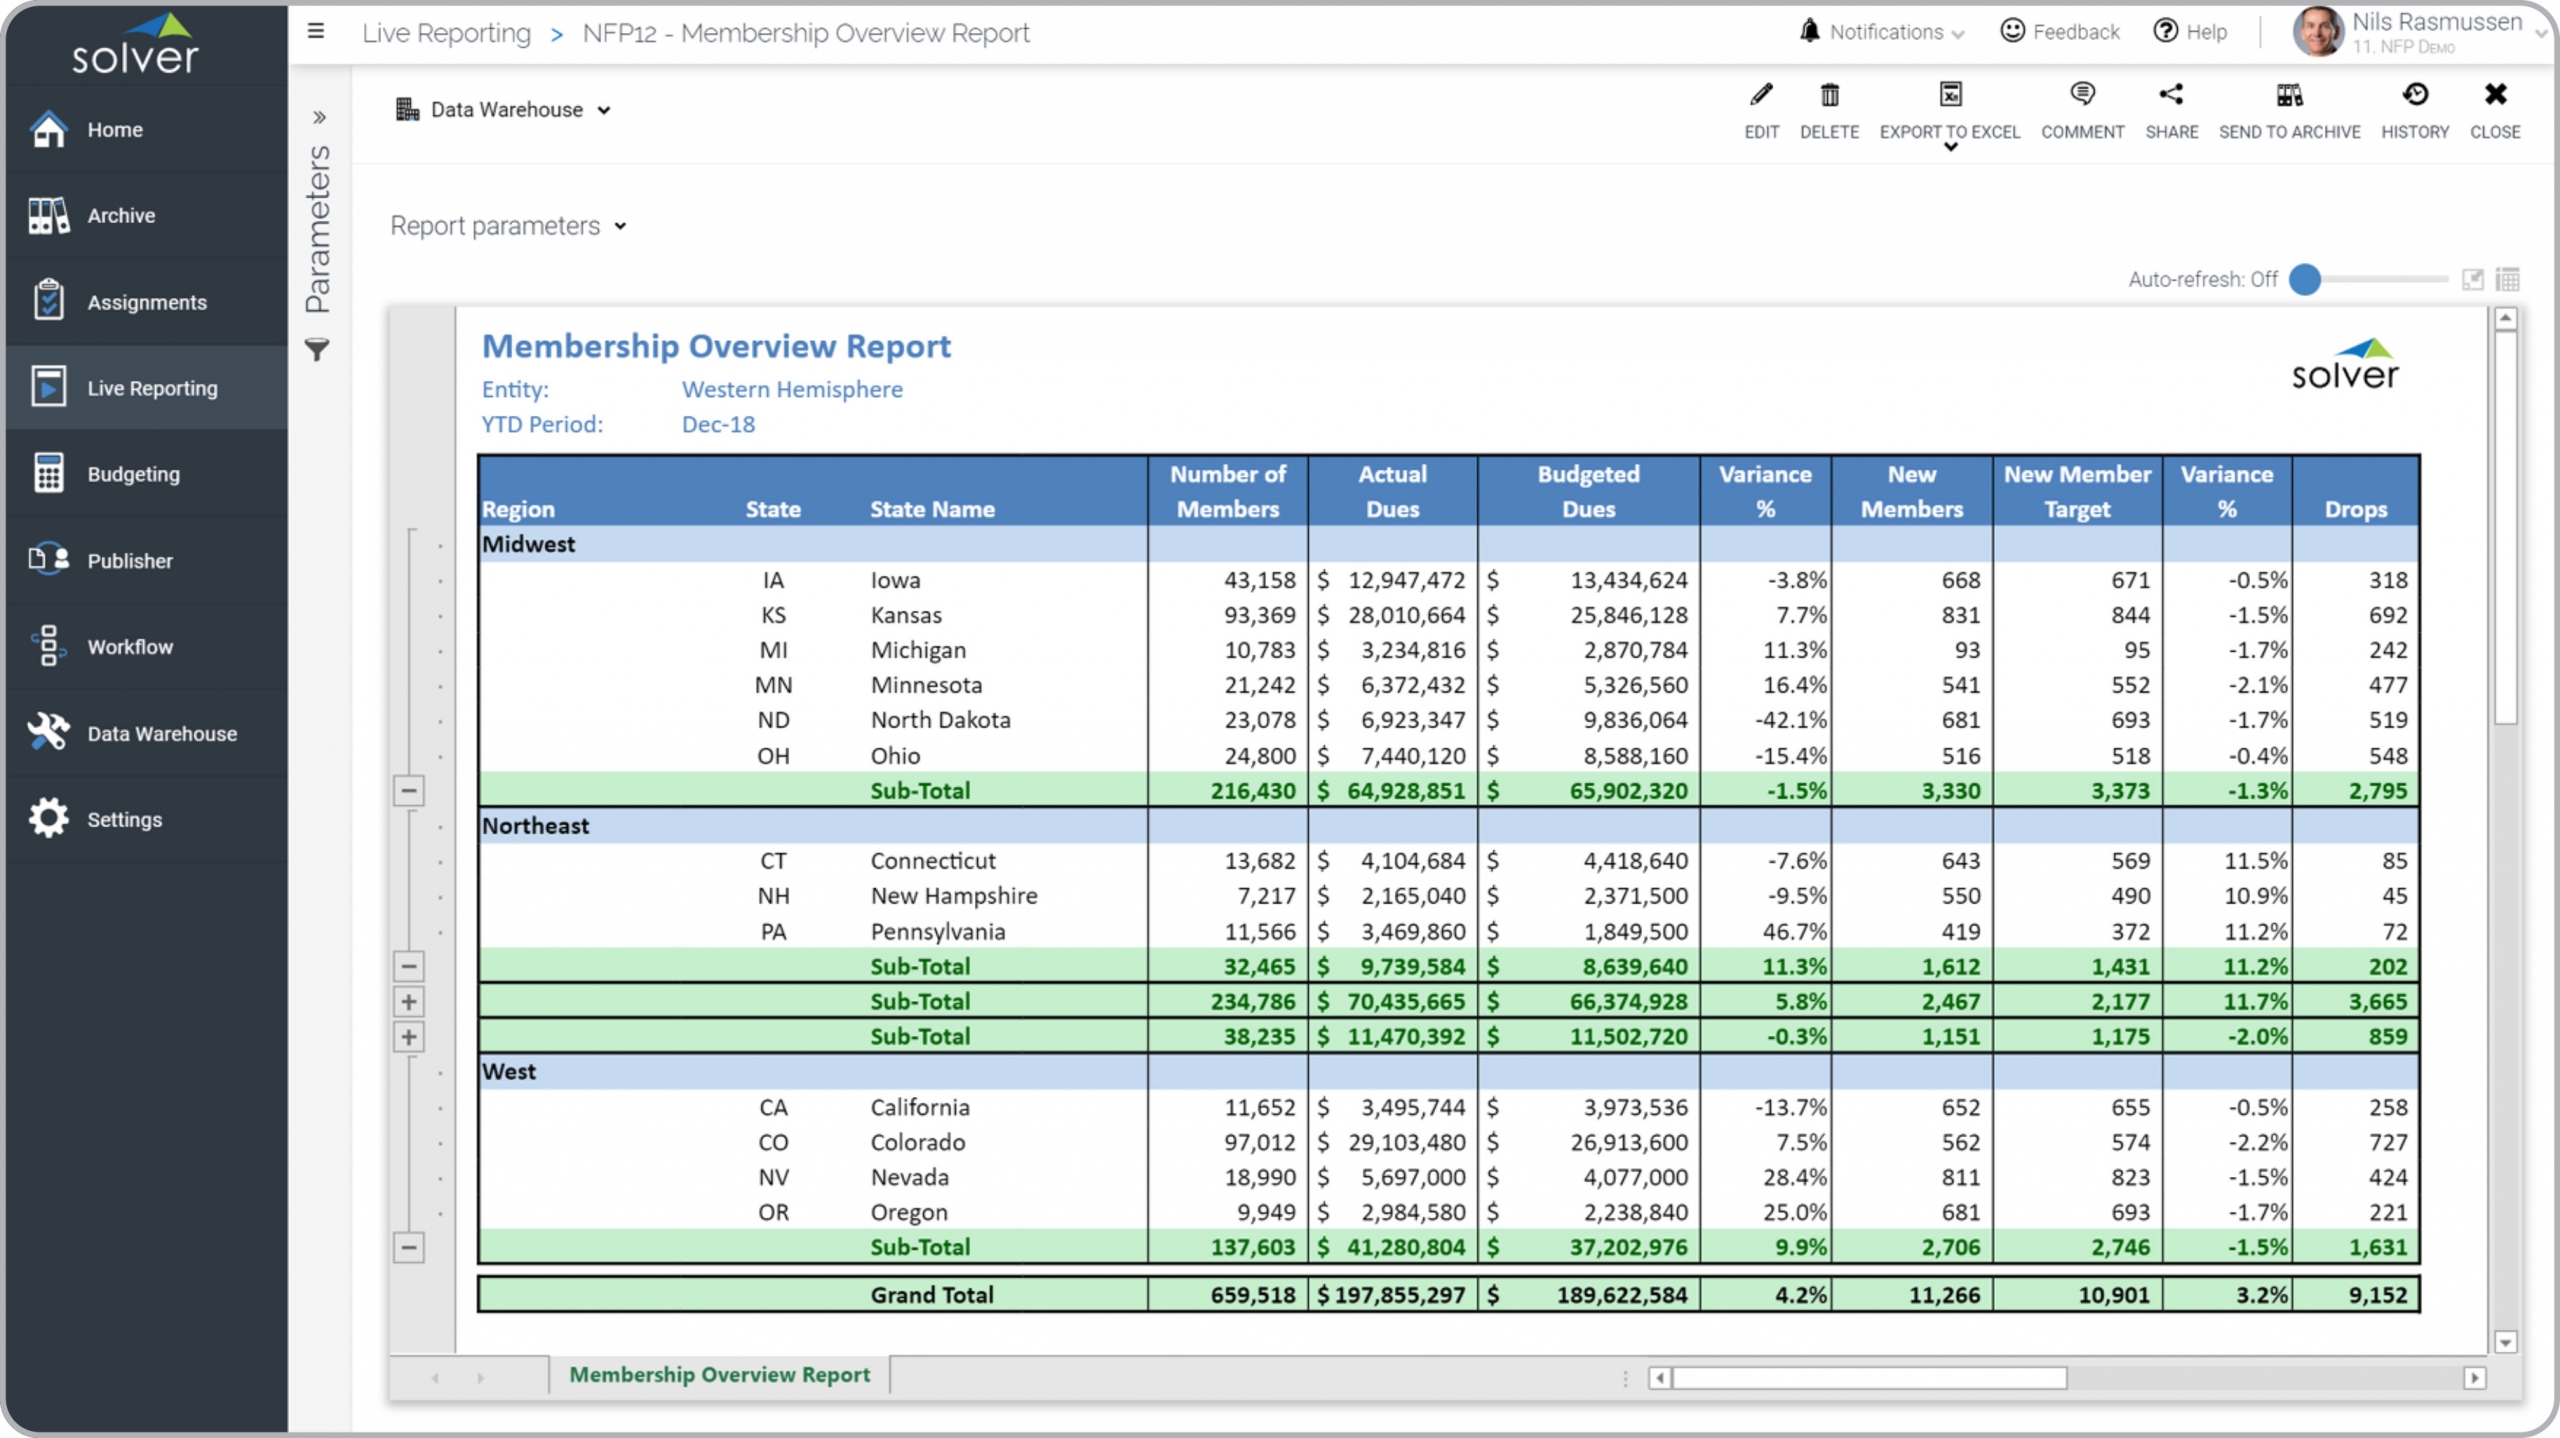
Nonprofit – Membership Overview
Analyze members, actual and budgeted dues, drops and variances.
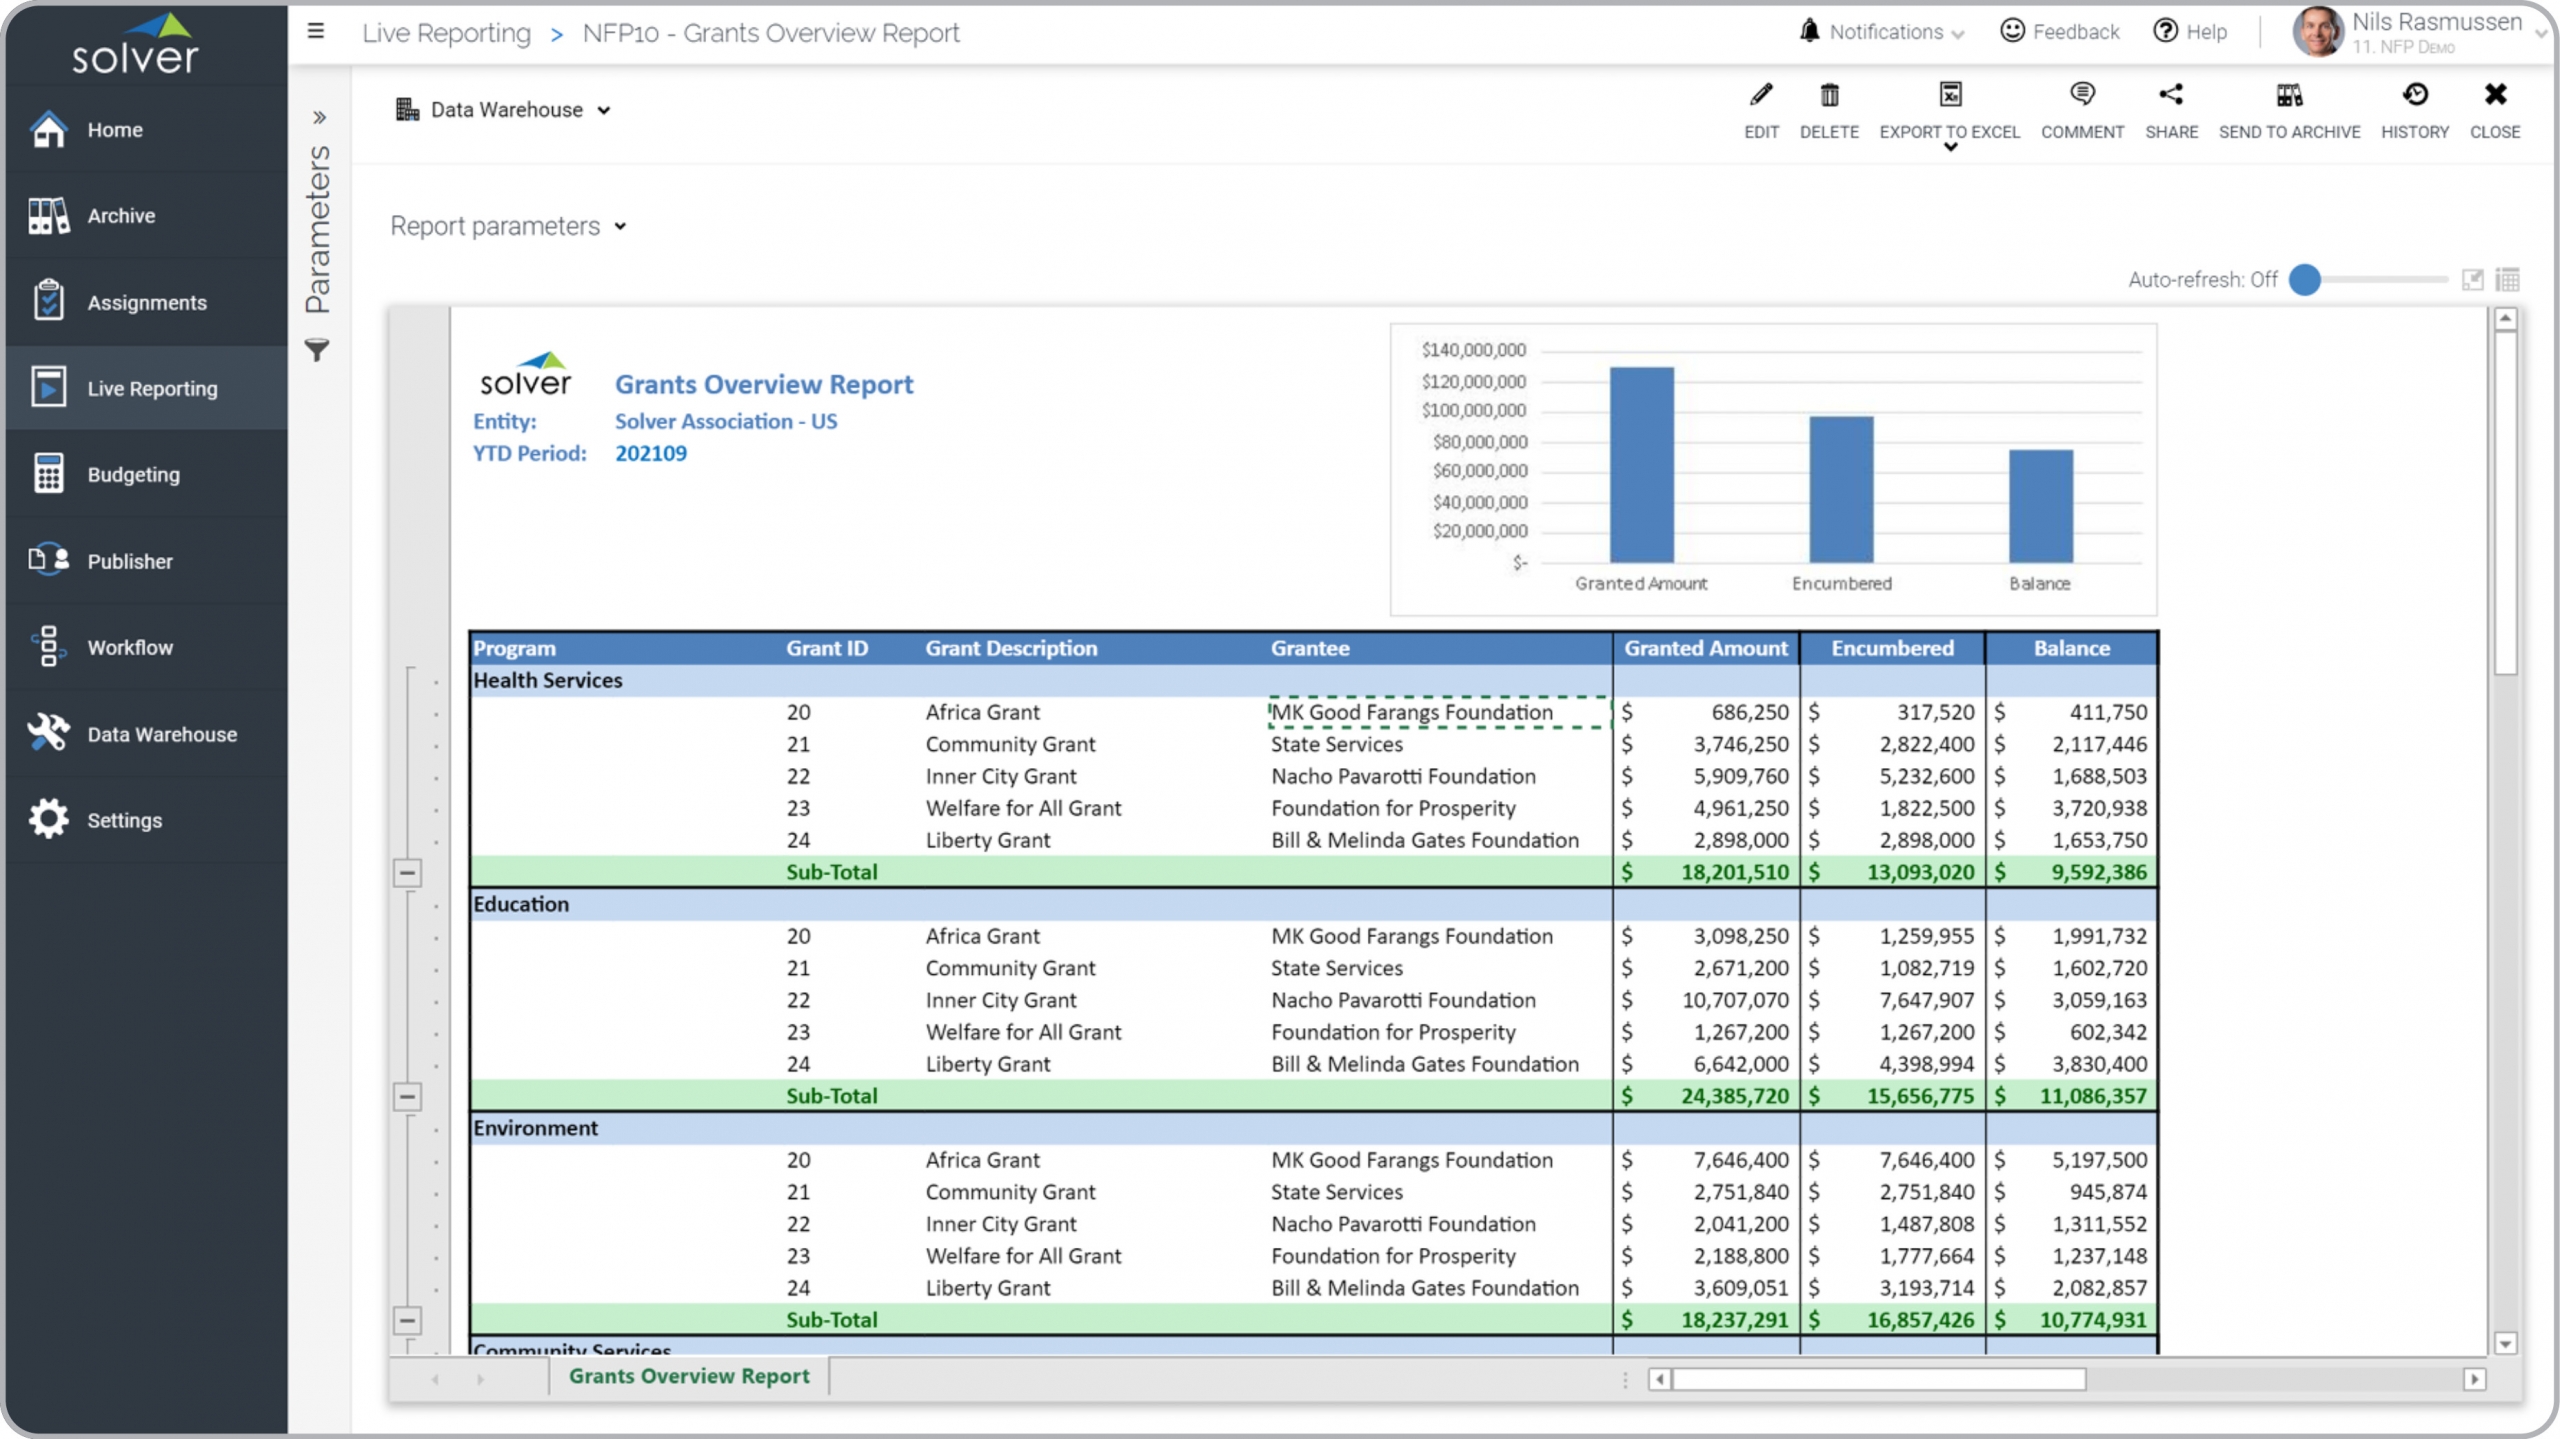
Nonprofit – Grants Overview
Shows granted, encumbered and balance amounts per program, grant and grantee.
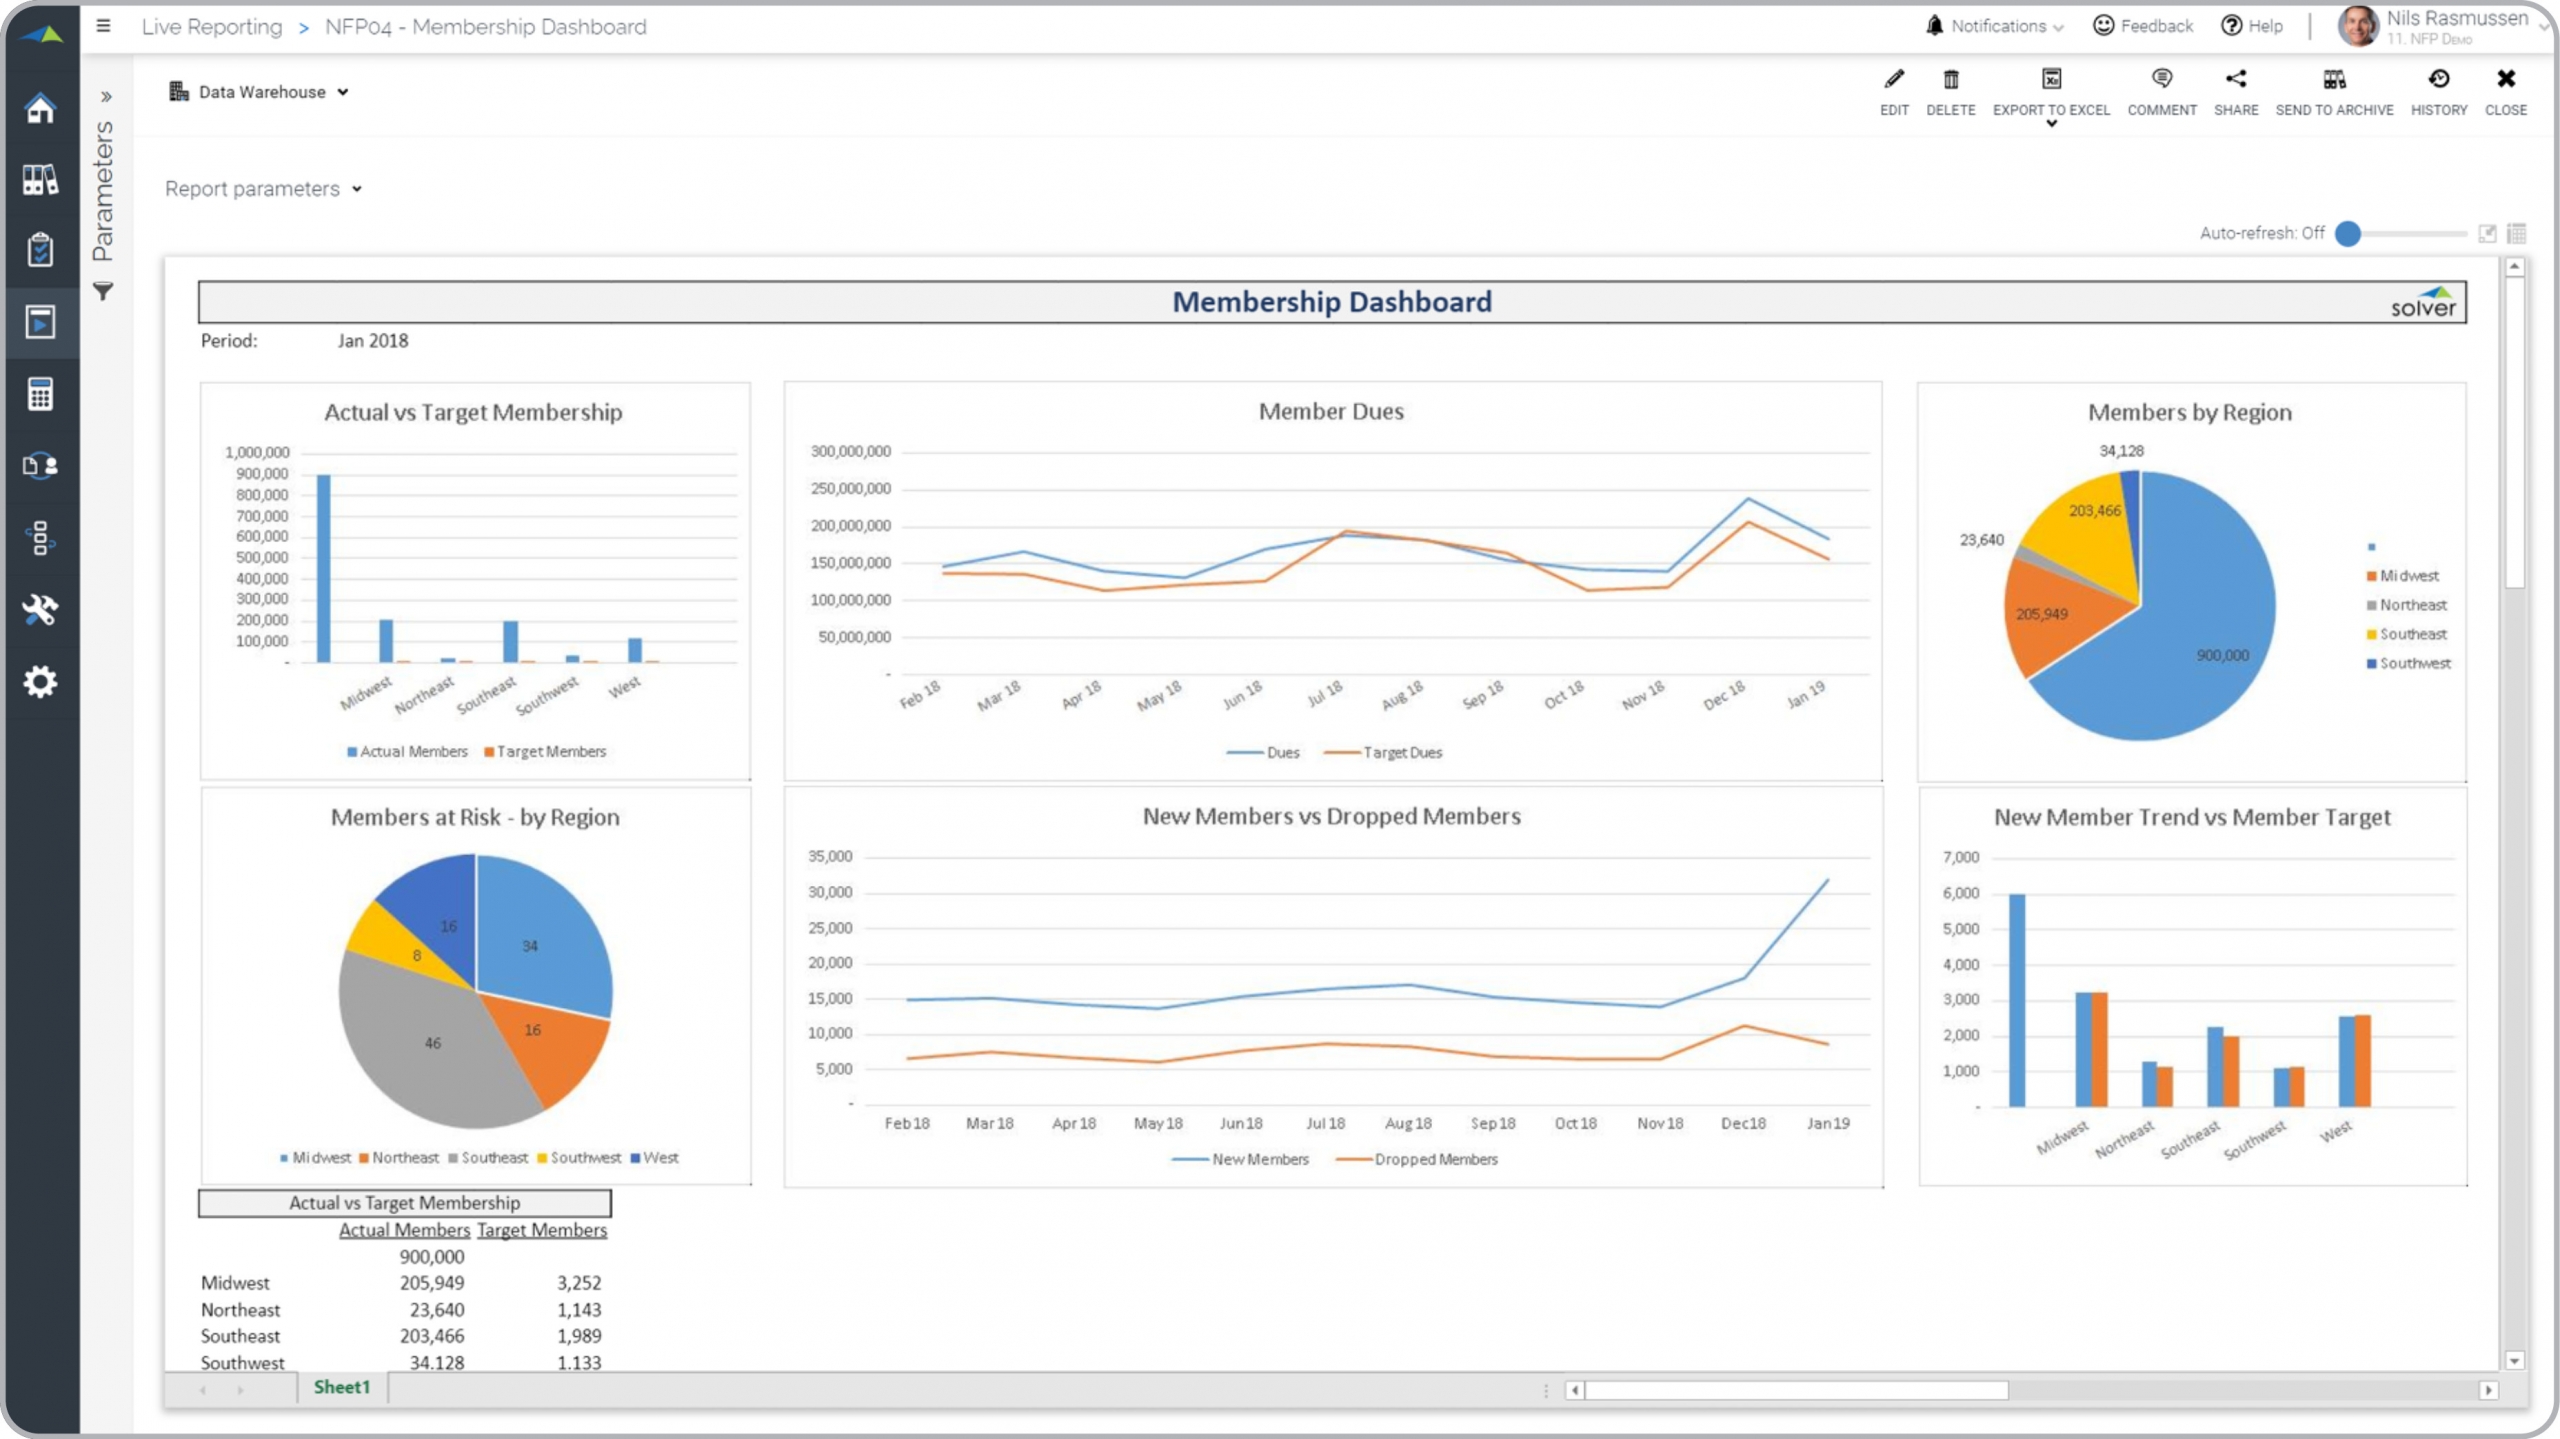
Nonprofit – Membership Dashboard
View actual and target membership metrics with comparisons and trends.
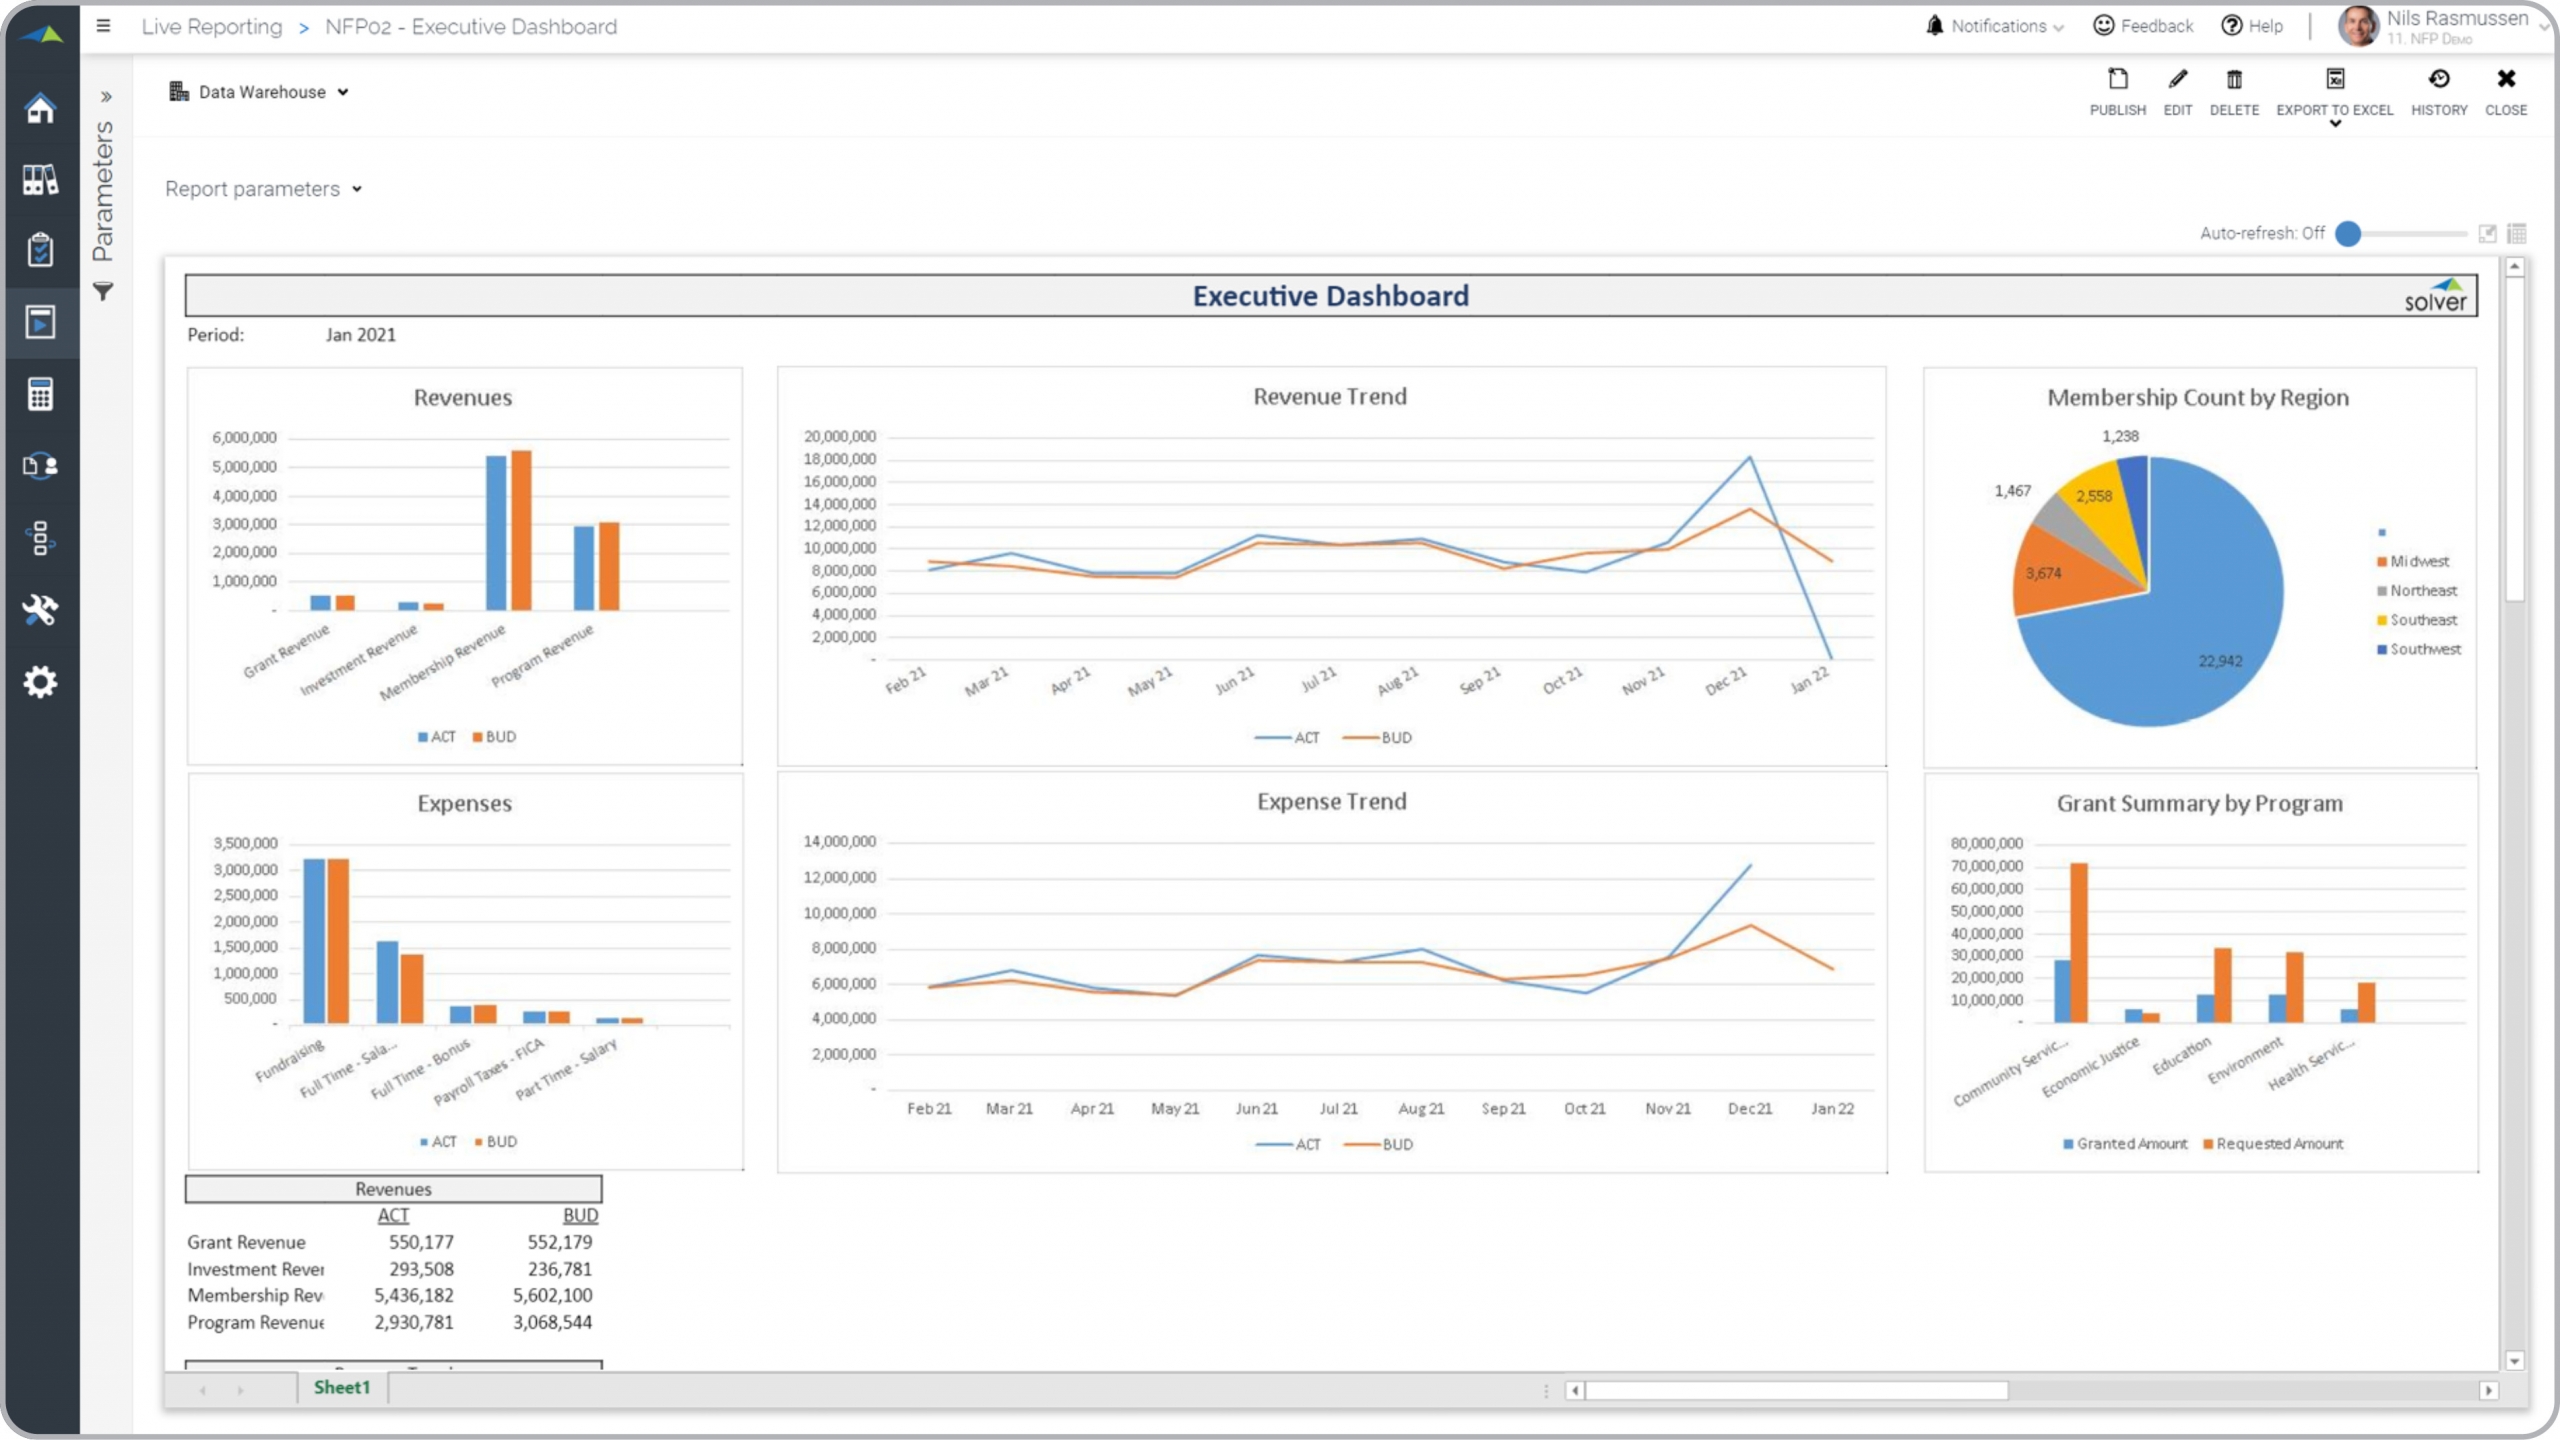
Nonprofit – Executive Dashboard
View actual and budgeted revenues and expenses for products, services, grants and dues.
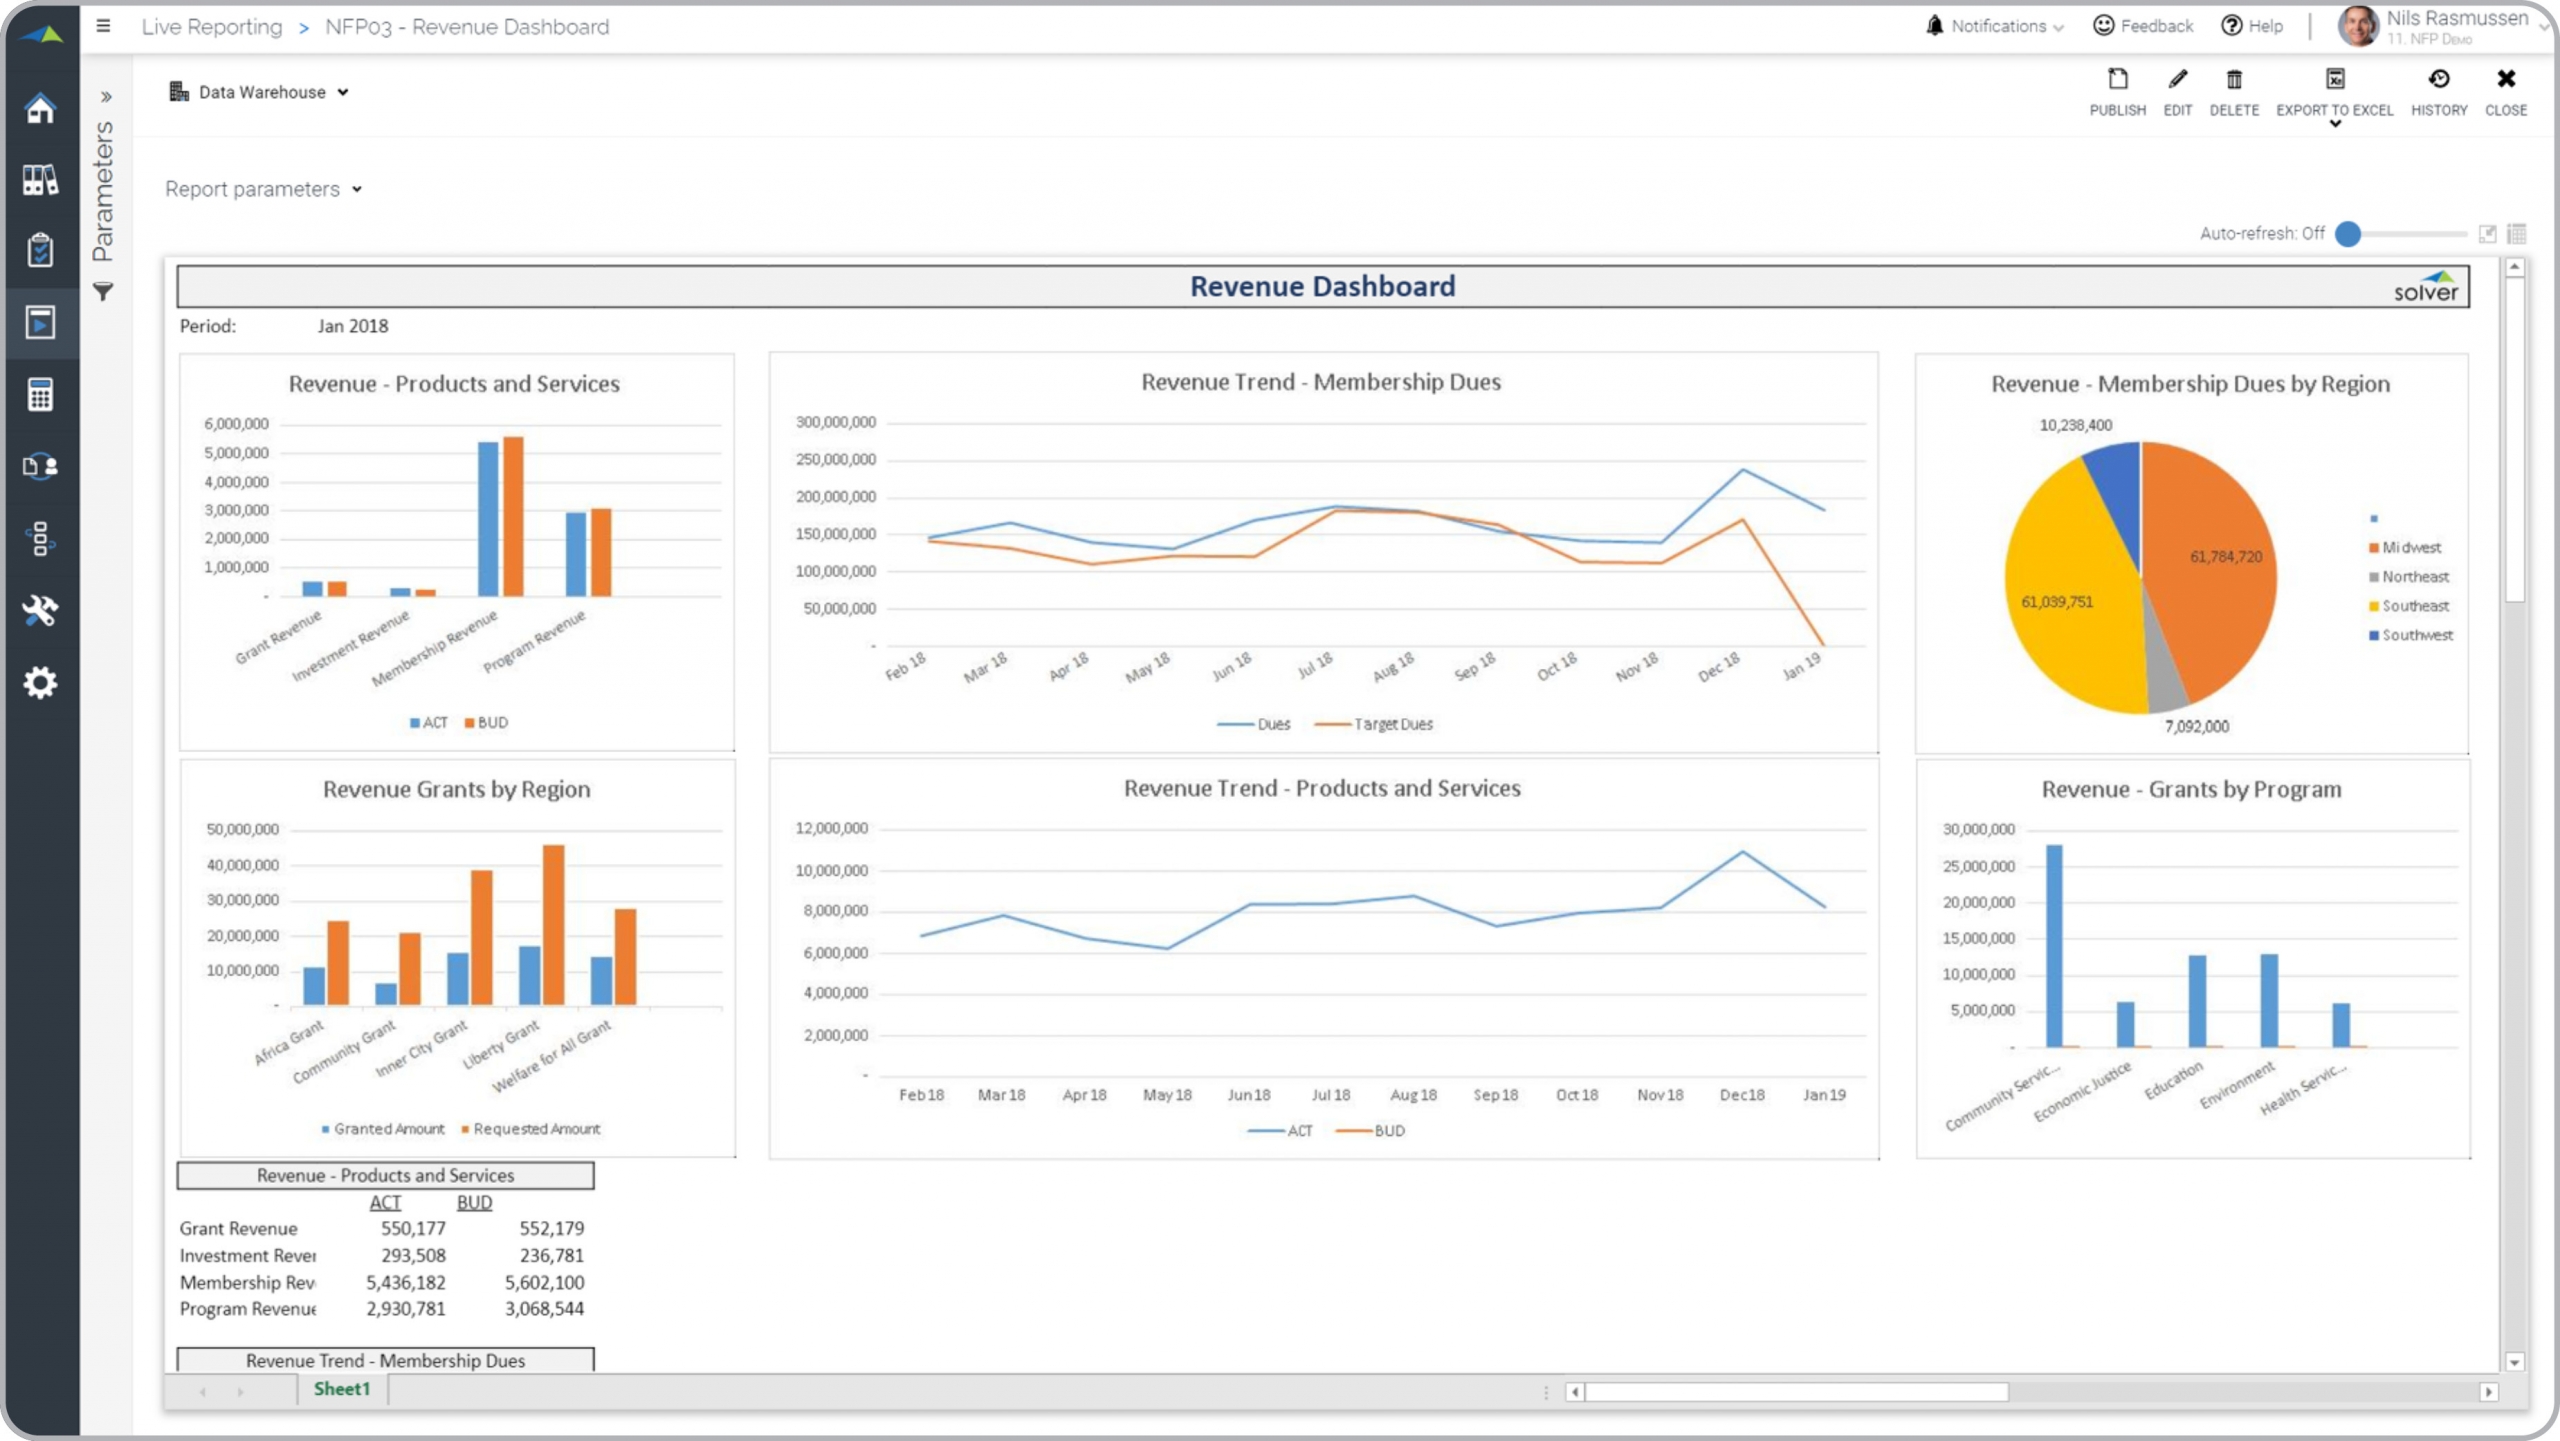
Nonprofit – Revenue Dashboard
Analyze actual and budgeted revenues for member dues, products, services and grants.
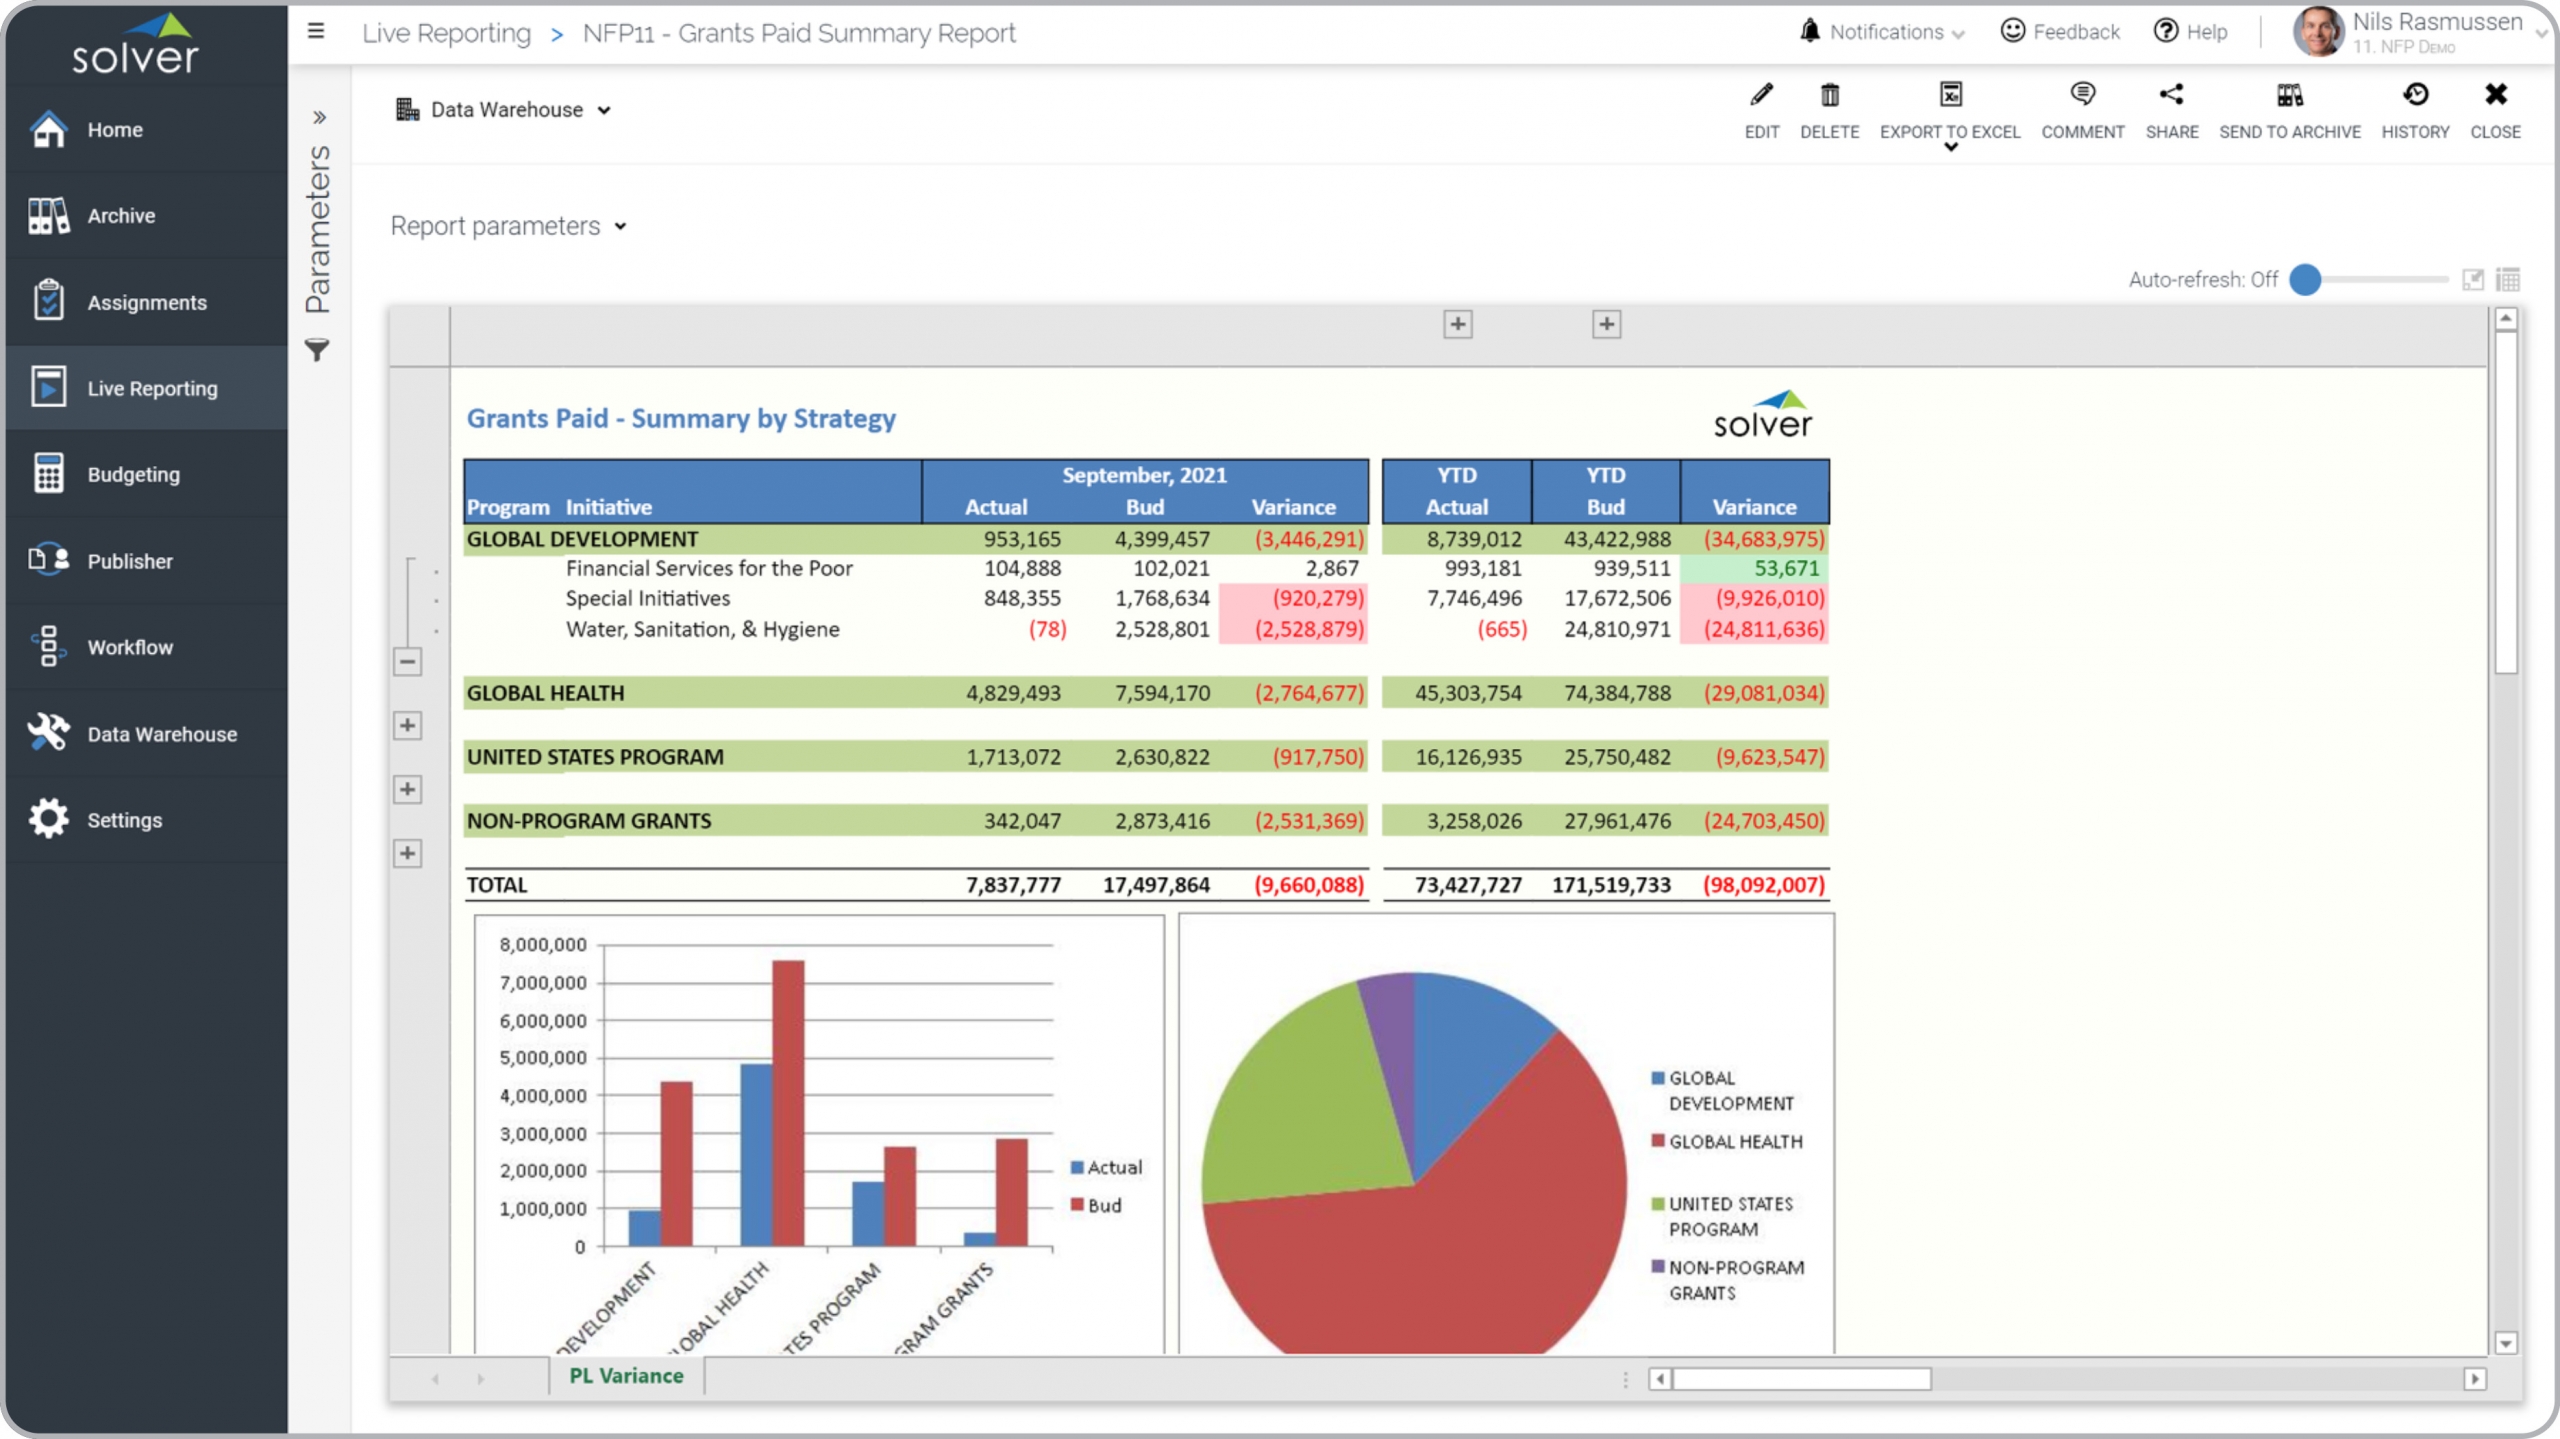
Nonprofit – Grants Paid Report
Shows actual paid grants versus budget, by program and initiative.
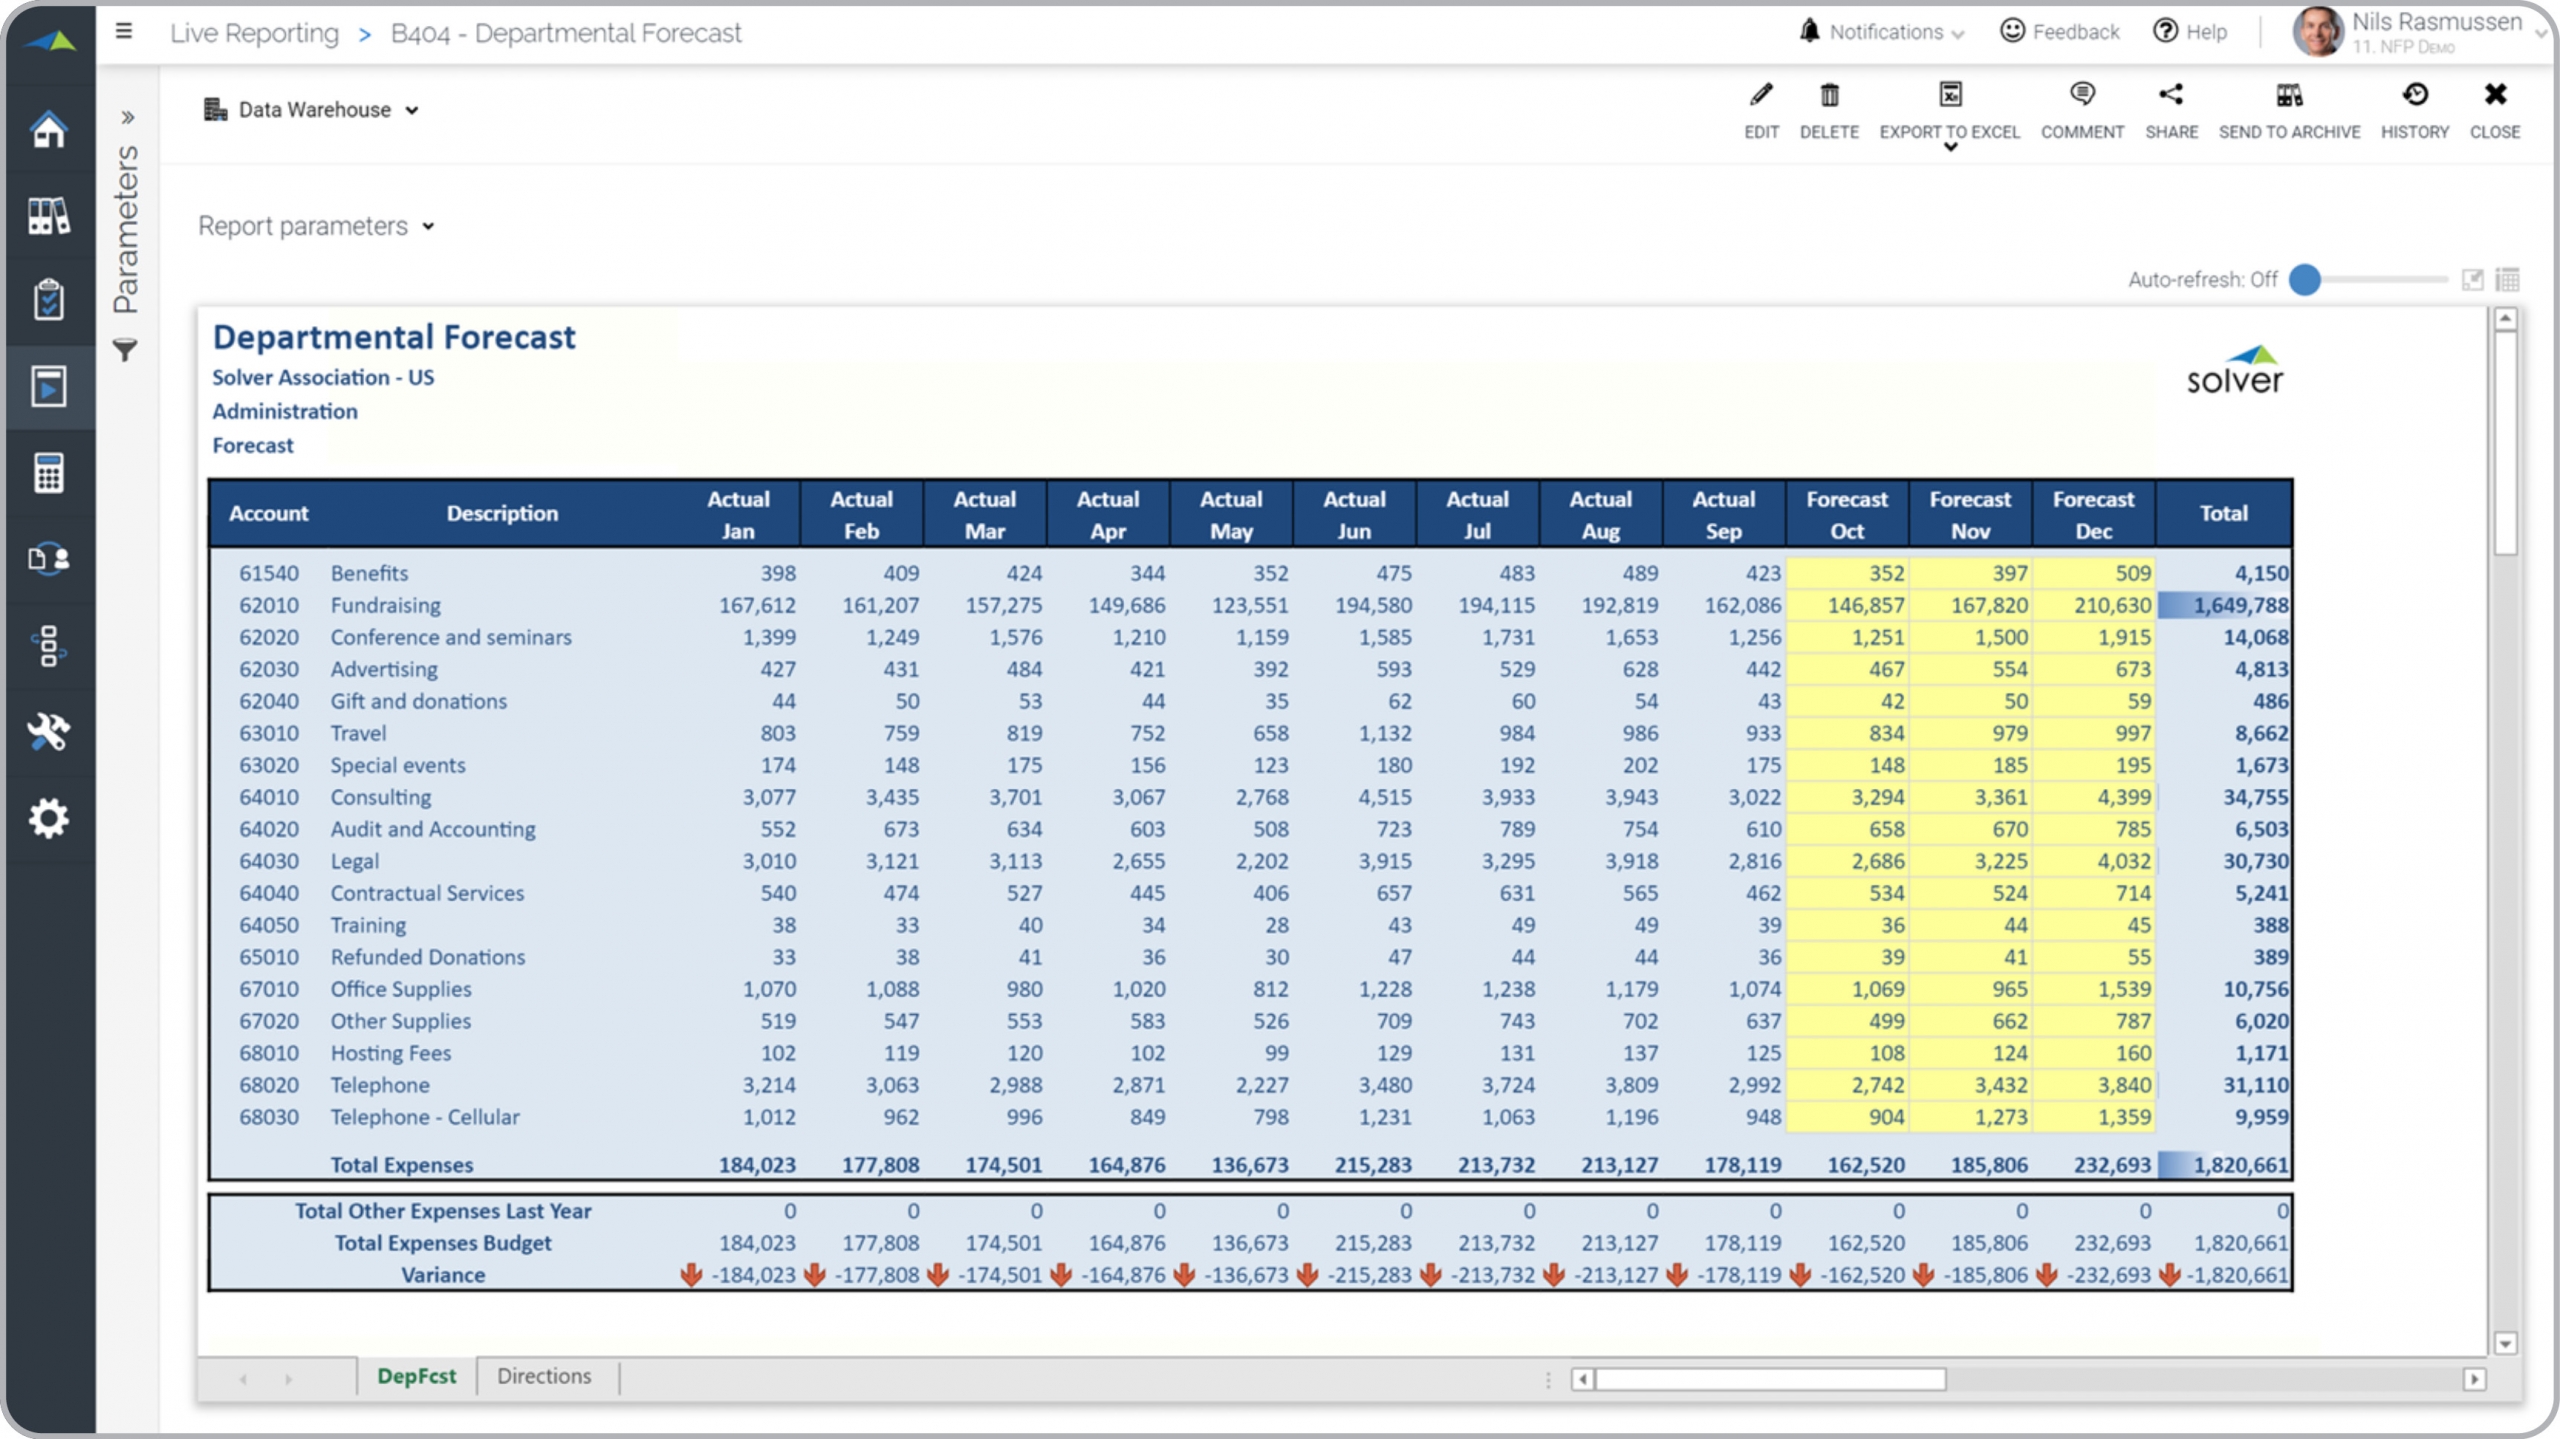
Nonprofit – Department Forecast
Historical months auto-populate with actual data and the user enters the forecast.
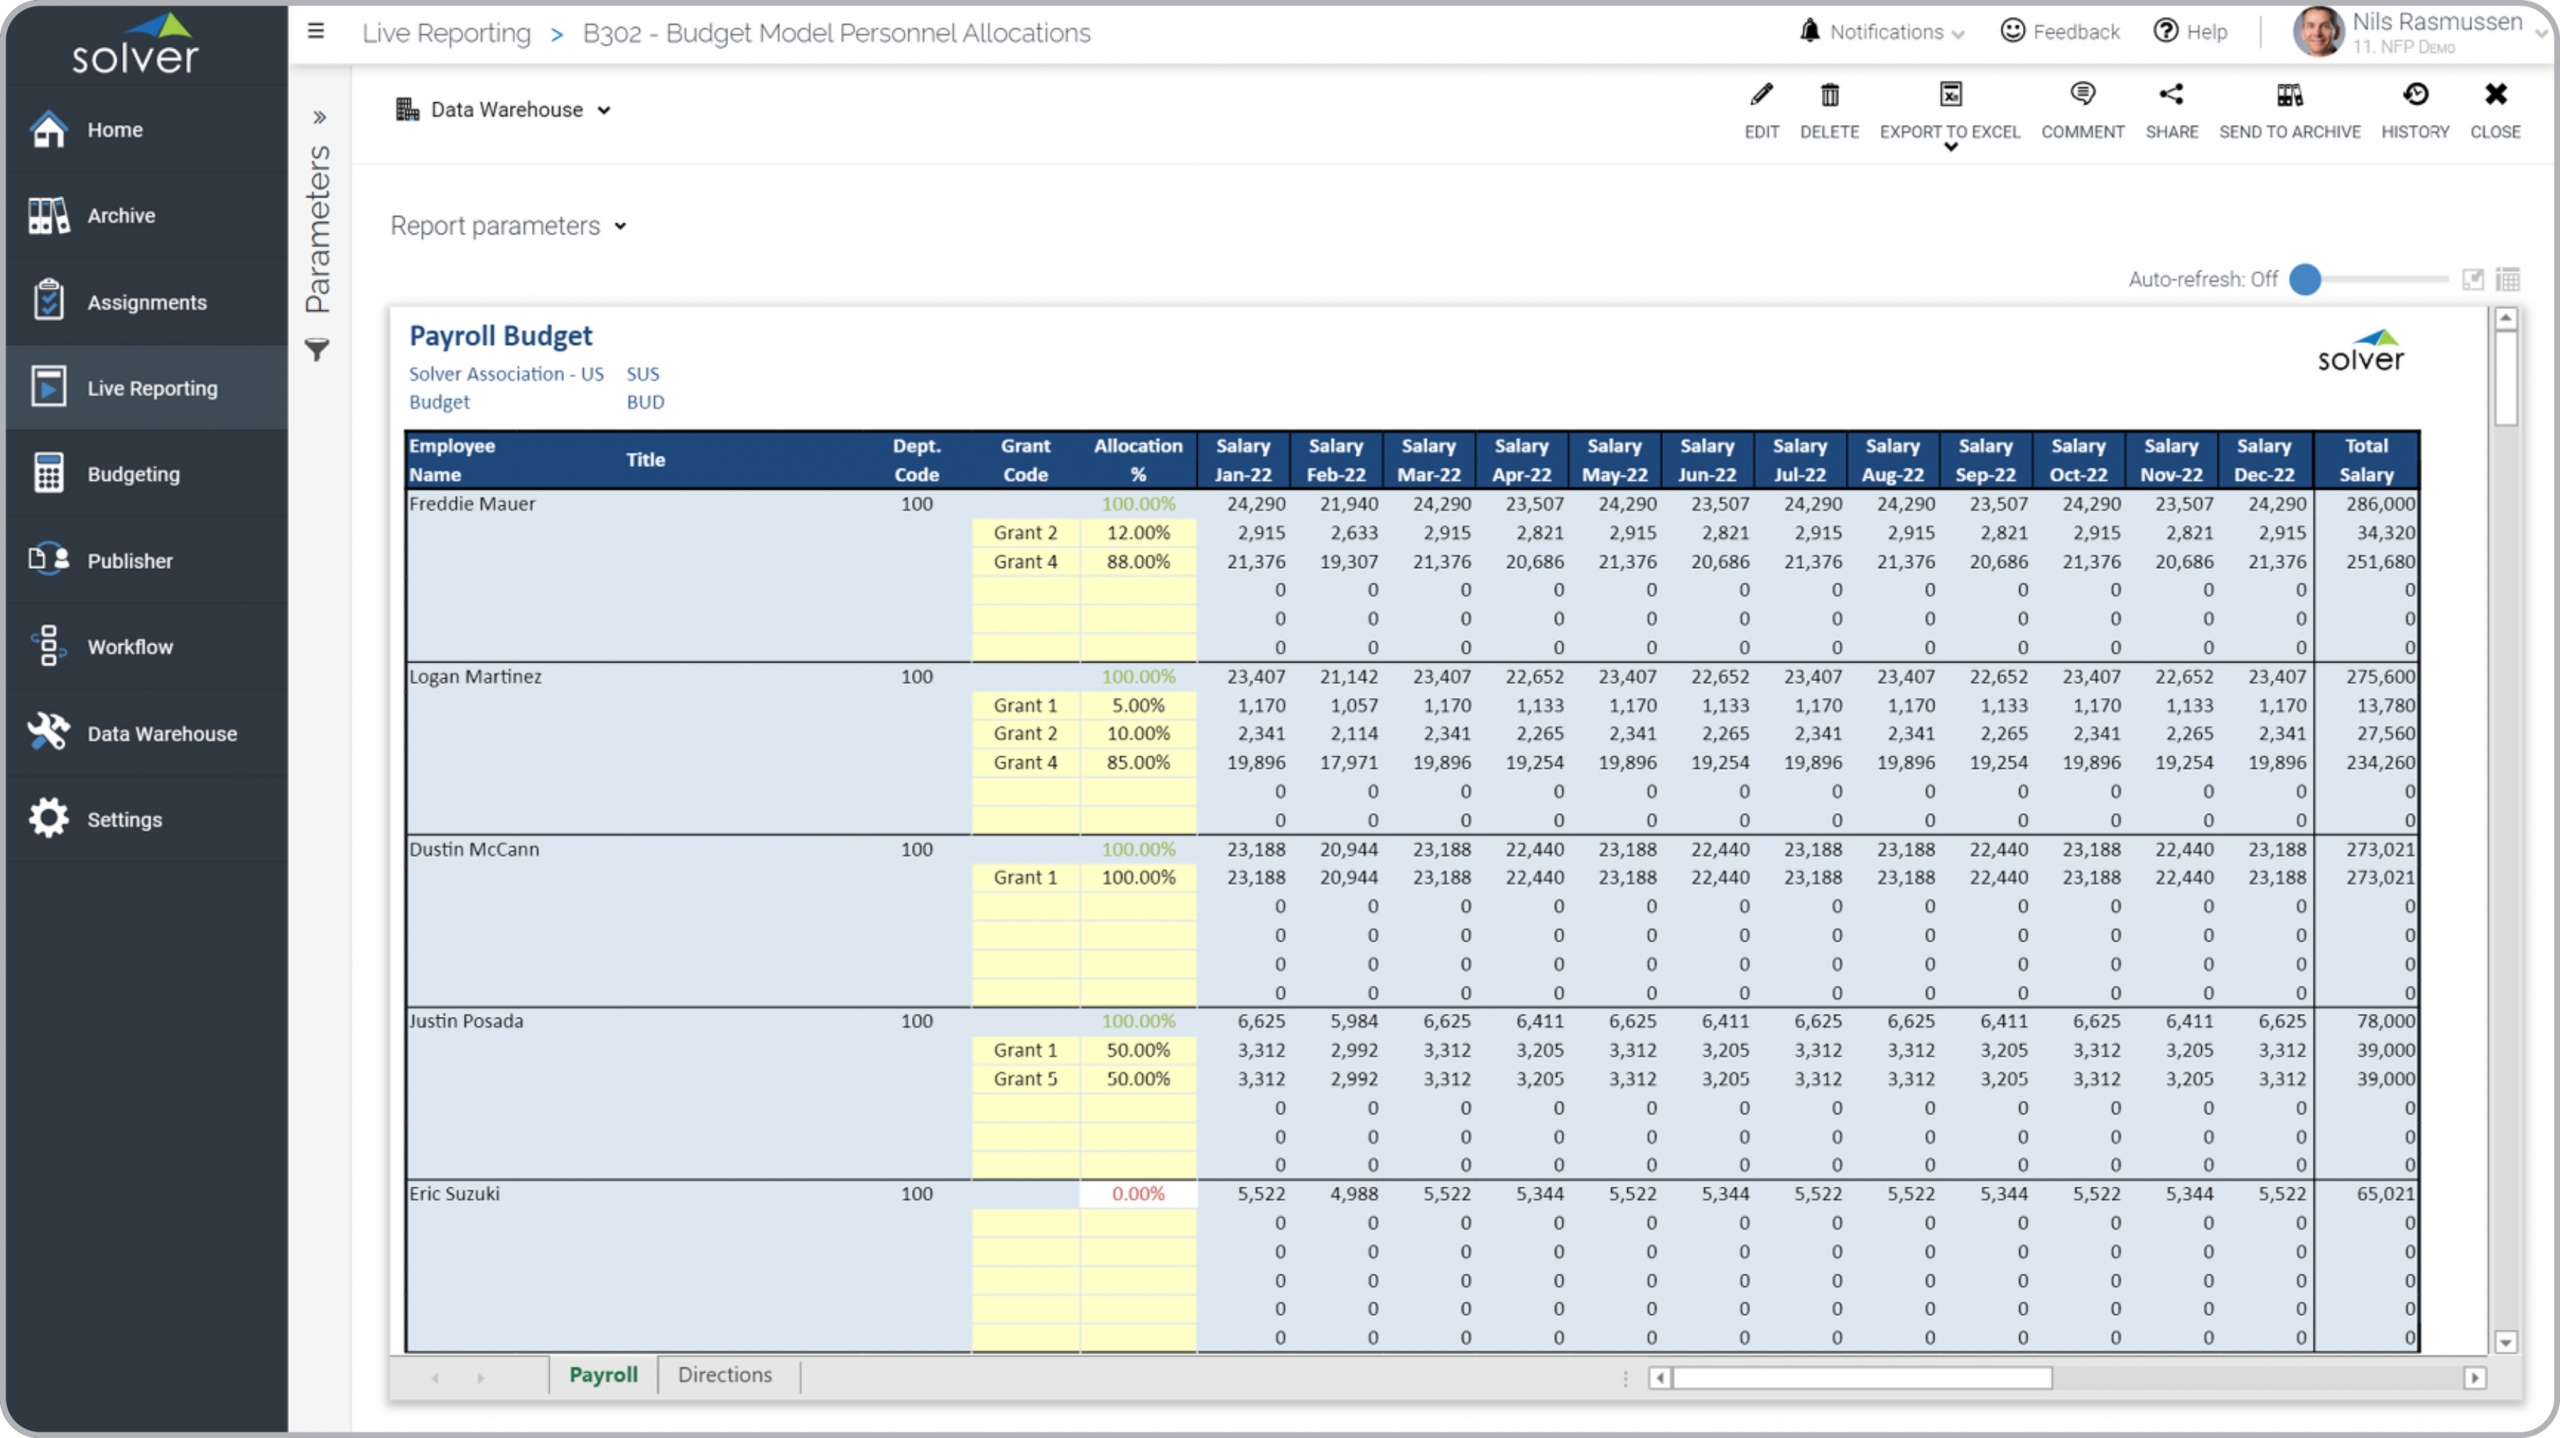
Nonprofit – Salary Allocation to Grants
Allocate employee salaries by percent to the applicable grants.
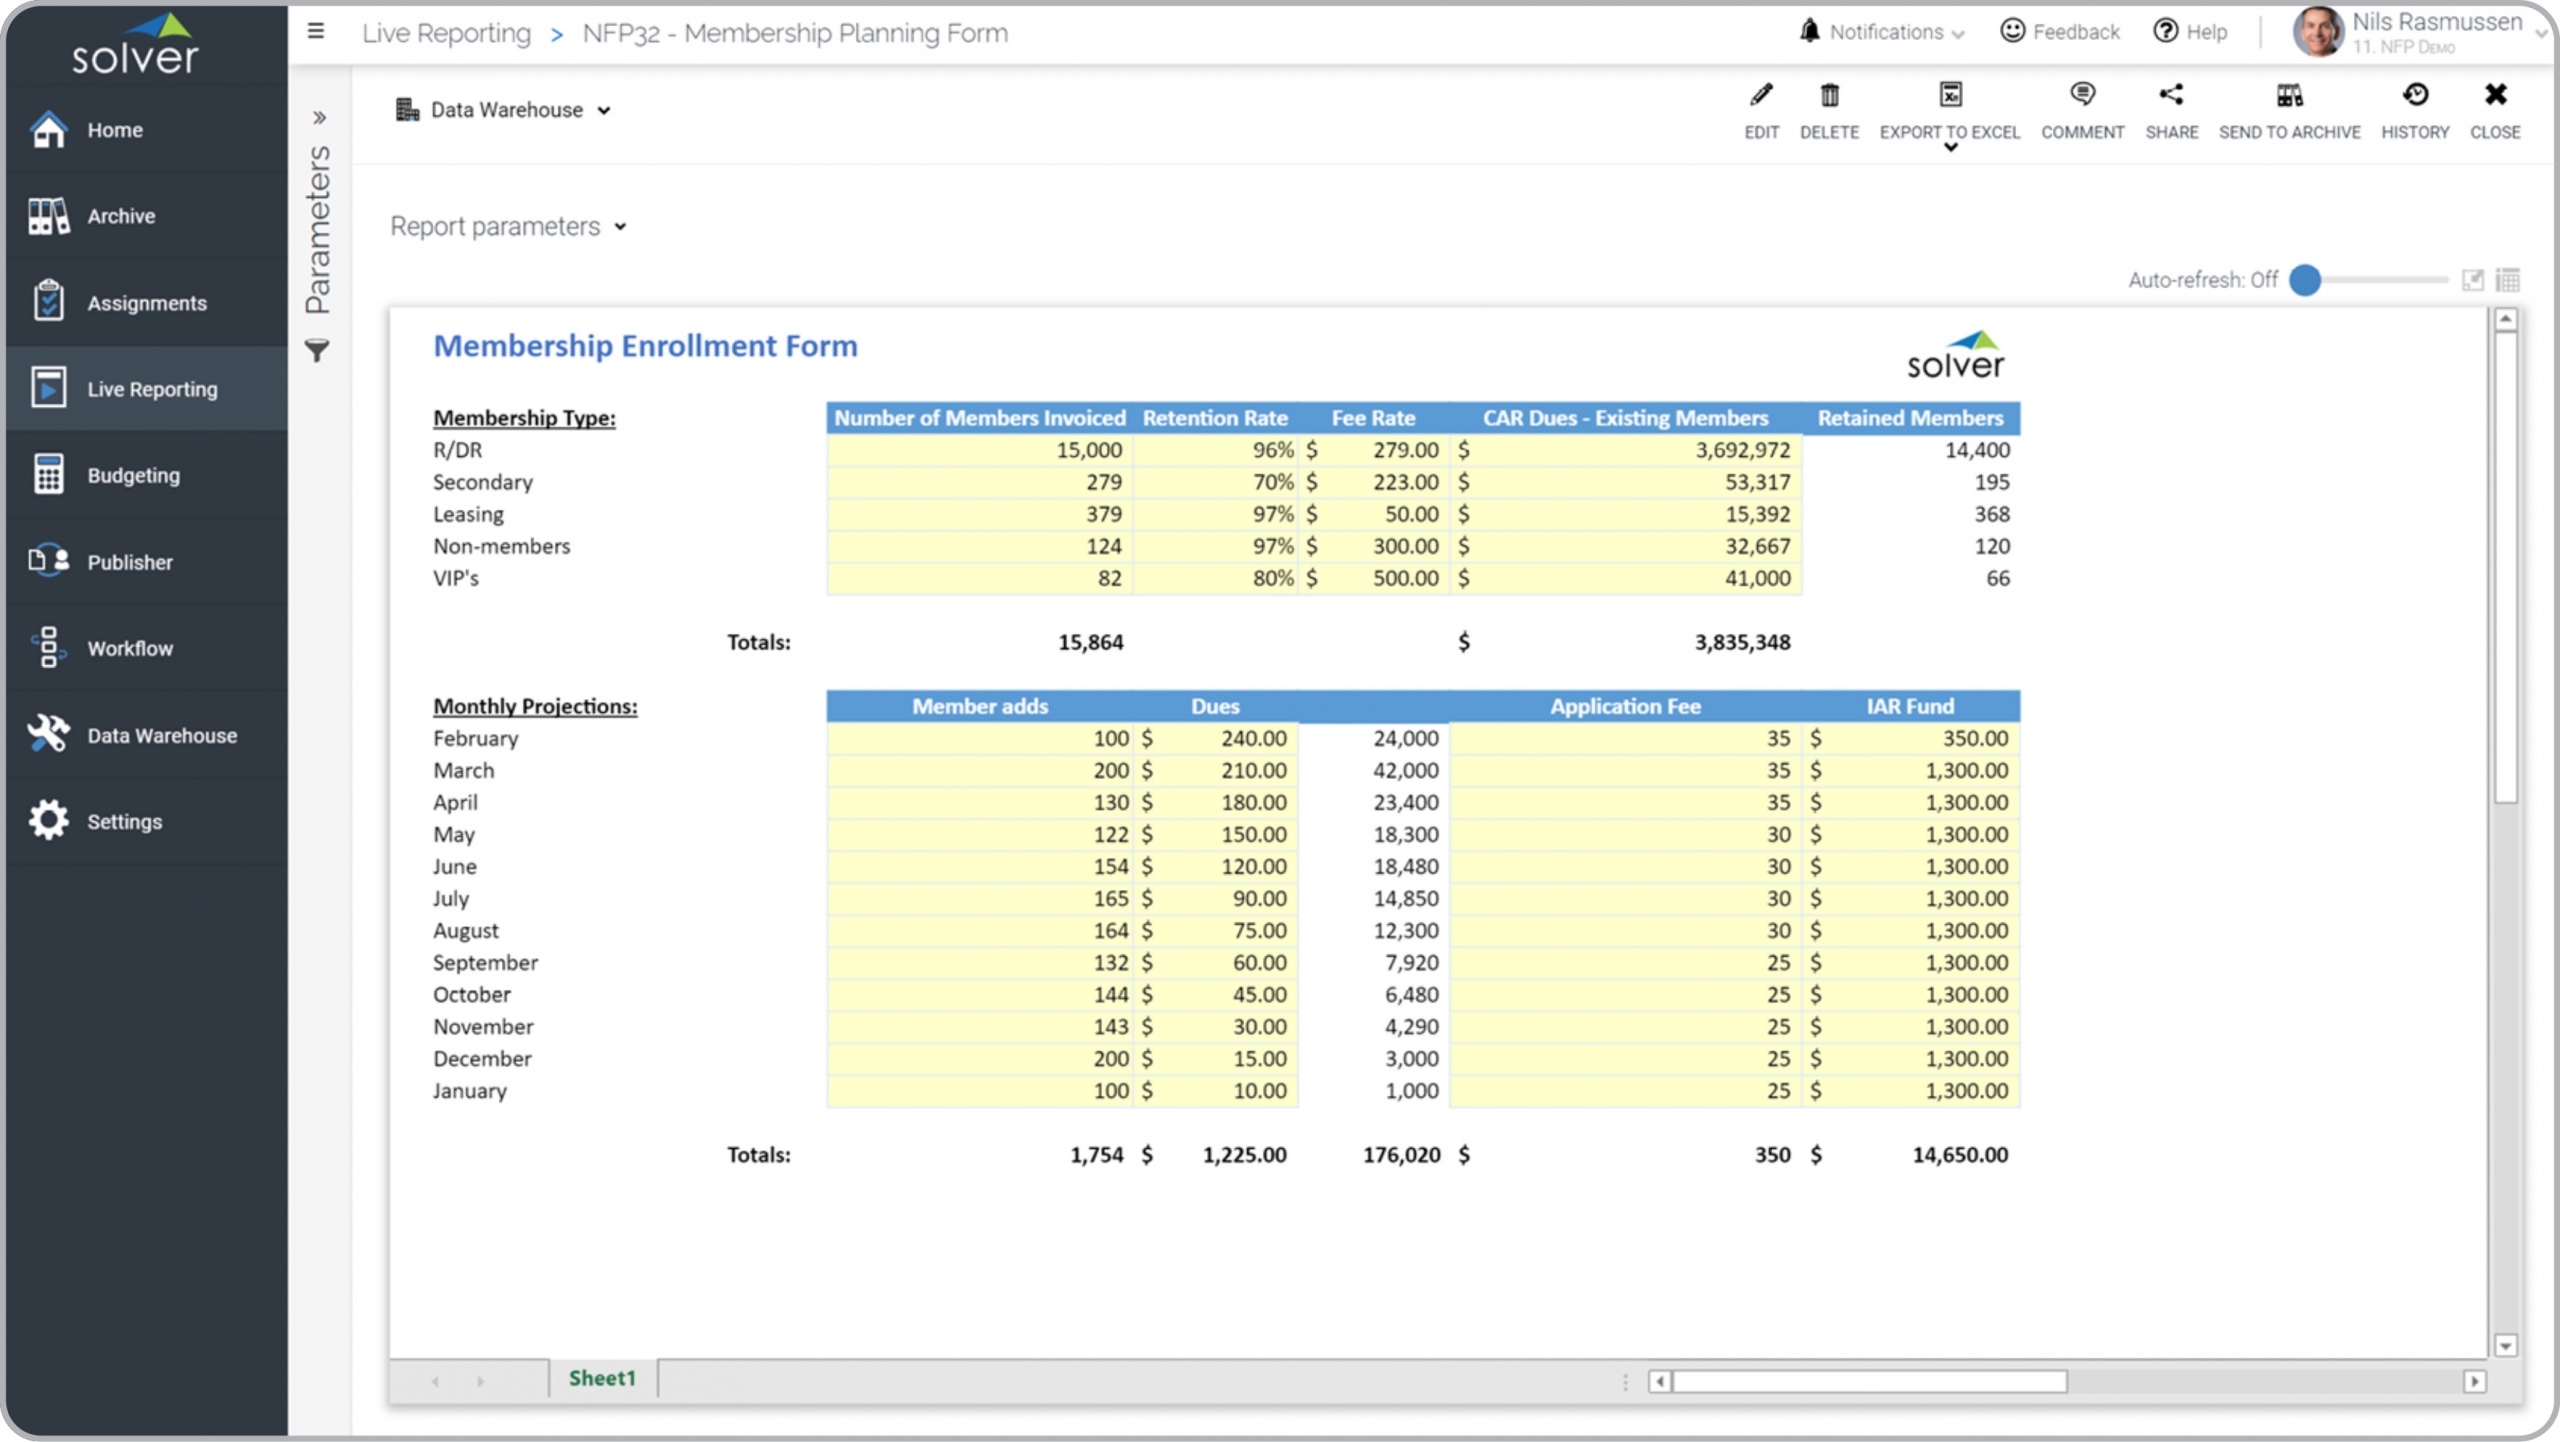
Nonprofit – Membership Budget
Budget membership revenue based on adds, retention, dues and other metrics.

Nonprofit – Event Forecast
Budget for tickets, revenues and expenses related to specific events.
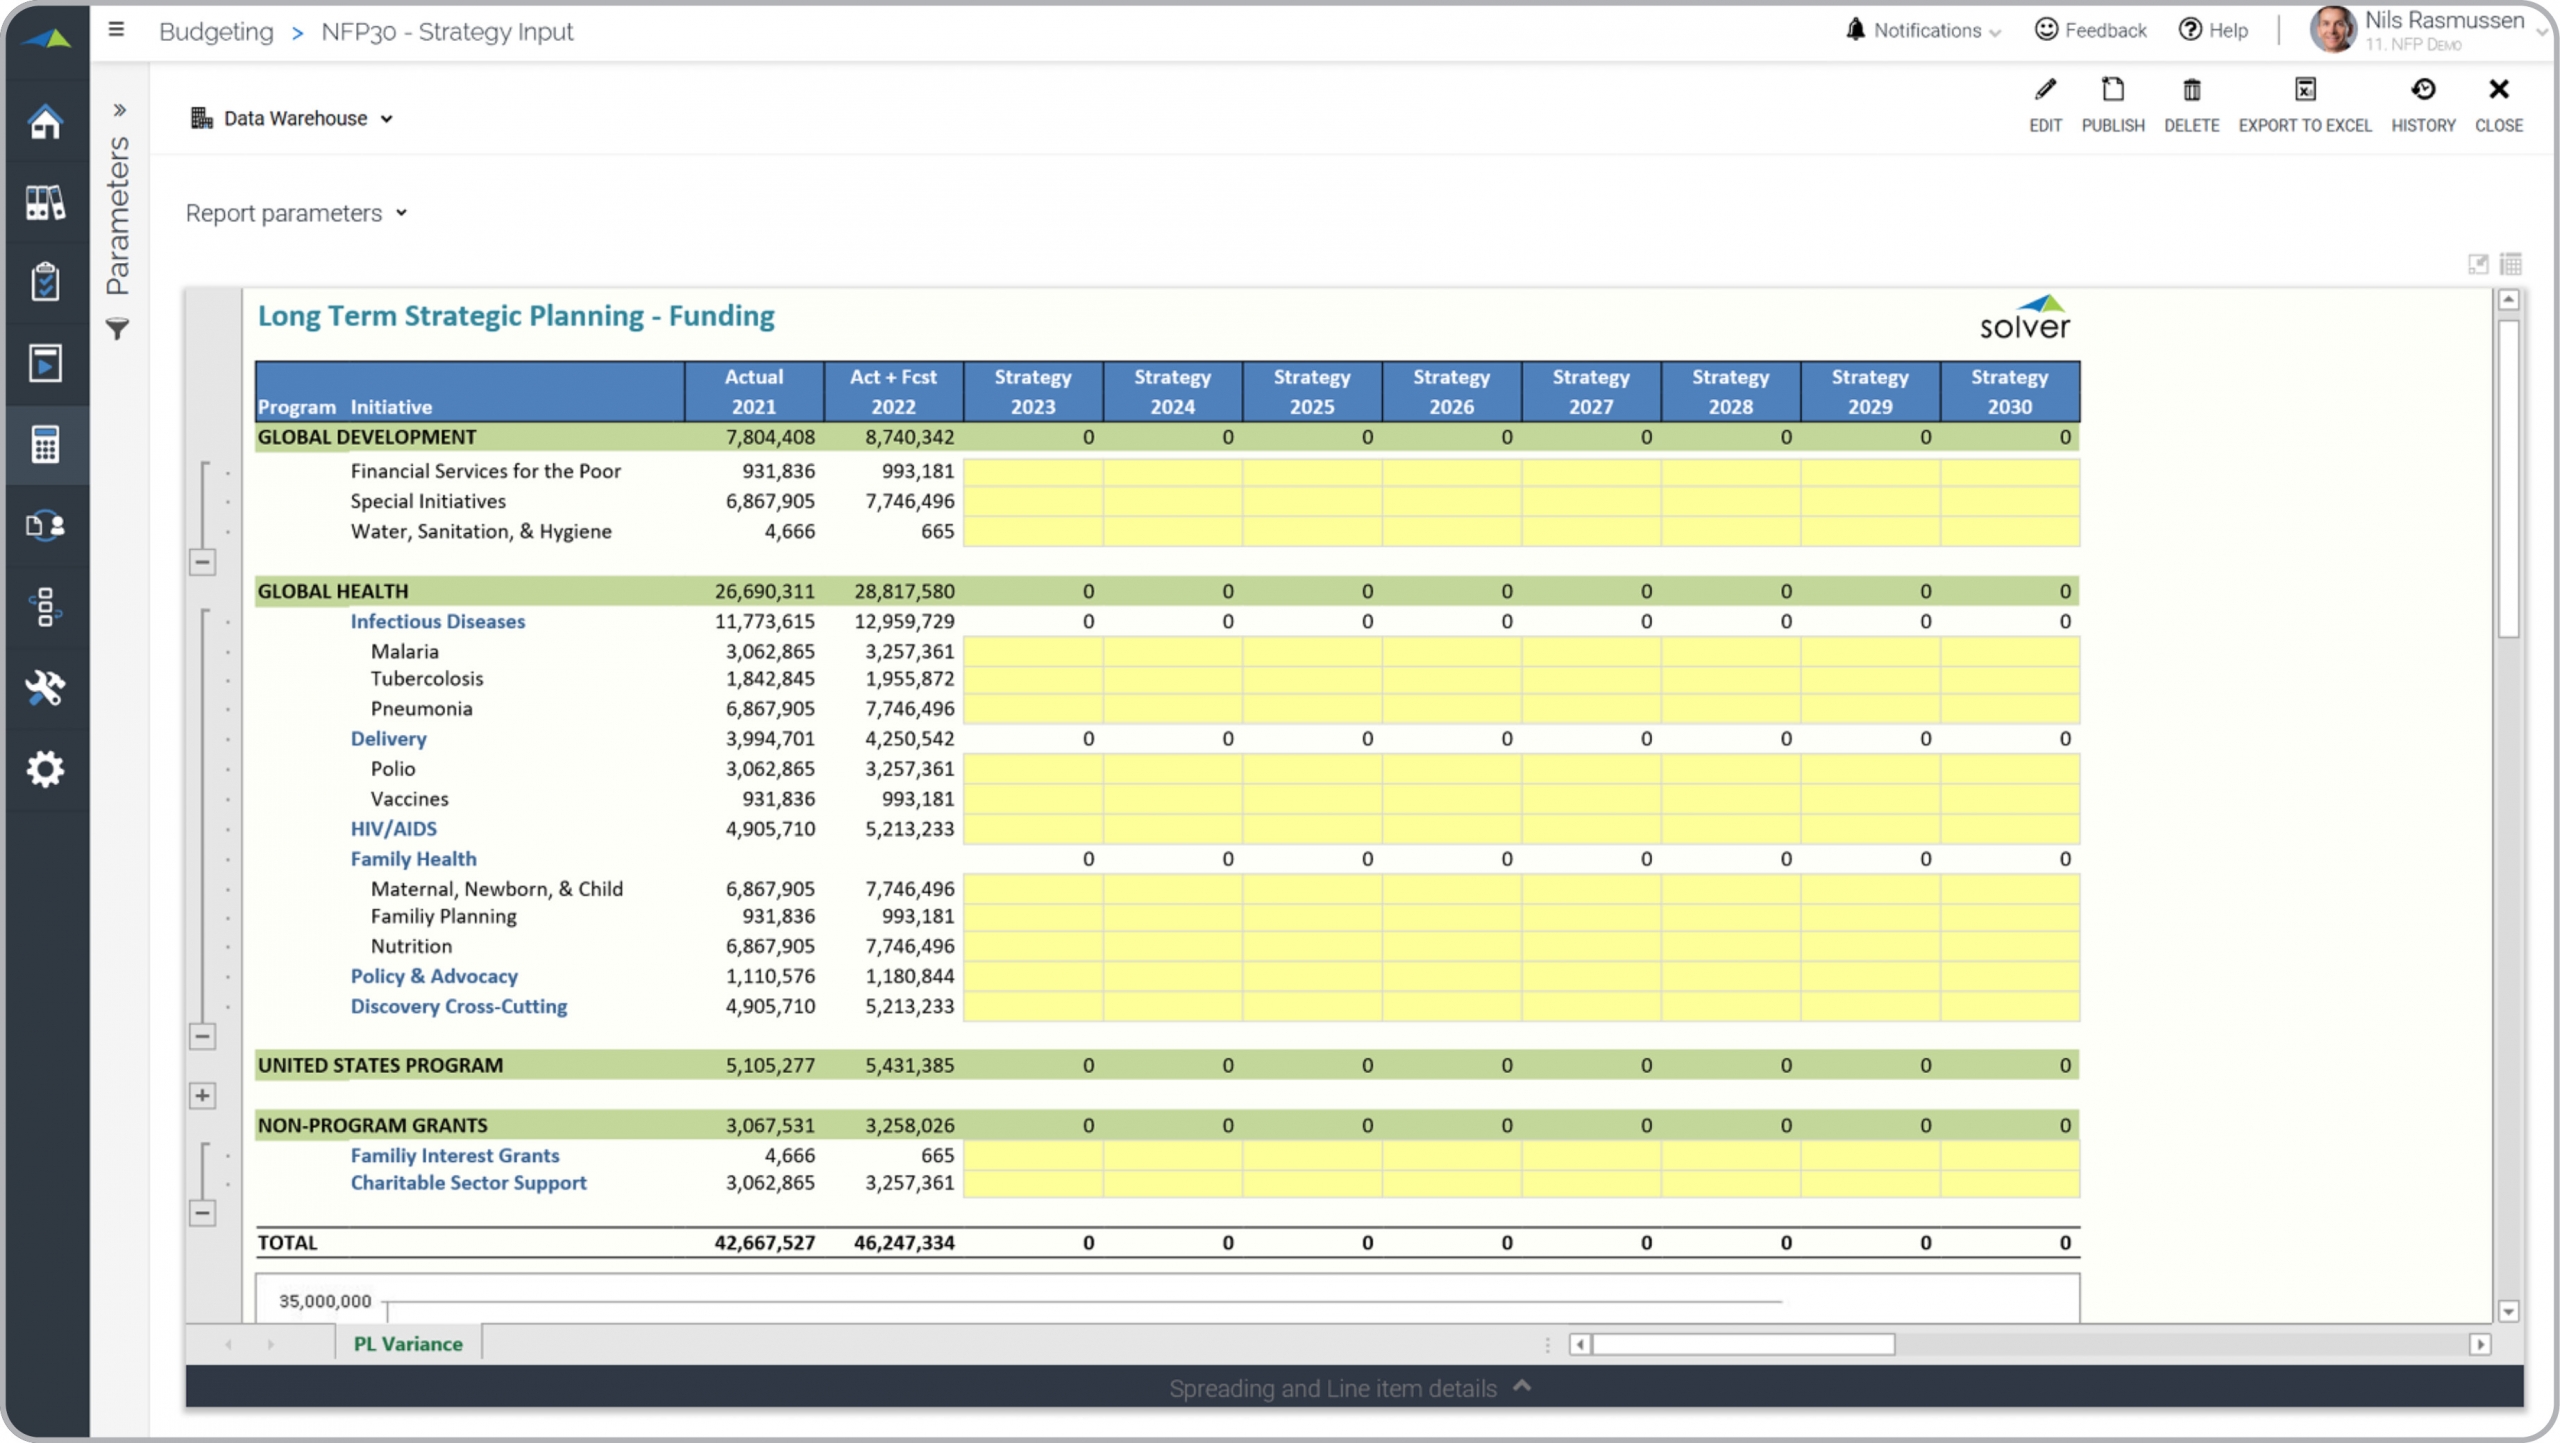
Nonprofit – Multi-year Program Funding
Enter multi-year funding targets for strategic programs and initiatives.
Process Manager Overview
Solver’s Process Manager is a new tool to help companies easily define and track processes and process tasks.
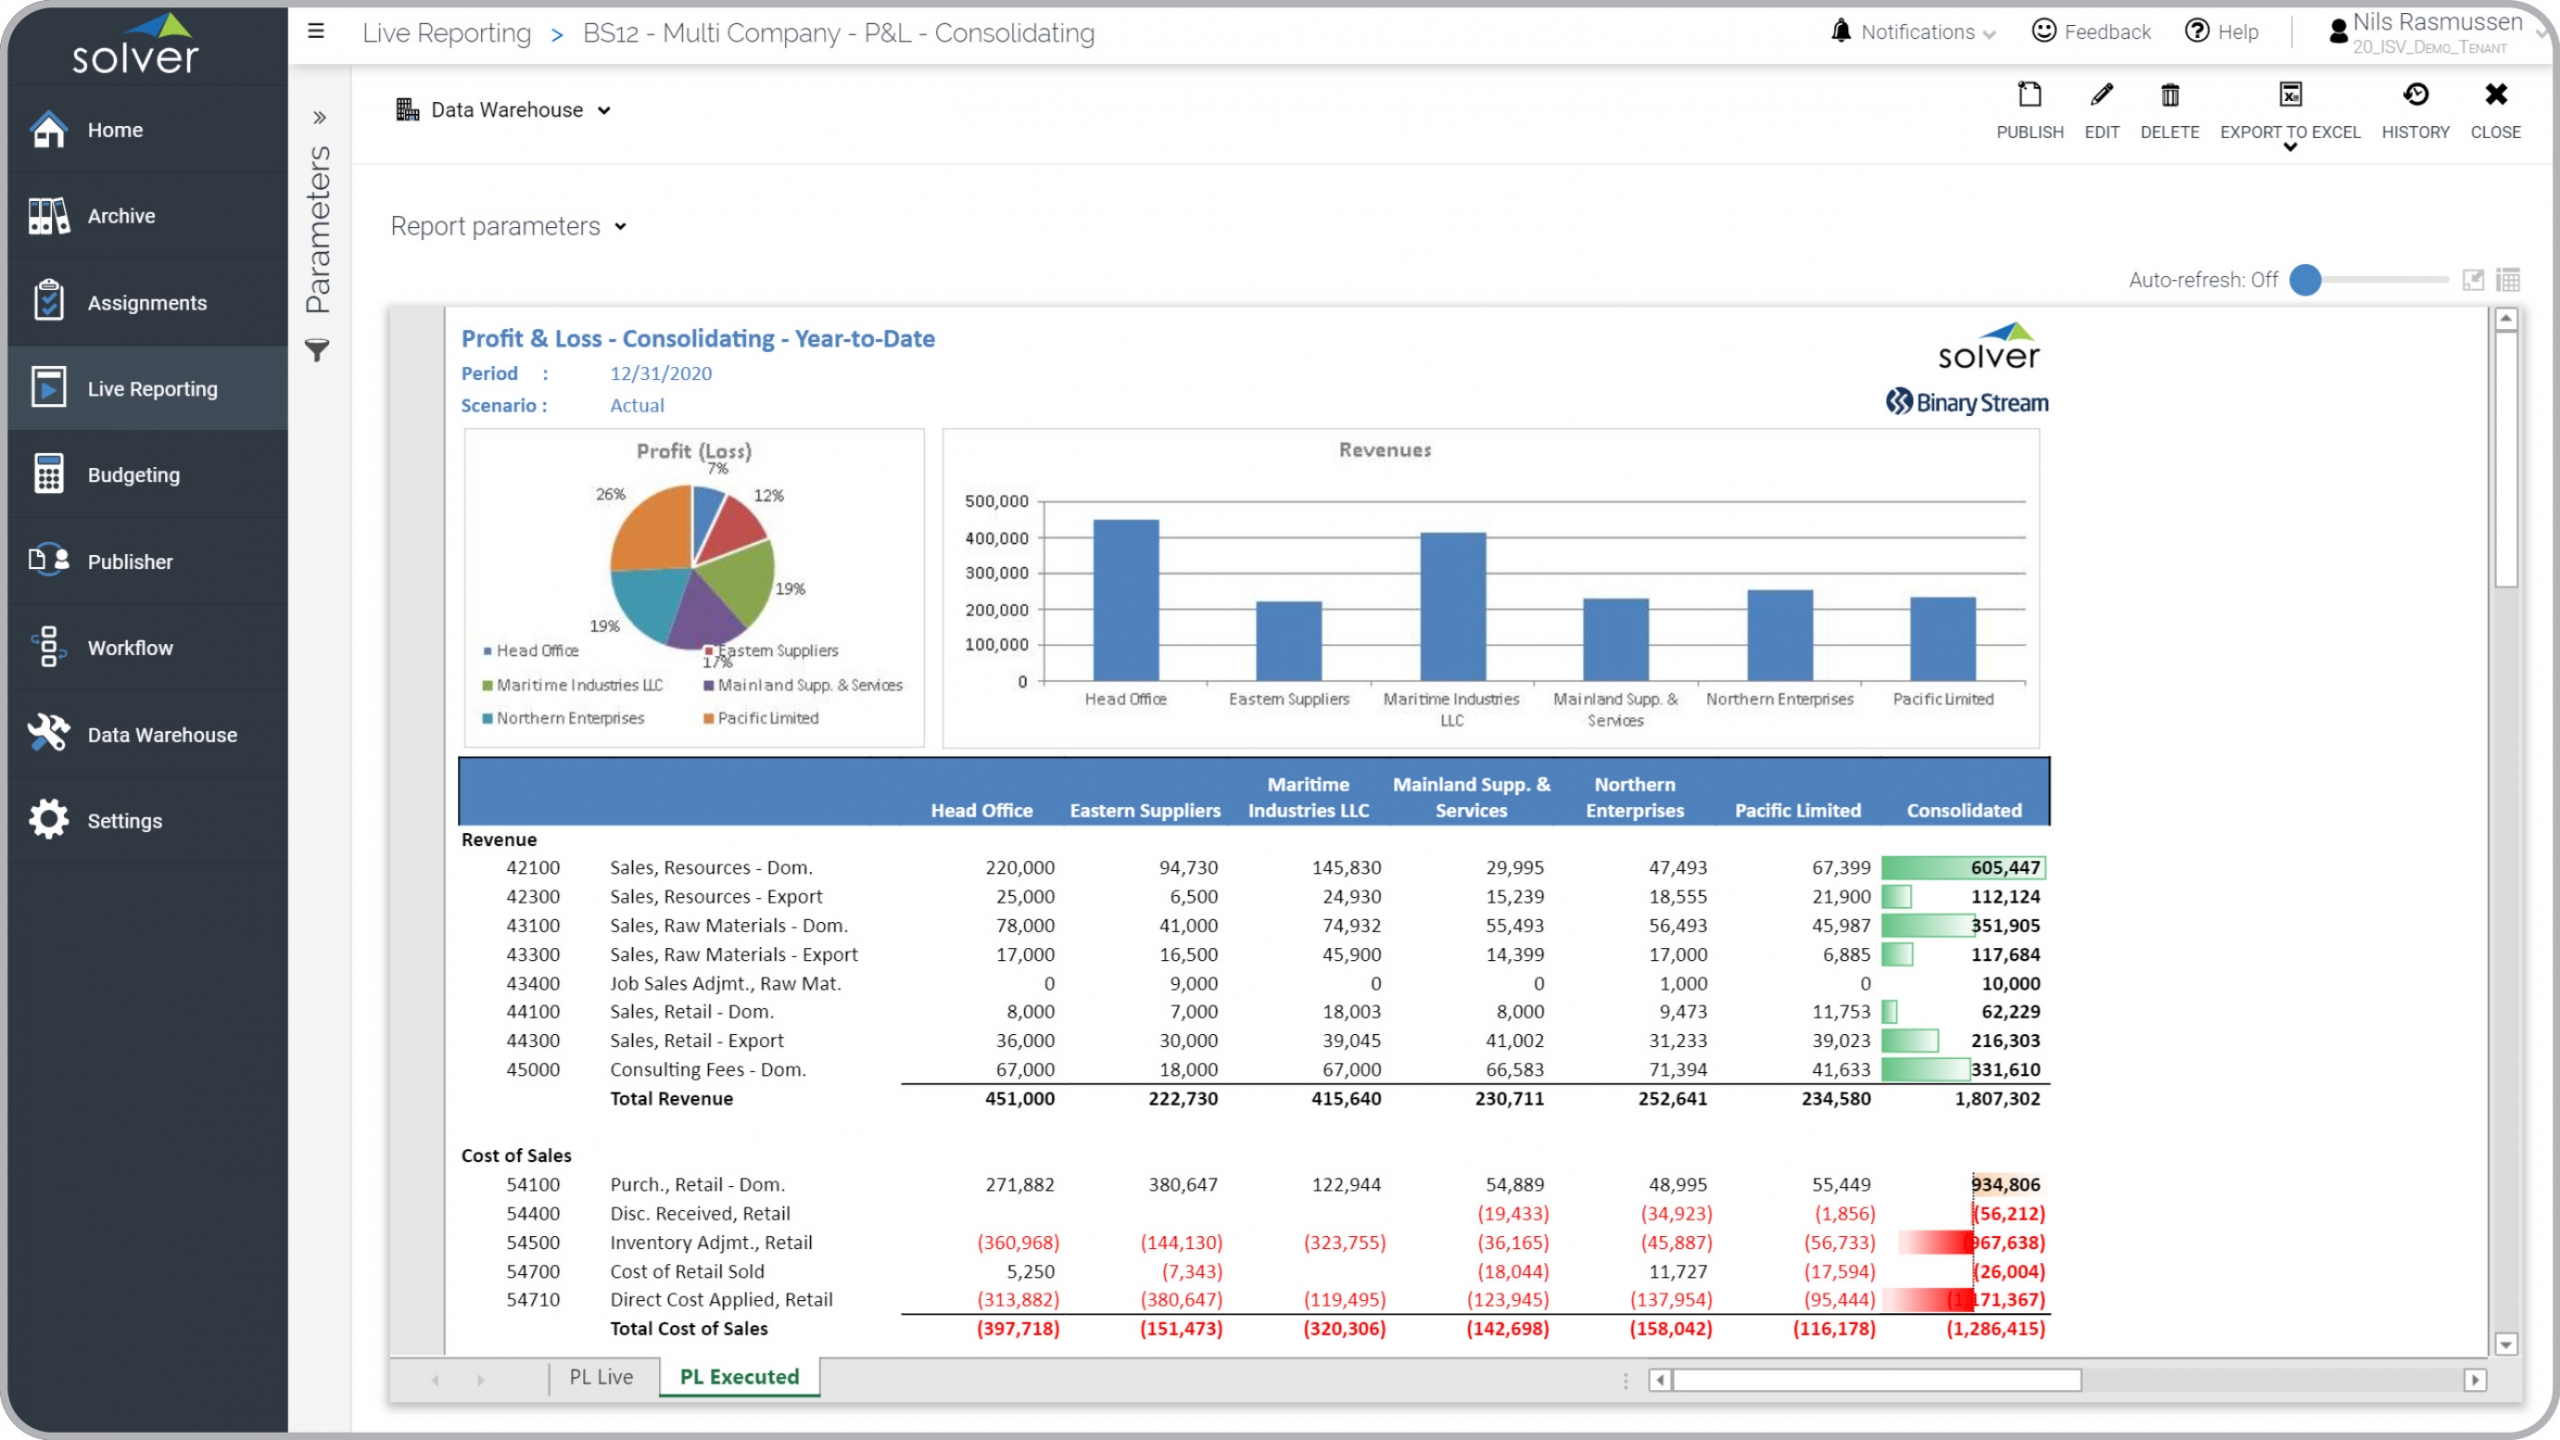
Consolidating Profit & Loss
Based on data from Binary Stream's Multi-Entity Management for Microsoft Dynamics.
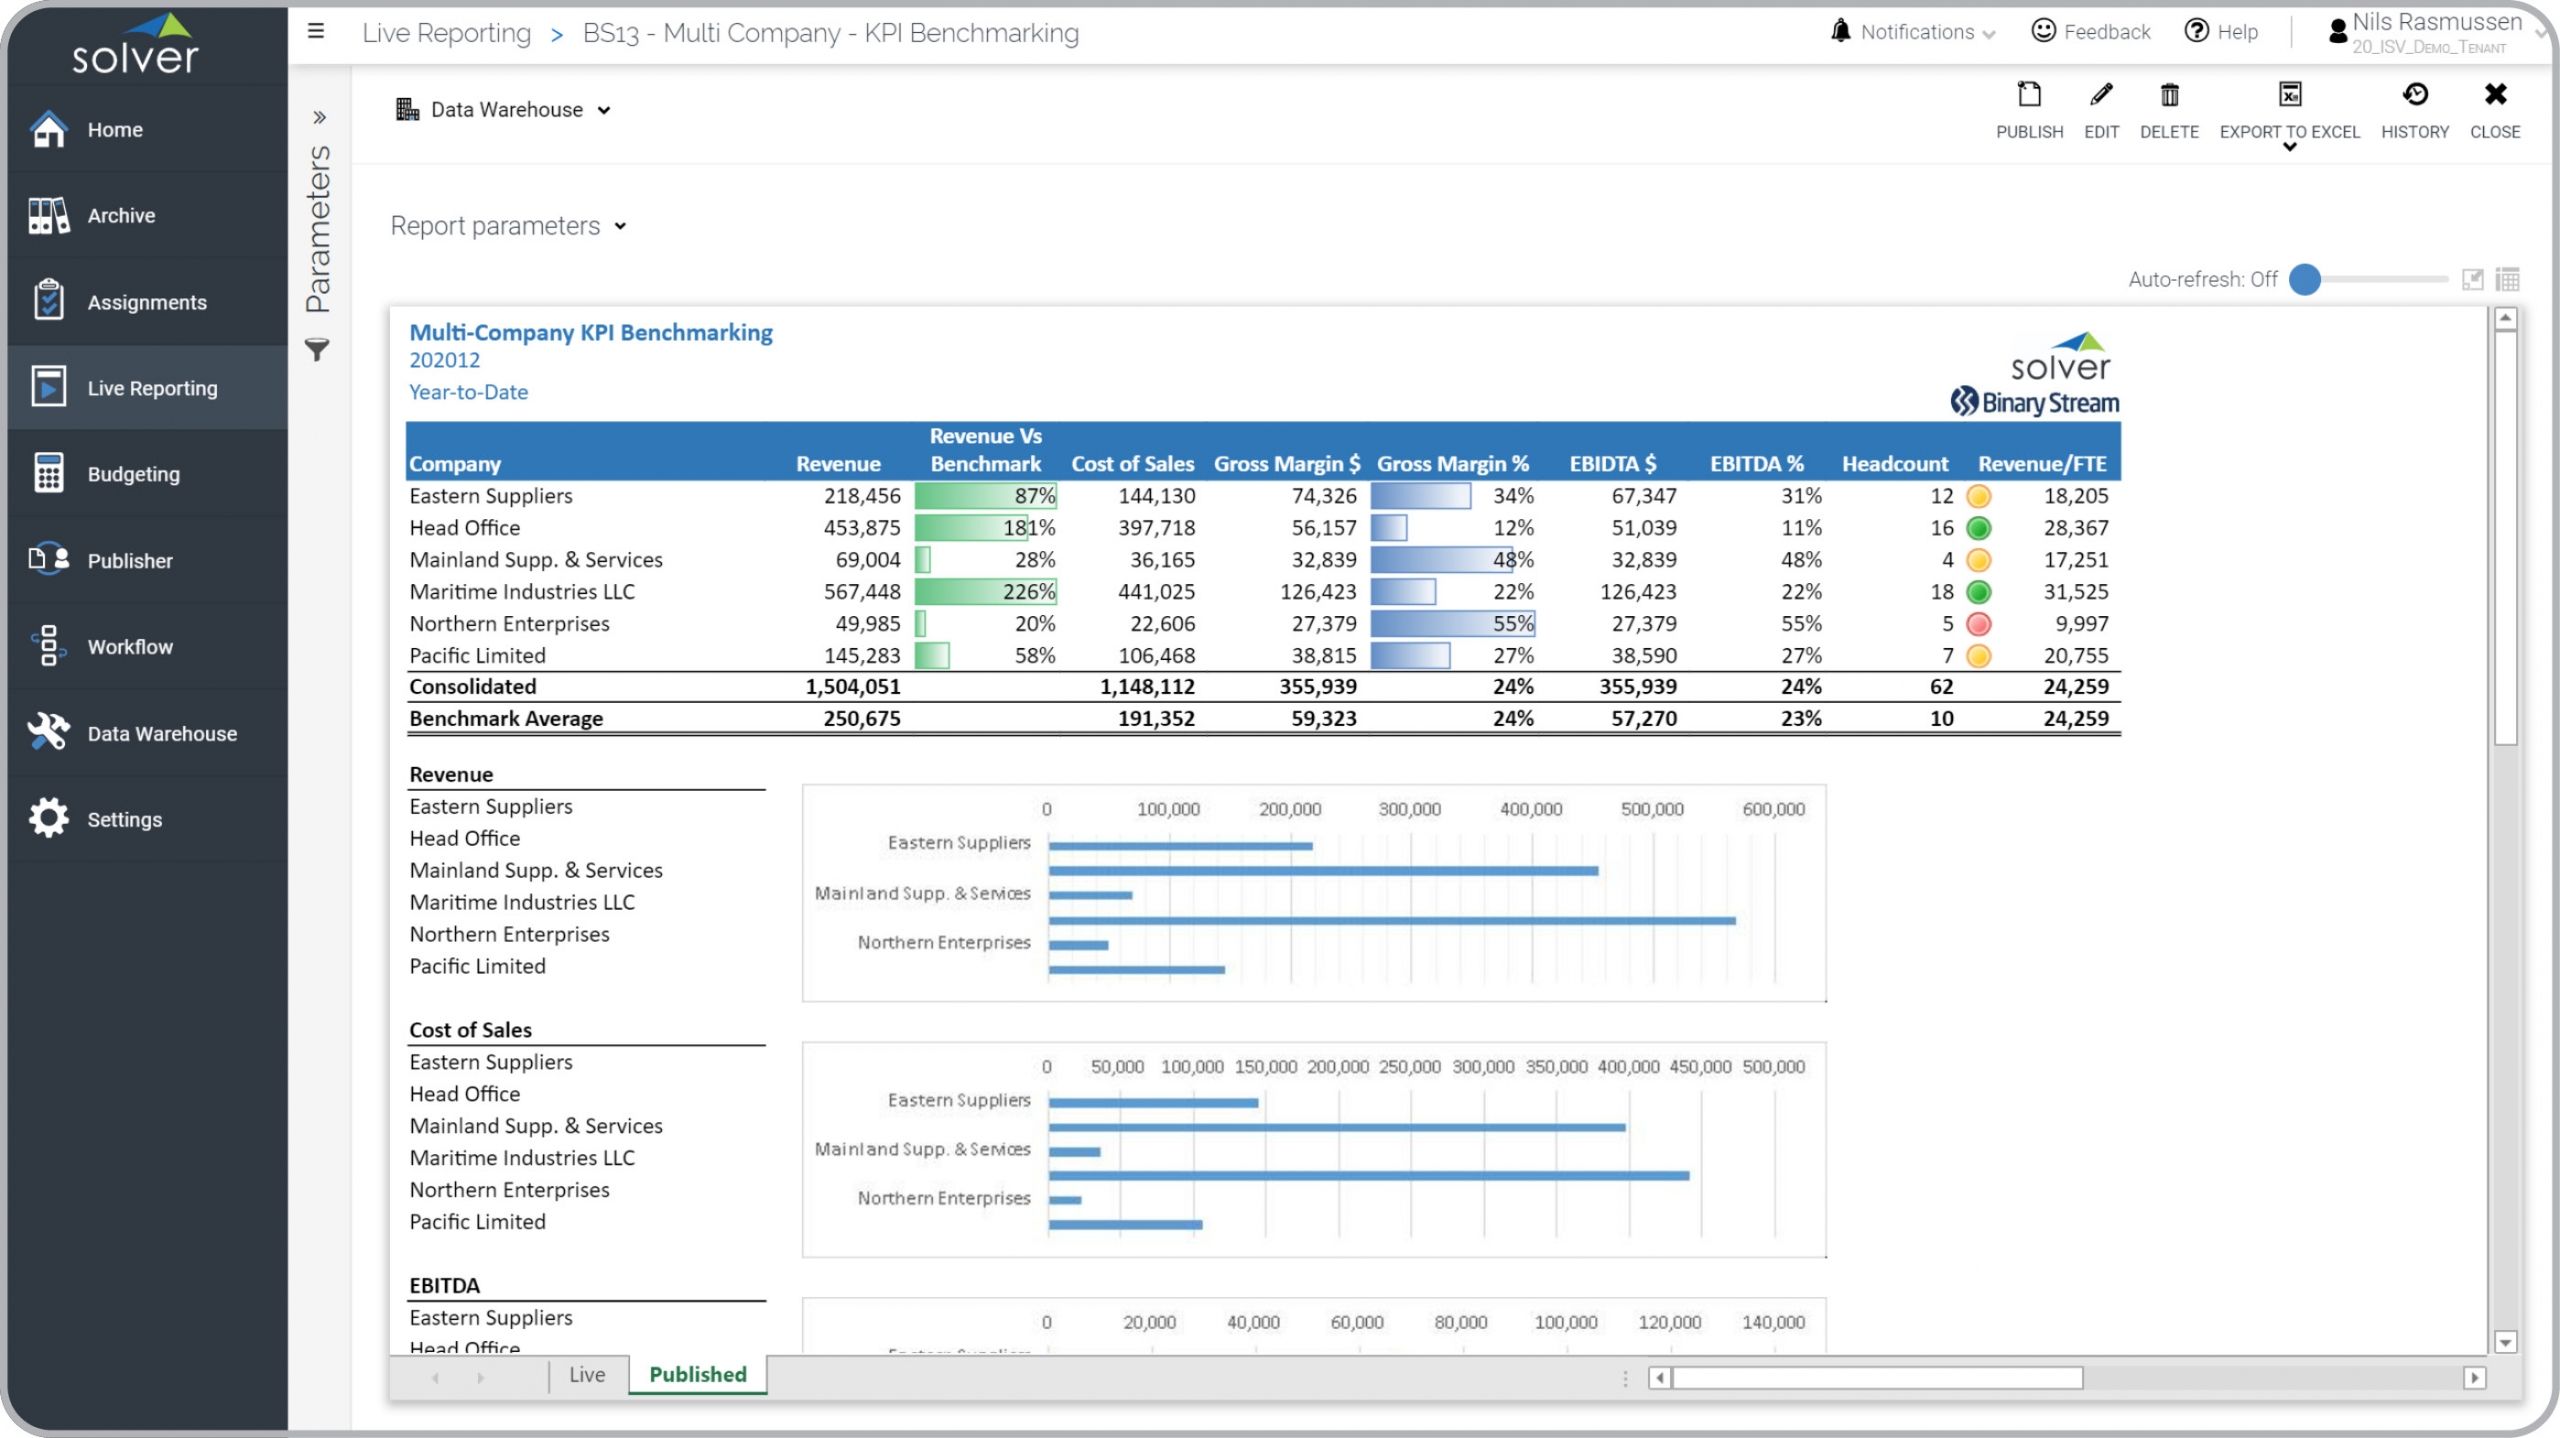
Multi-company KPI Benchmarking
Based on data from Binary Stream's Multi-Entity Management for Microsoft Dynamics.
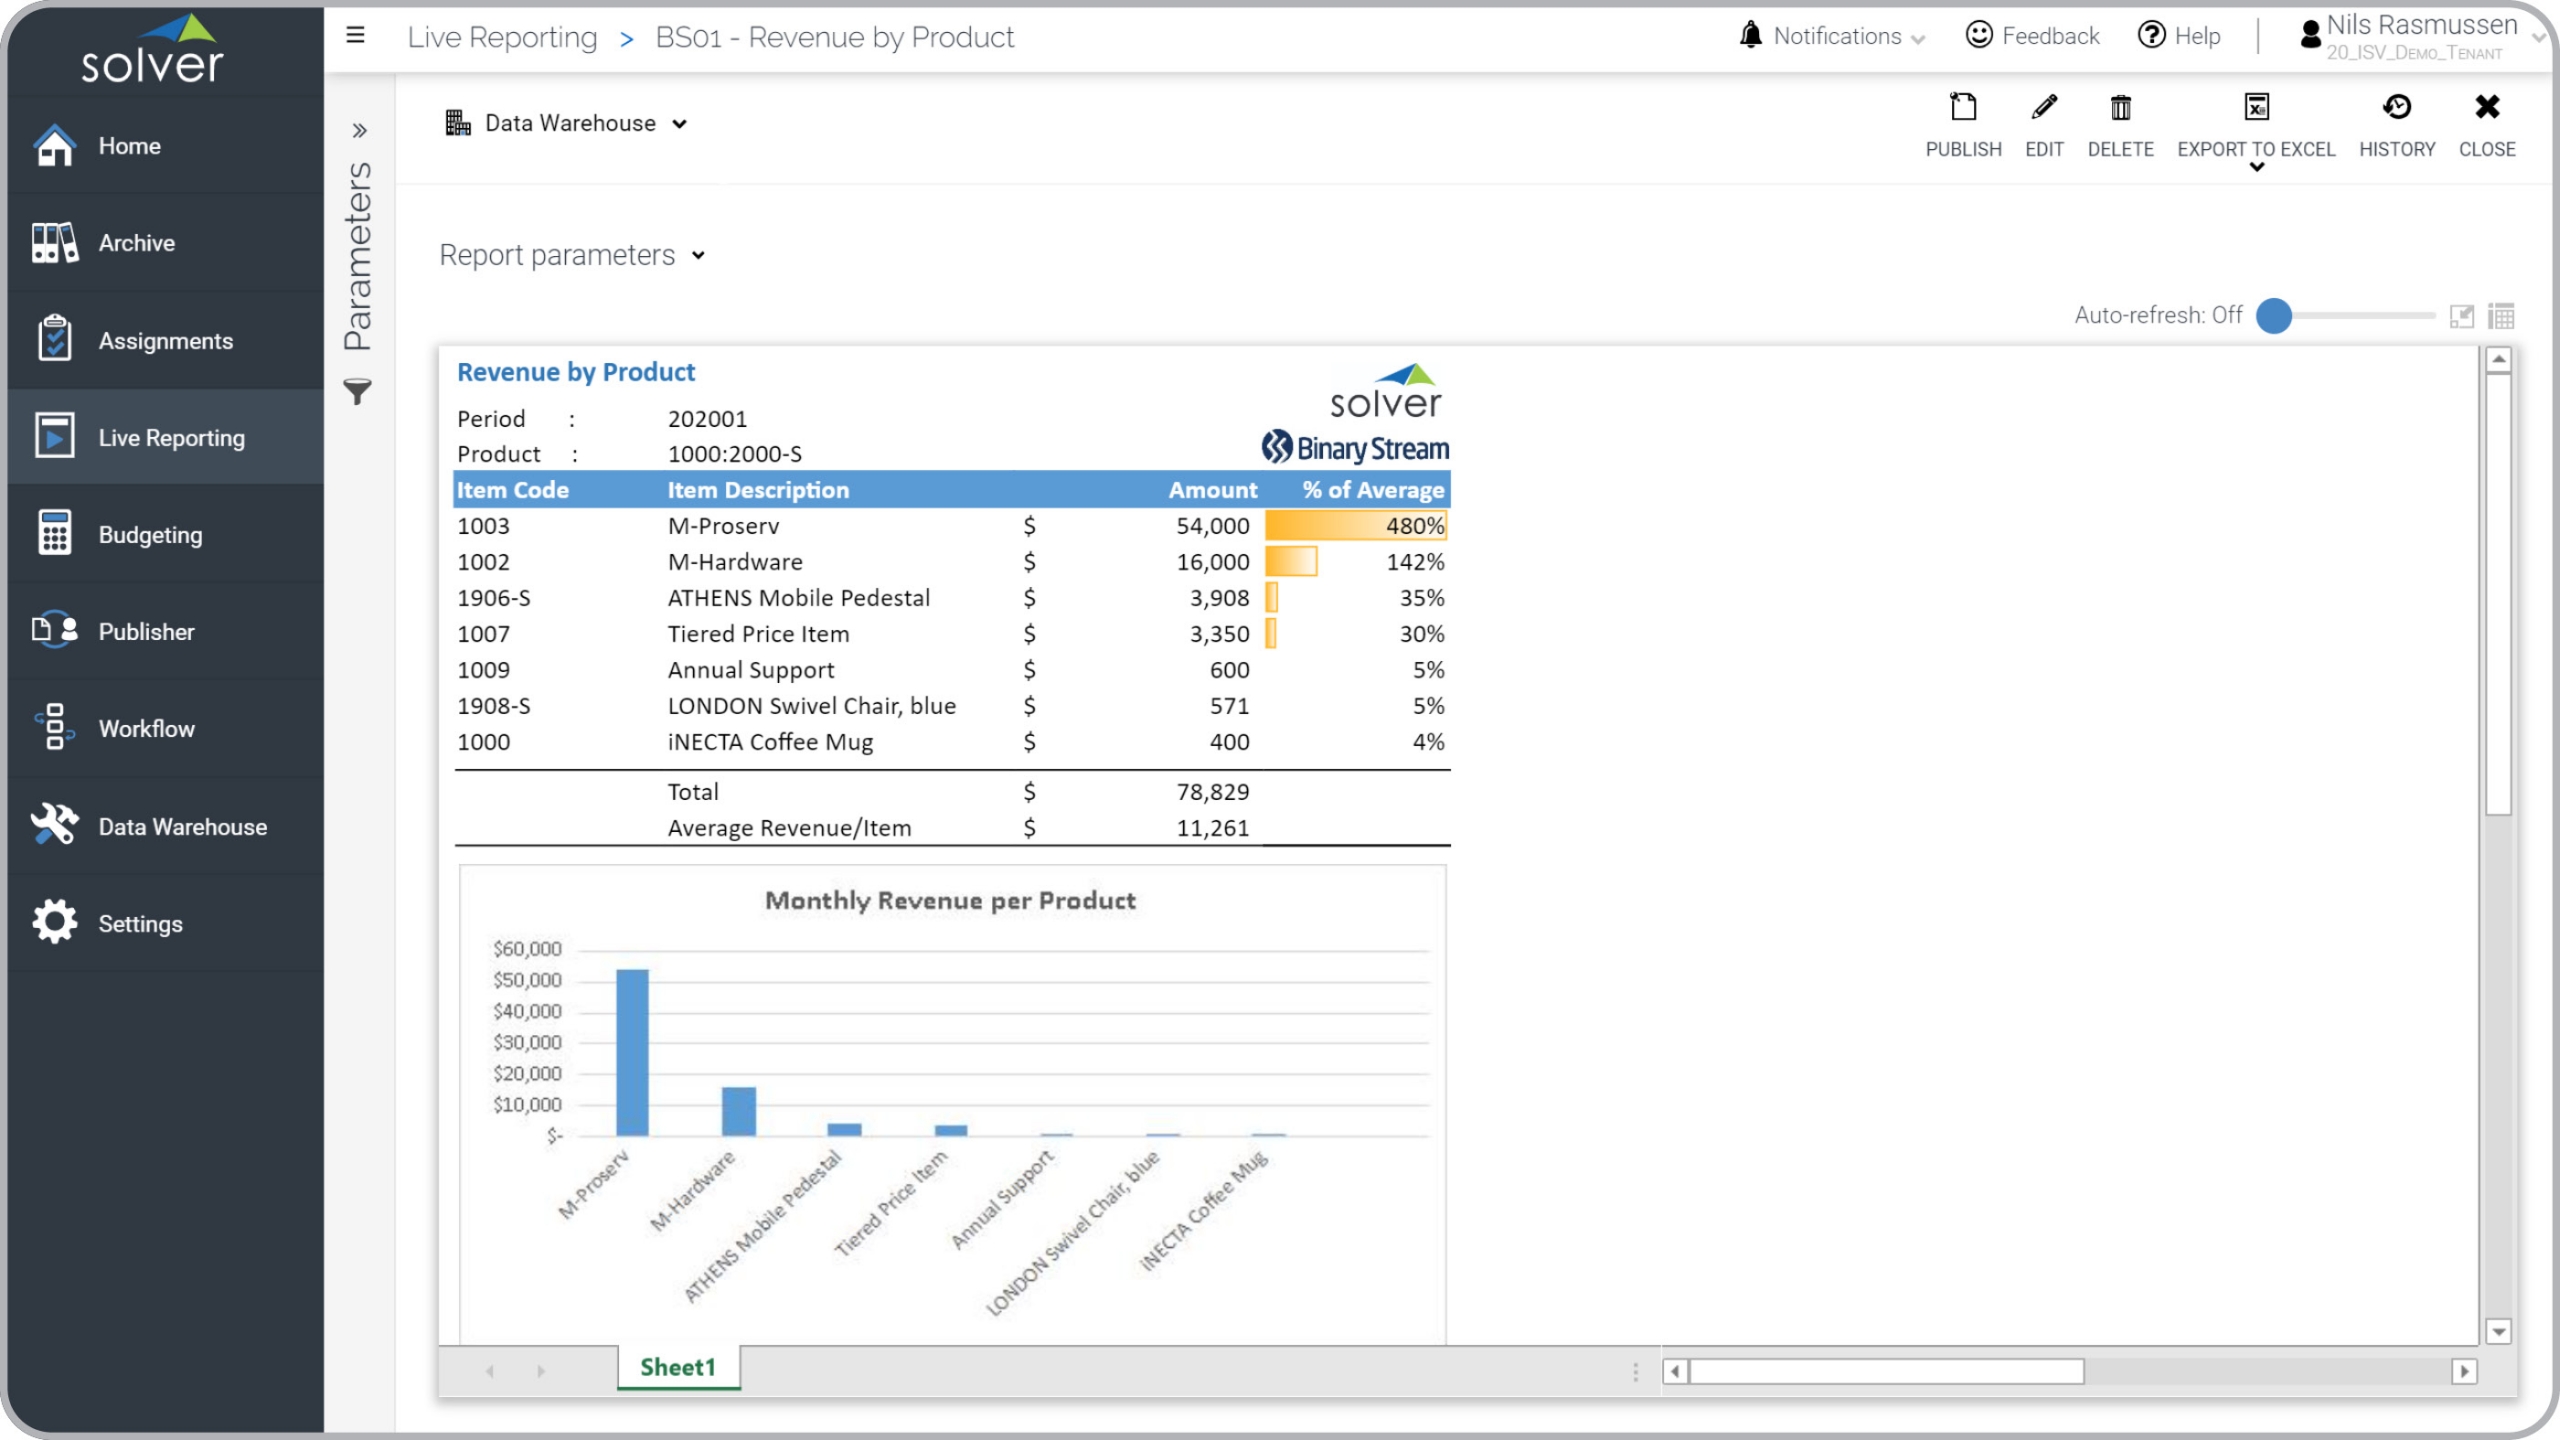
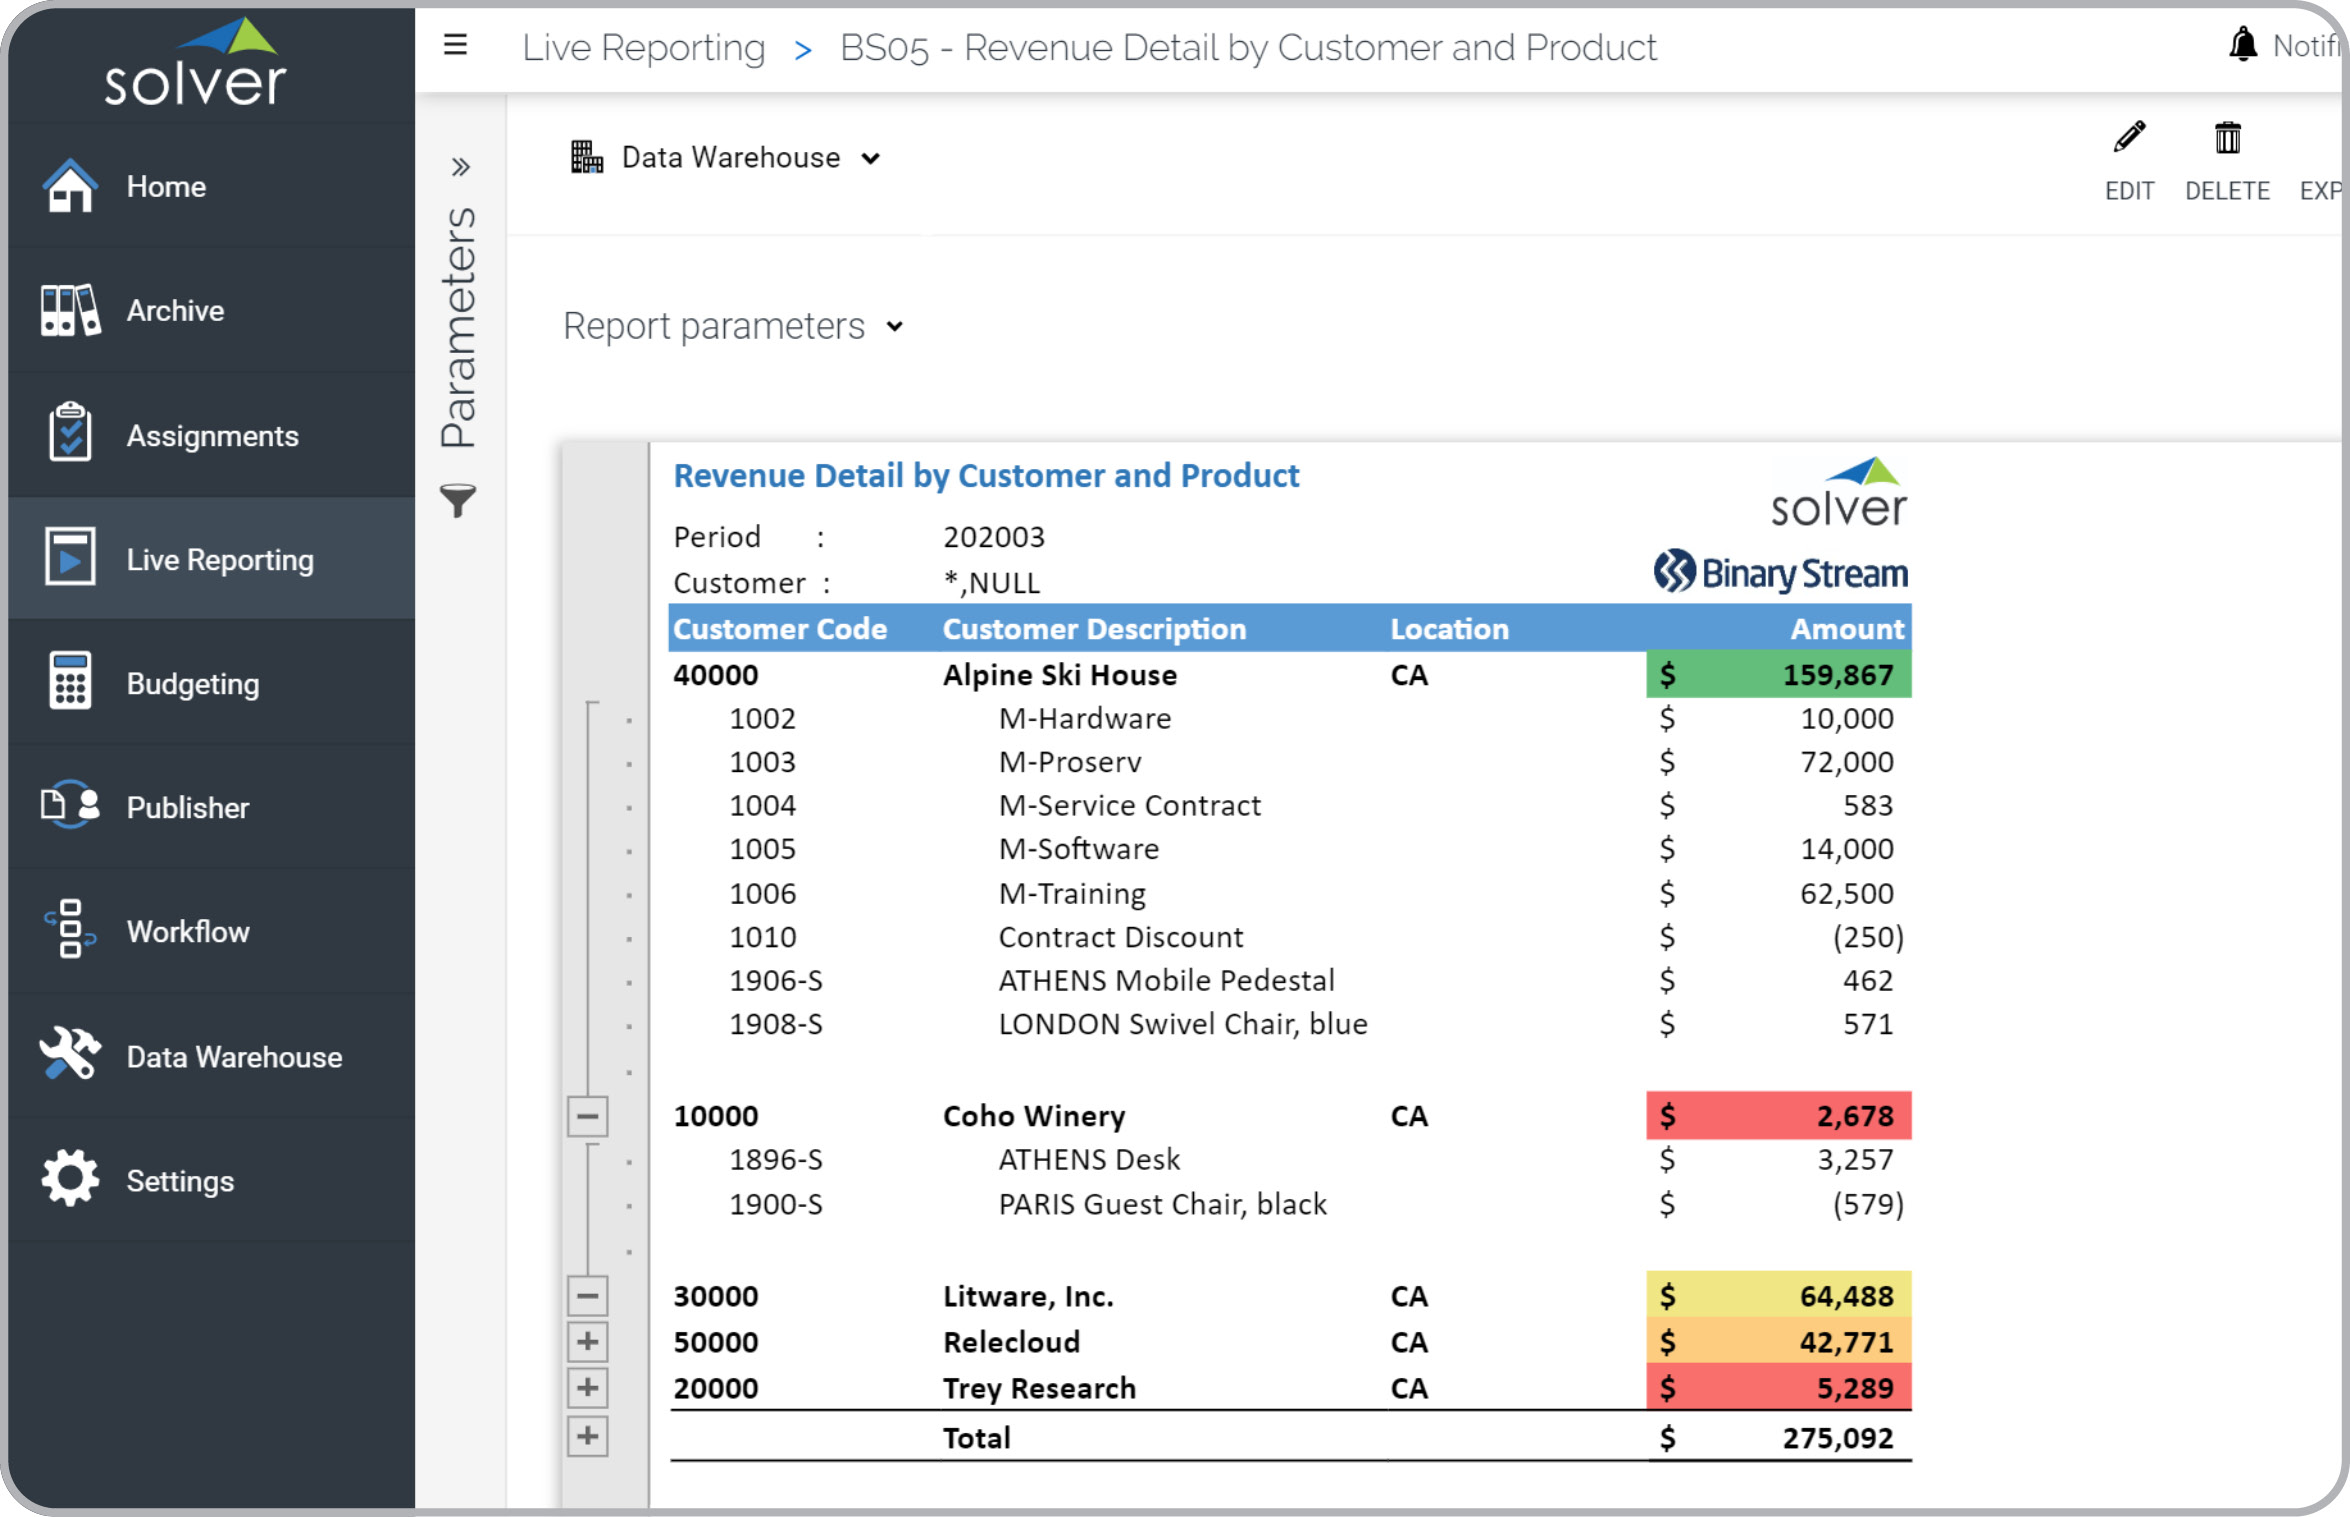
Subscription Revenue by Product
Shows monthly revenue by item code with % of average. Sample data from Binary Stream.
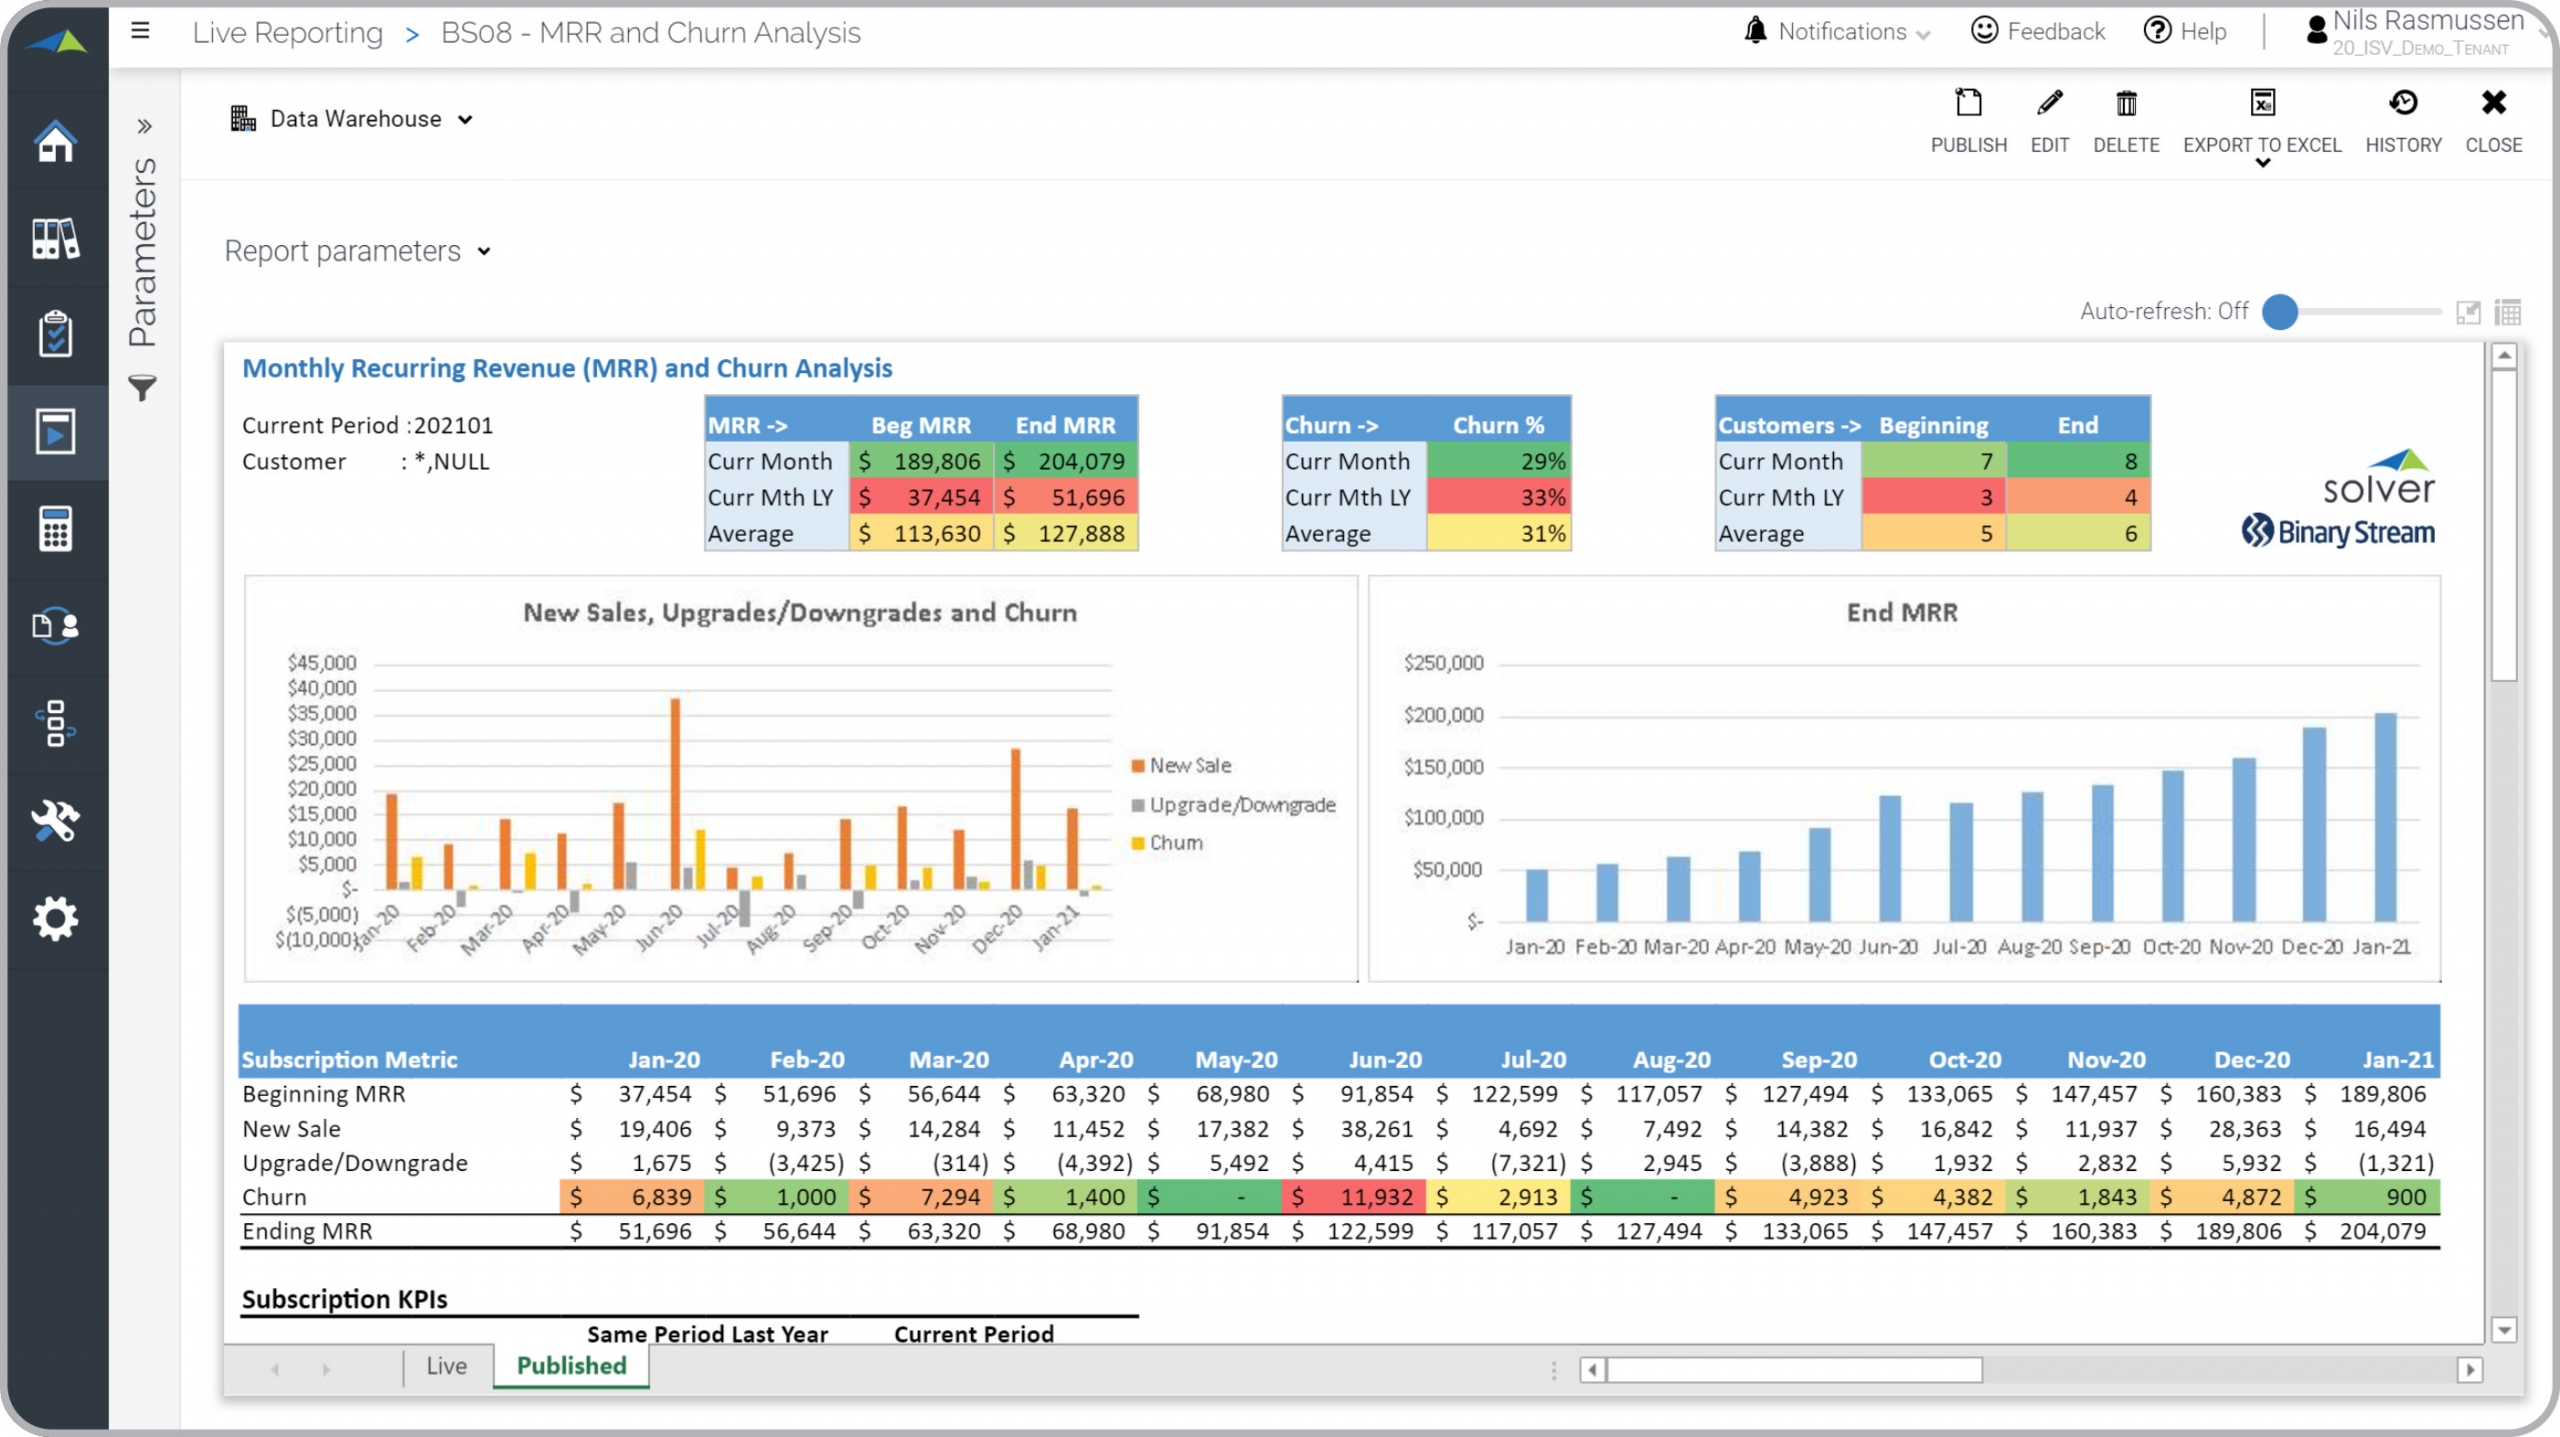
Recurring Revenue & Churn Analysis
Subscription report with monthly MRR and Churn metrics. Sample data from Binary Stream.
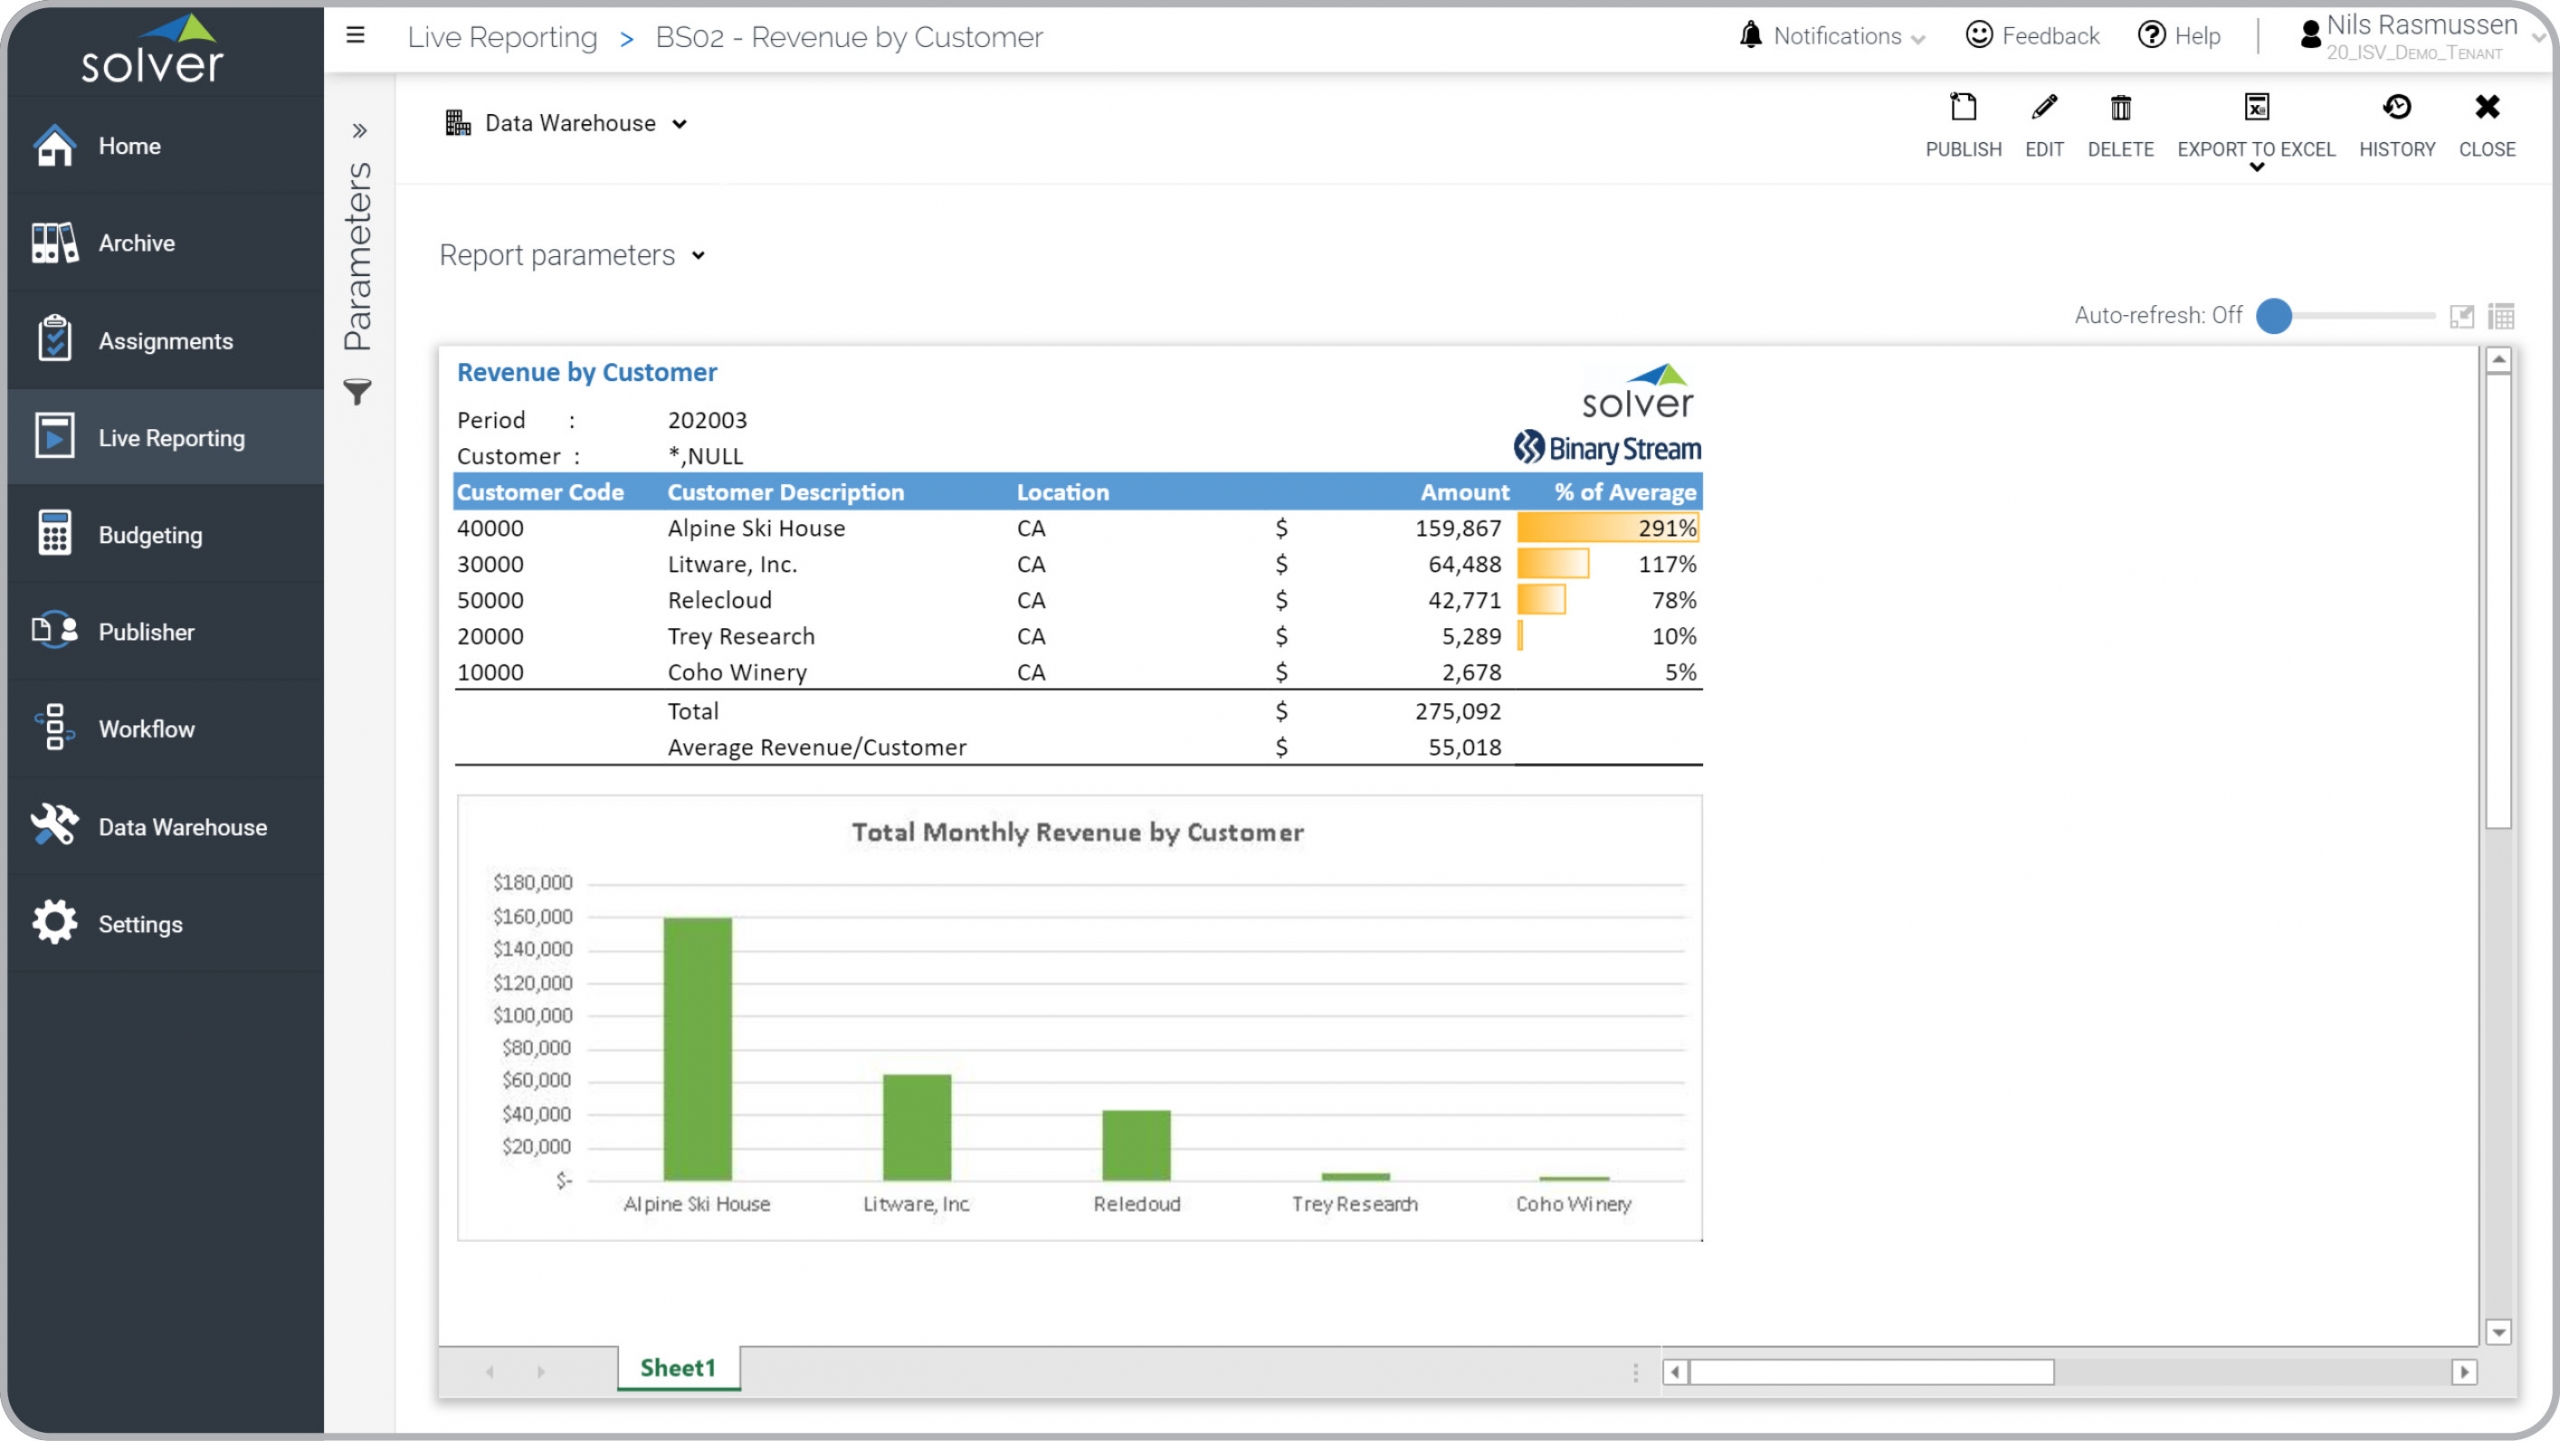
Subscription Revenue by Customer
Shows monthly revenue by customer with % of average. Sample data from Binary Stream.
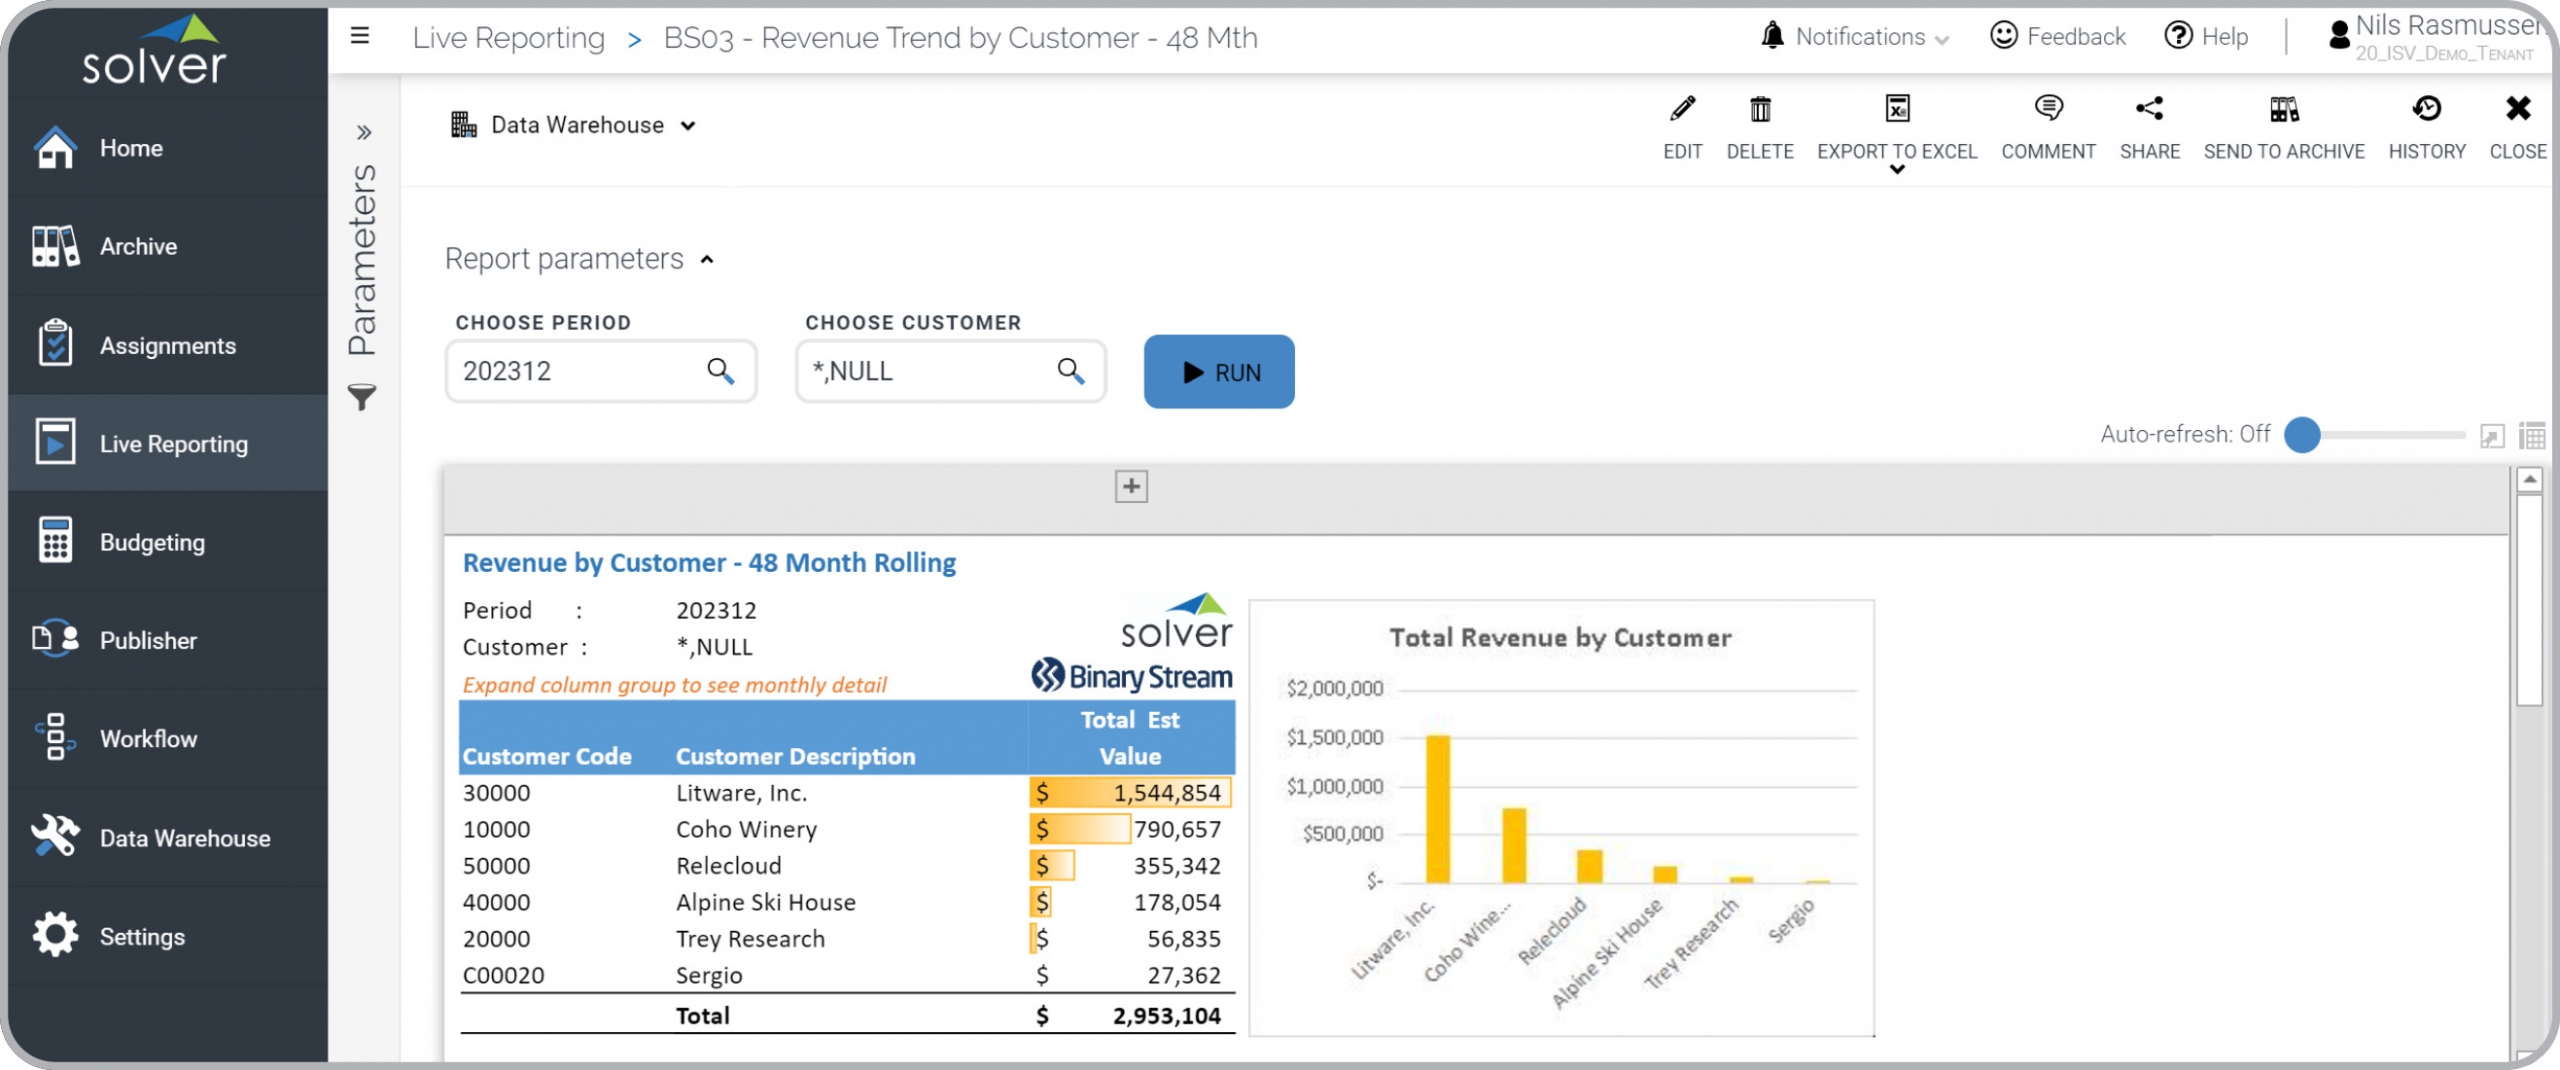
Subscription Revenue Trend
The Total column expands to display 48 months of revenue by customer. Sample data from Binary Stream.
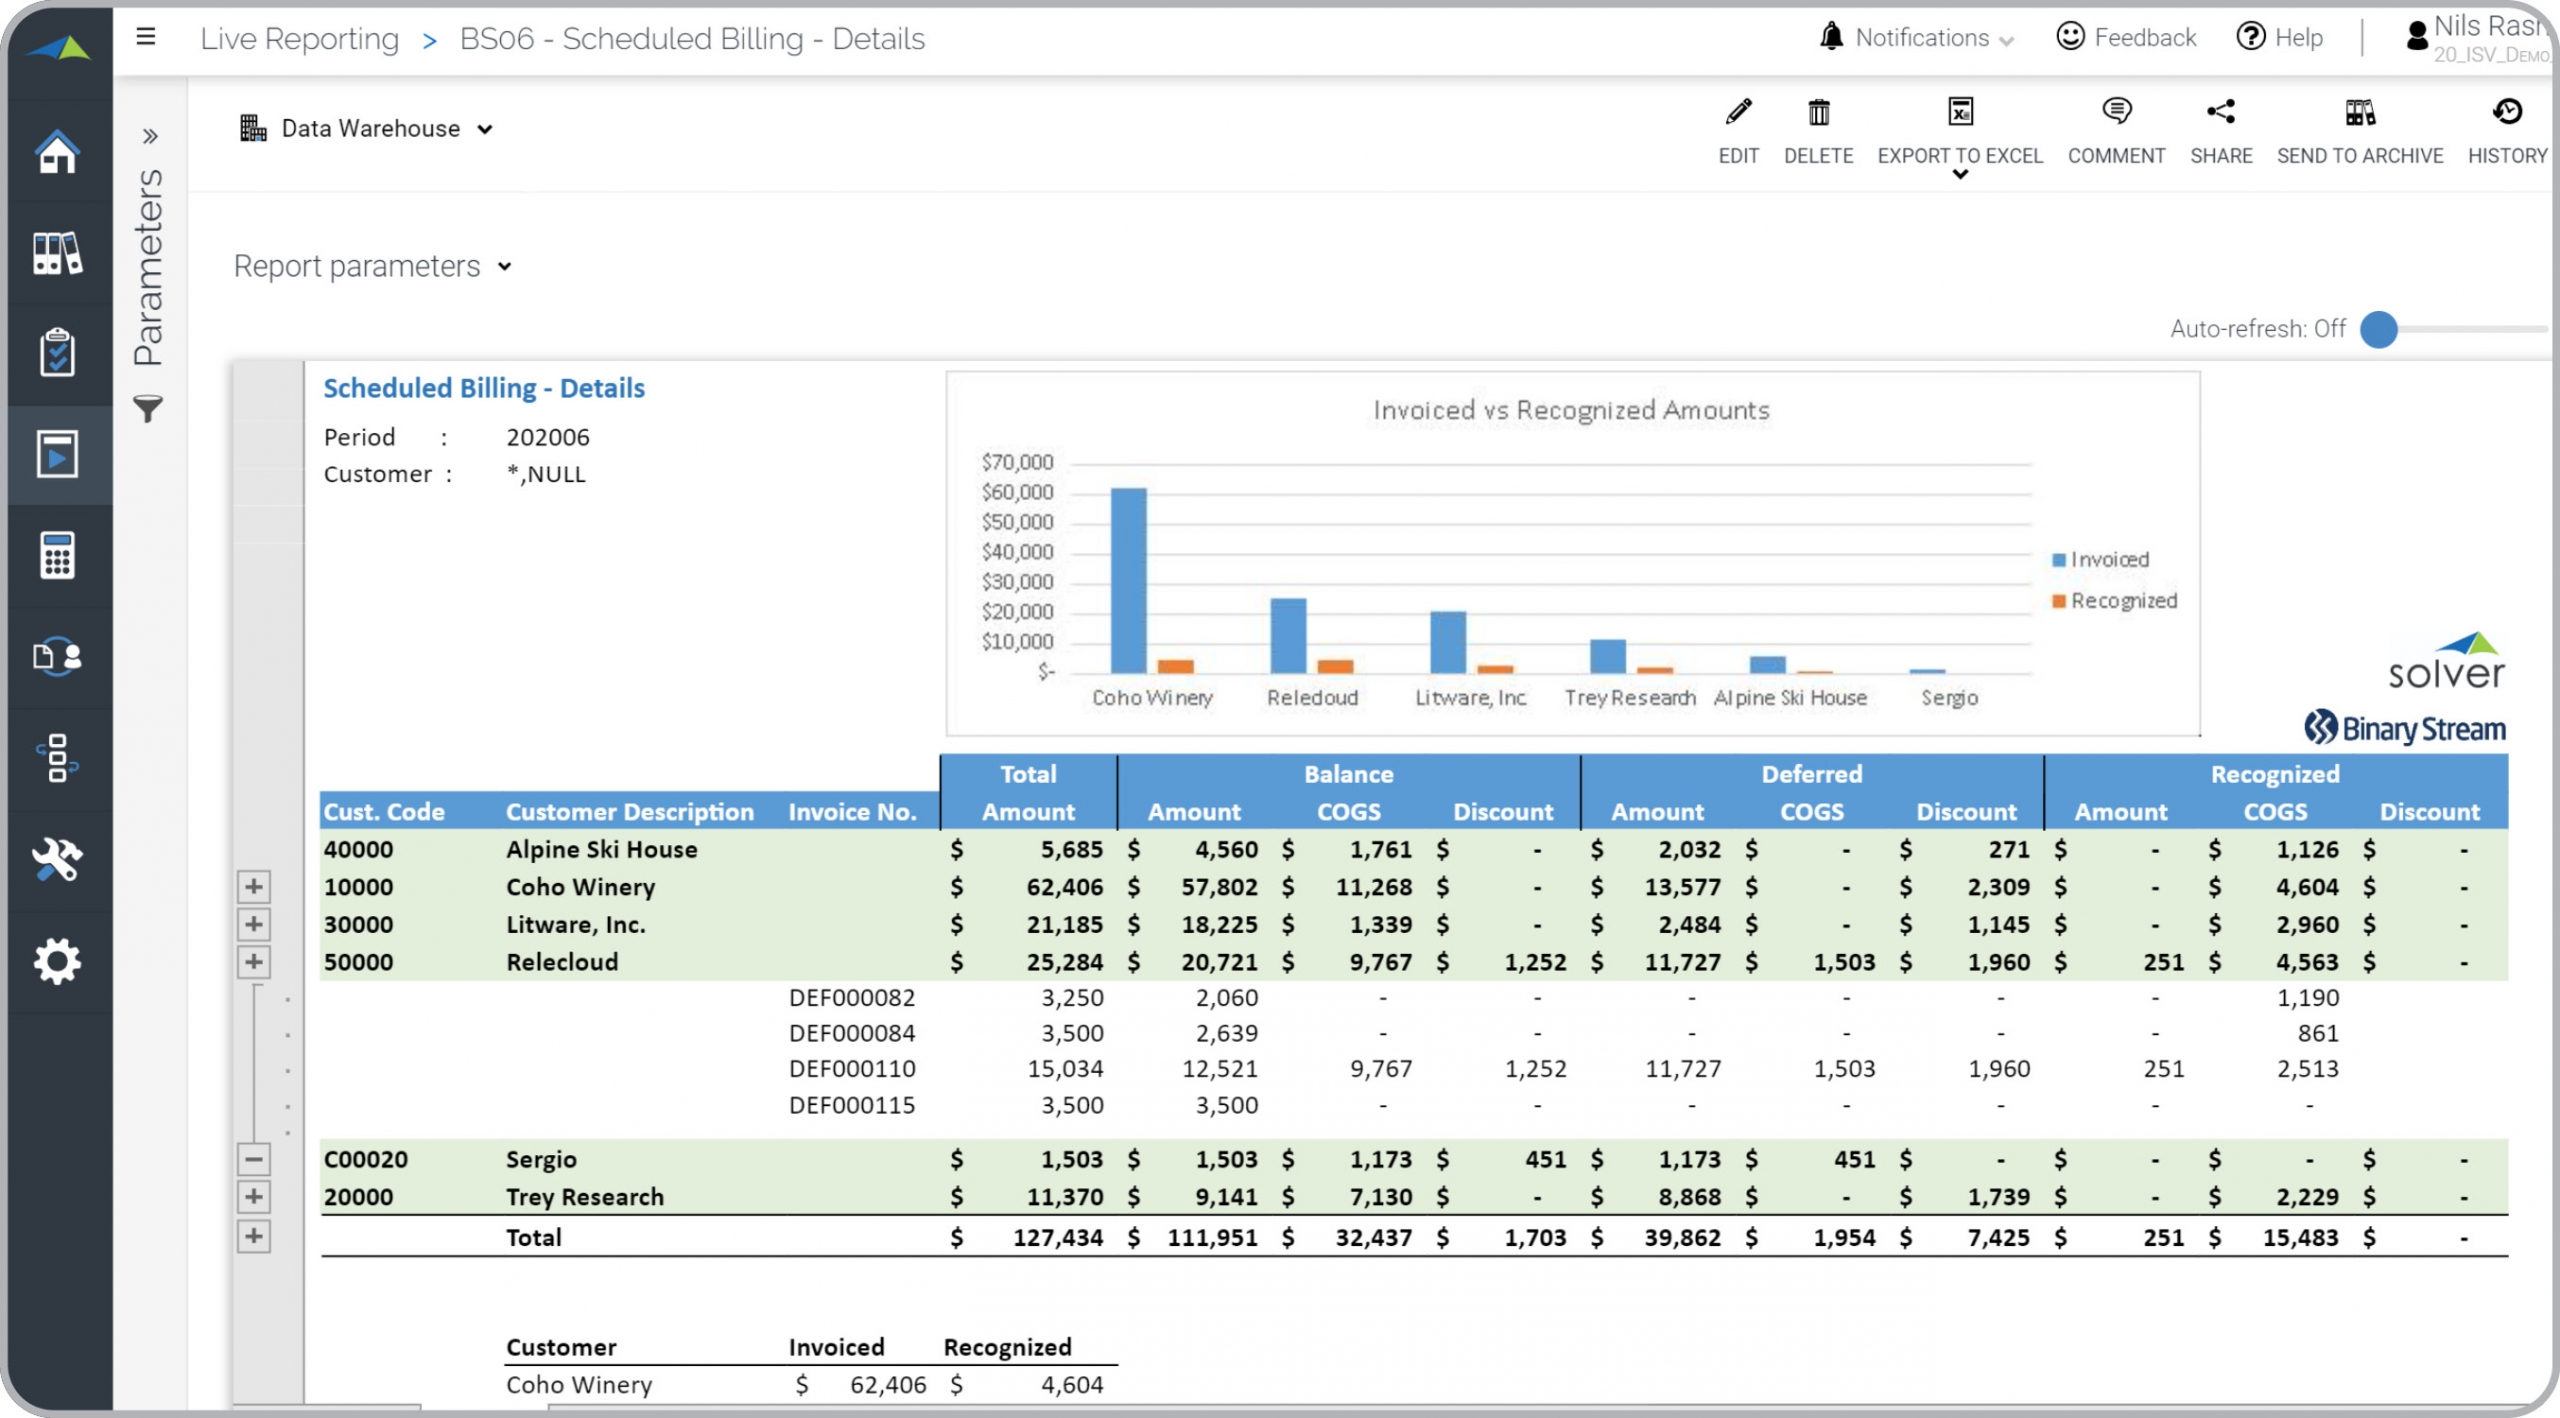
Scheduled Billing by Customer
Scheduled subscription billing with deferred and recognized amounts. Sample data from Binary Stream.
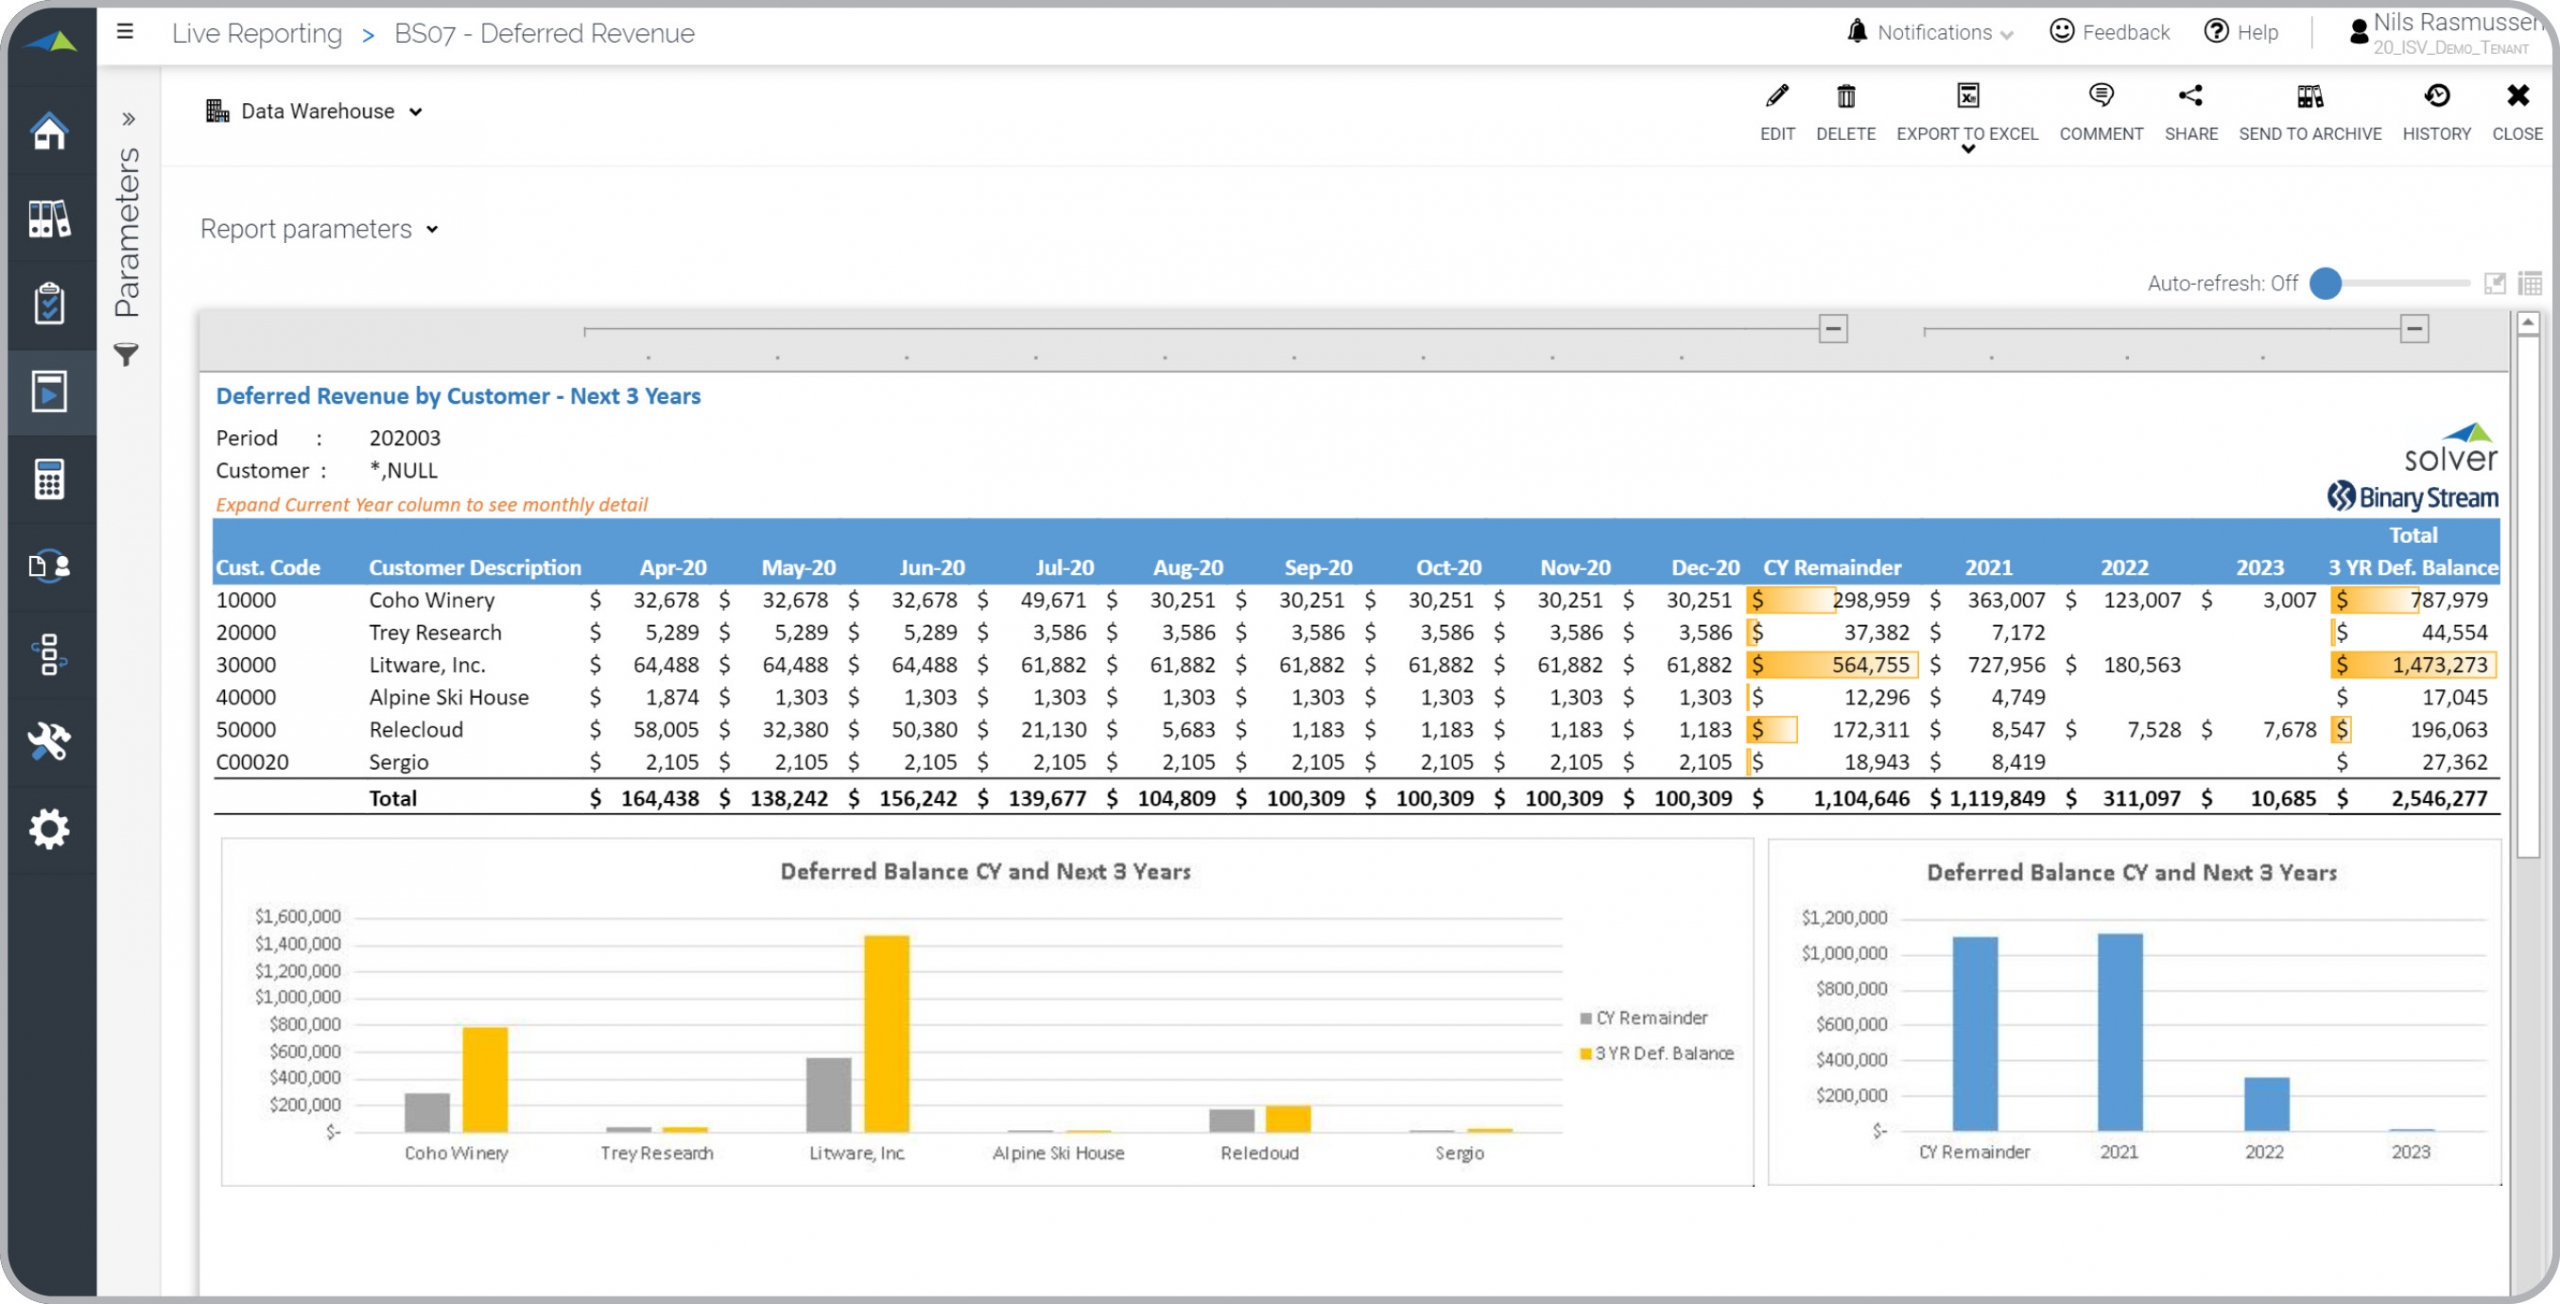
Deferred Subscription Revenue
Deferred subscription revenue for the current year and 3 years forward. Sample data from Binary Stream.
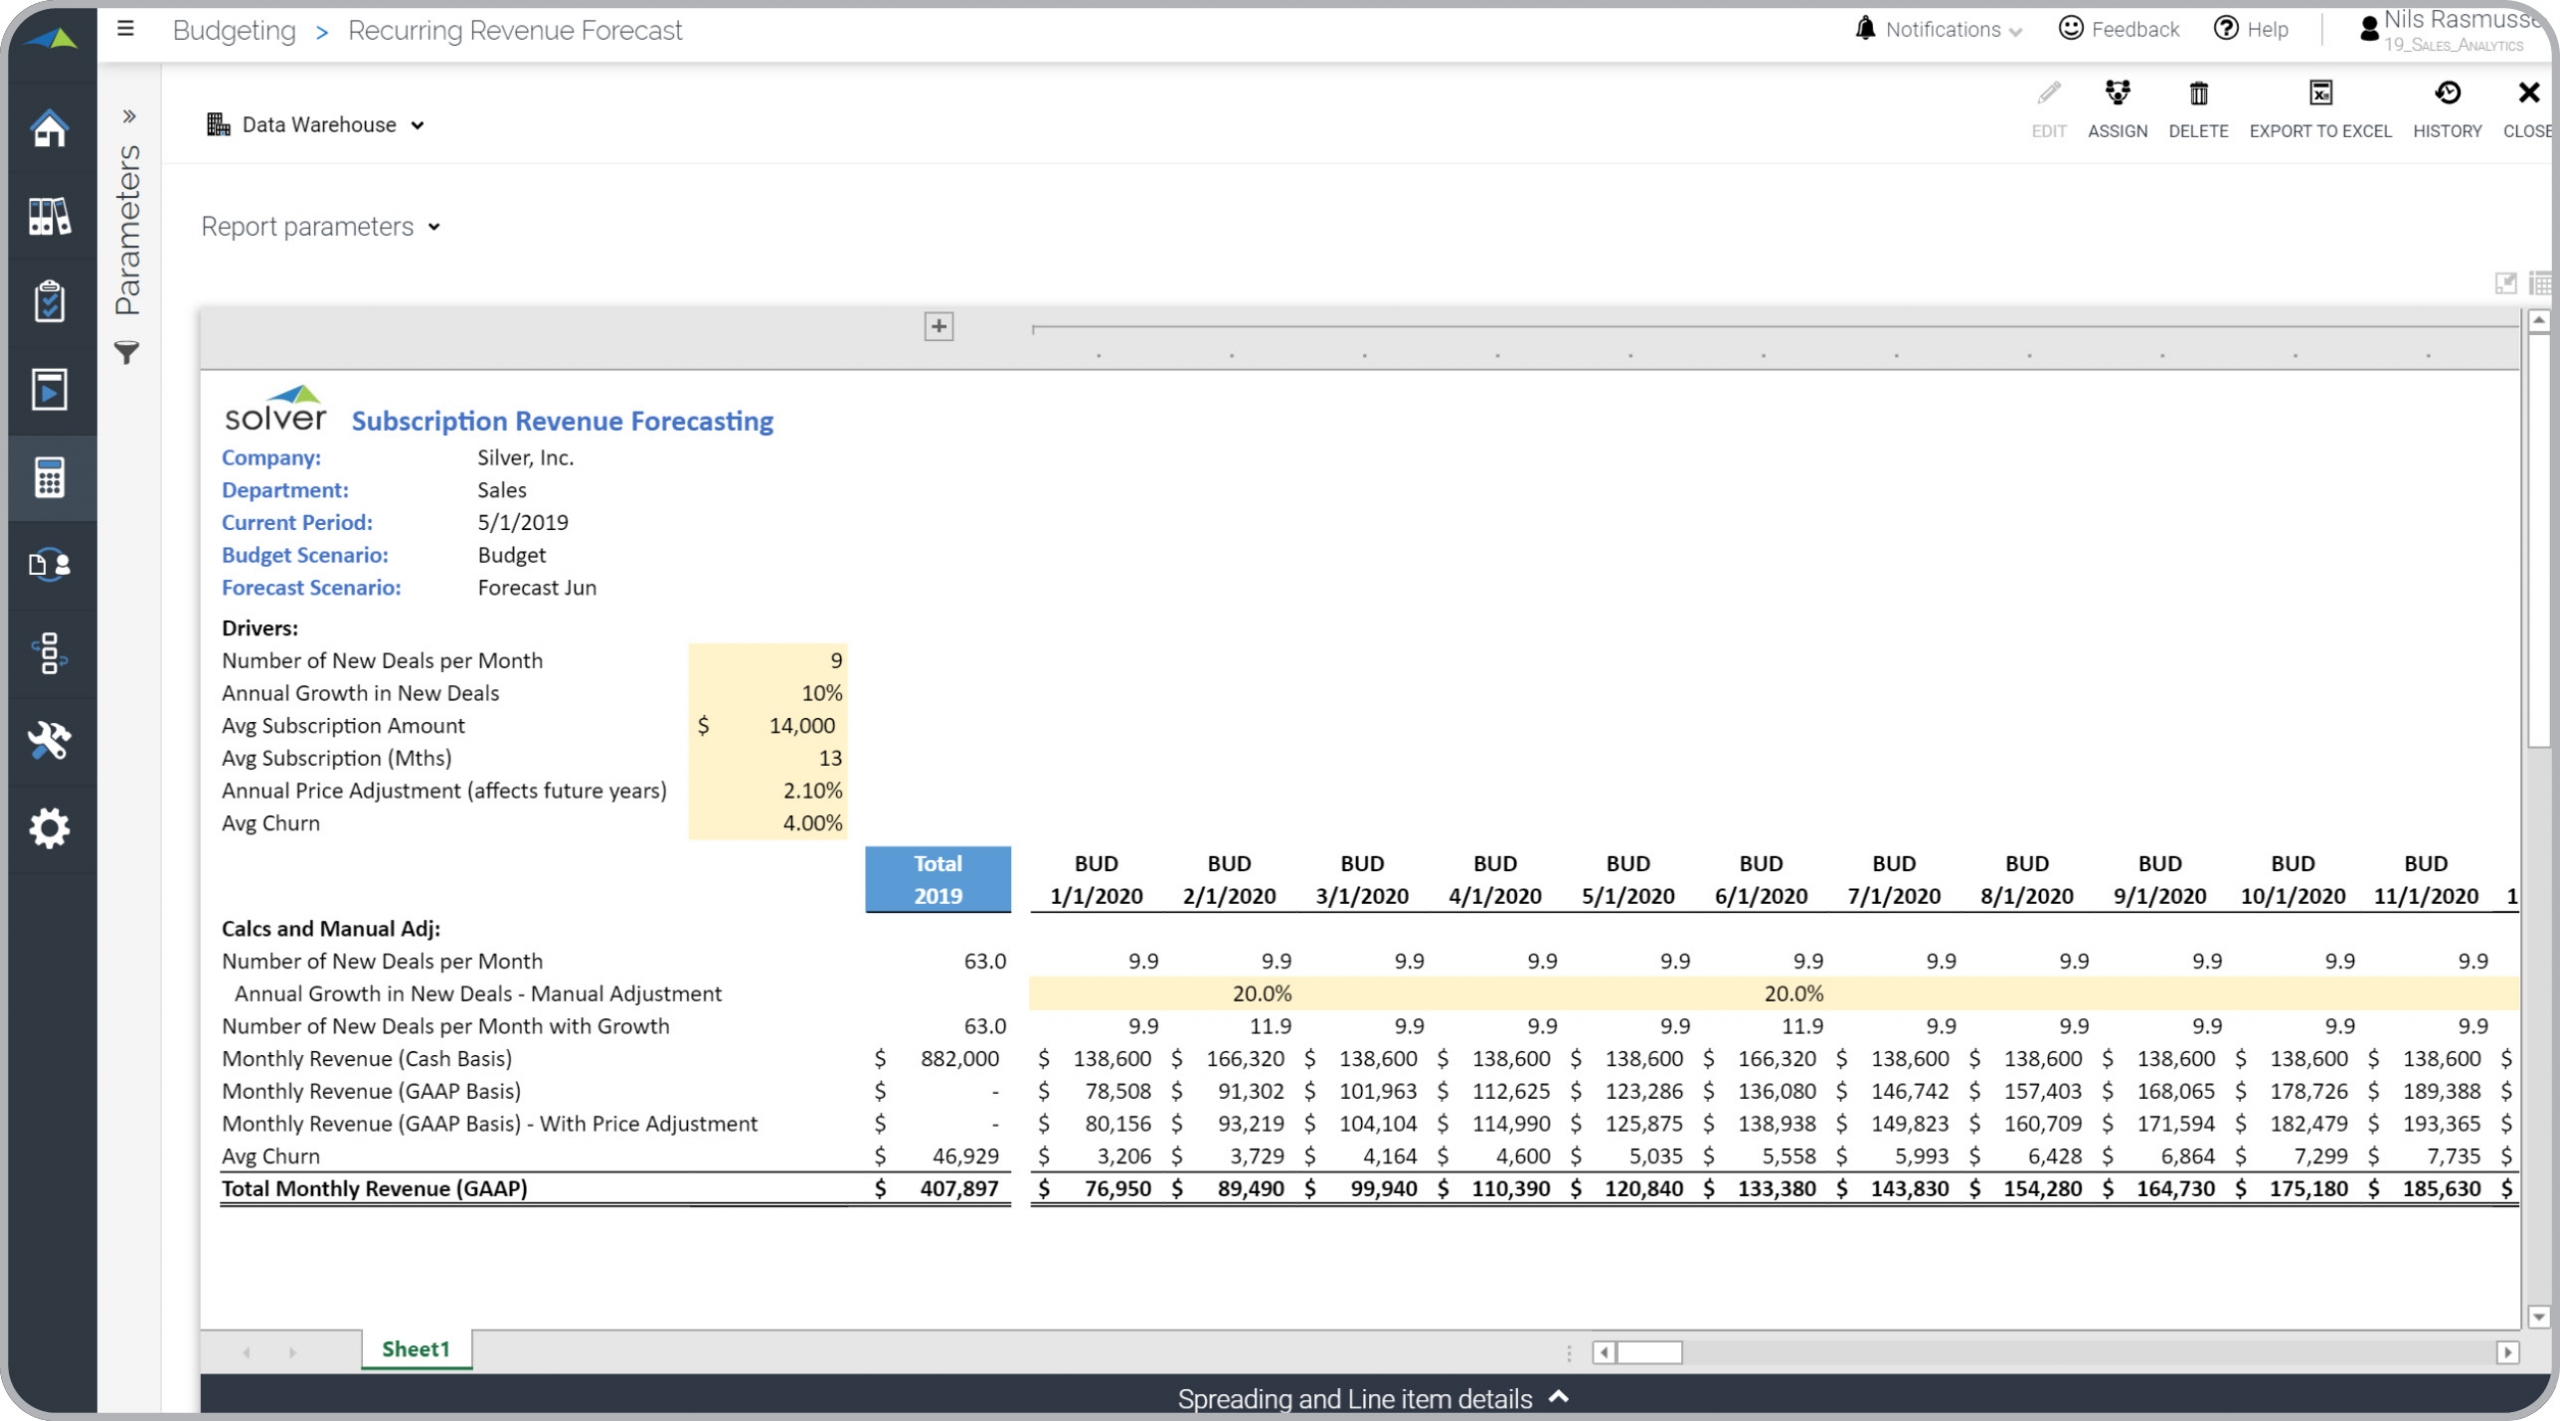
Recurring Revenue Forecast
Driver-based input calculates monthly subscription revenue for Current Year and 9 years forward.
Subscription Revenue by Customer and Product
Monthly subscription revenue by customer and then by product. Sample data from Binary Stream.
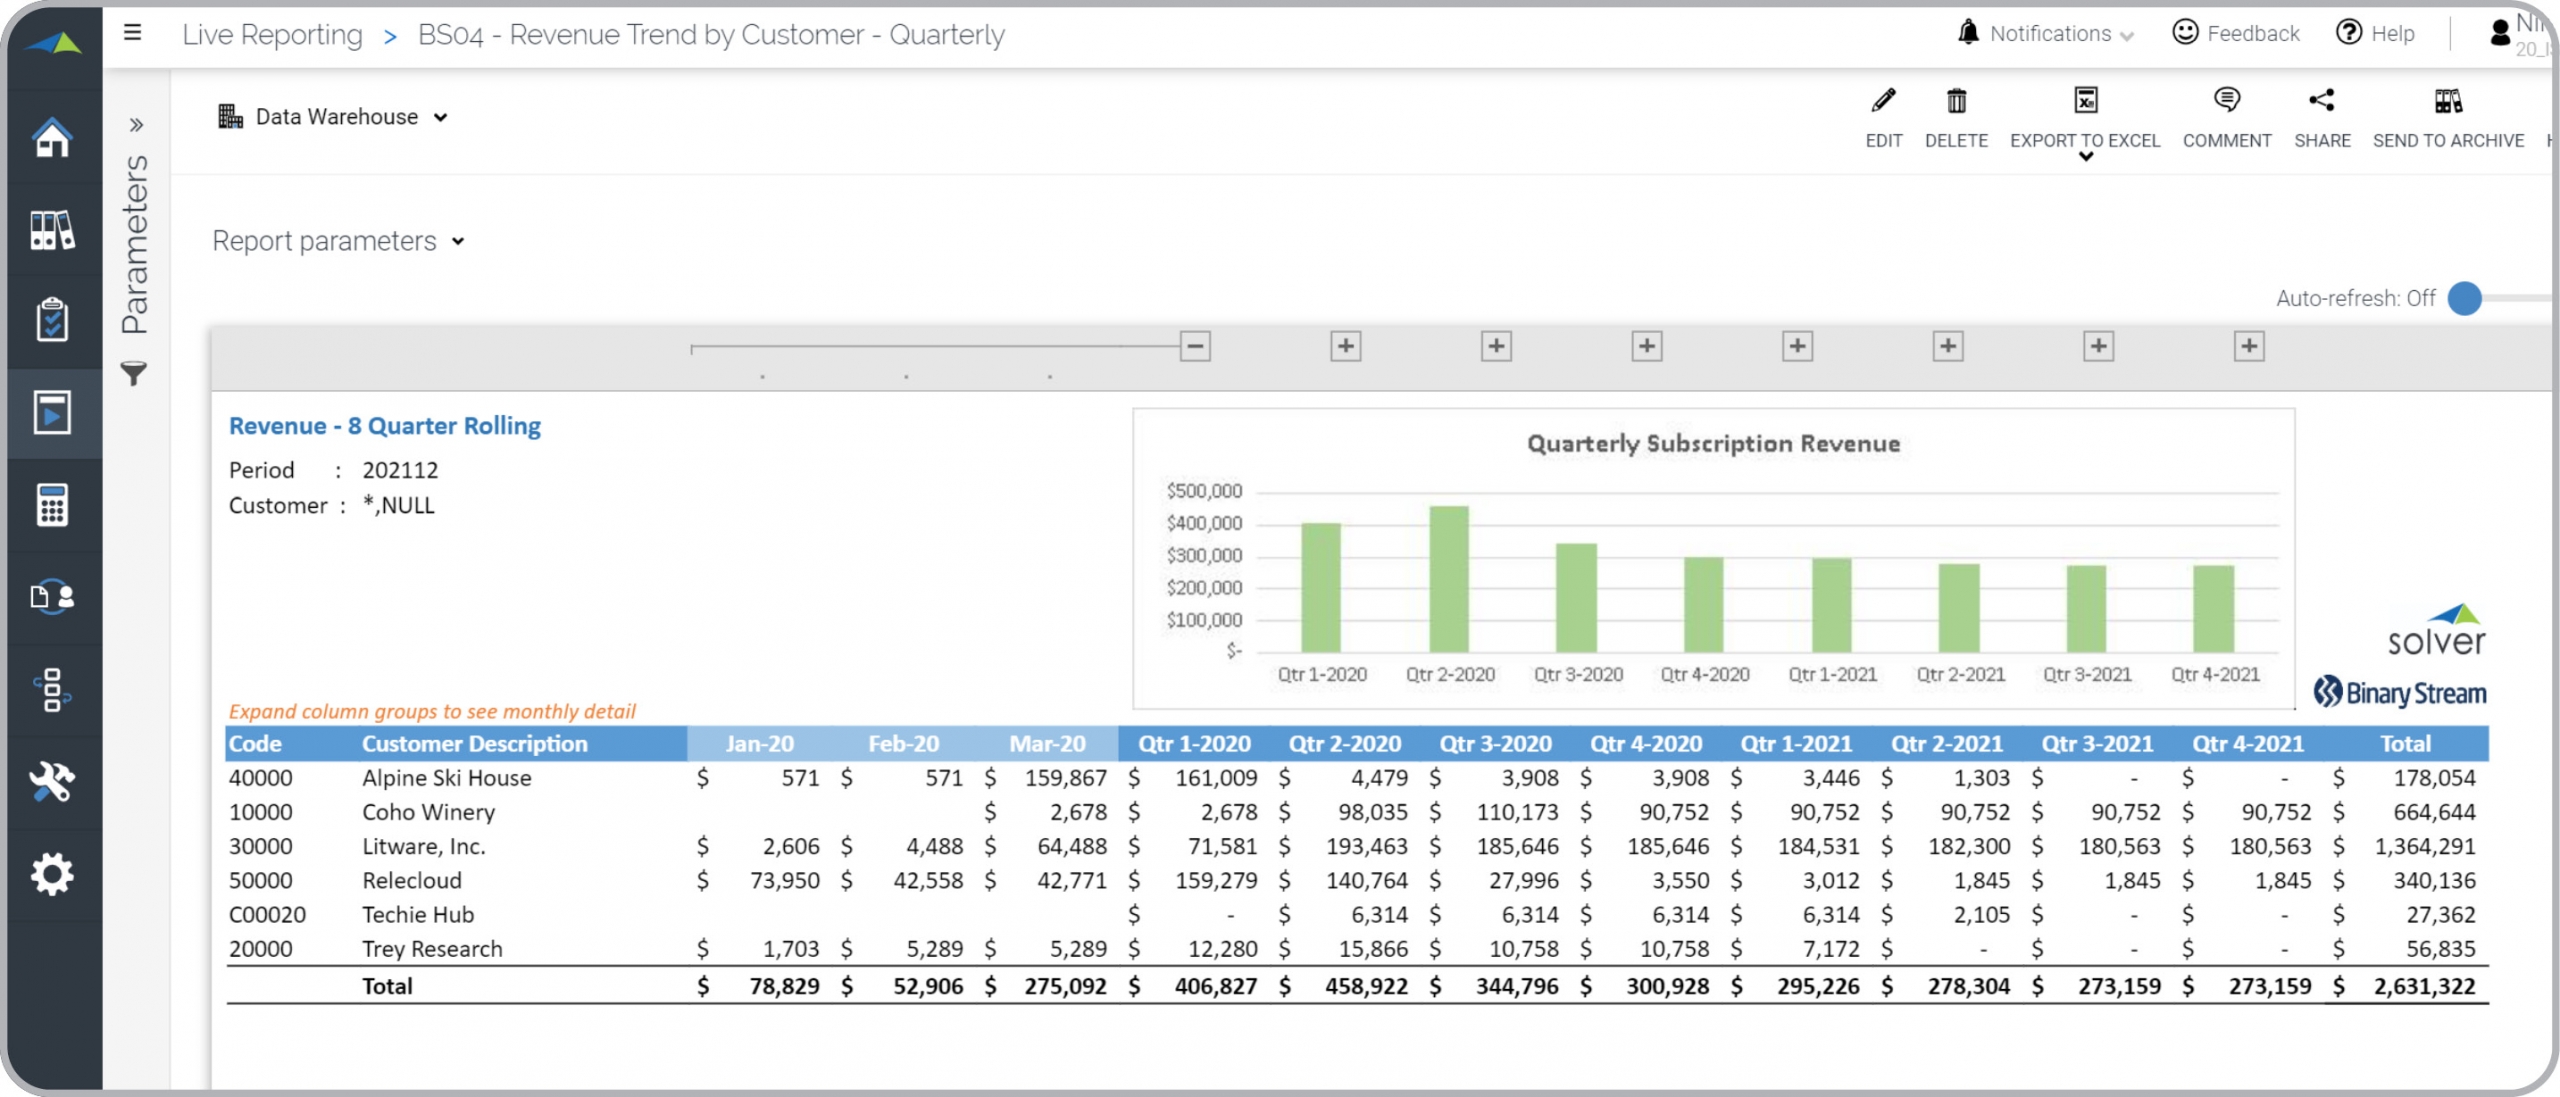
Subscription Revenue for 8 Quarters
Shows 8 rolling quarters of revenue. Each column expands to show months. Sample data from Binary Stream.
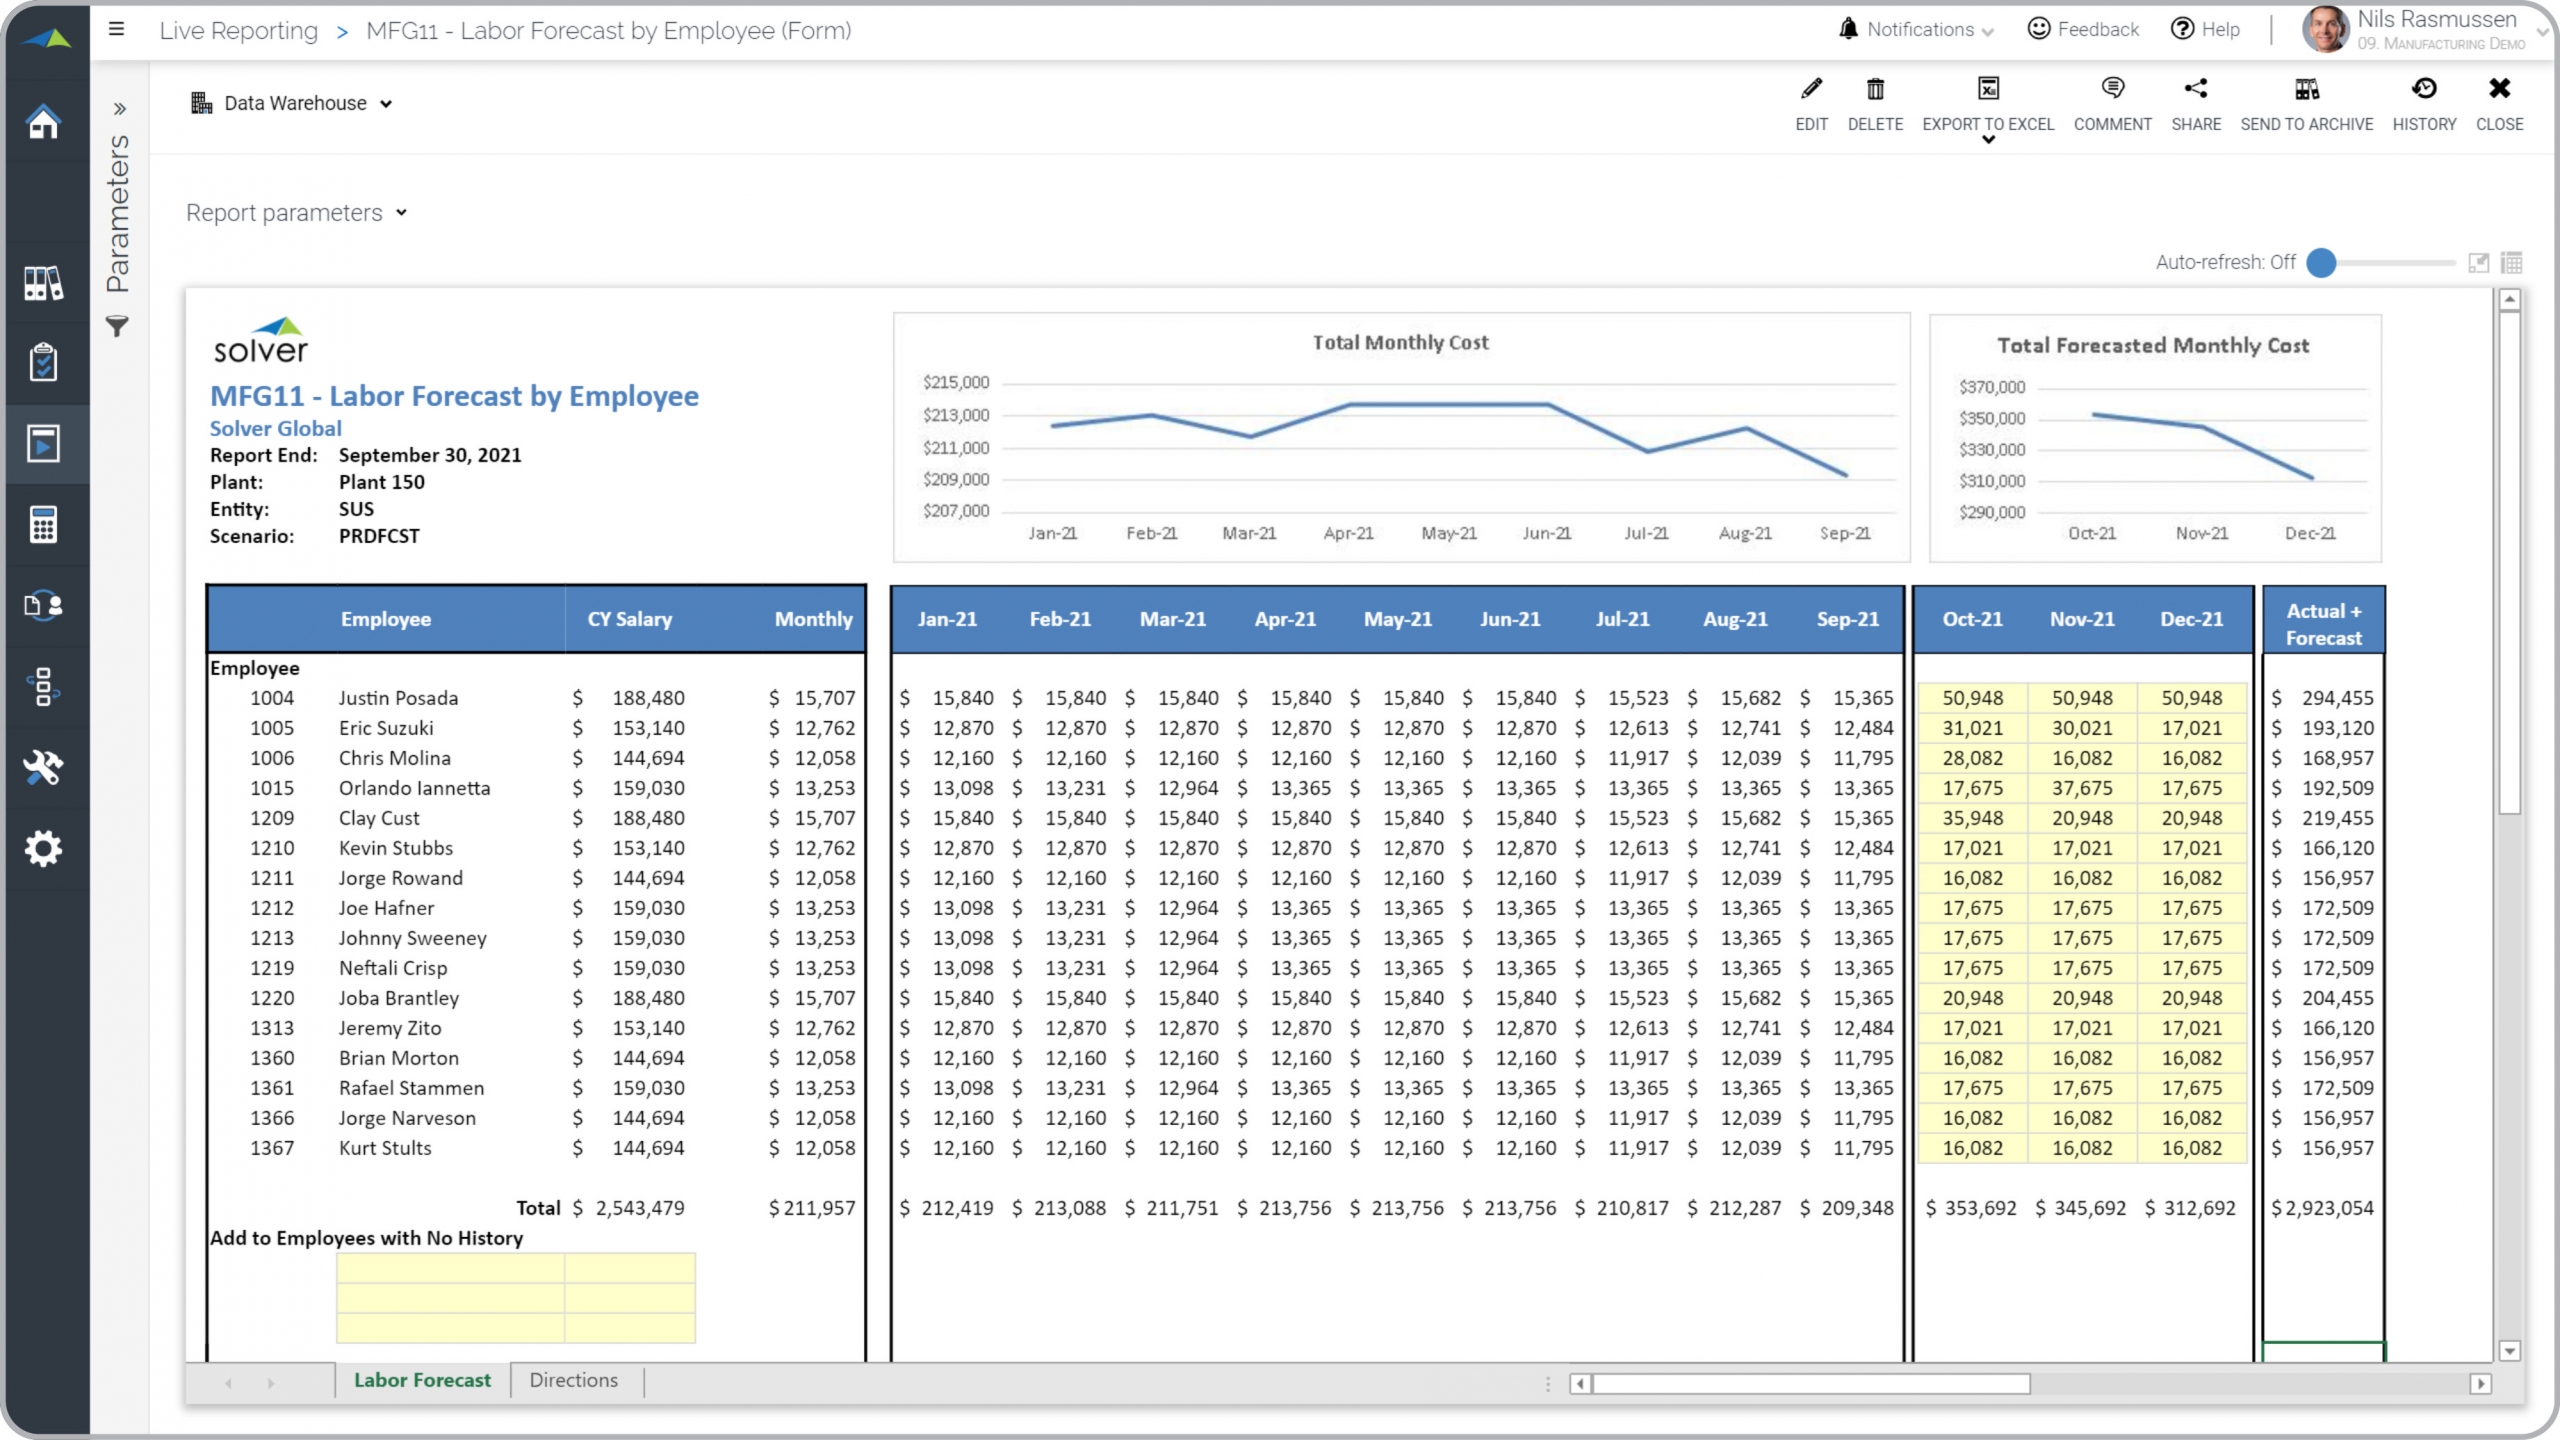
Mfg – Labor Forecast by Employee
Enter monthly salary forecast per FTE per plant.
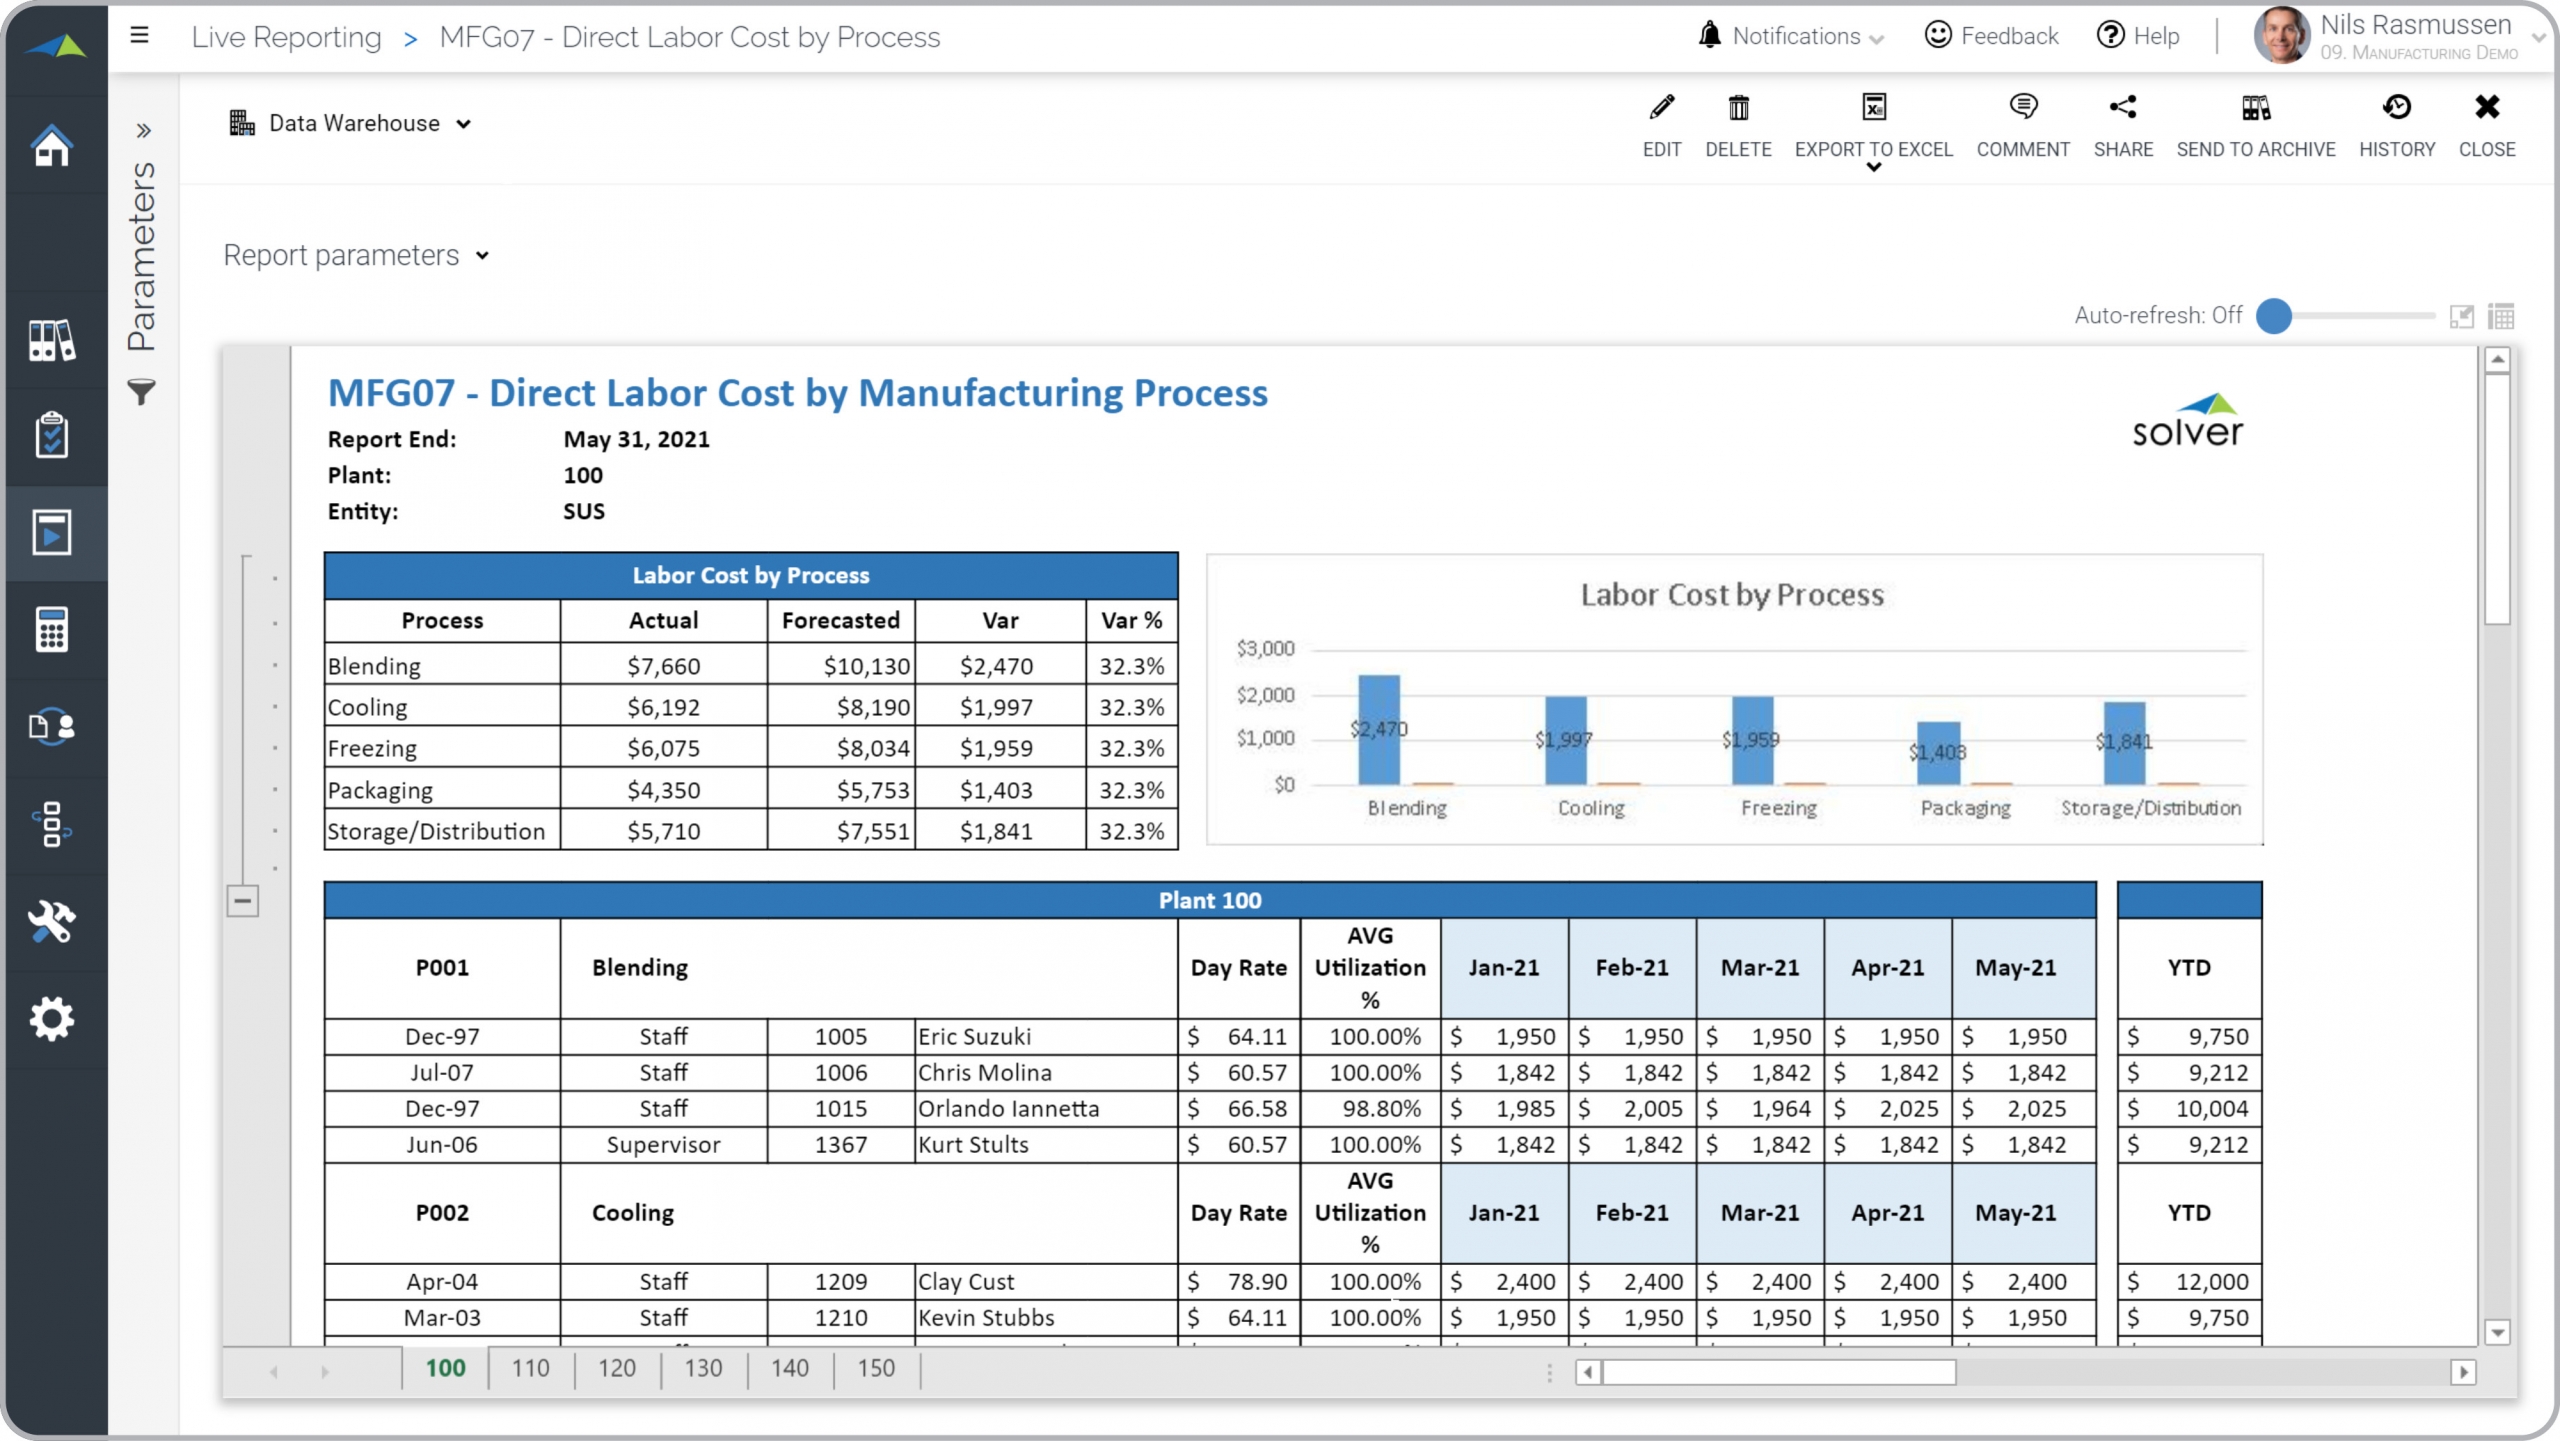
Mfg – Direct Labor Cost by Process
Actual vs Forecasted direct labor cost and utilization per FTE per manufacturing process.
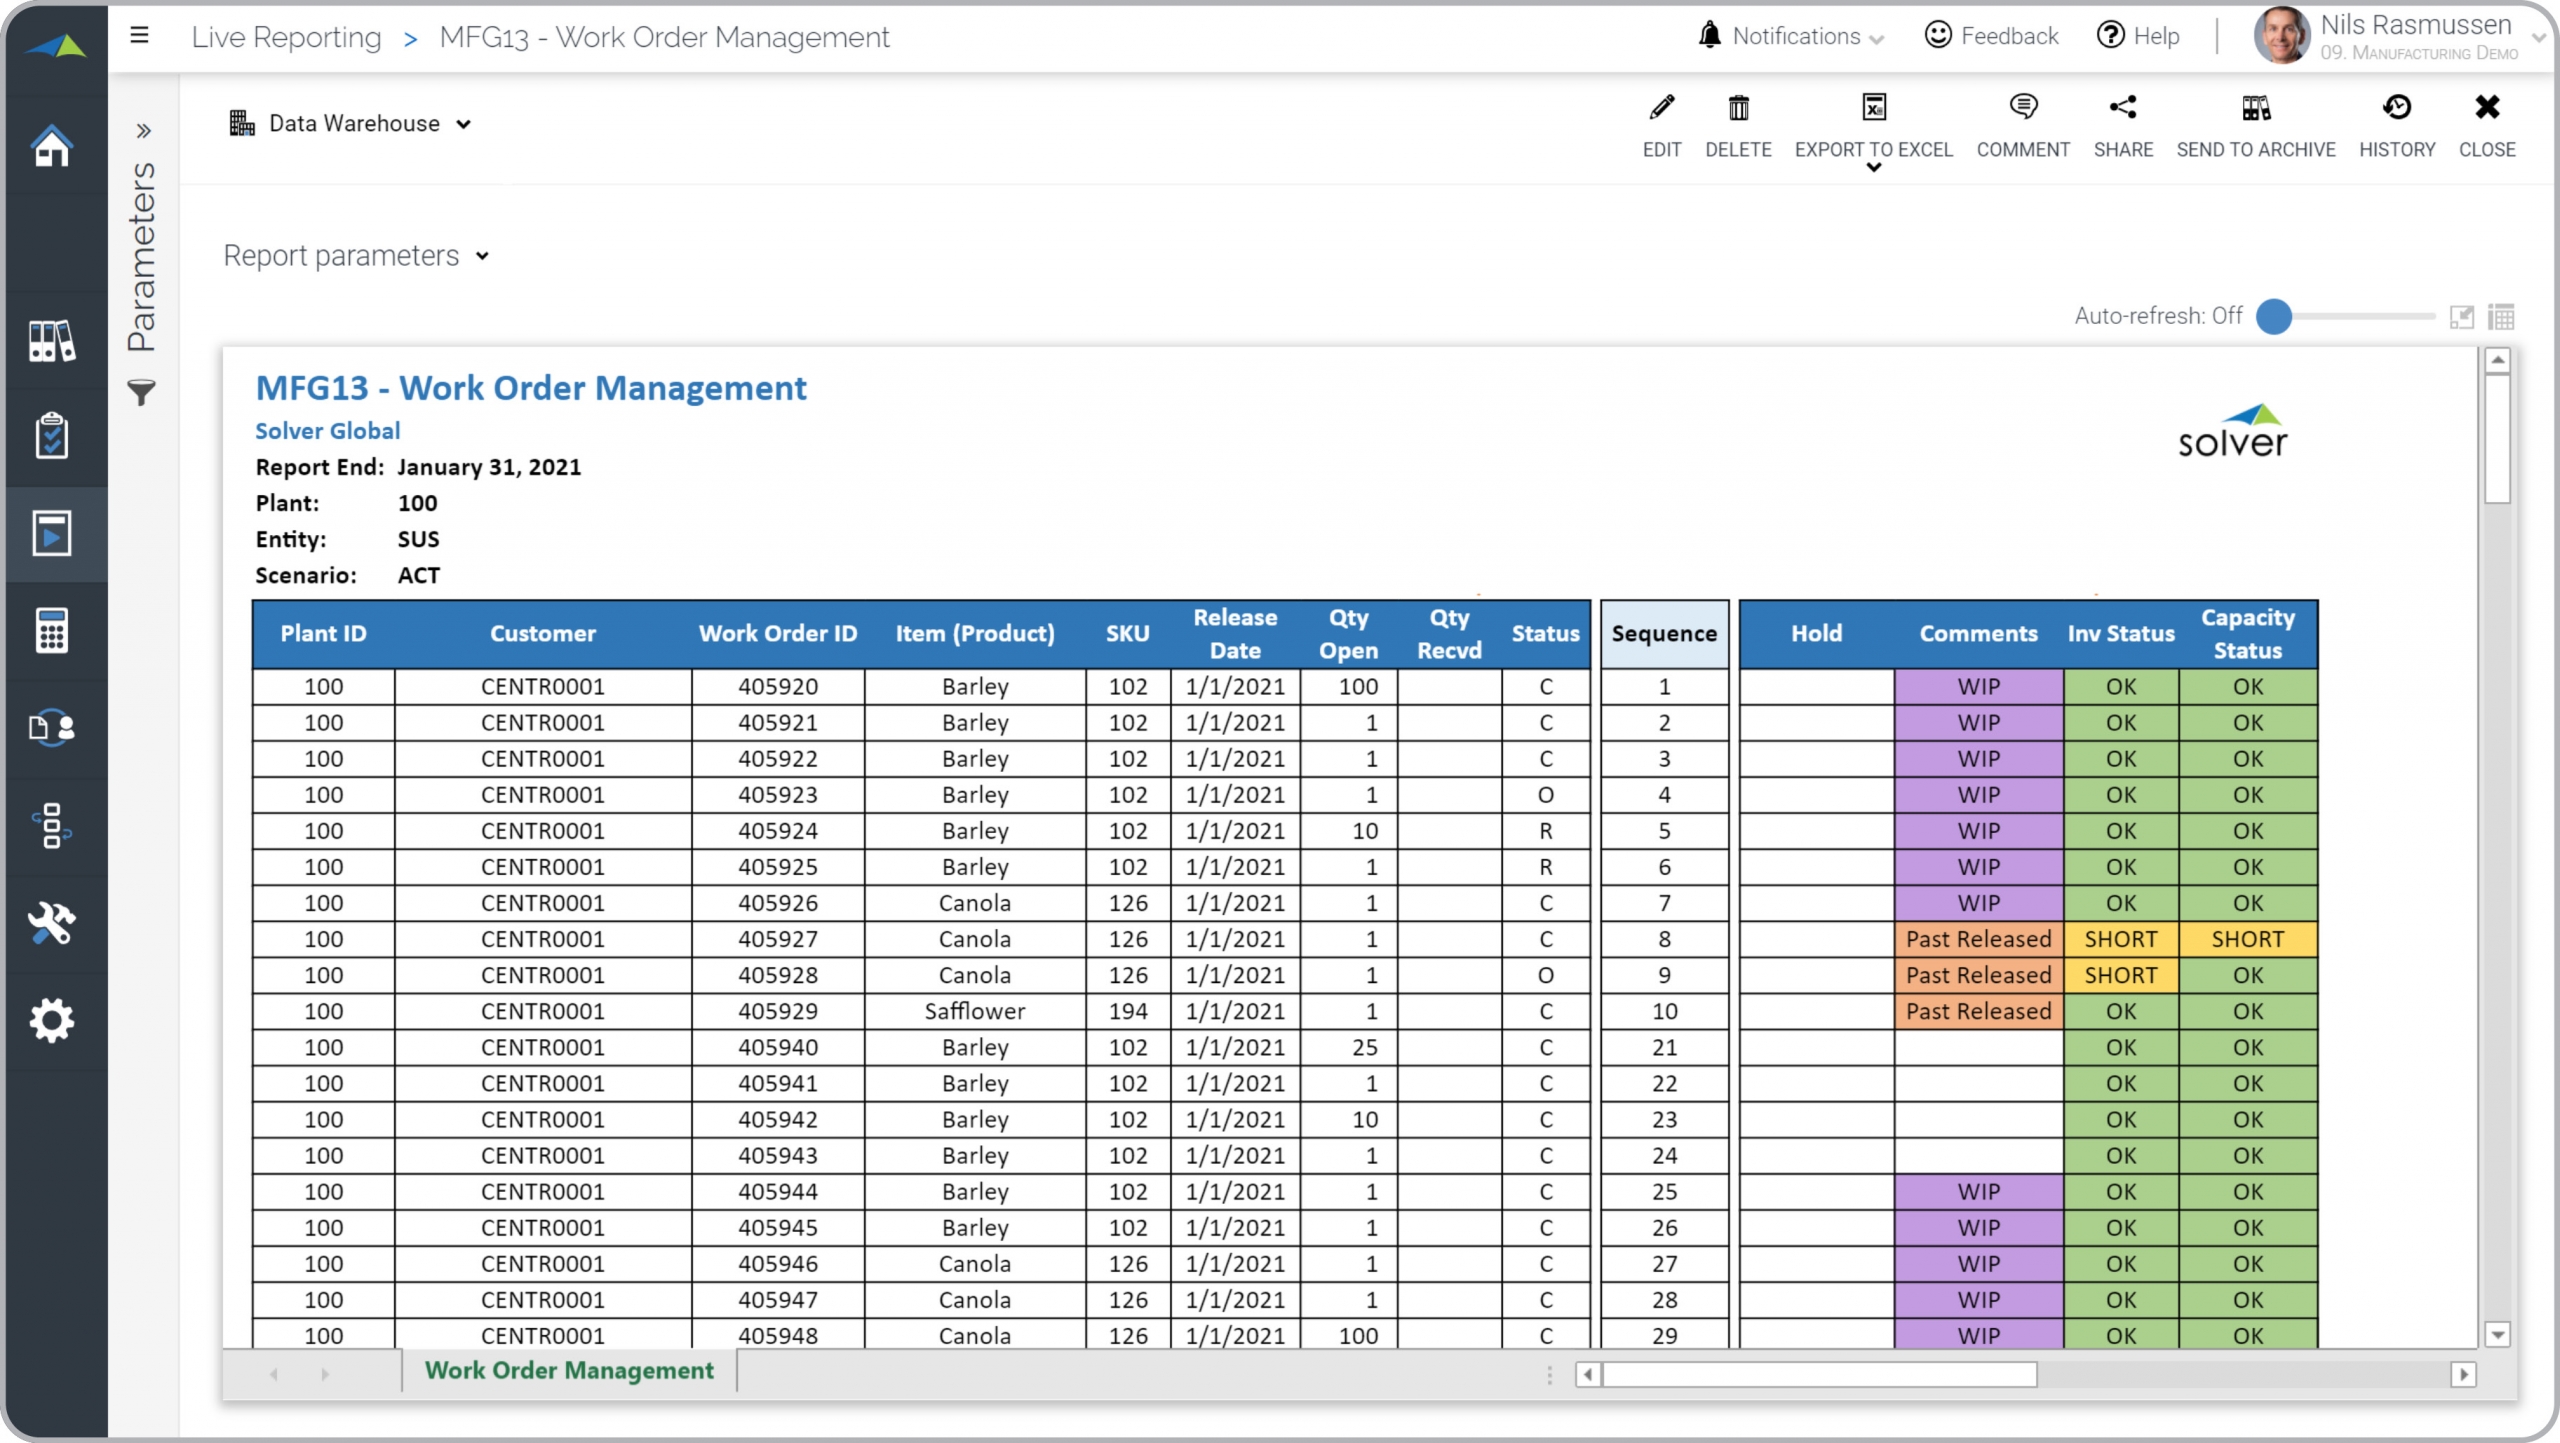
Mfg – Work Order Management
Work orders per plant, customer and item with capacity and inventory status.
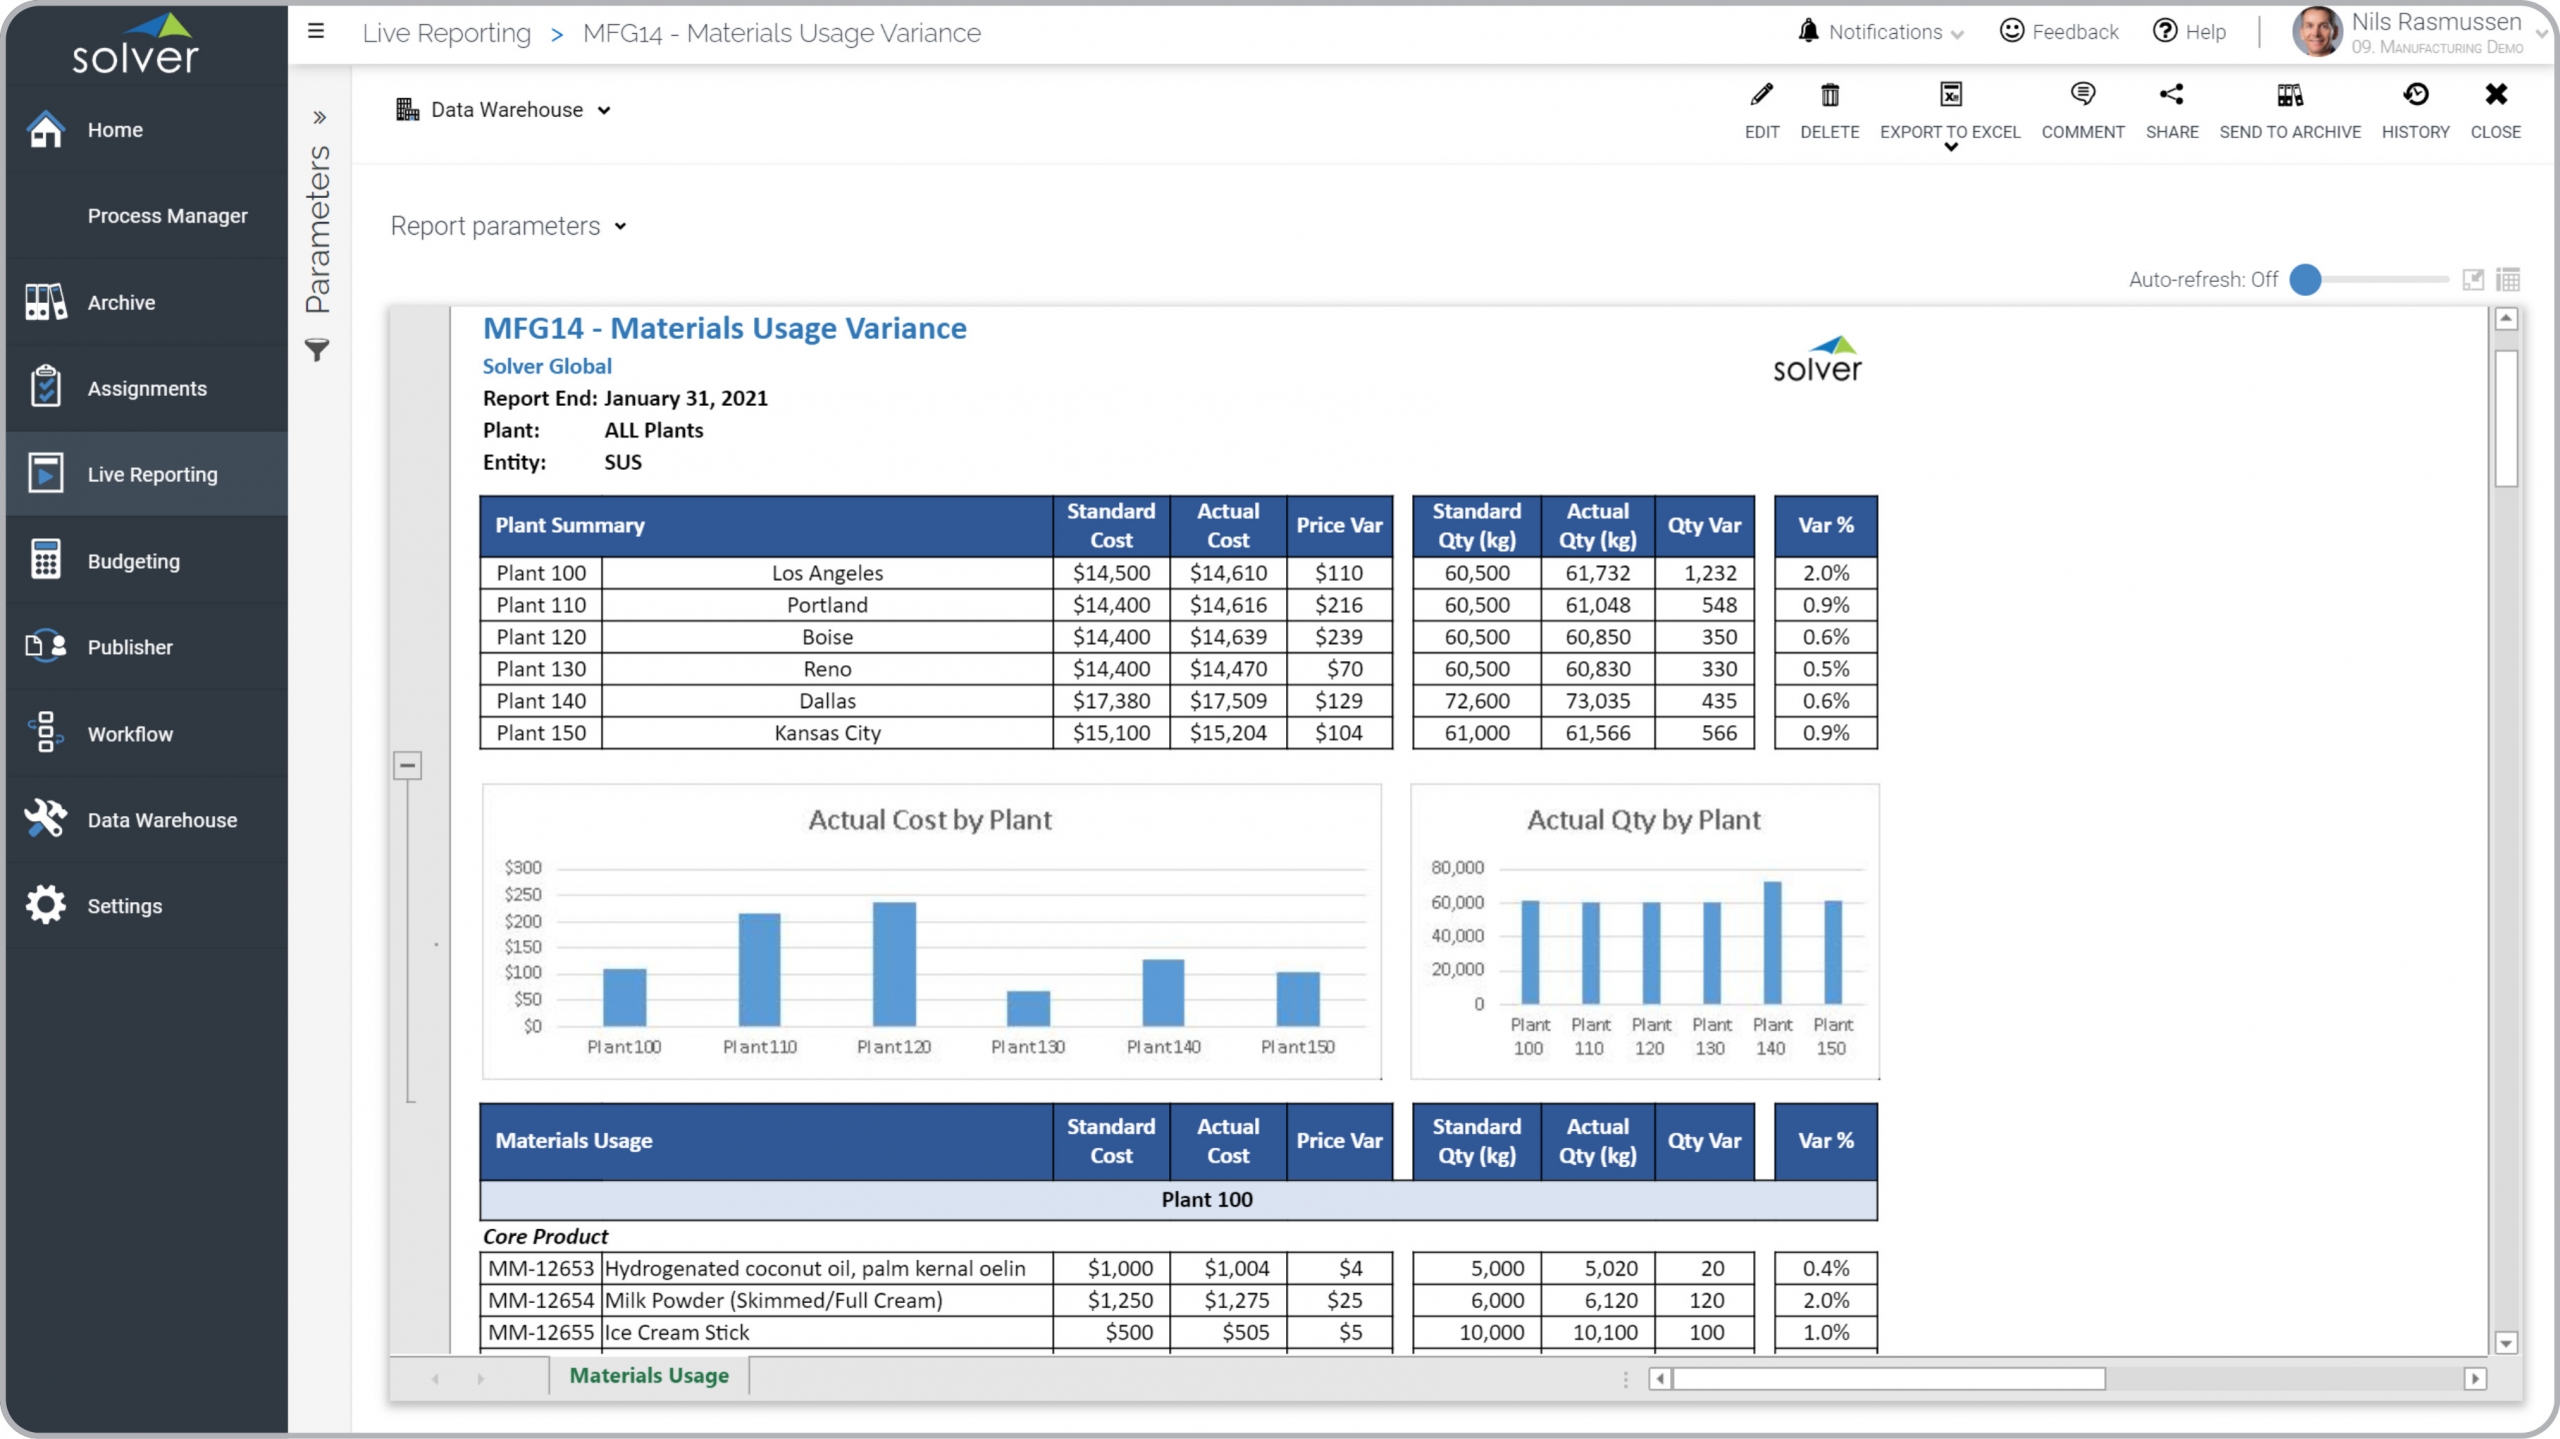
Mfg – Materials Usage Variance
Standard and actual cost with price and quantity variance per plant.
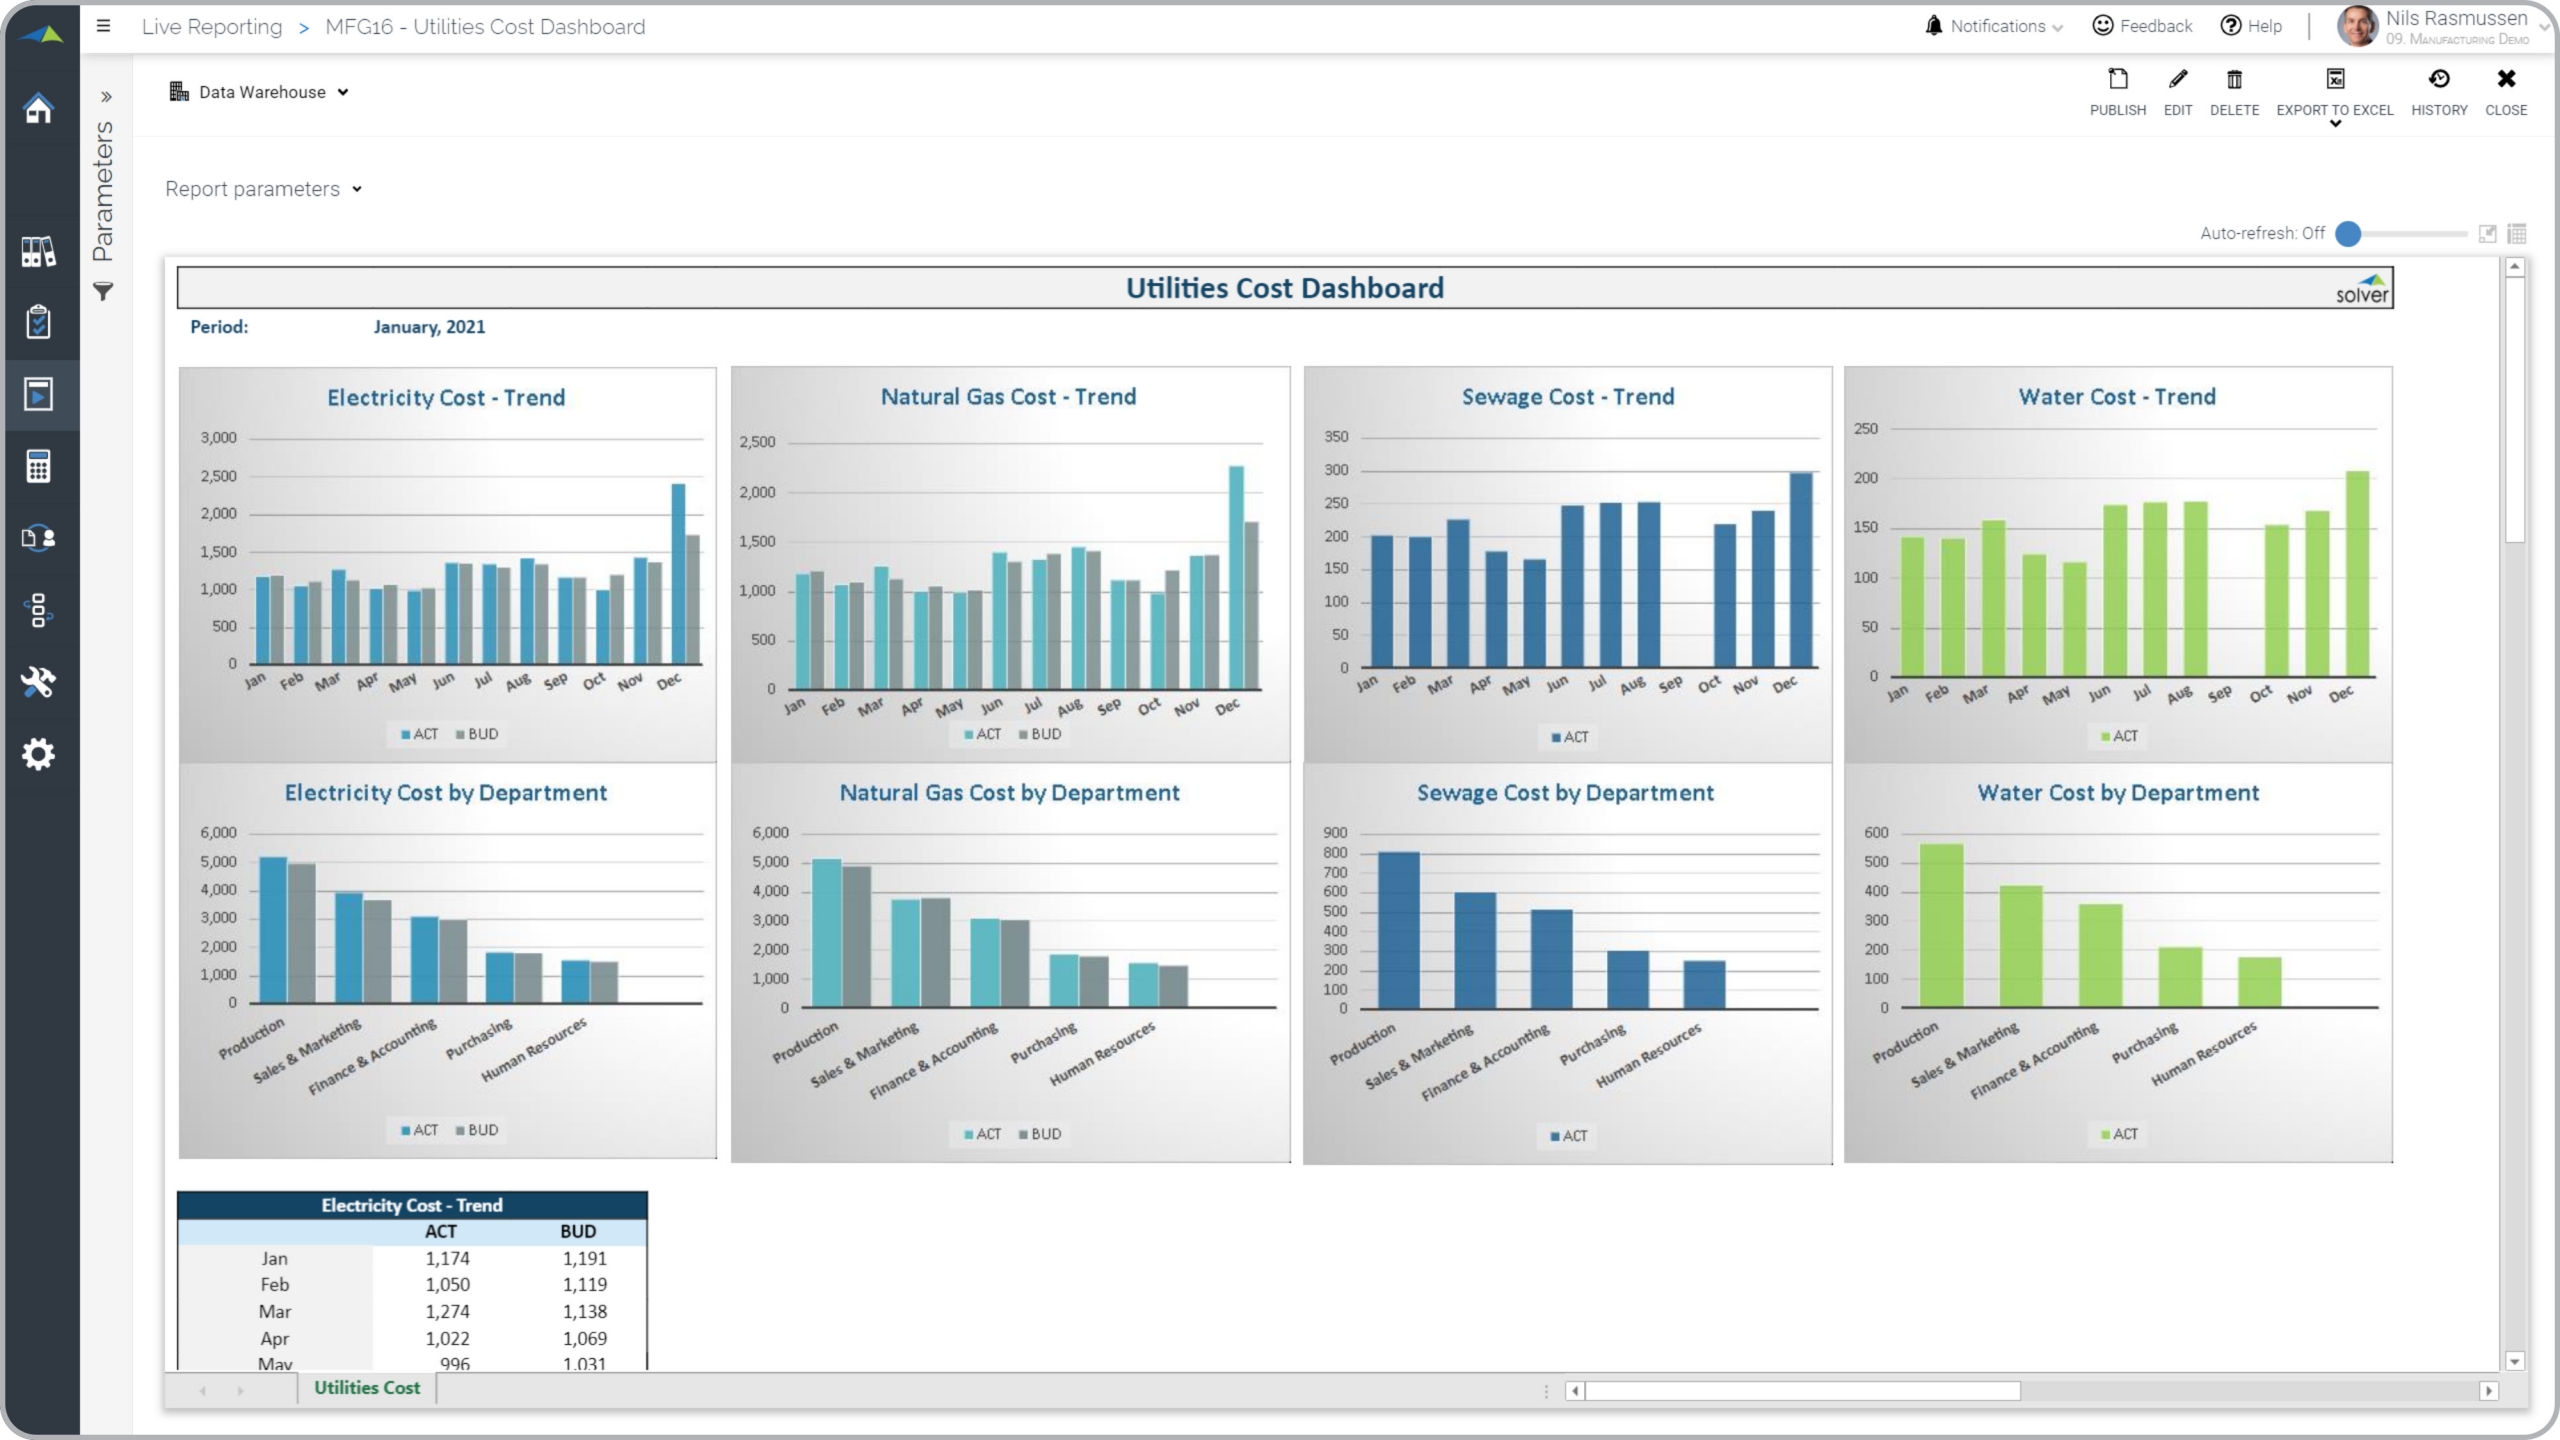
Mfg – Utilities Cost Analysis
Analyze monthly expense trends in utilities like electricity, gas, sewage and water.
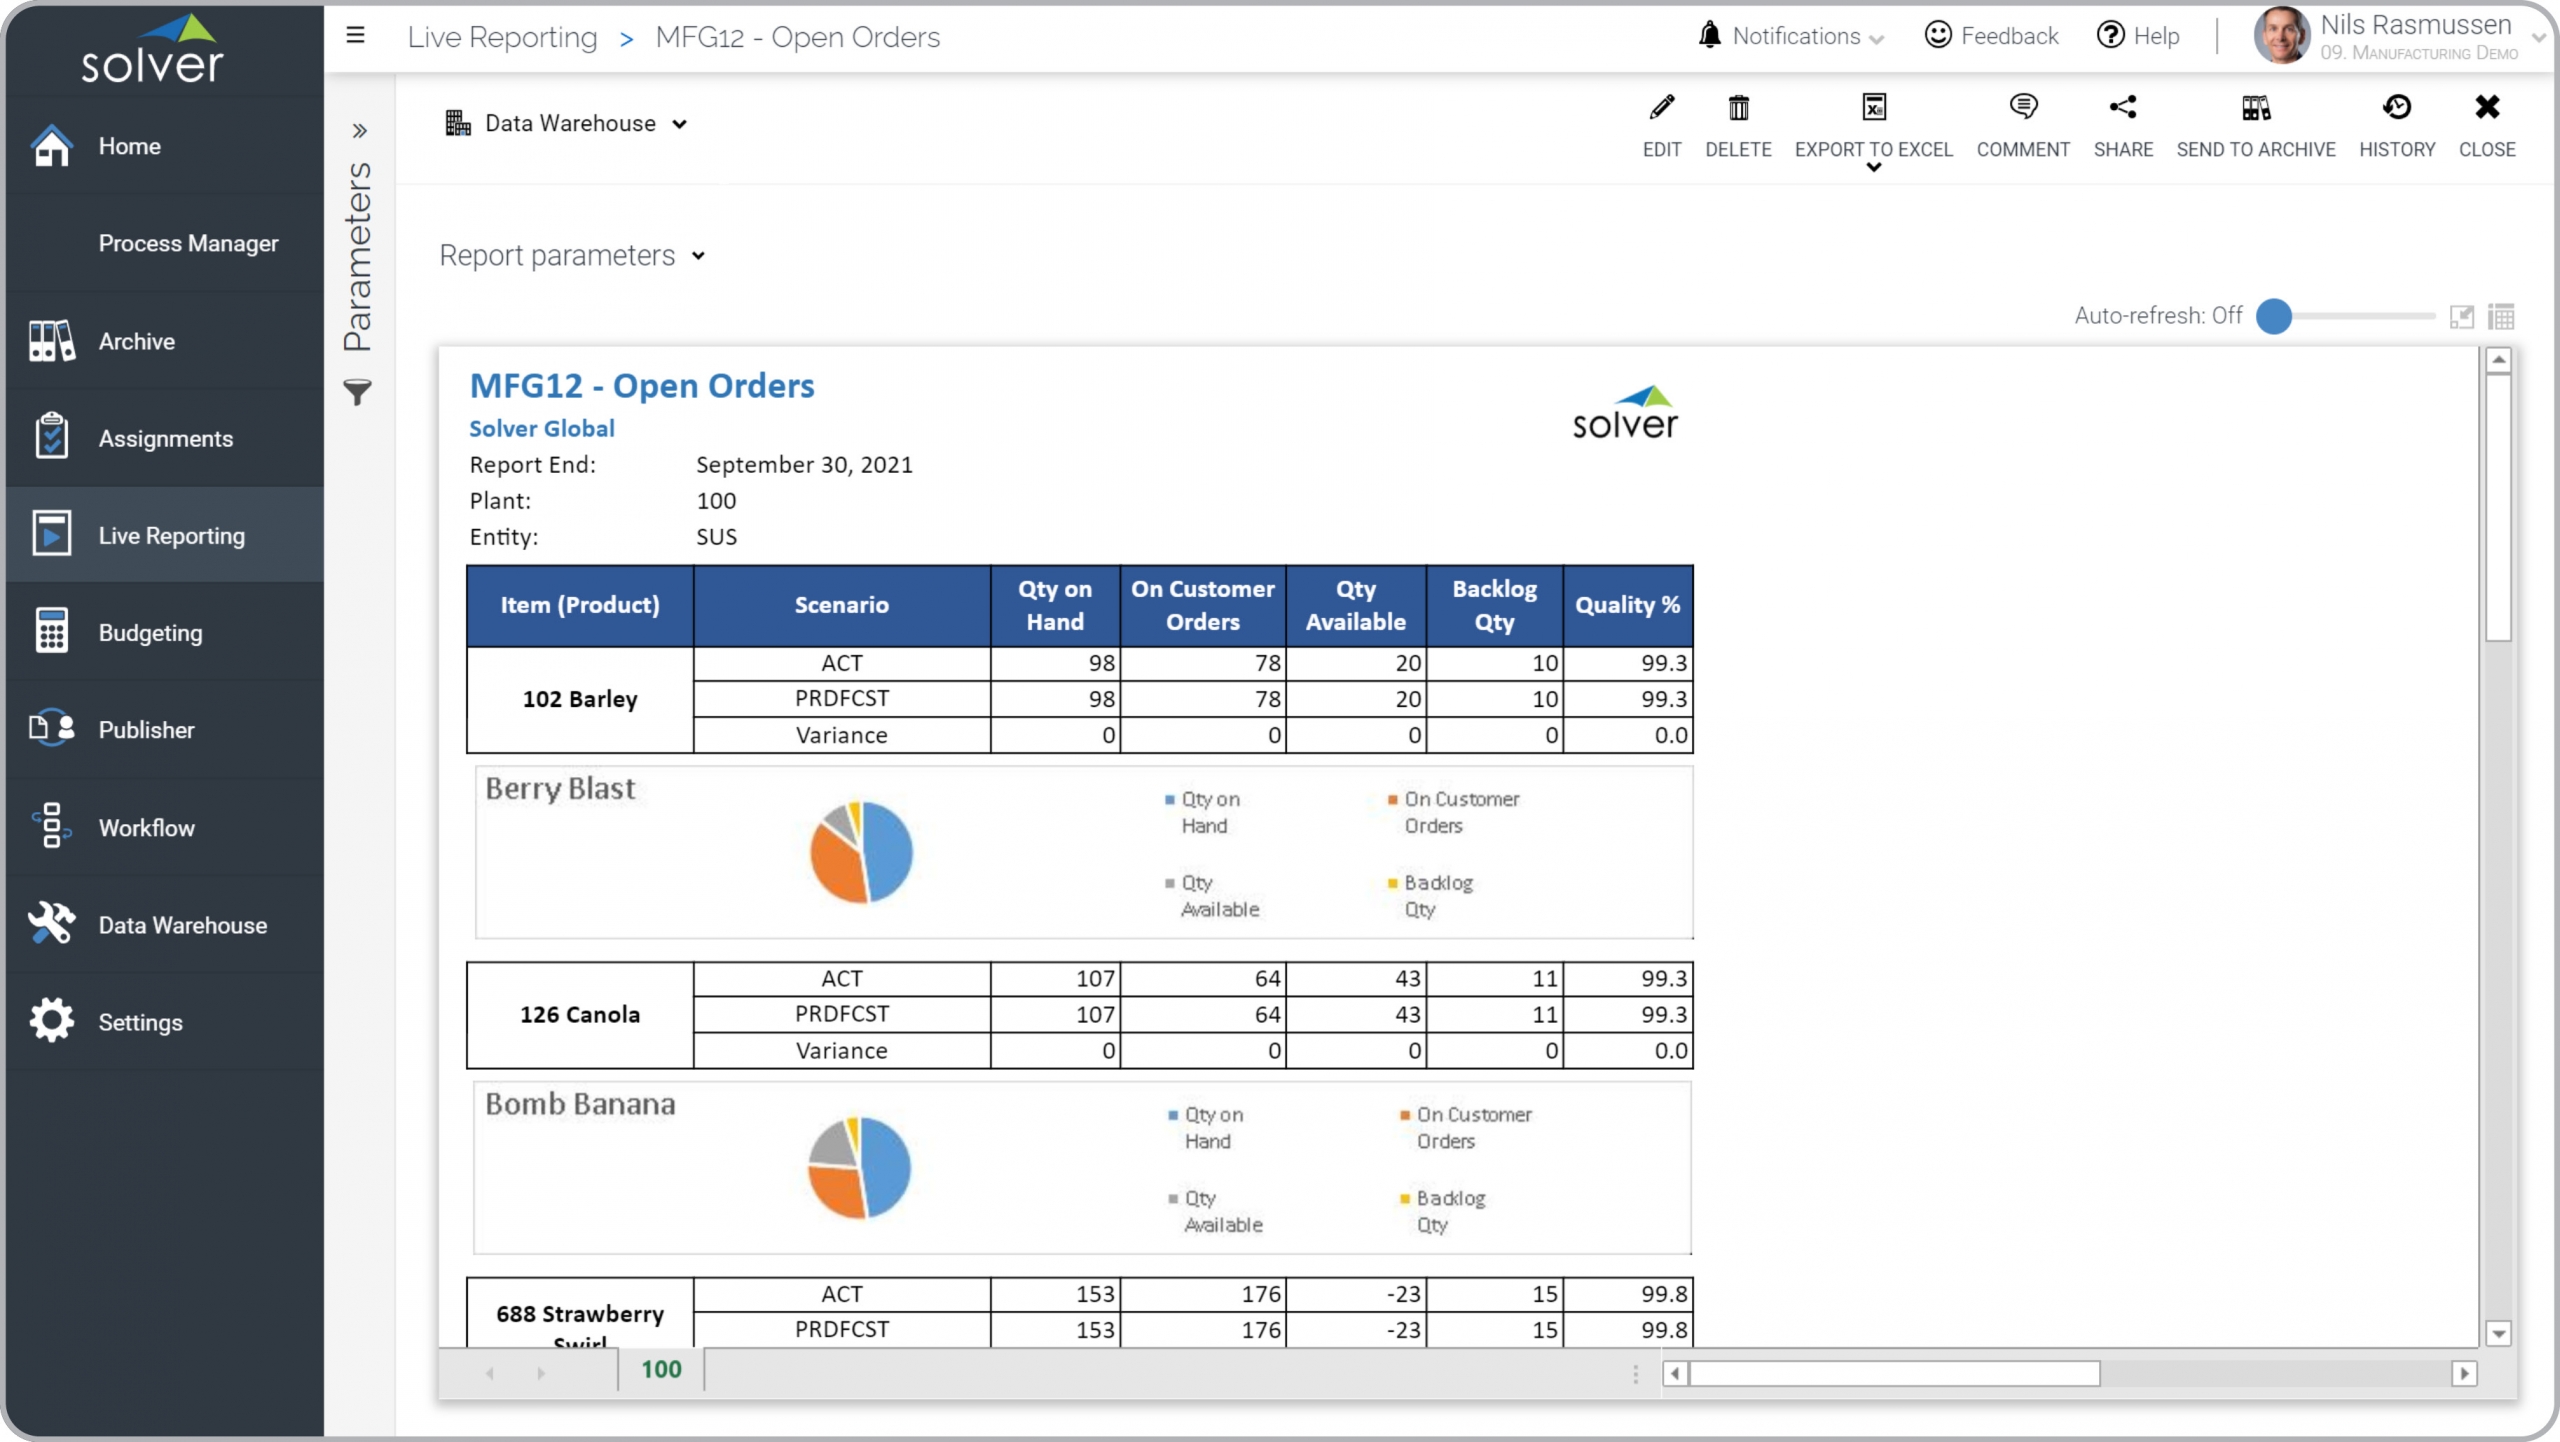
Mfg – Open Orders
Open orders by Plant by Item with actual, forecast and variance.
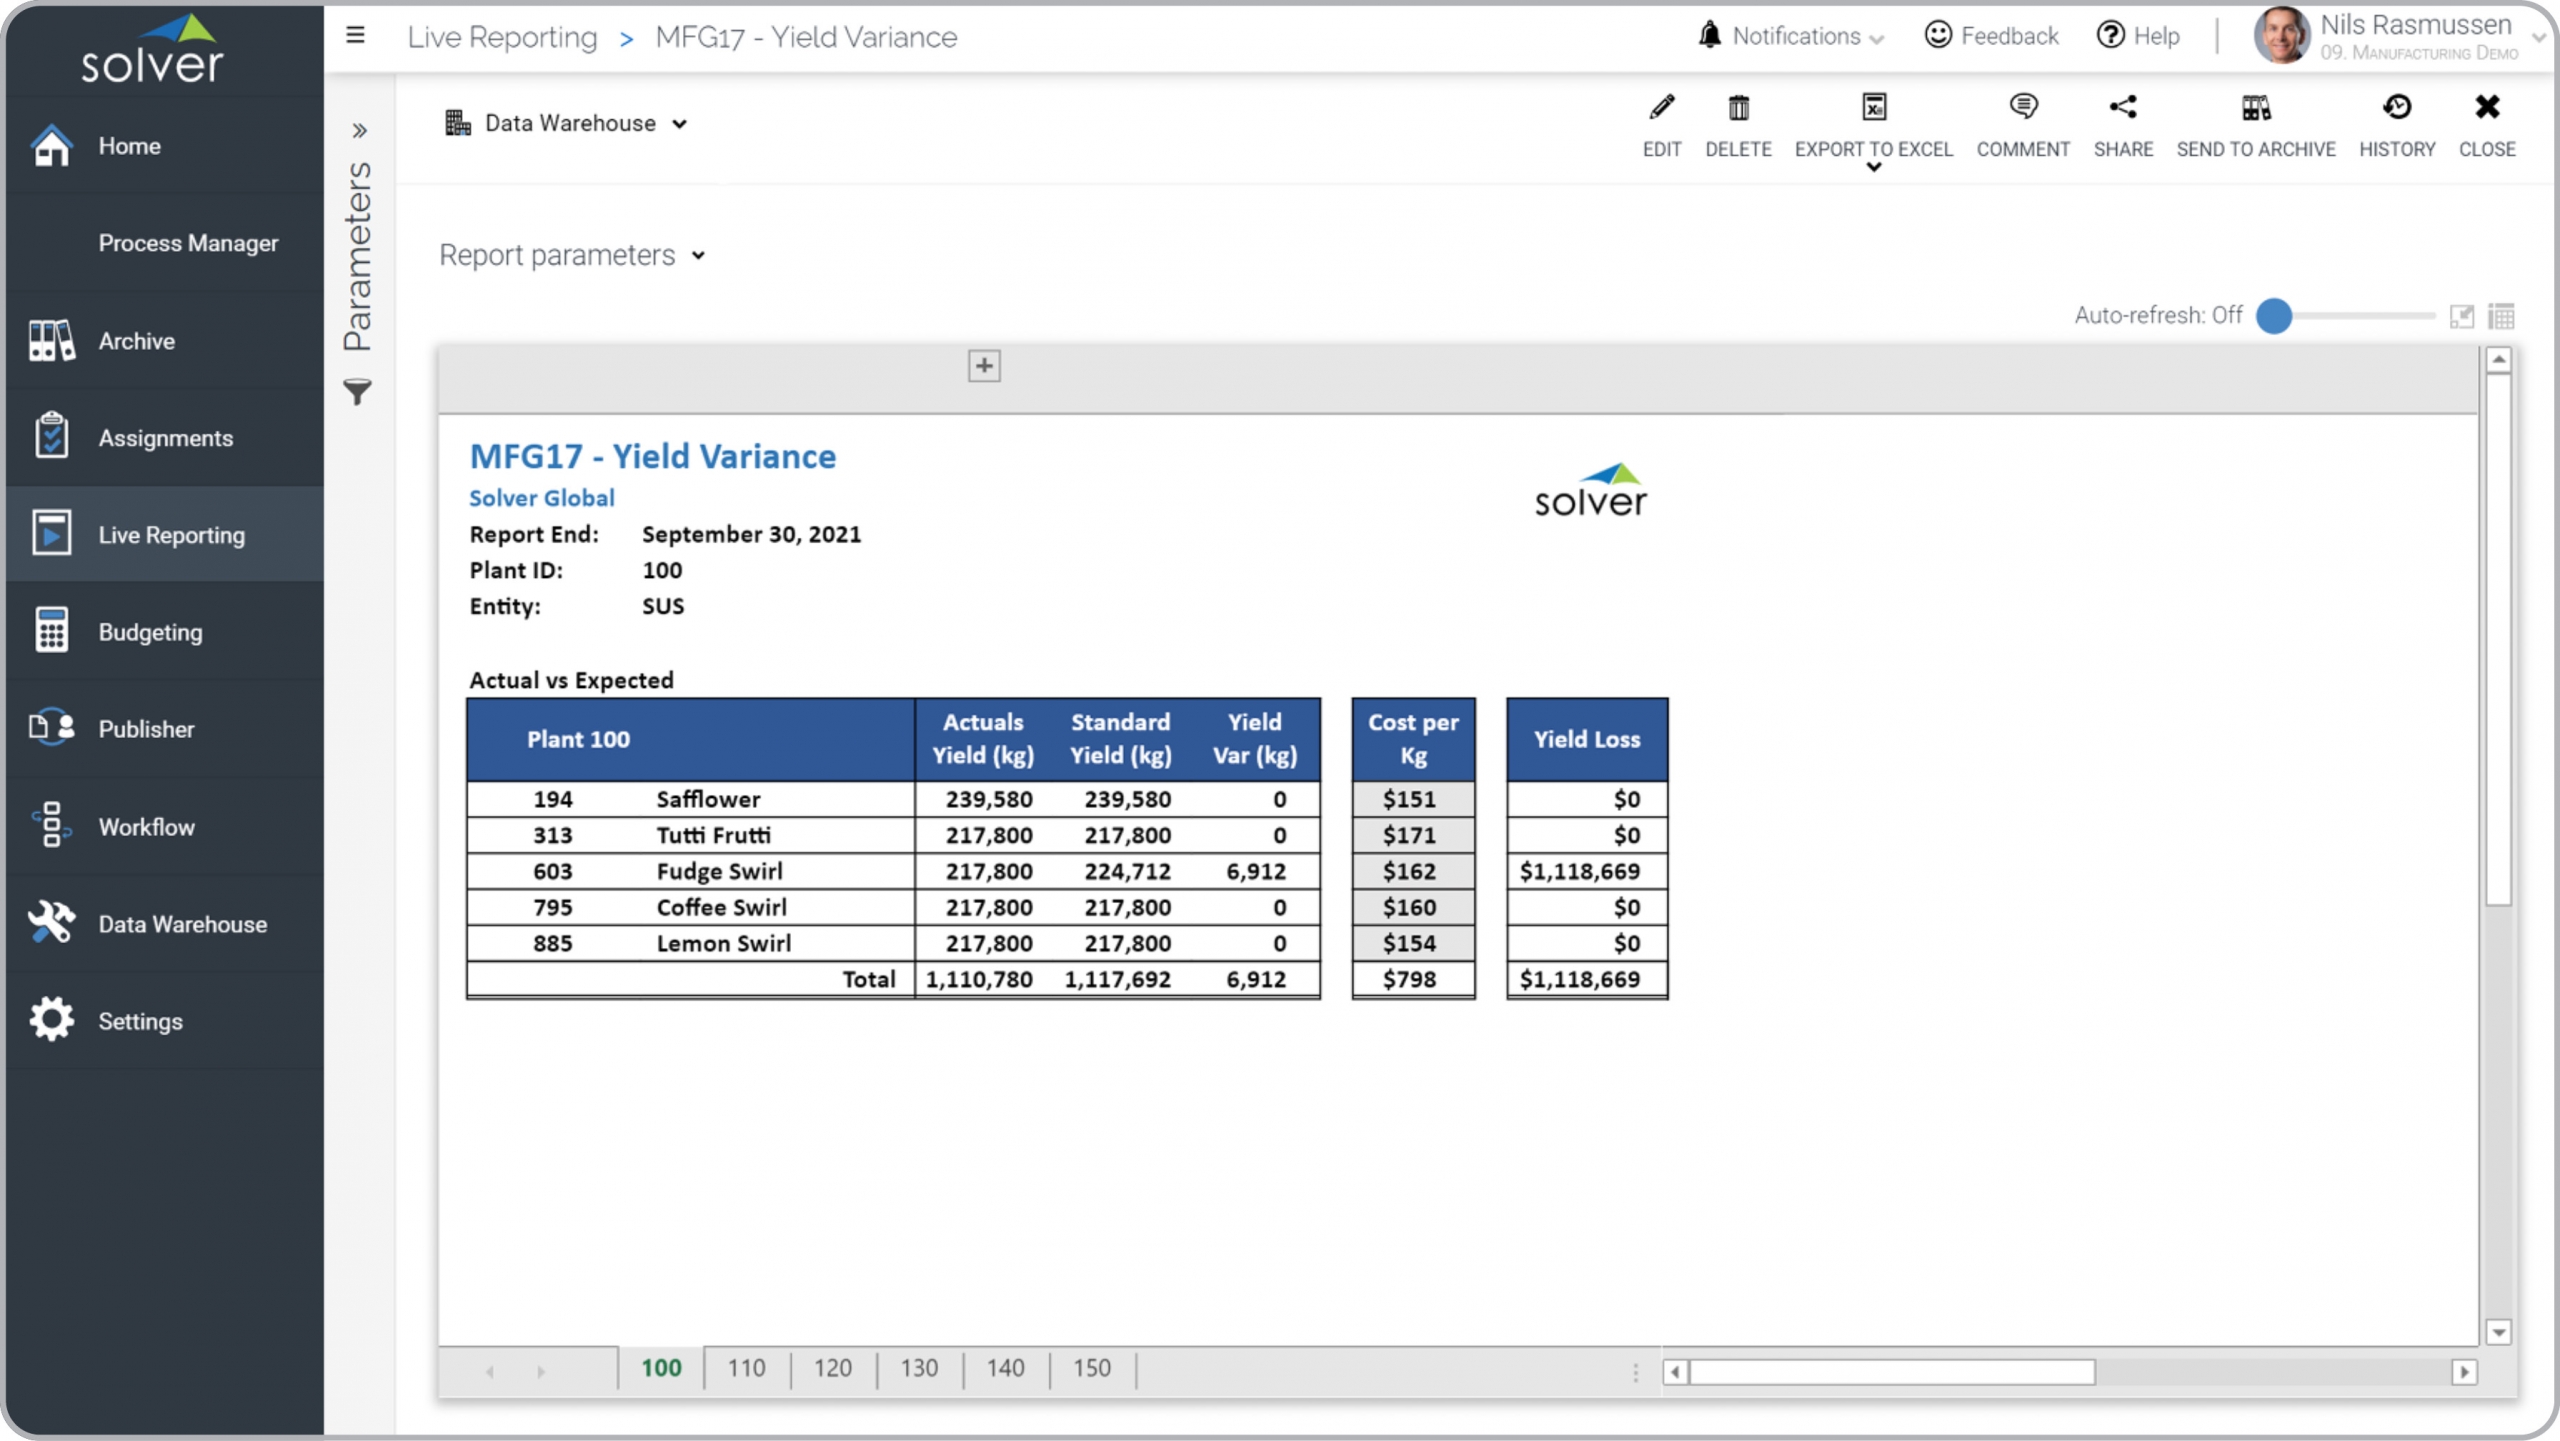
Mfg – Yield Variance
Actual and standard yield by product by plant with cost and yield loss.
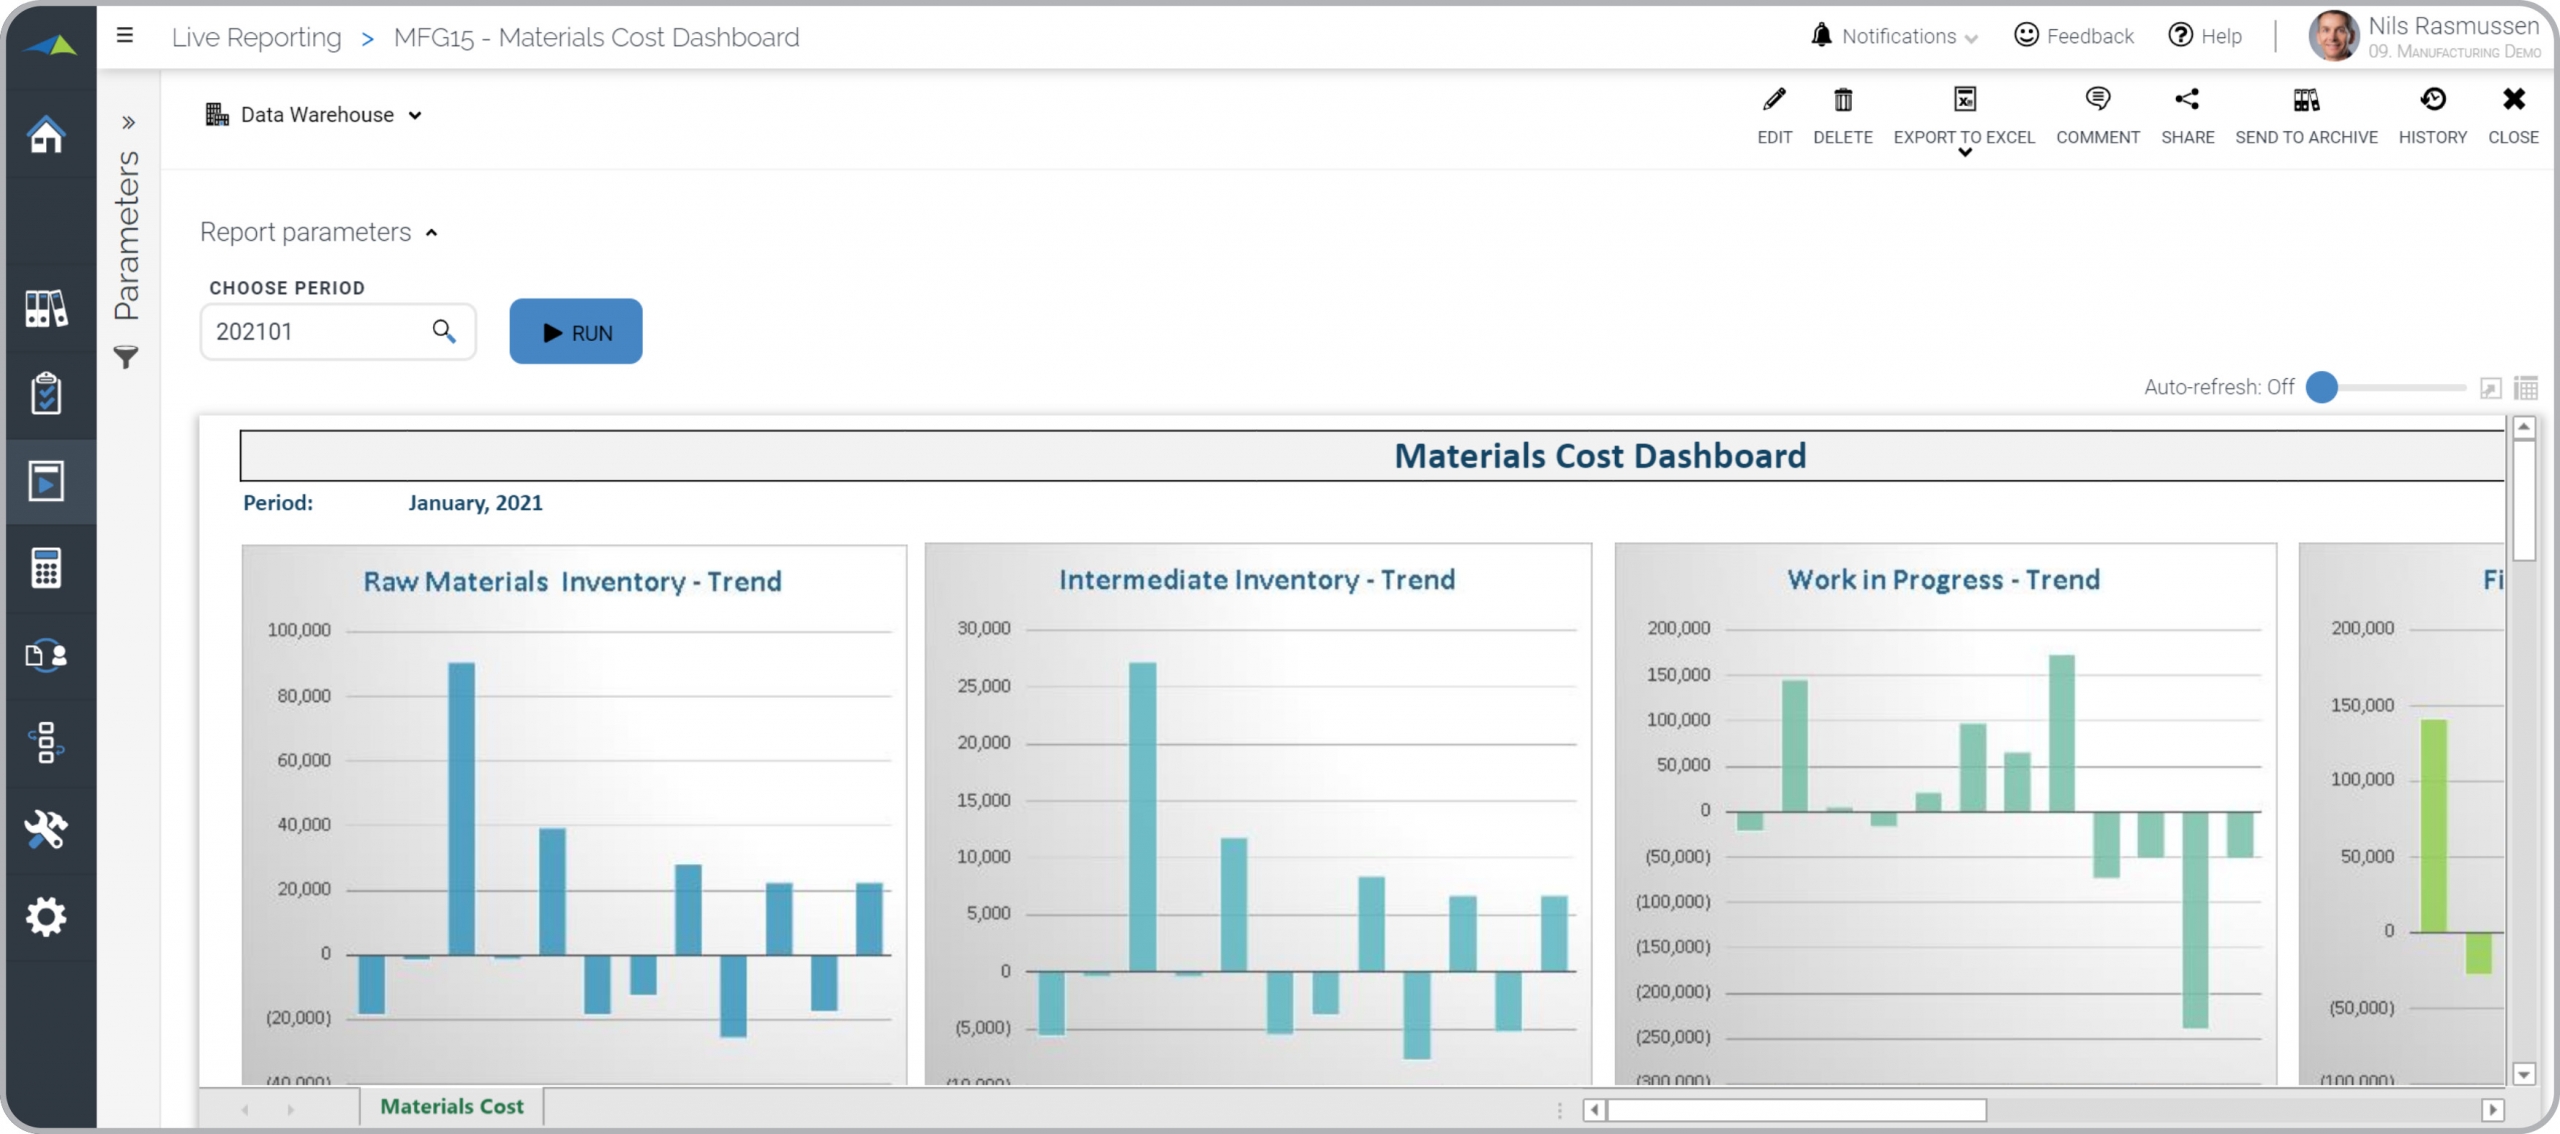
Mfg – Materials Cost Analysis
Monthly trend charts with raw material and intermediate inventory, WIP and FIG.
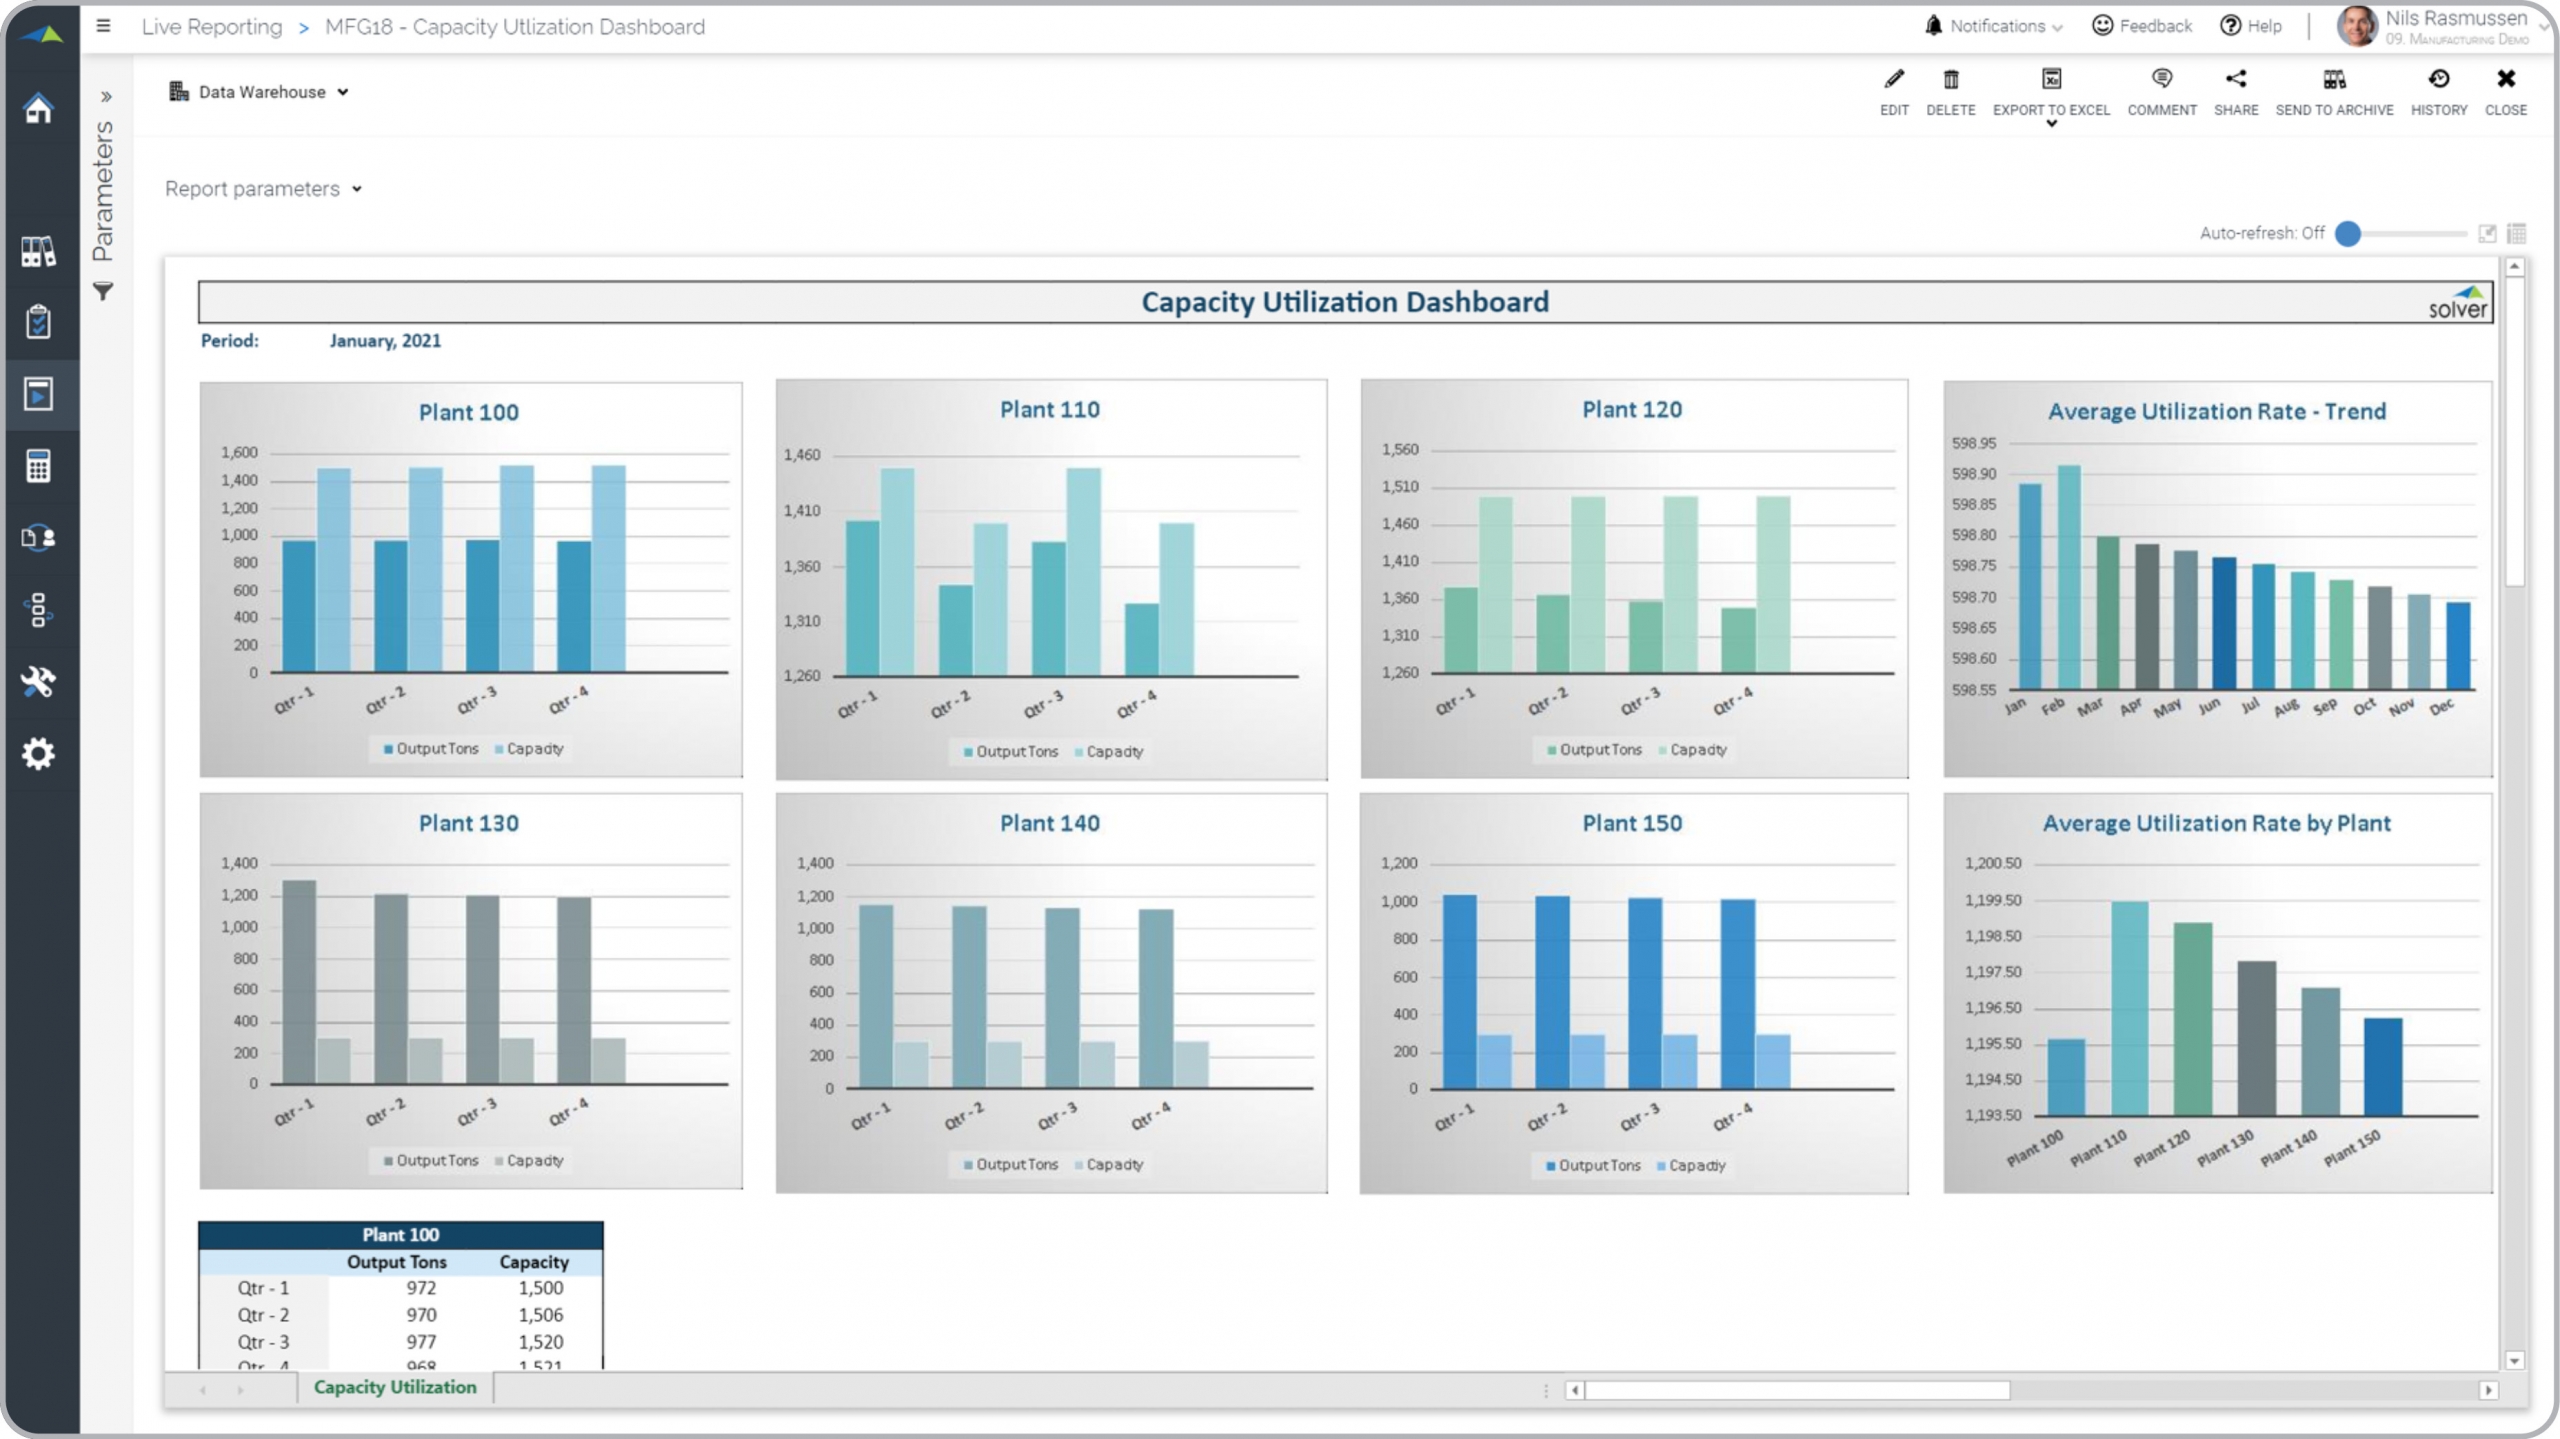
Mfg – Capacity Utilization by Plant
Actual vs capacity utilization by plant with comparison across plants and by month.
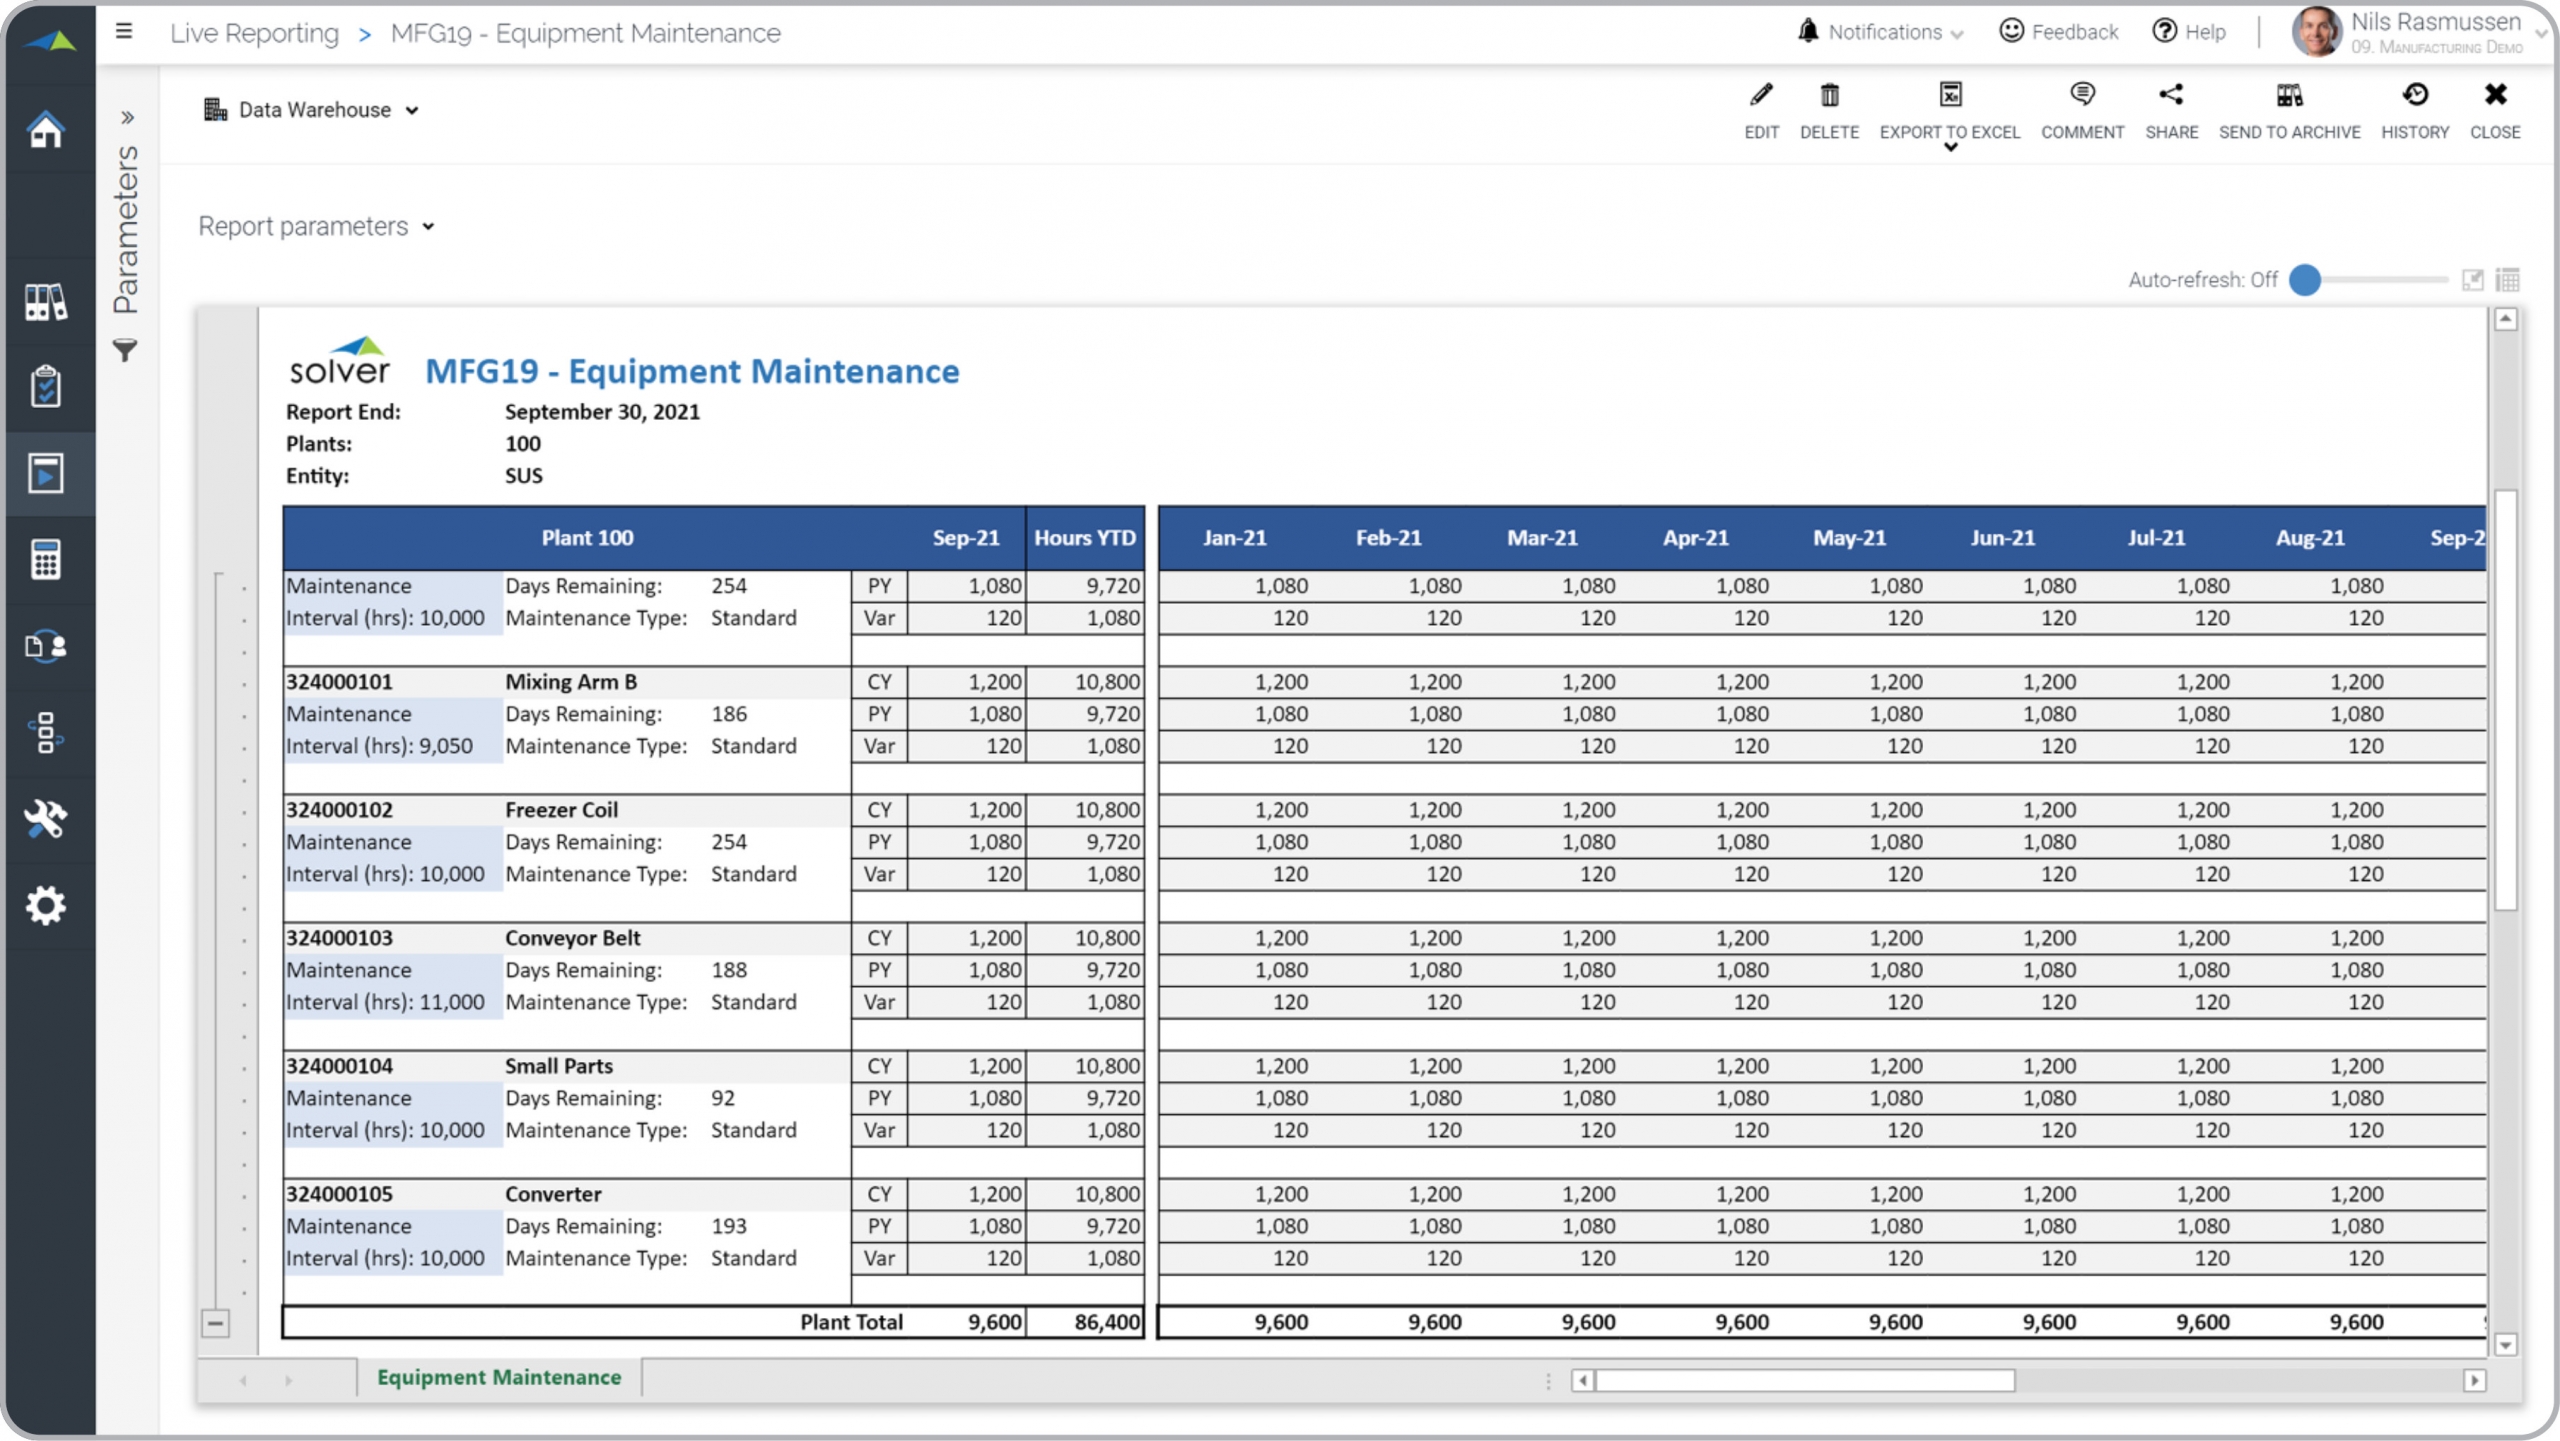
Mfg – Equipment Maintenance Report
Days remaining and maintenance type with intervals and comparison to prior year.
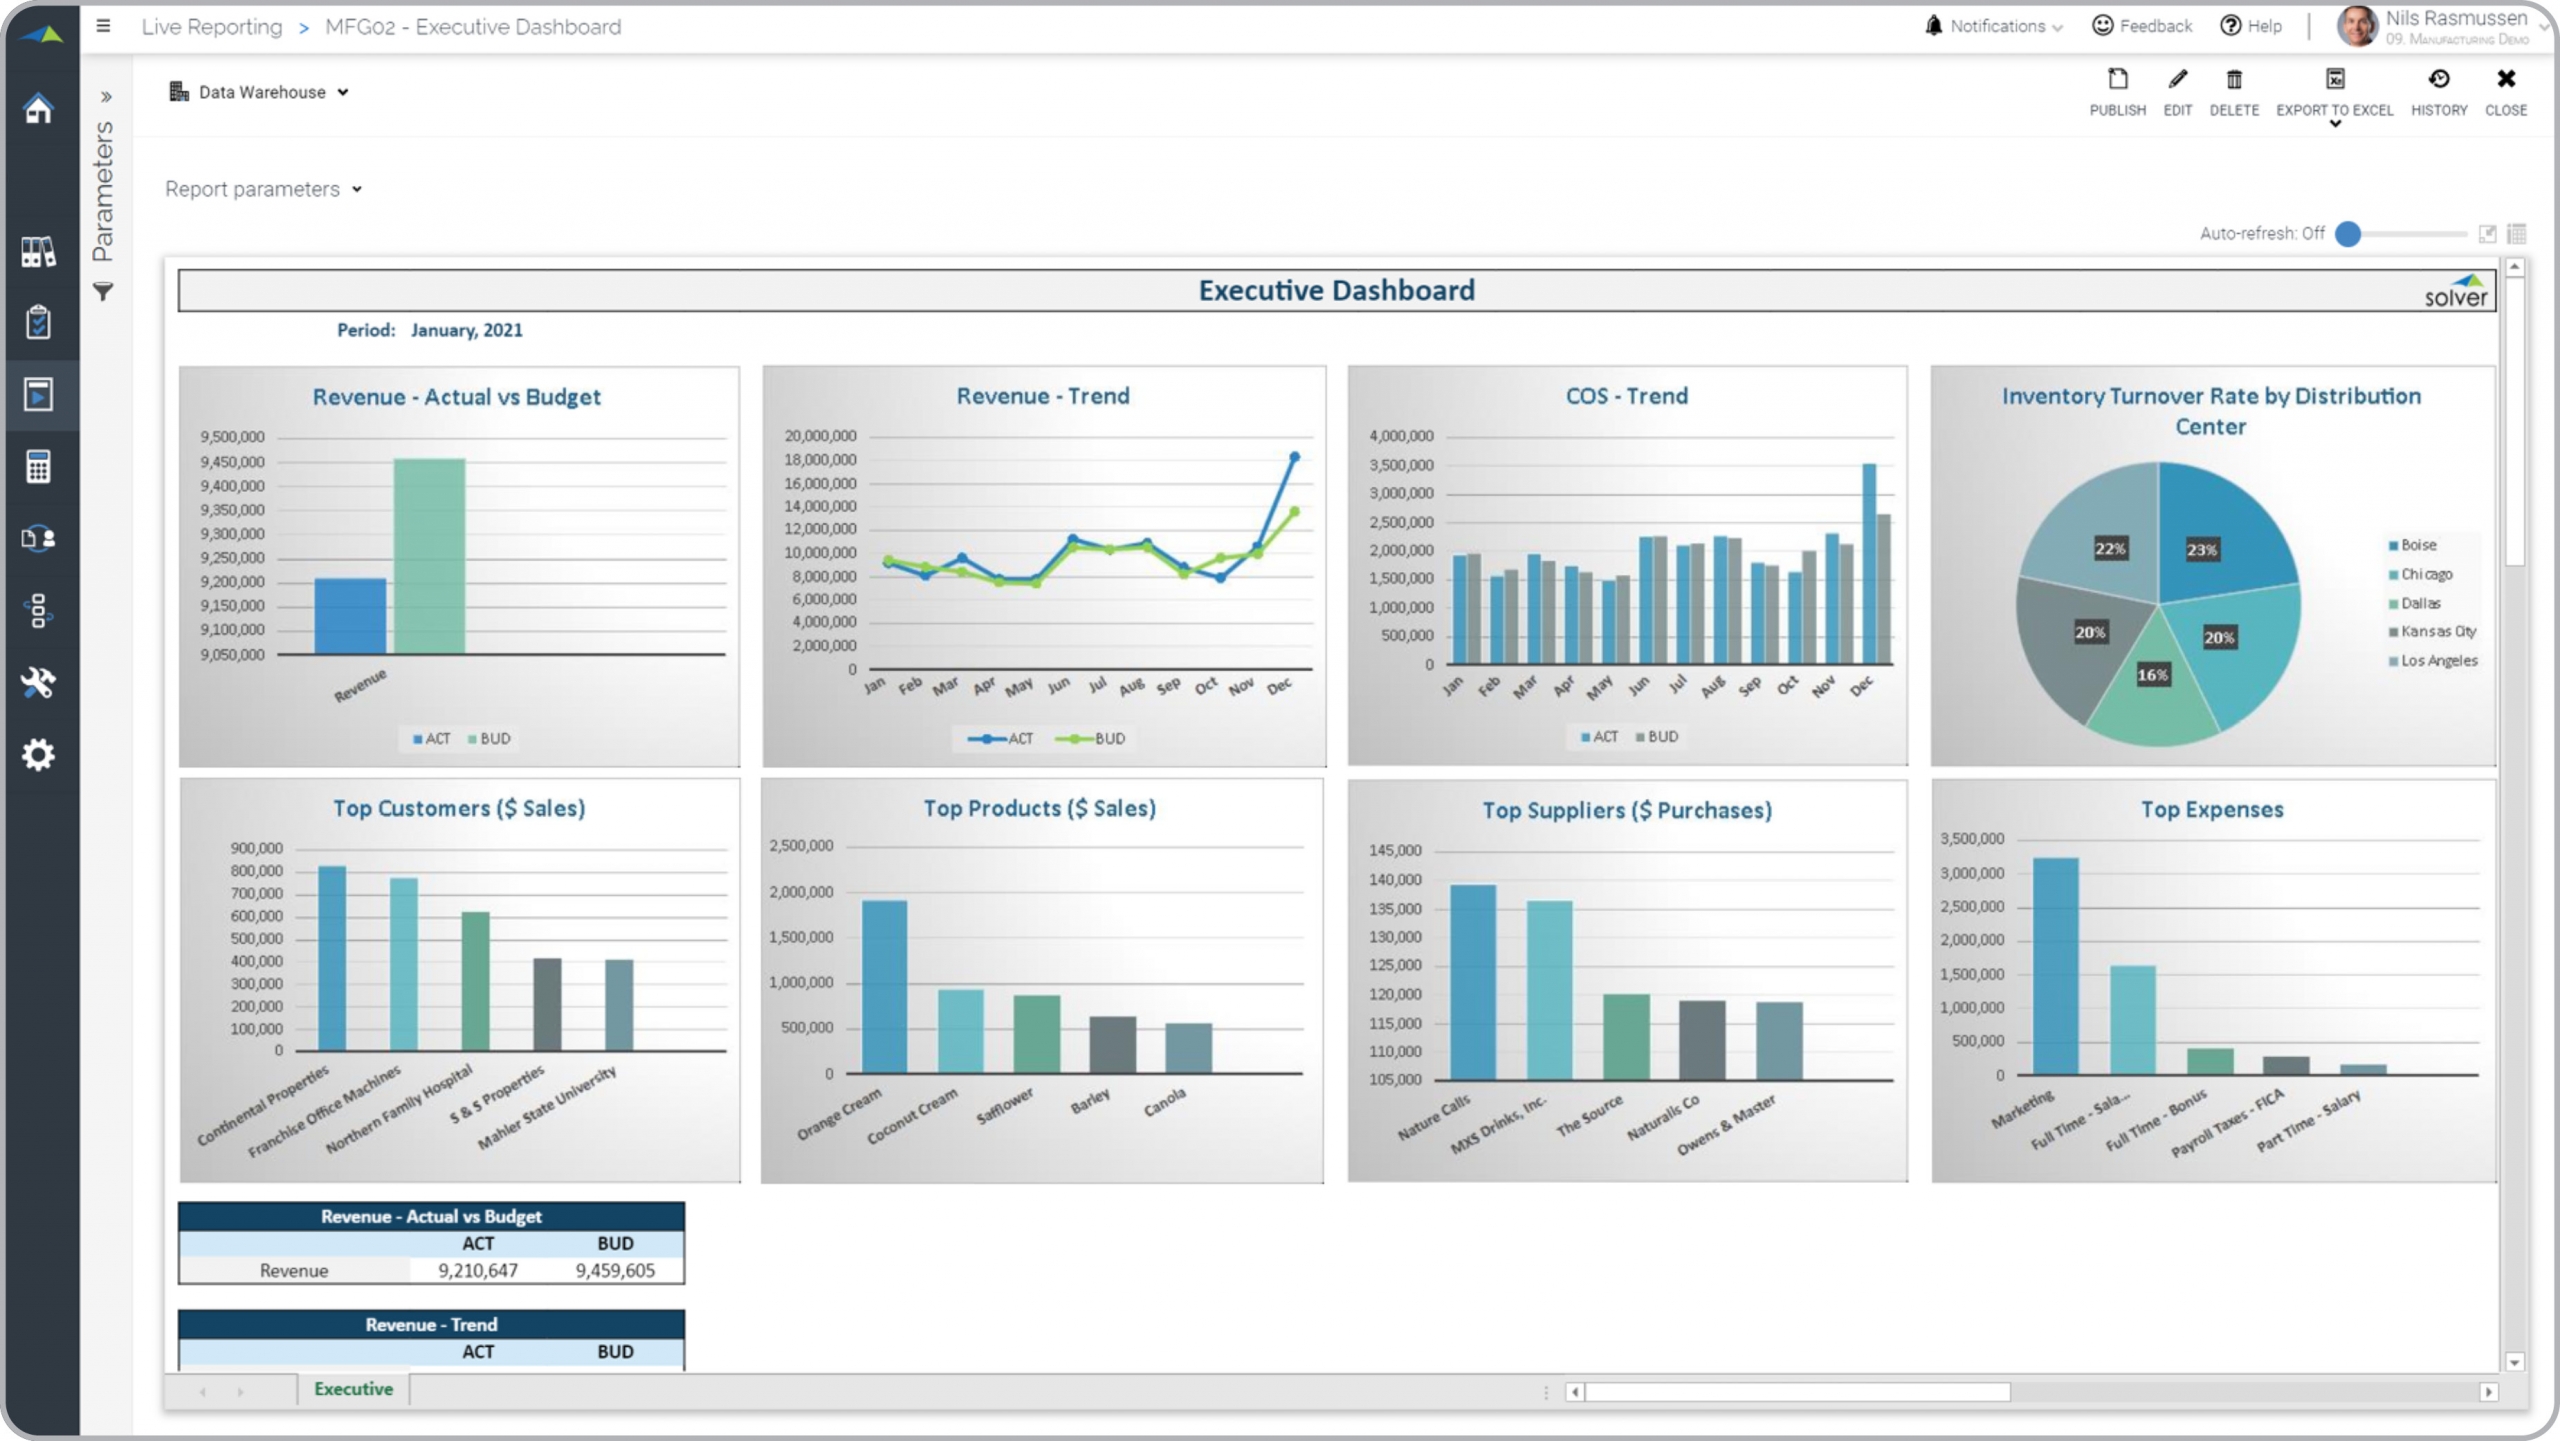
Mfg – Executive Dashboard
Analysis of sales by product and customer, top suppliers, inventory and cost.
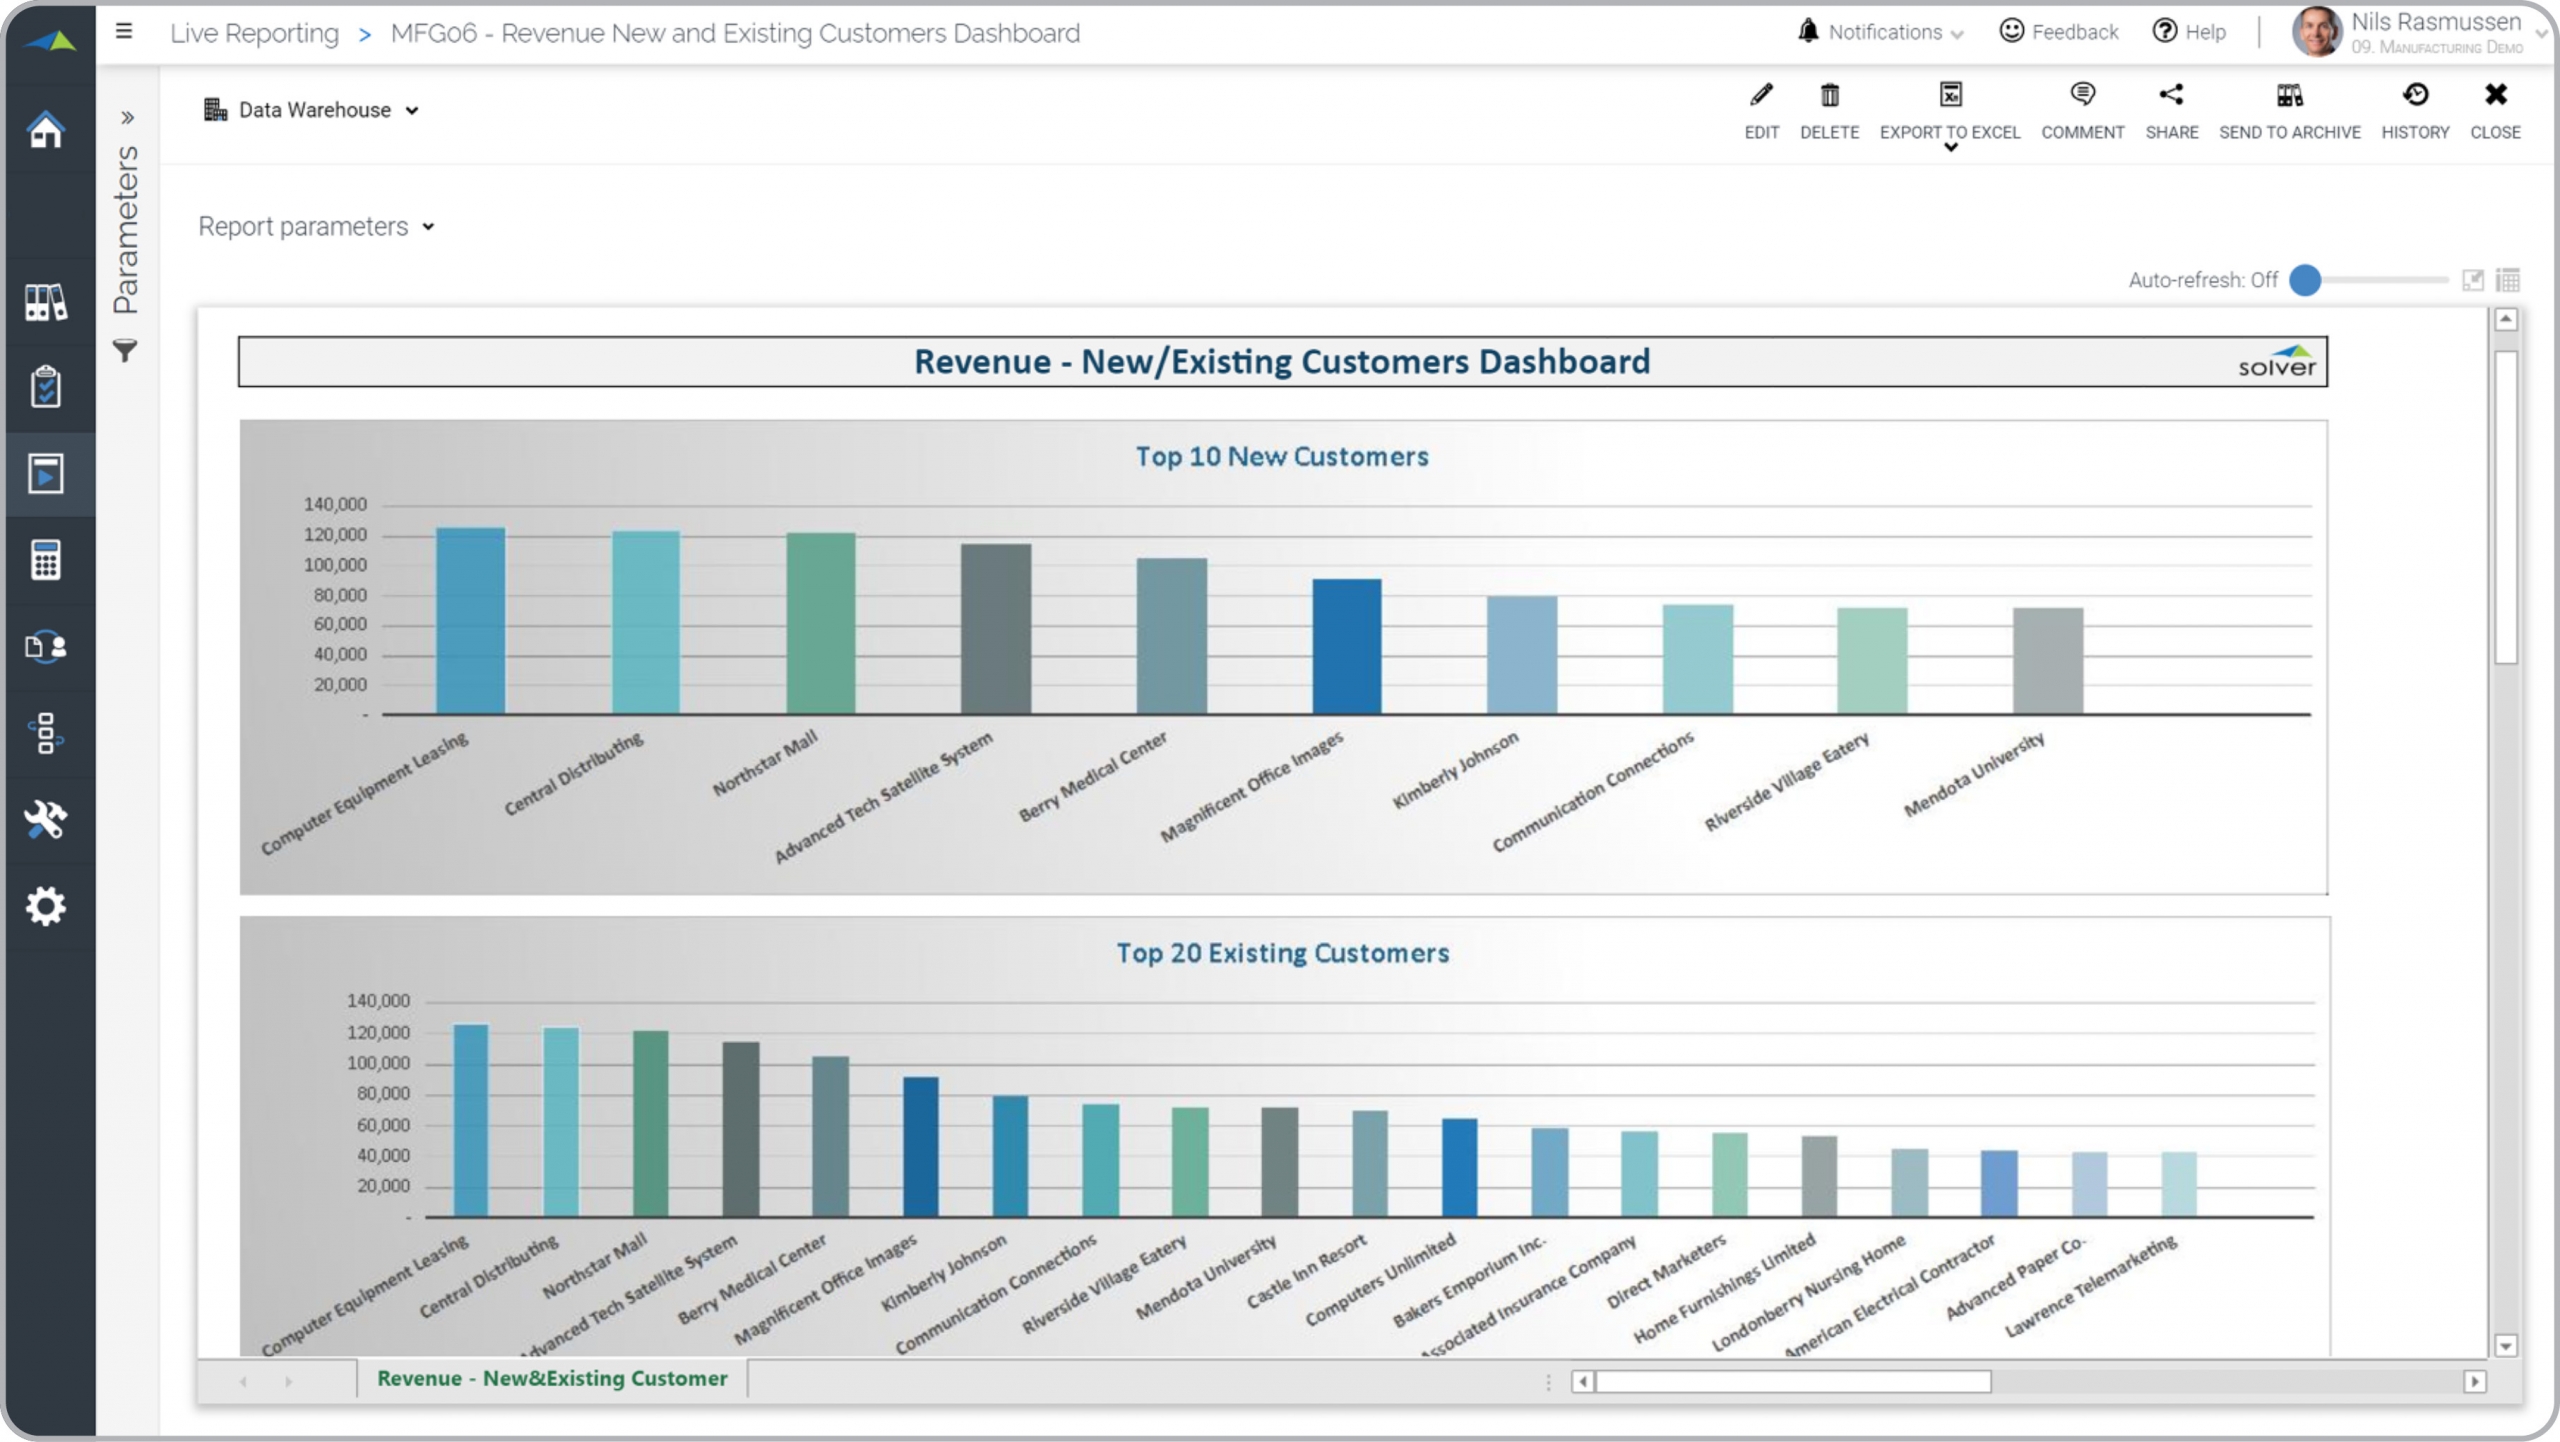
Mfg – New & Existing Customer Sales
Revenue from Top 10 New Customers and Top 20 Existing Customers.
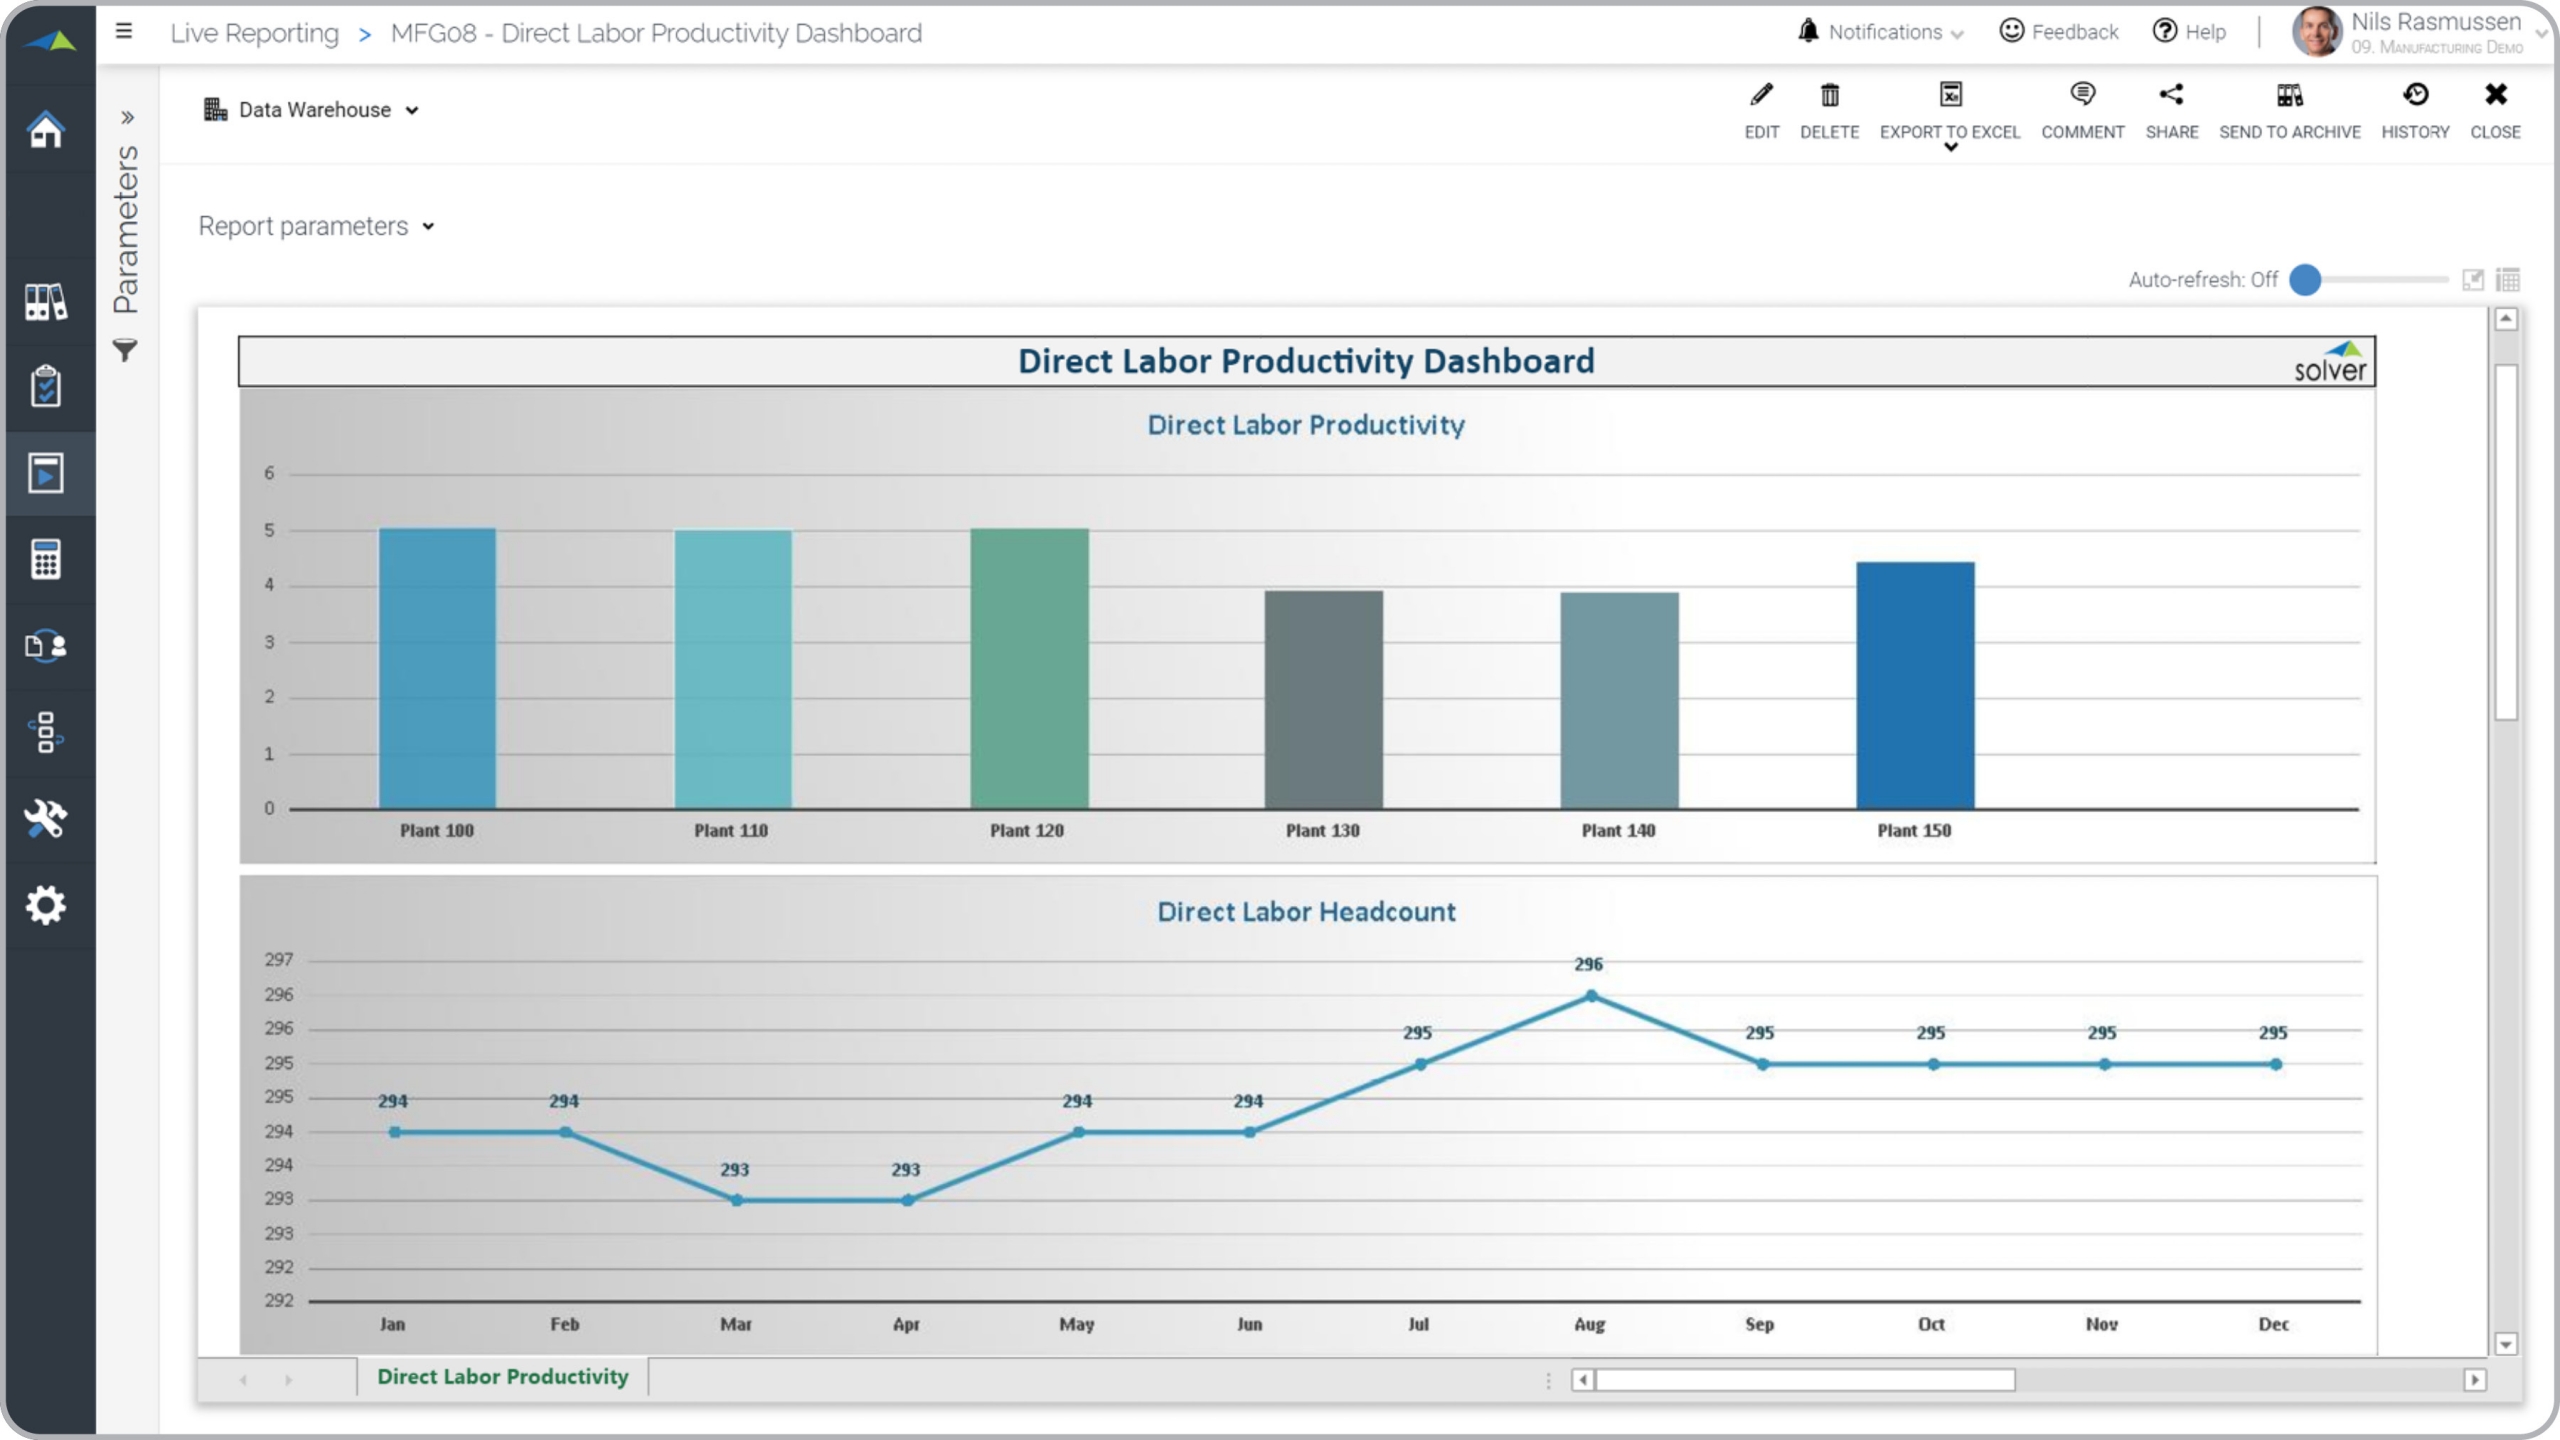
Mfg – Direct Labor Productivity
Labor productivity compared across plants and monthly trend for direct labor headcount.
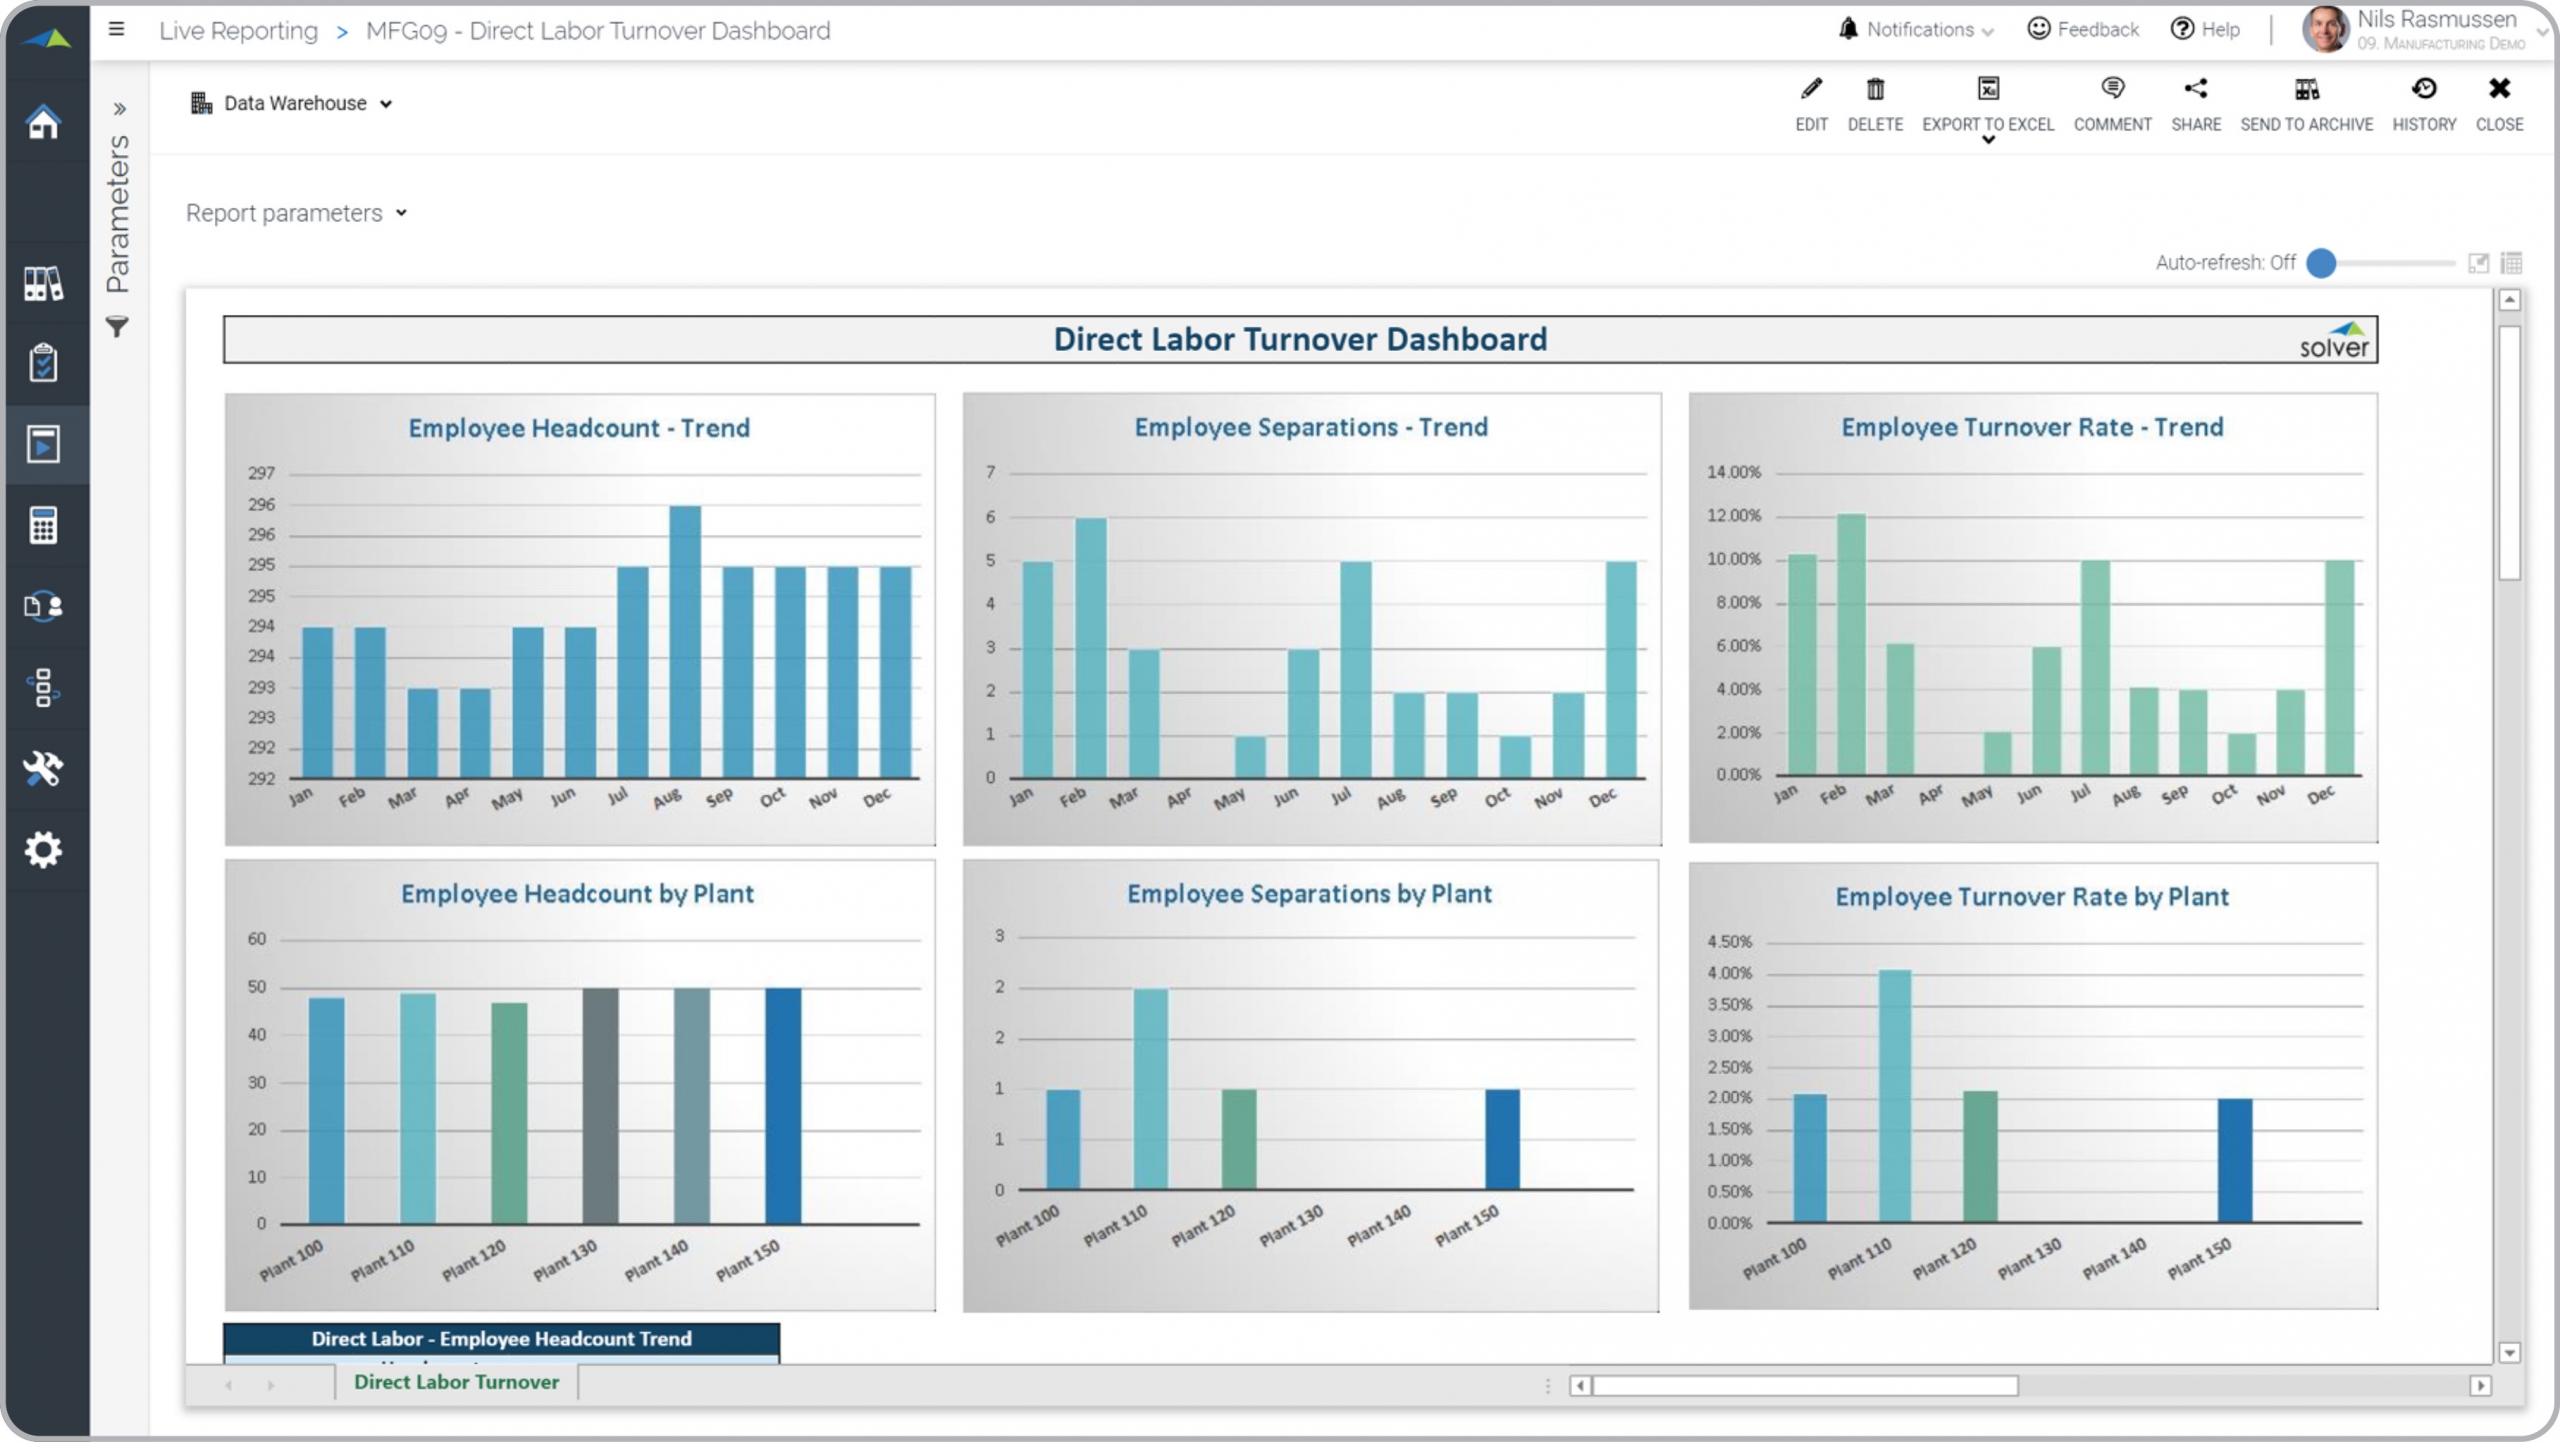
Mfg – Direct Labor Turnover Analysis
Headcount, employee separation and turnover rate by plant and month.
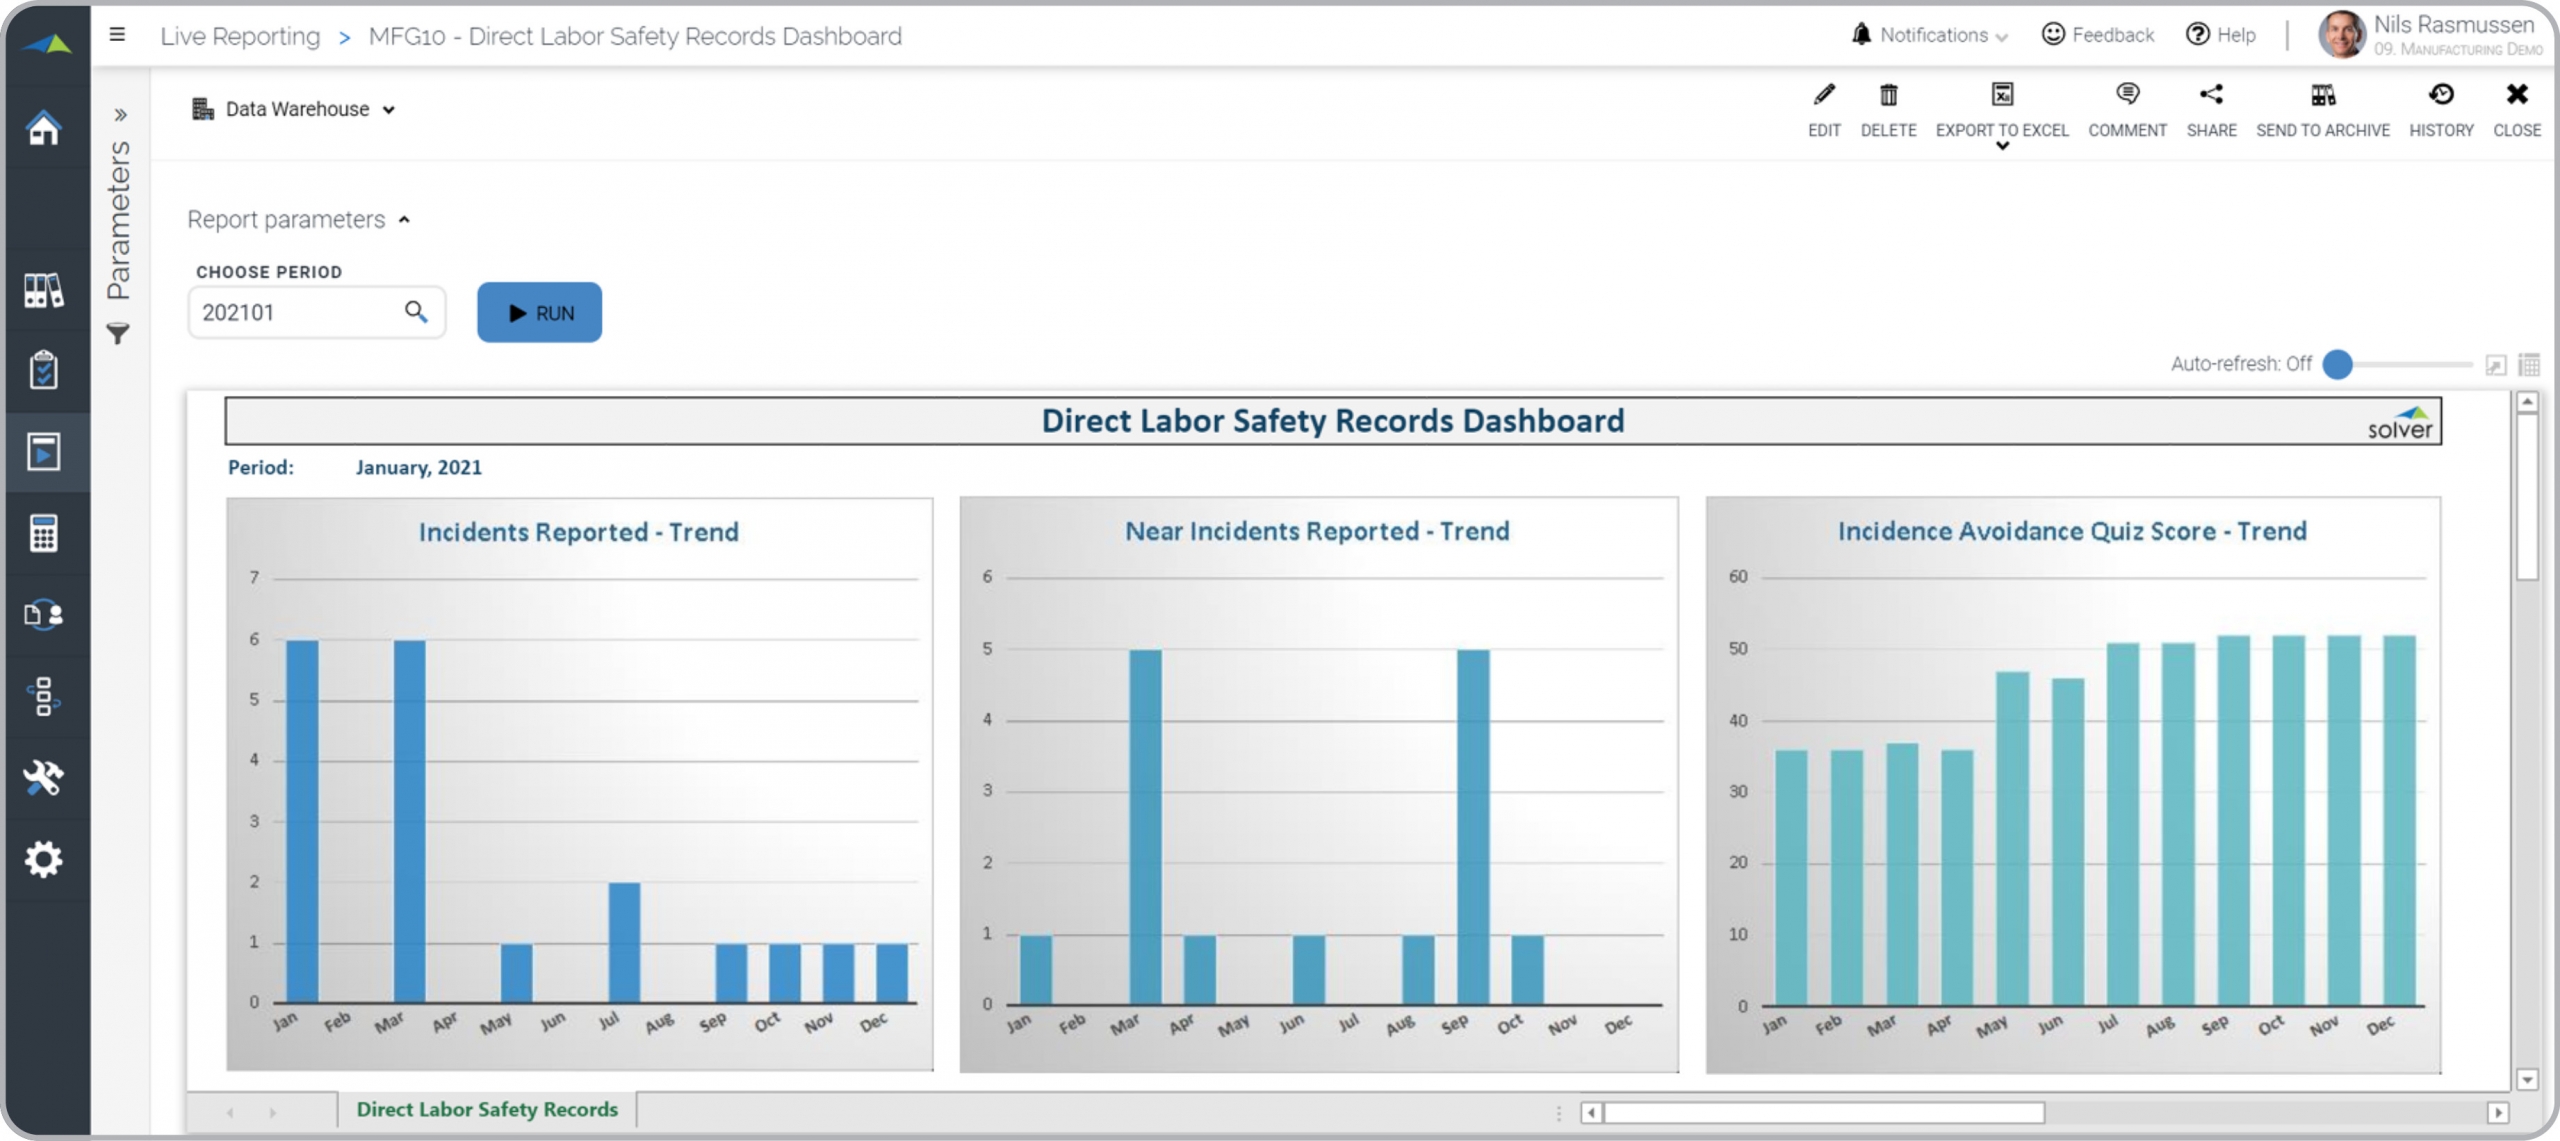
Mfg – Labor Safety Record Analysis
Dashboard showing monthly trends in incidents and near incidents reported, and test scores.
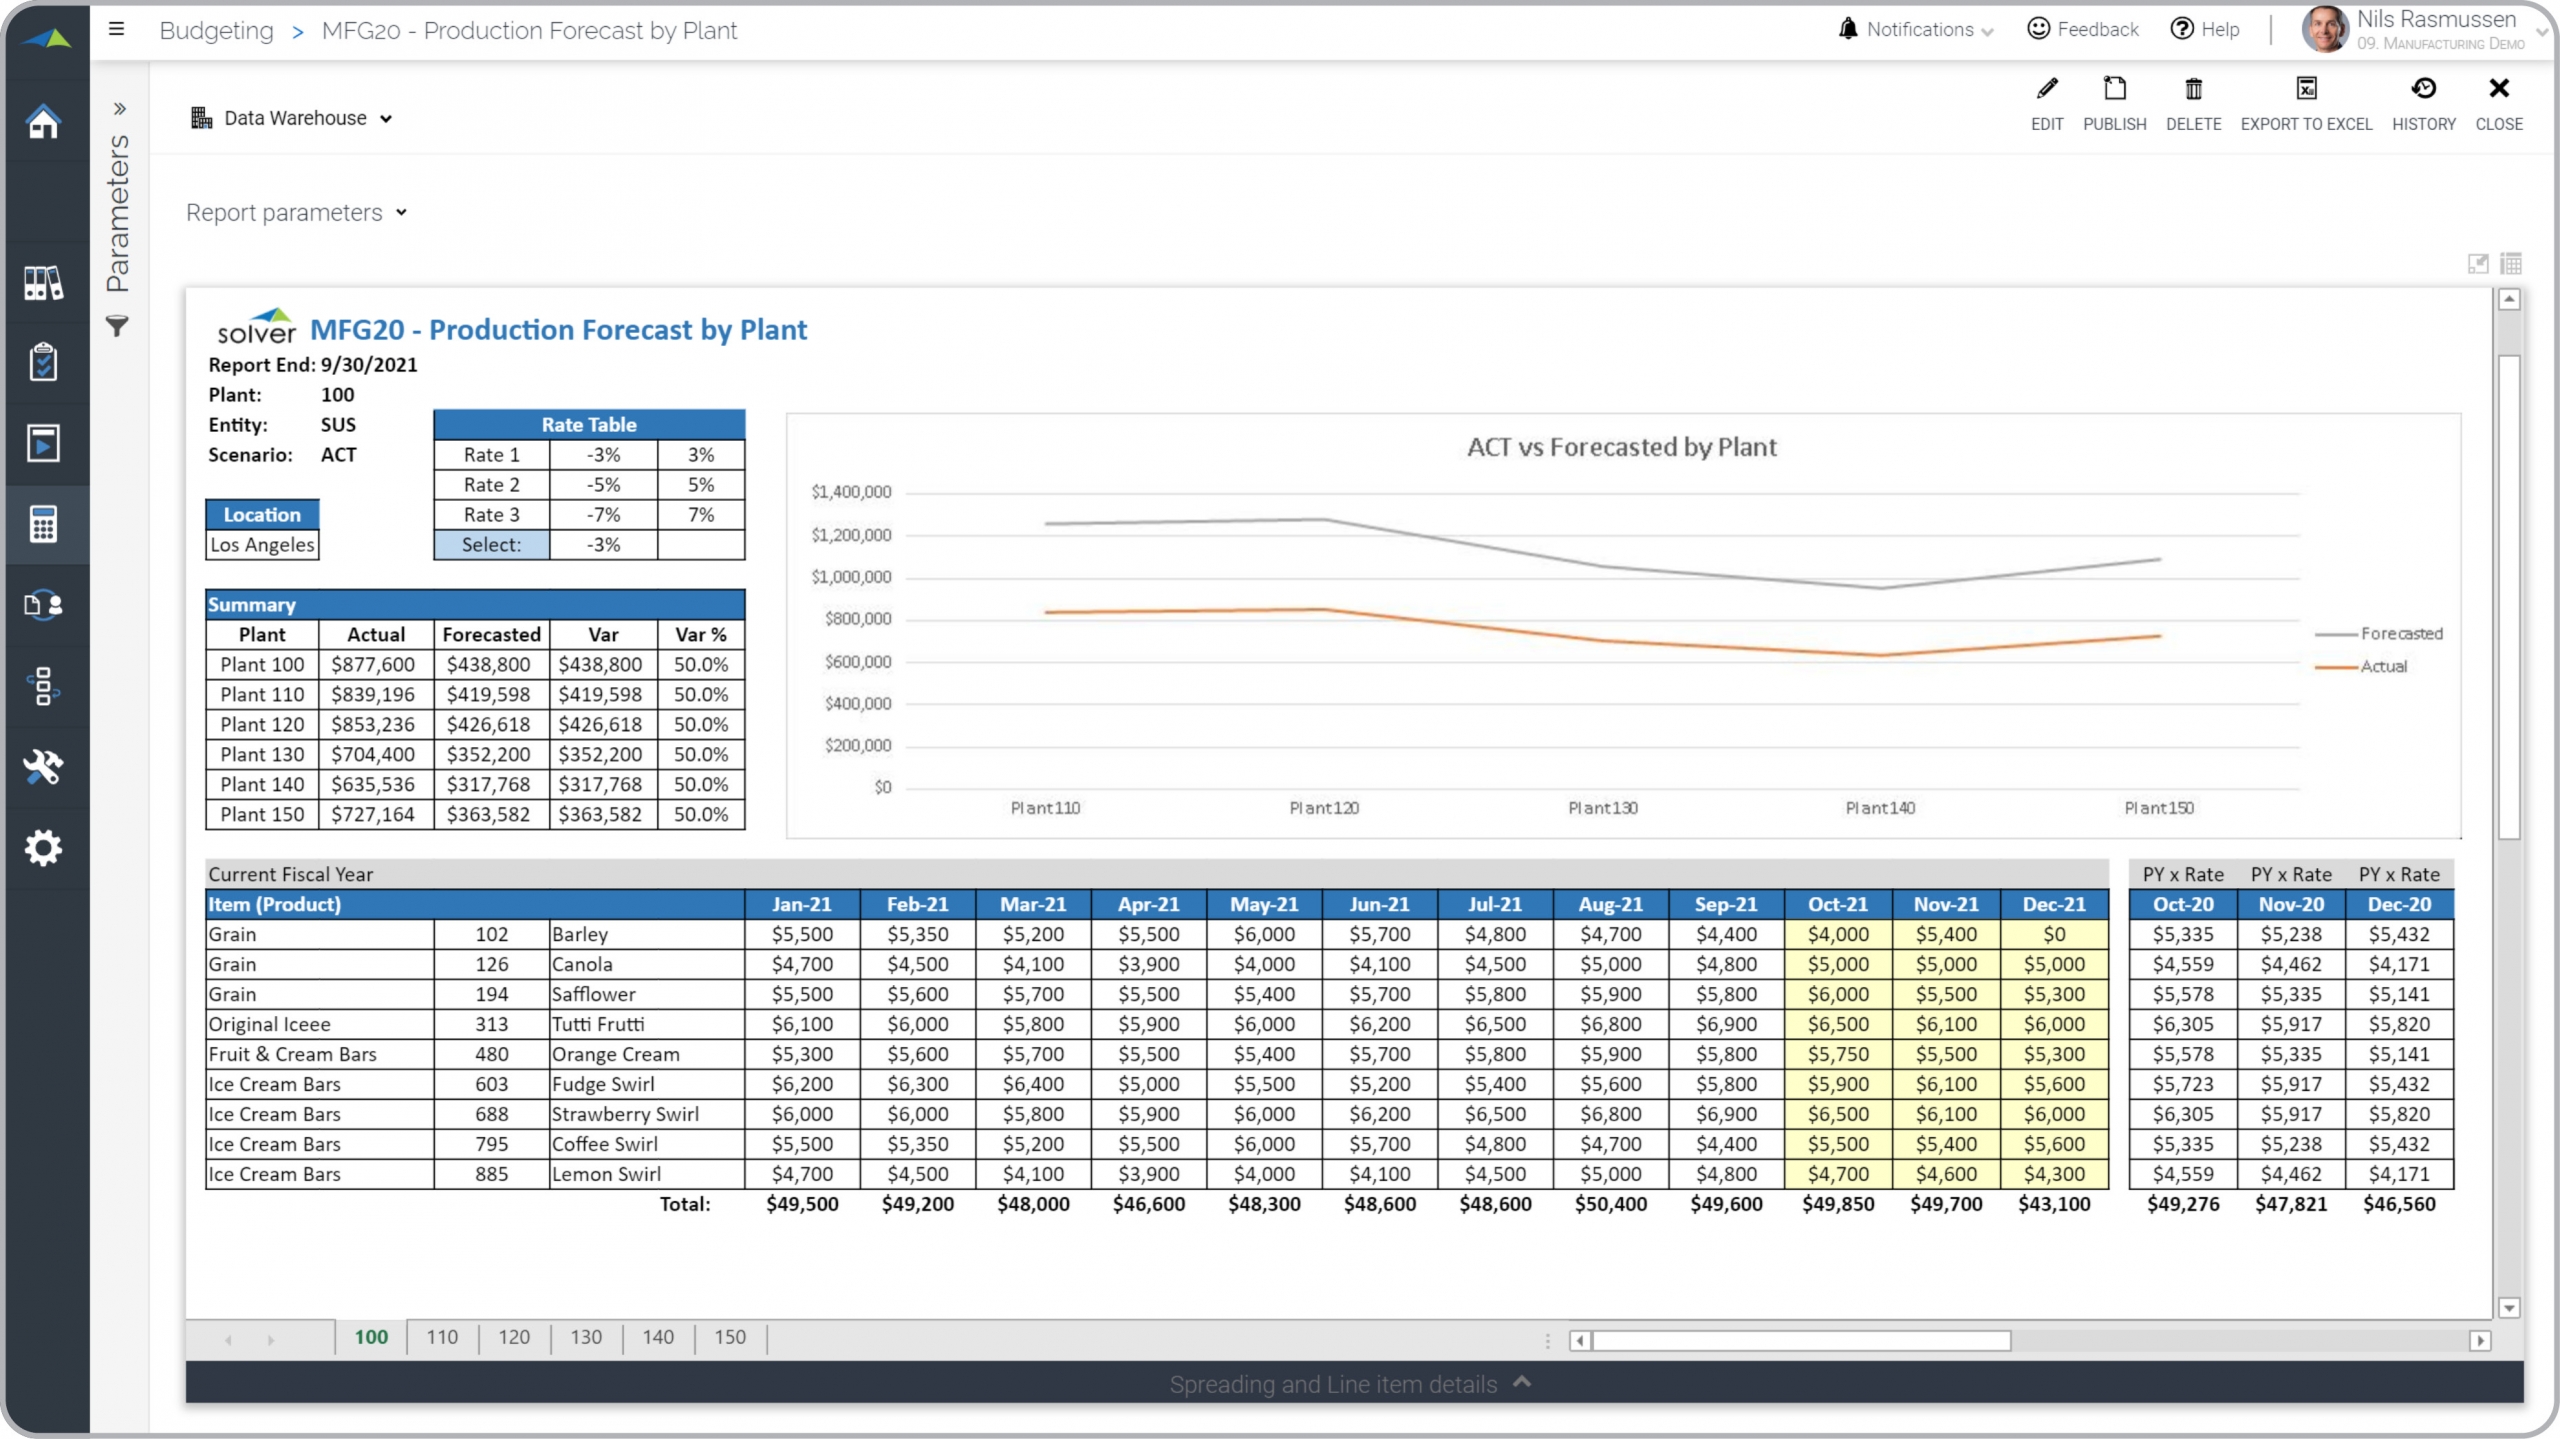
Mfg – Production Forecast per Plant
Input of monthly production forecast (amount) per product per plant.
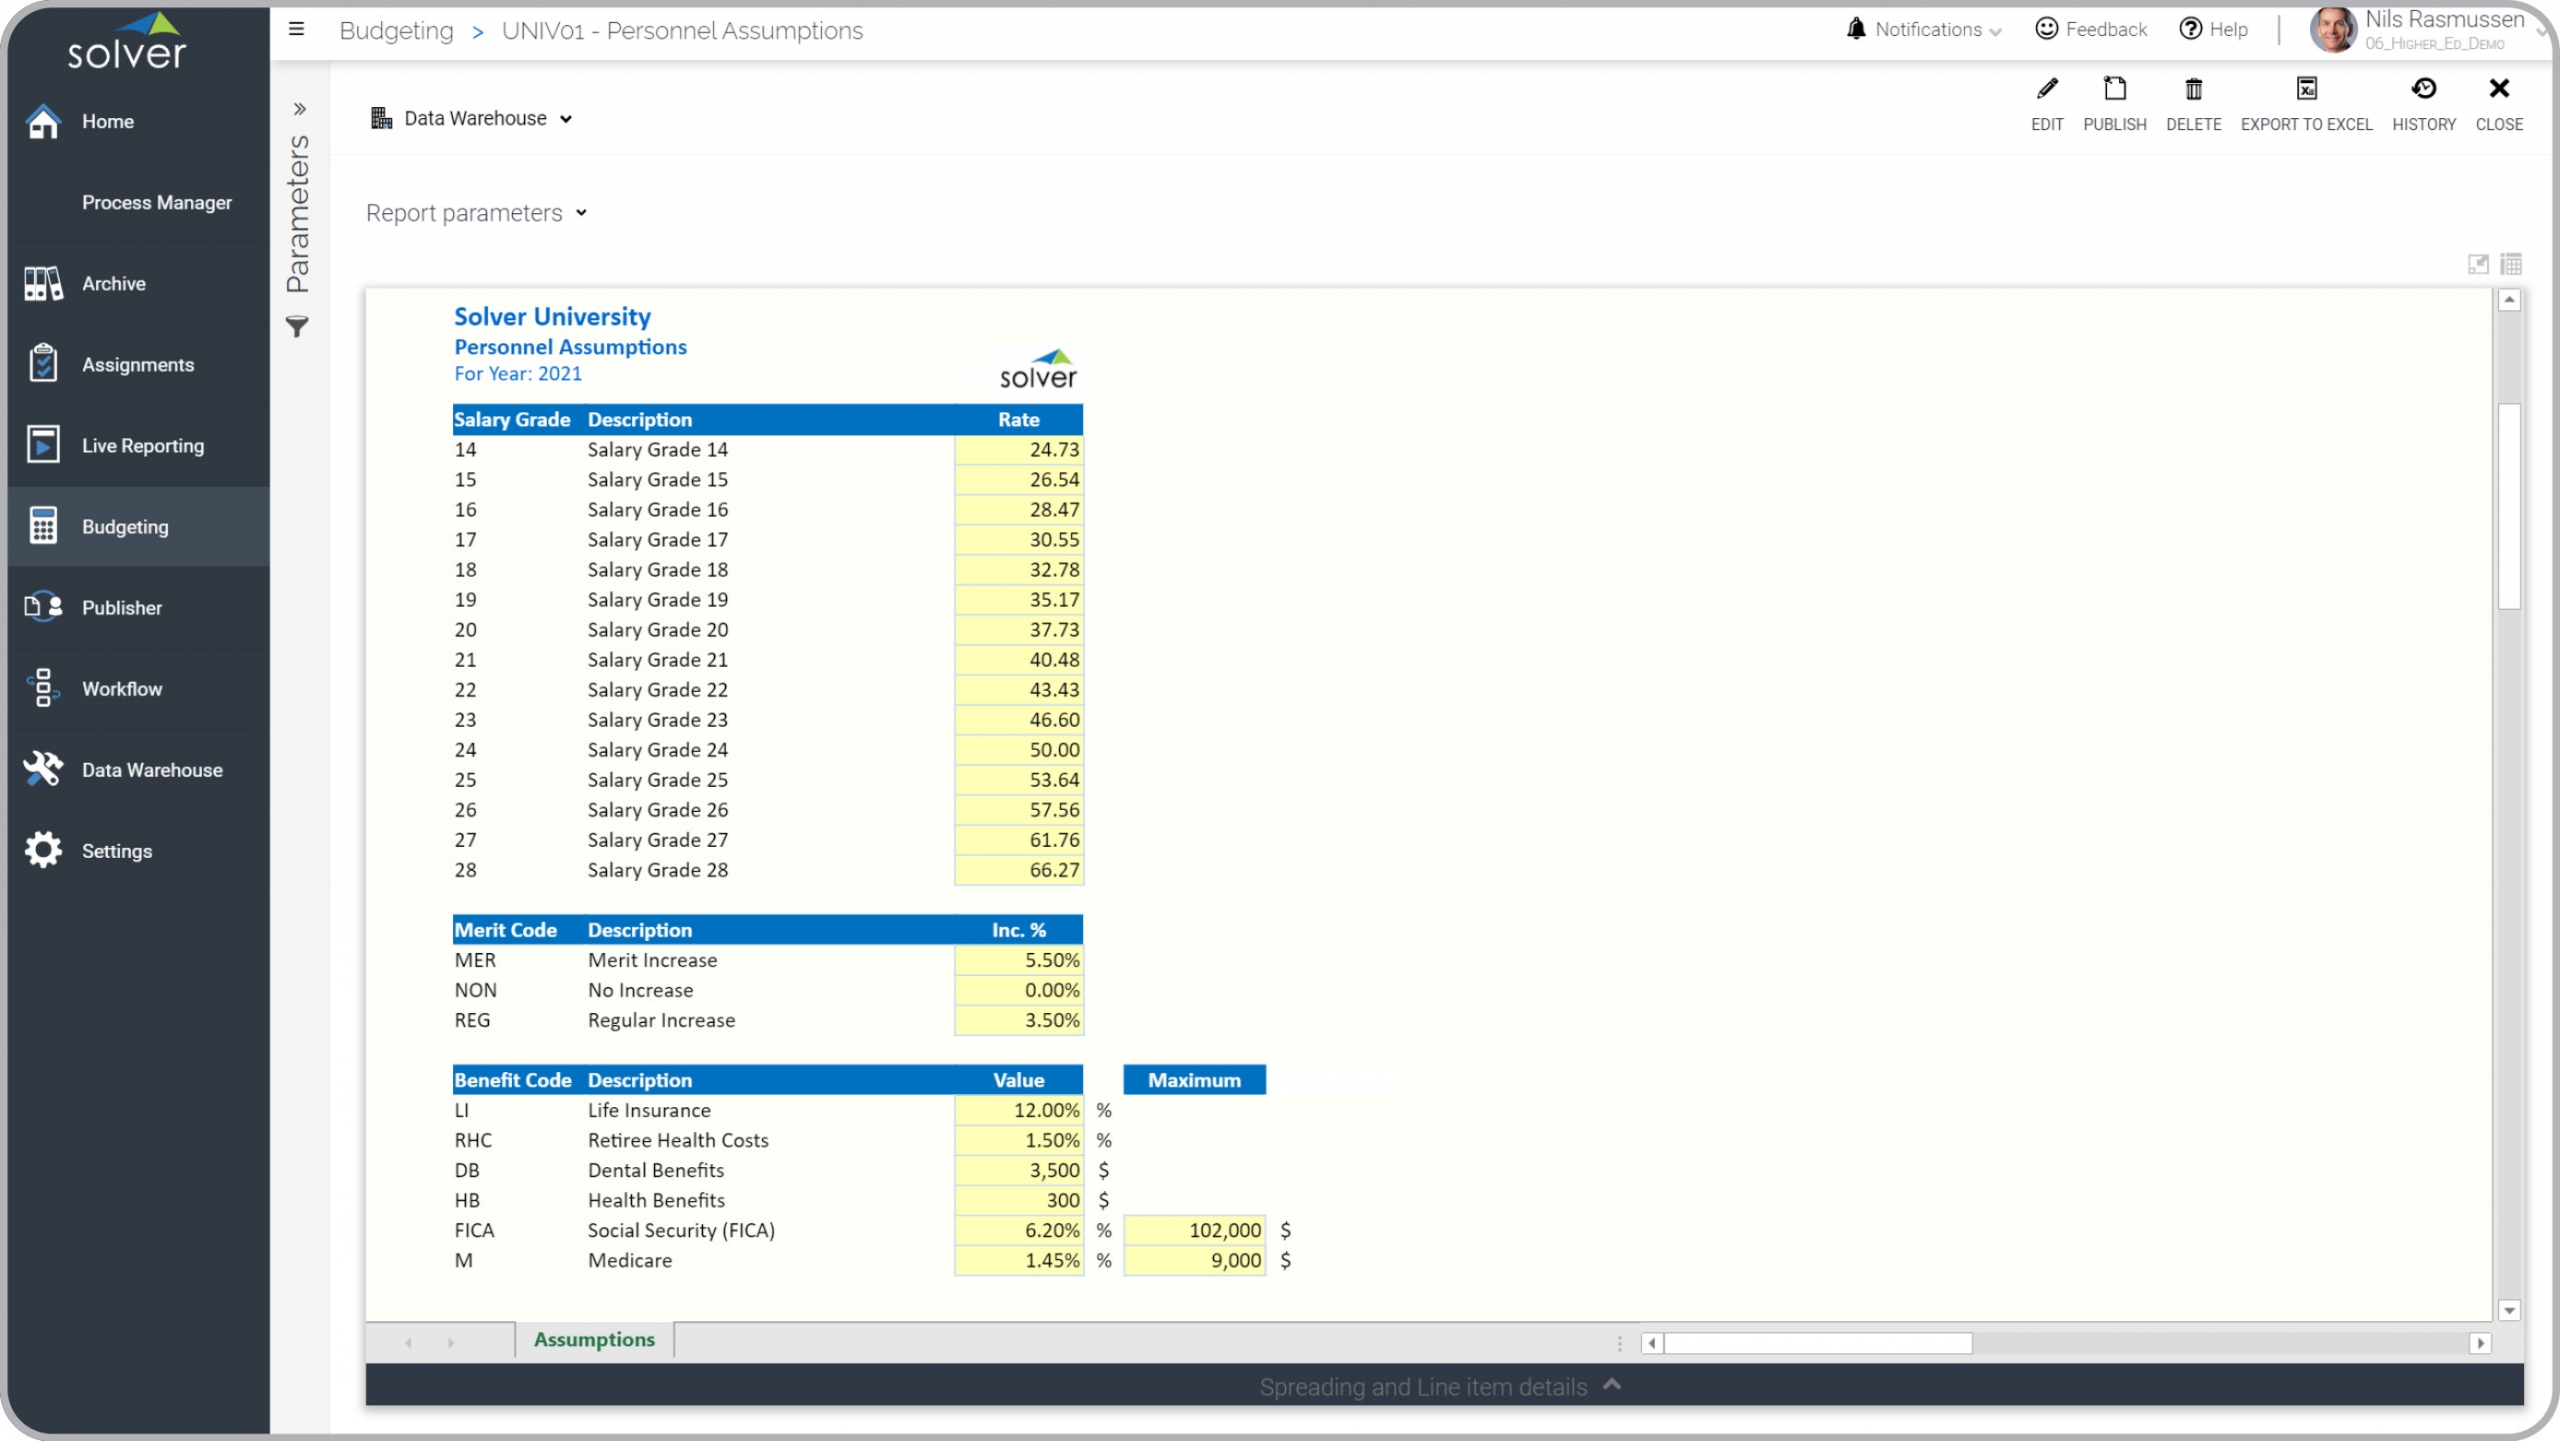
Higher Ed – Salary Assumptions
Input of drivers for payroll budget, including benefits, merit increases and salary grade rates.
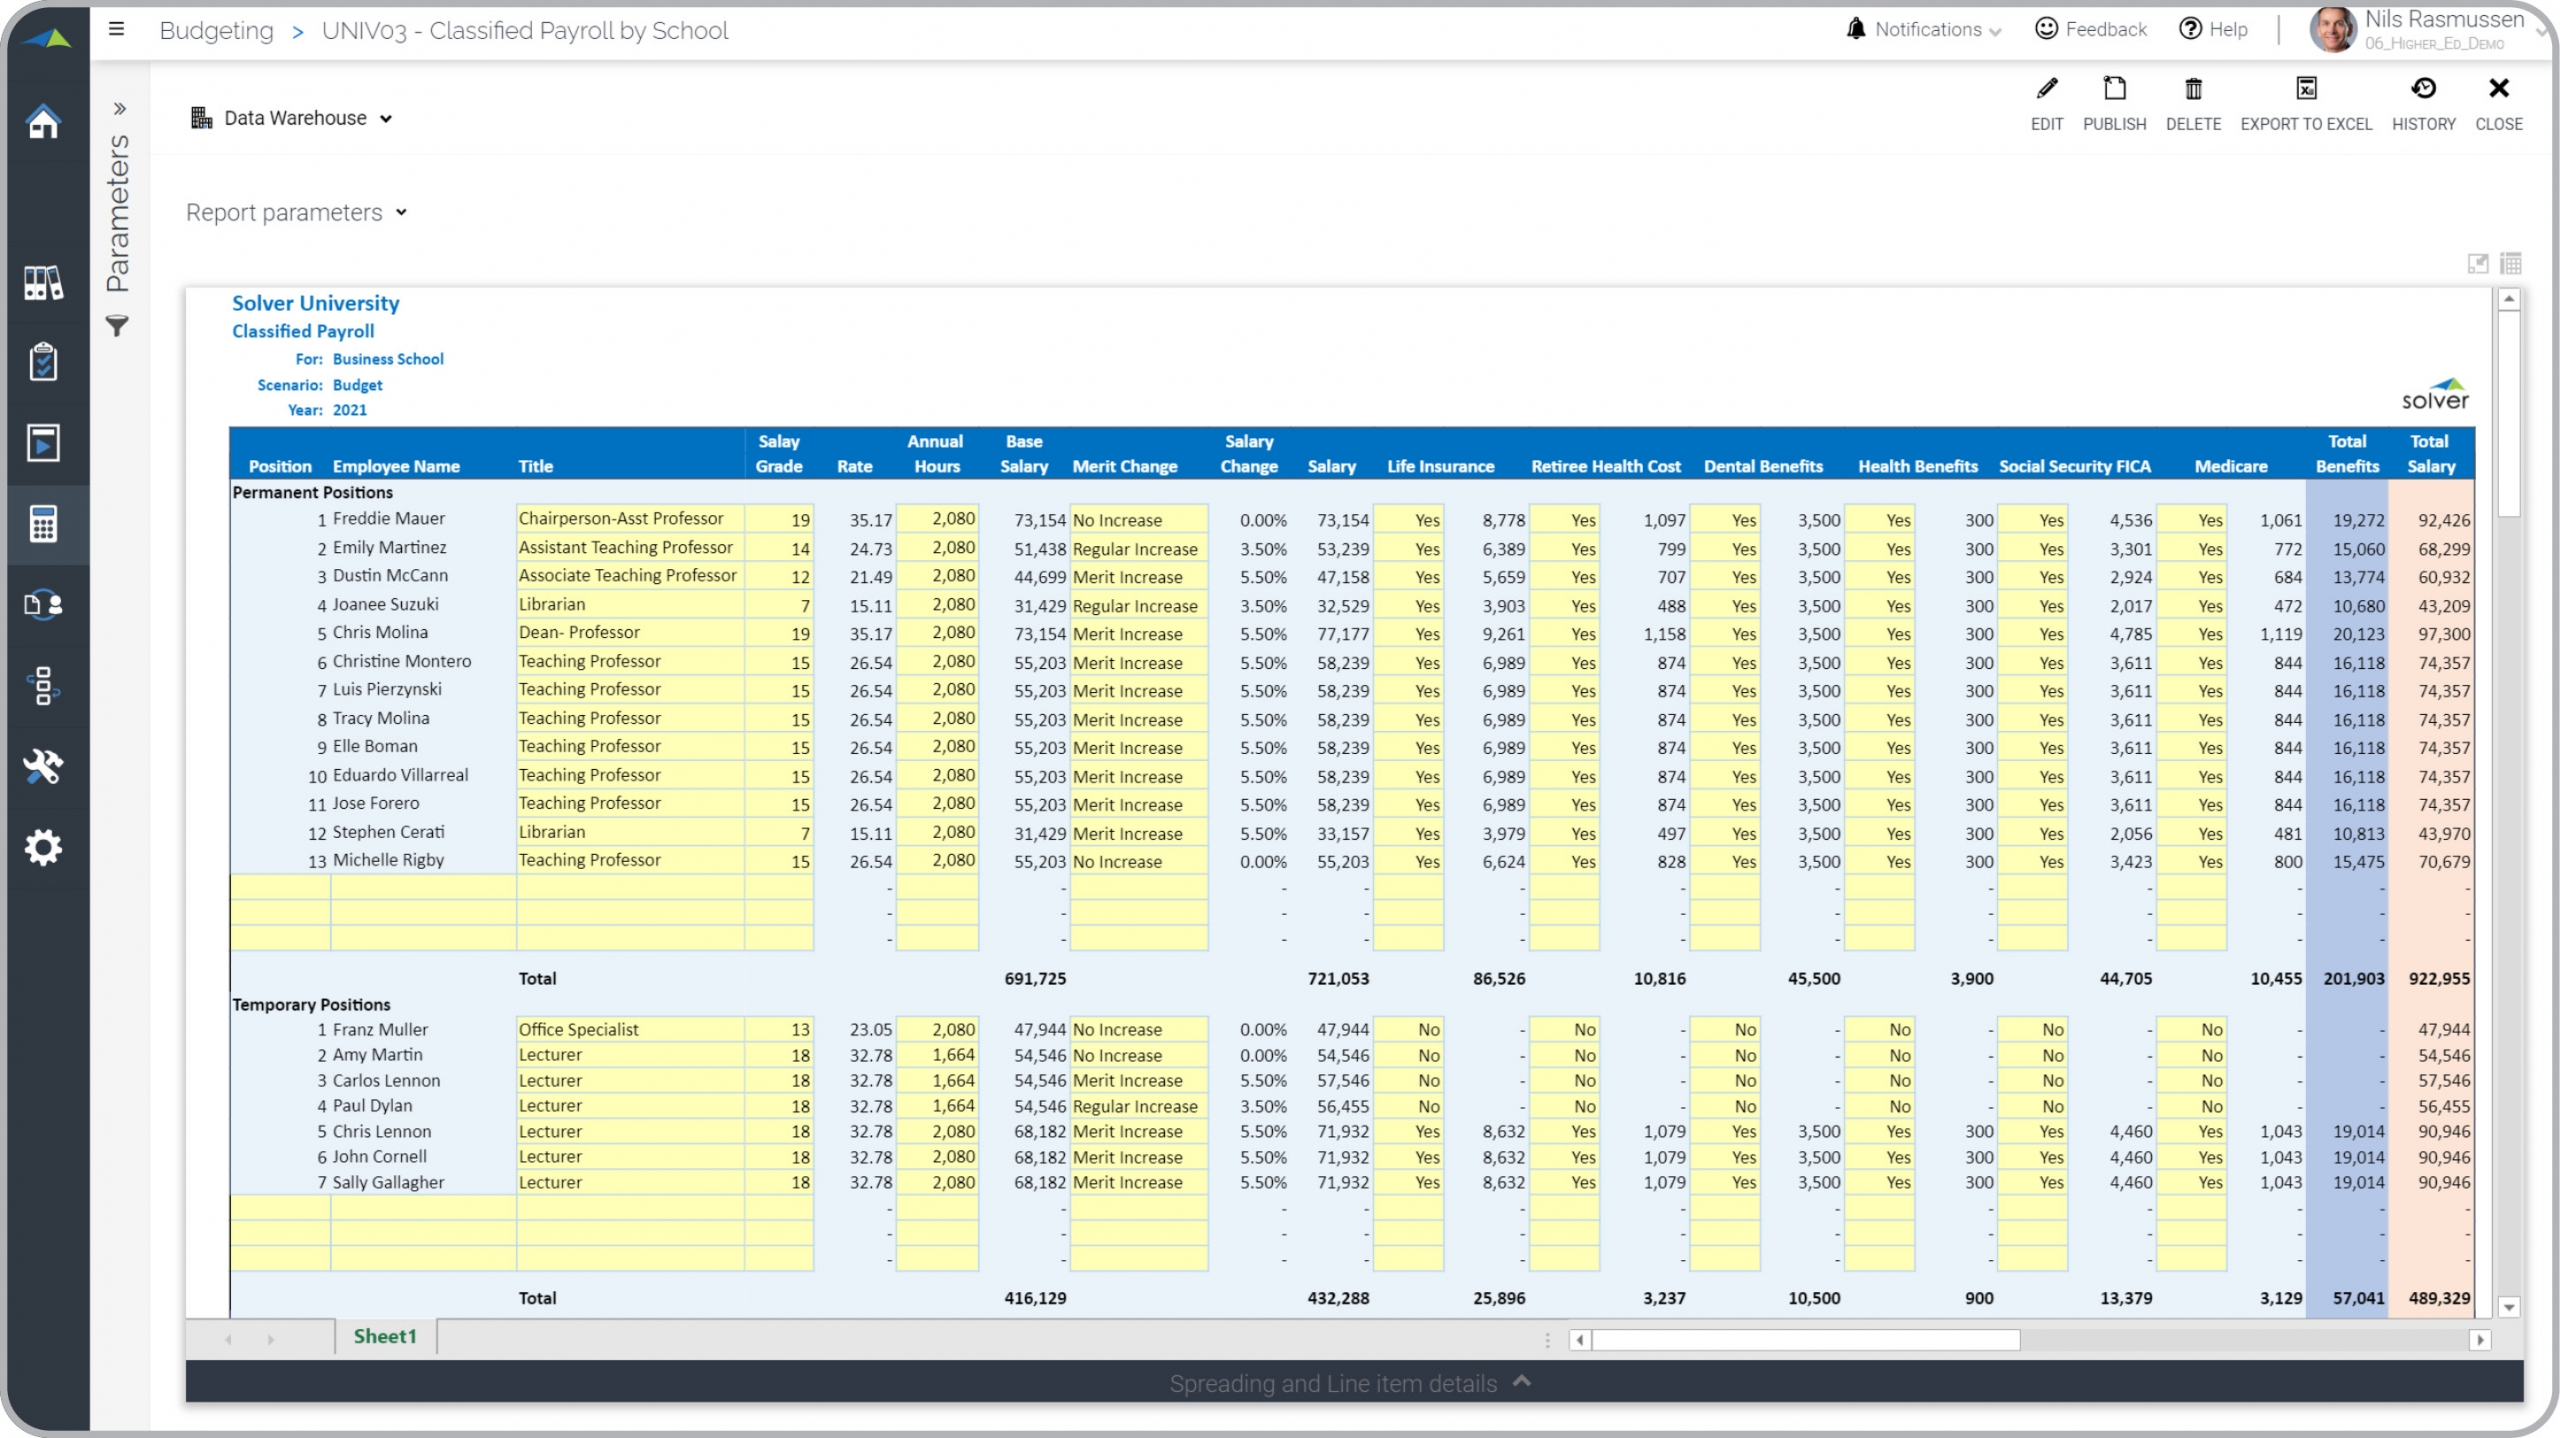
Higher Ed – Classified Payroll Budget
Input of compensation detail for permanent and temporary positions.
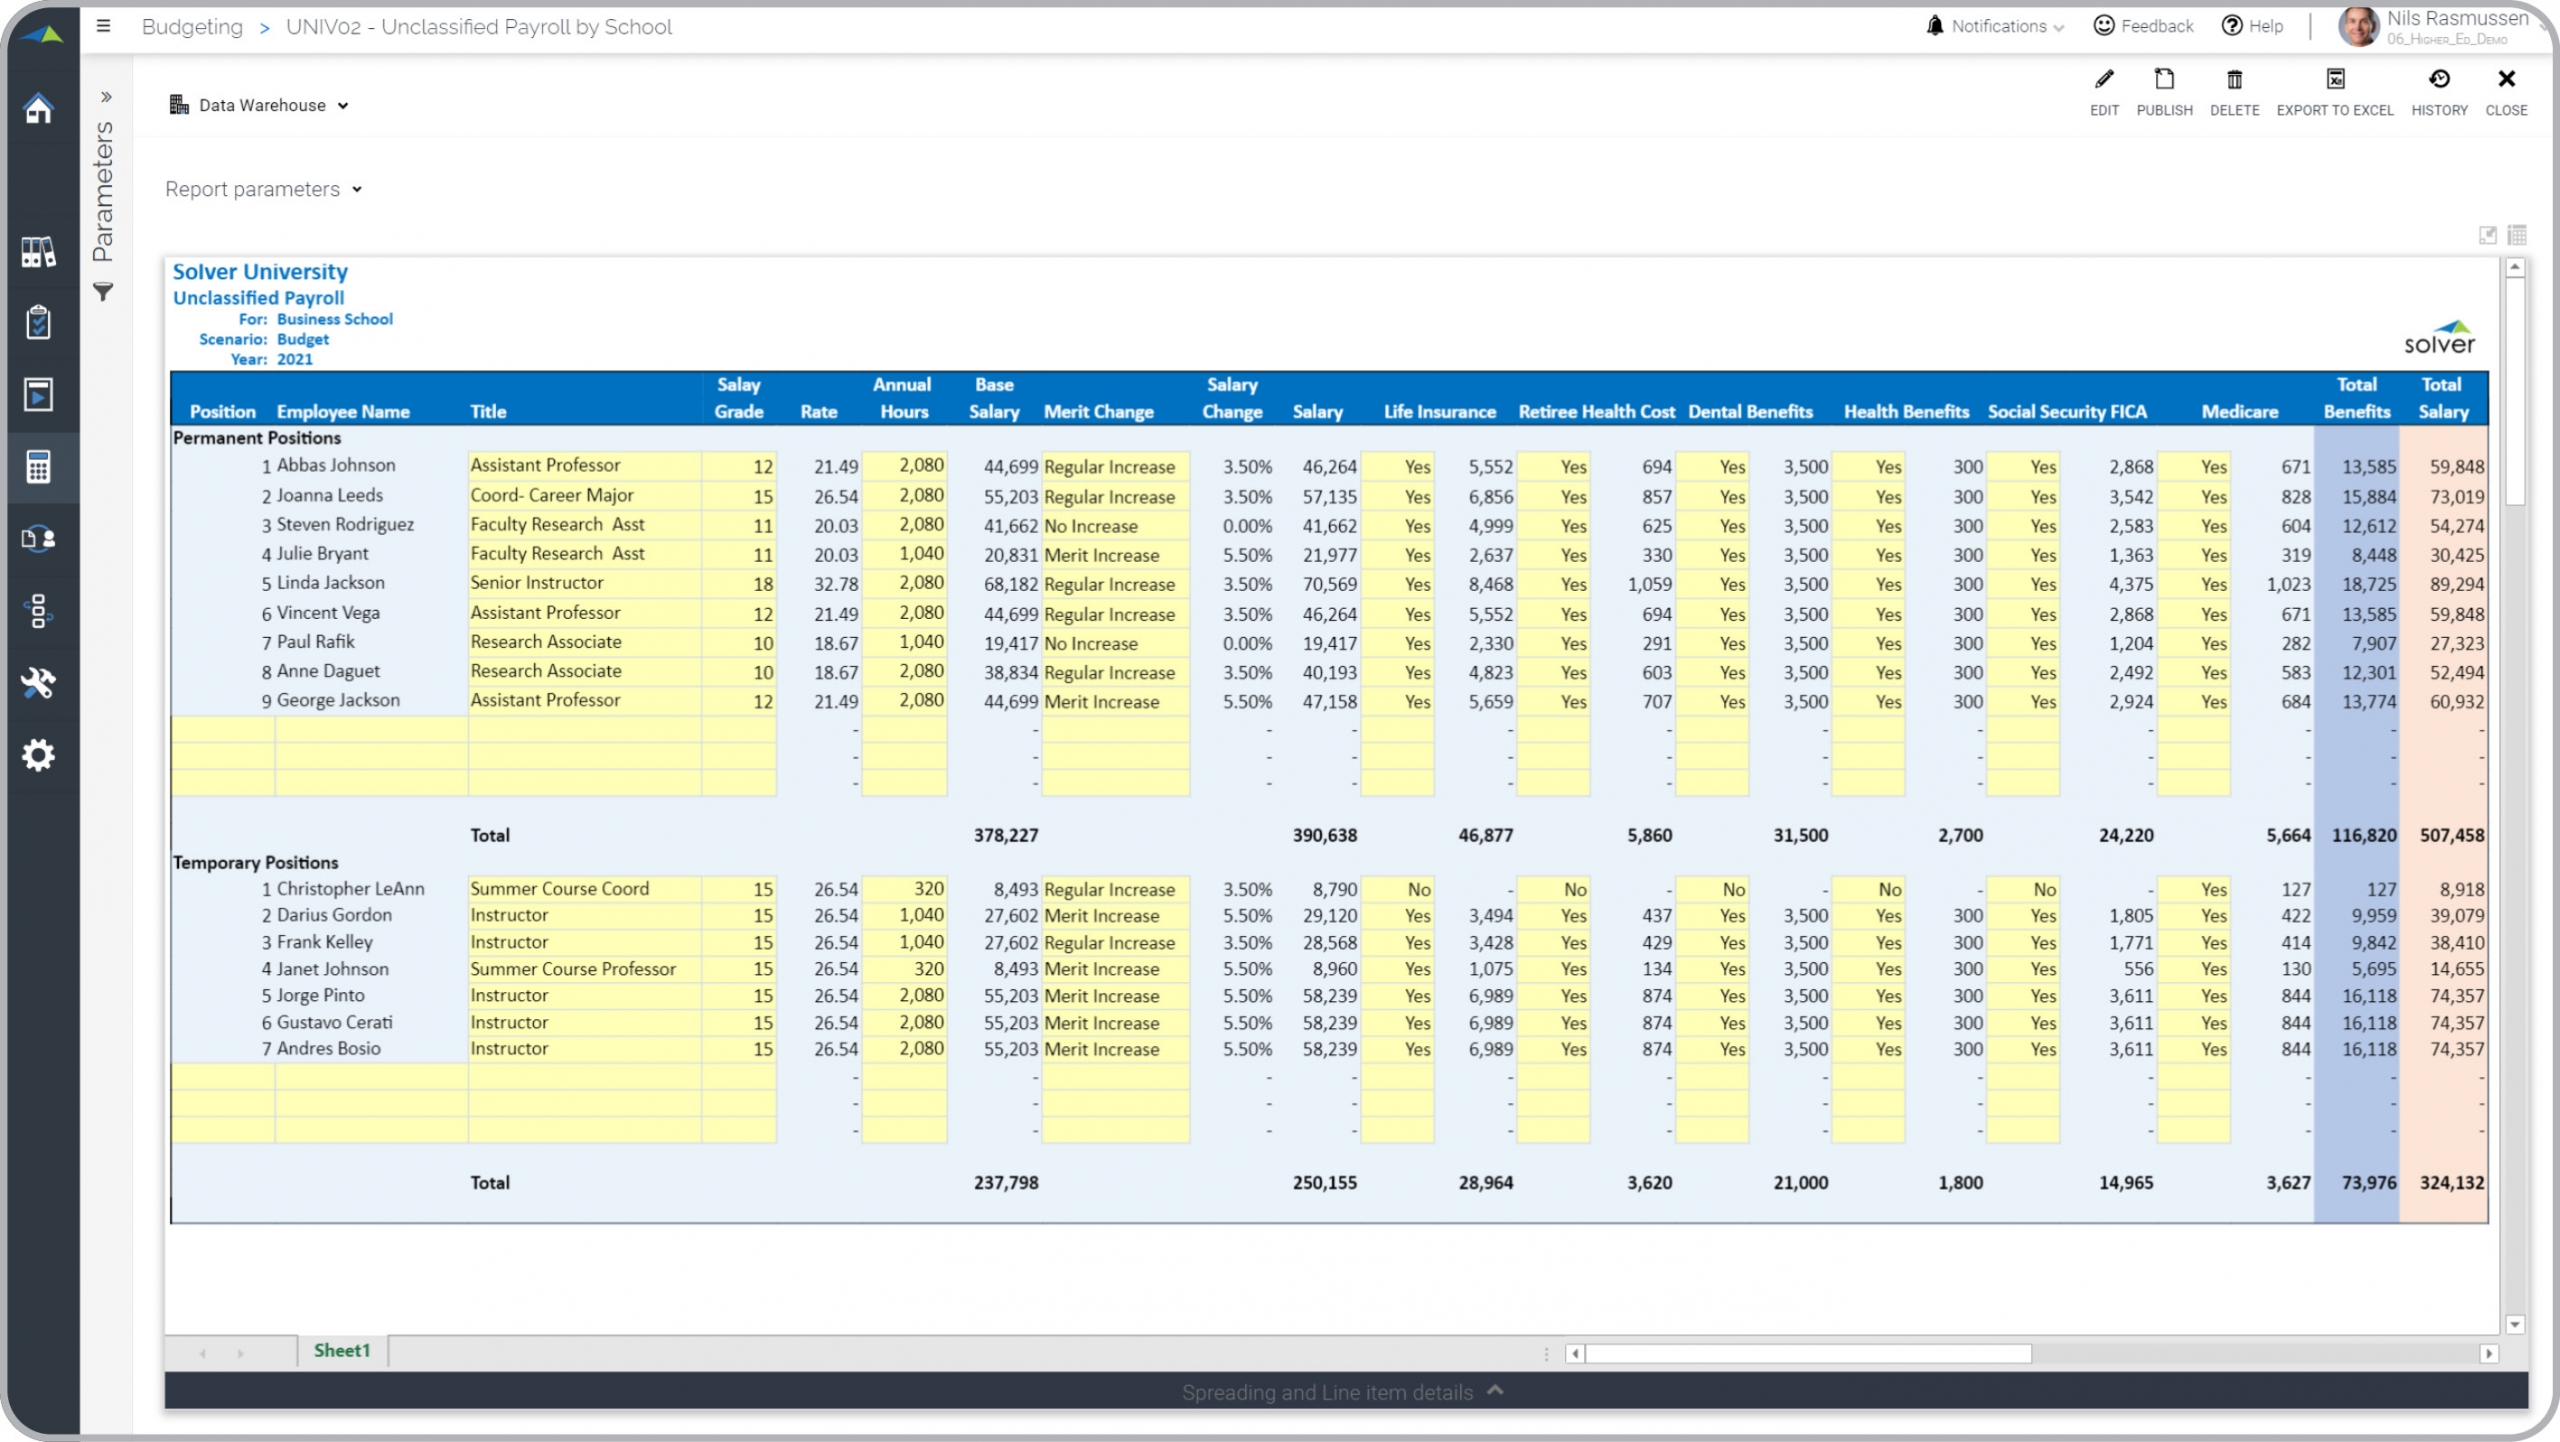
Higher Ed – Unclassified Payroll Budget
Input of compensation detail for permanent and temporary positions.
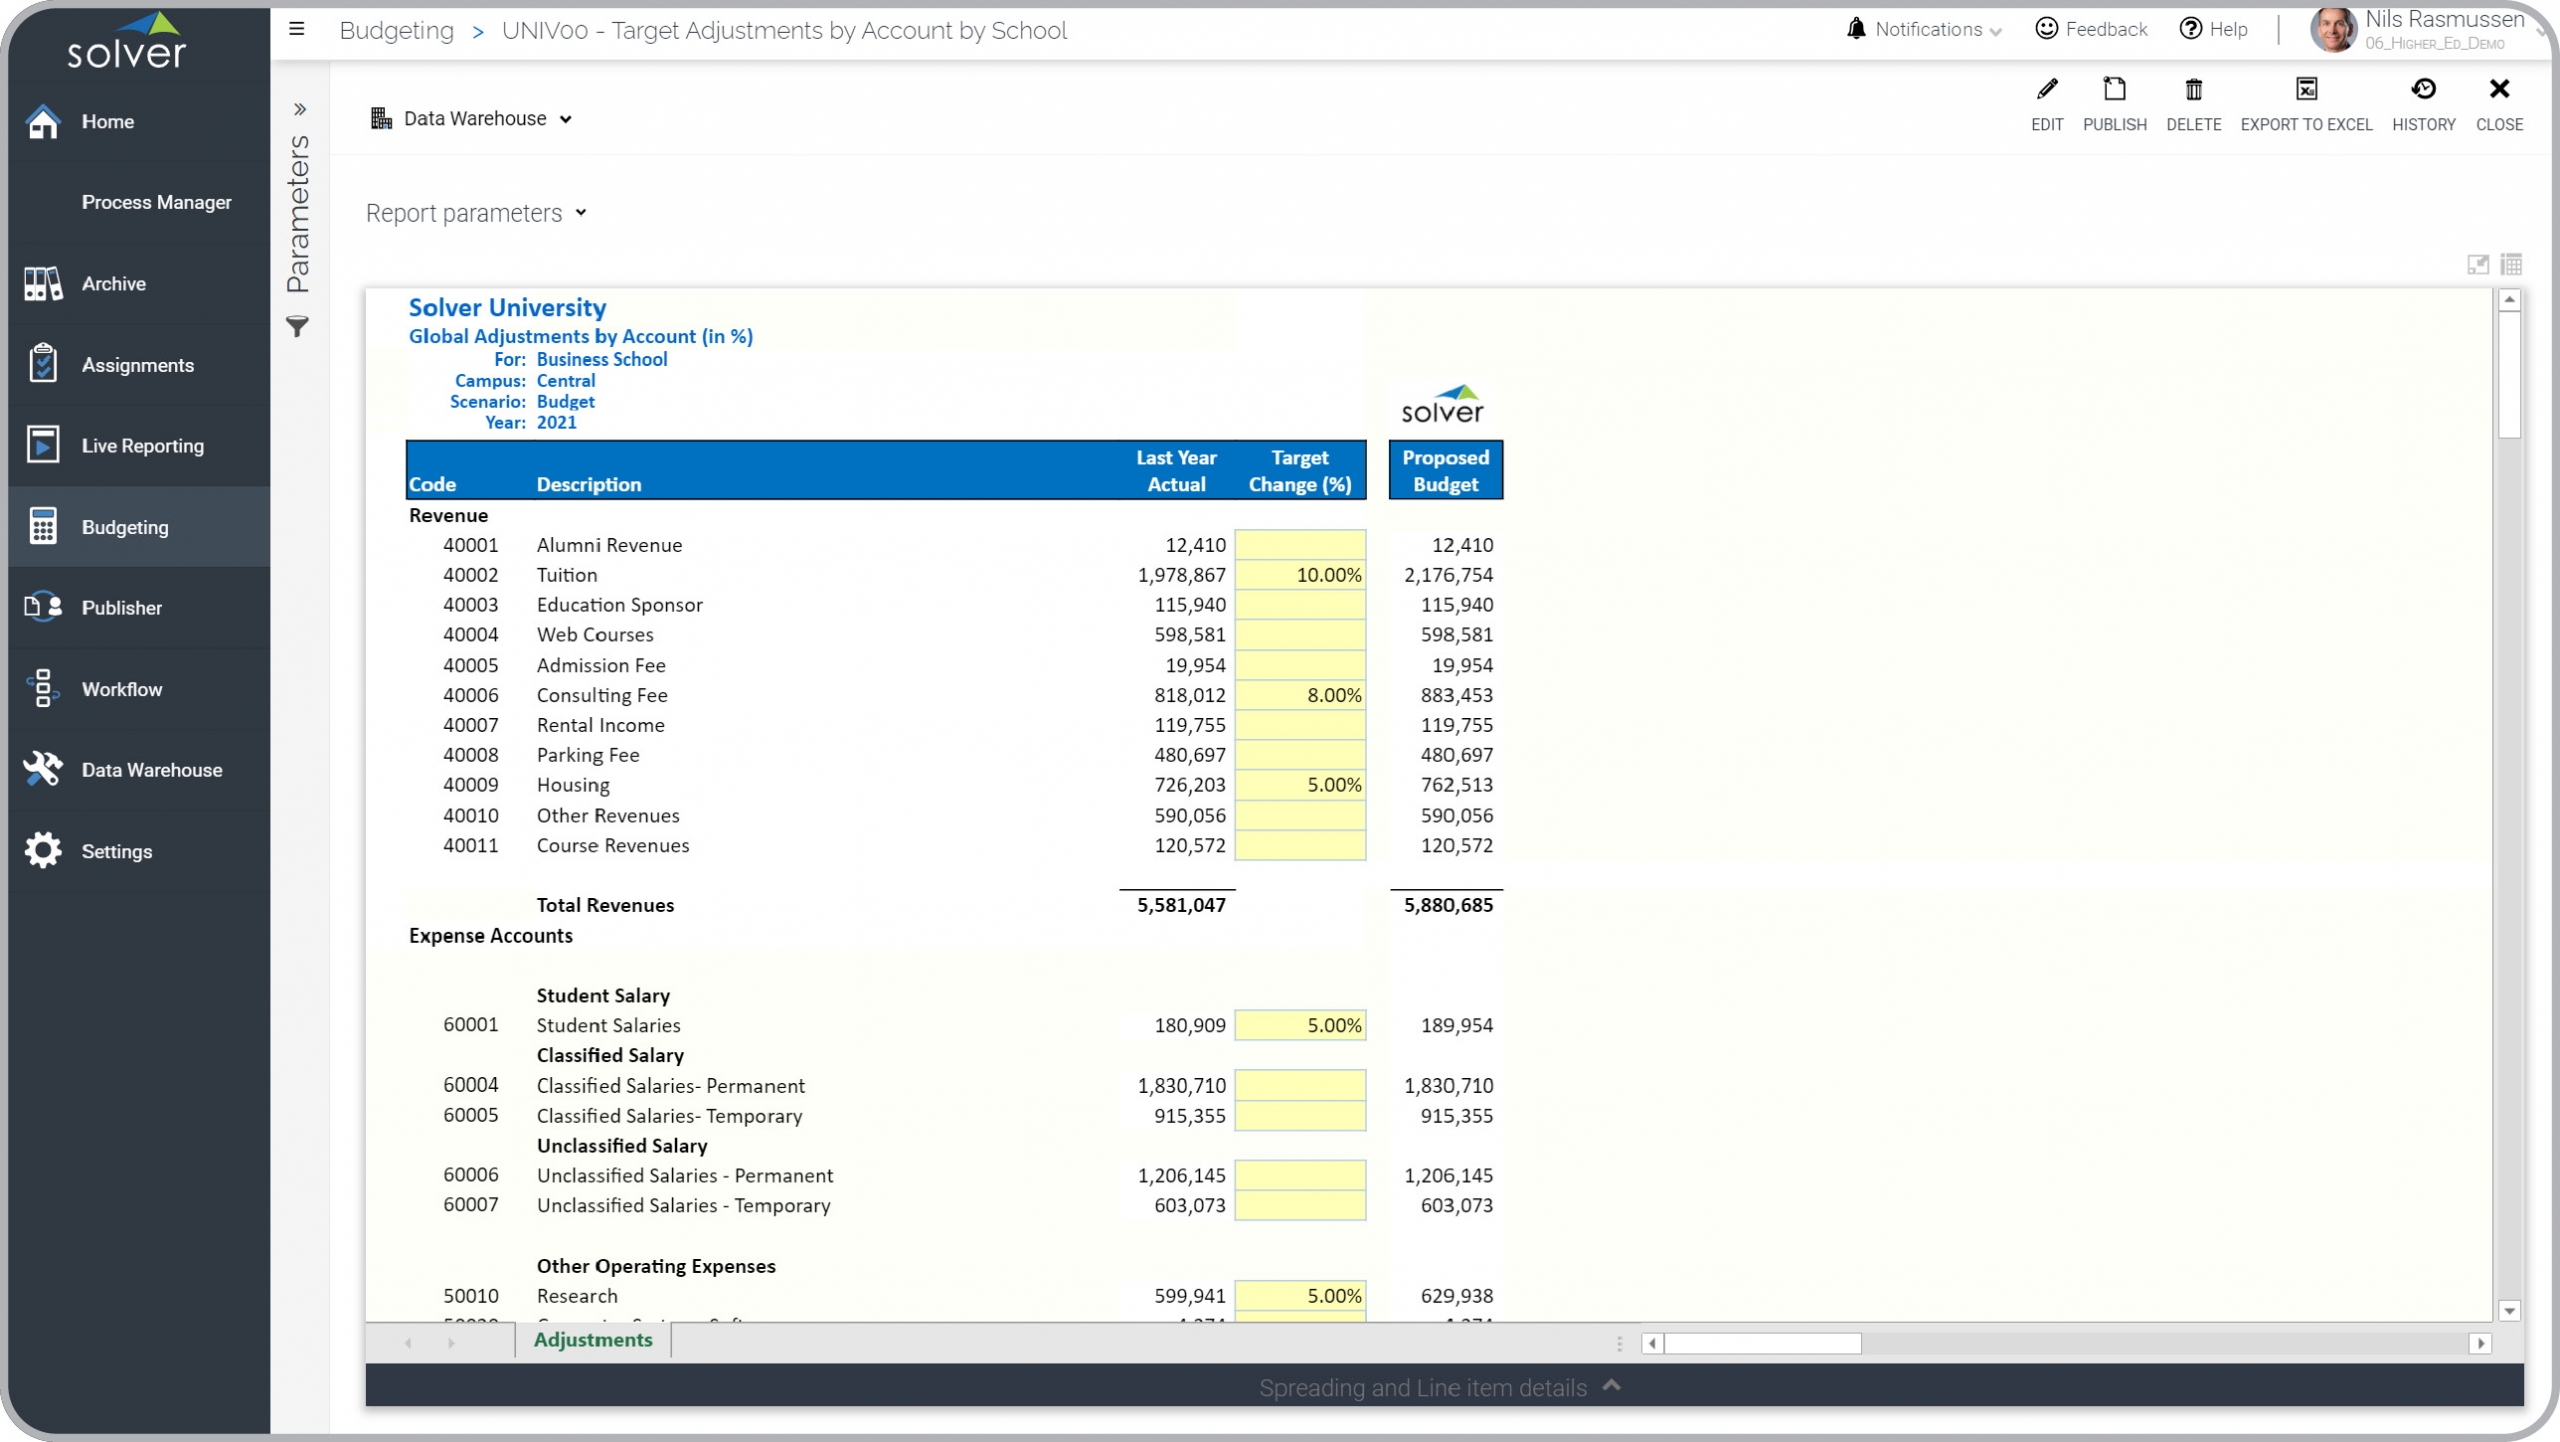
Higher Ed – Target Adjustments by Account
Input of proposed increase/decrease of revenues and expenses for next year's budget.
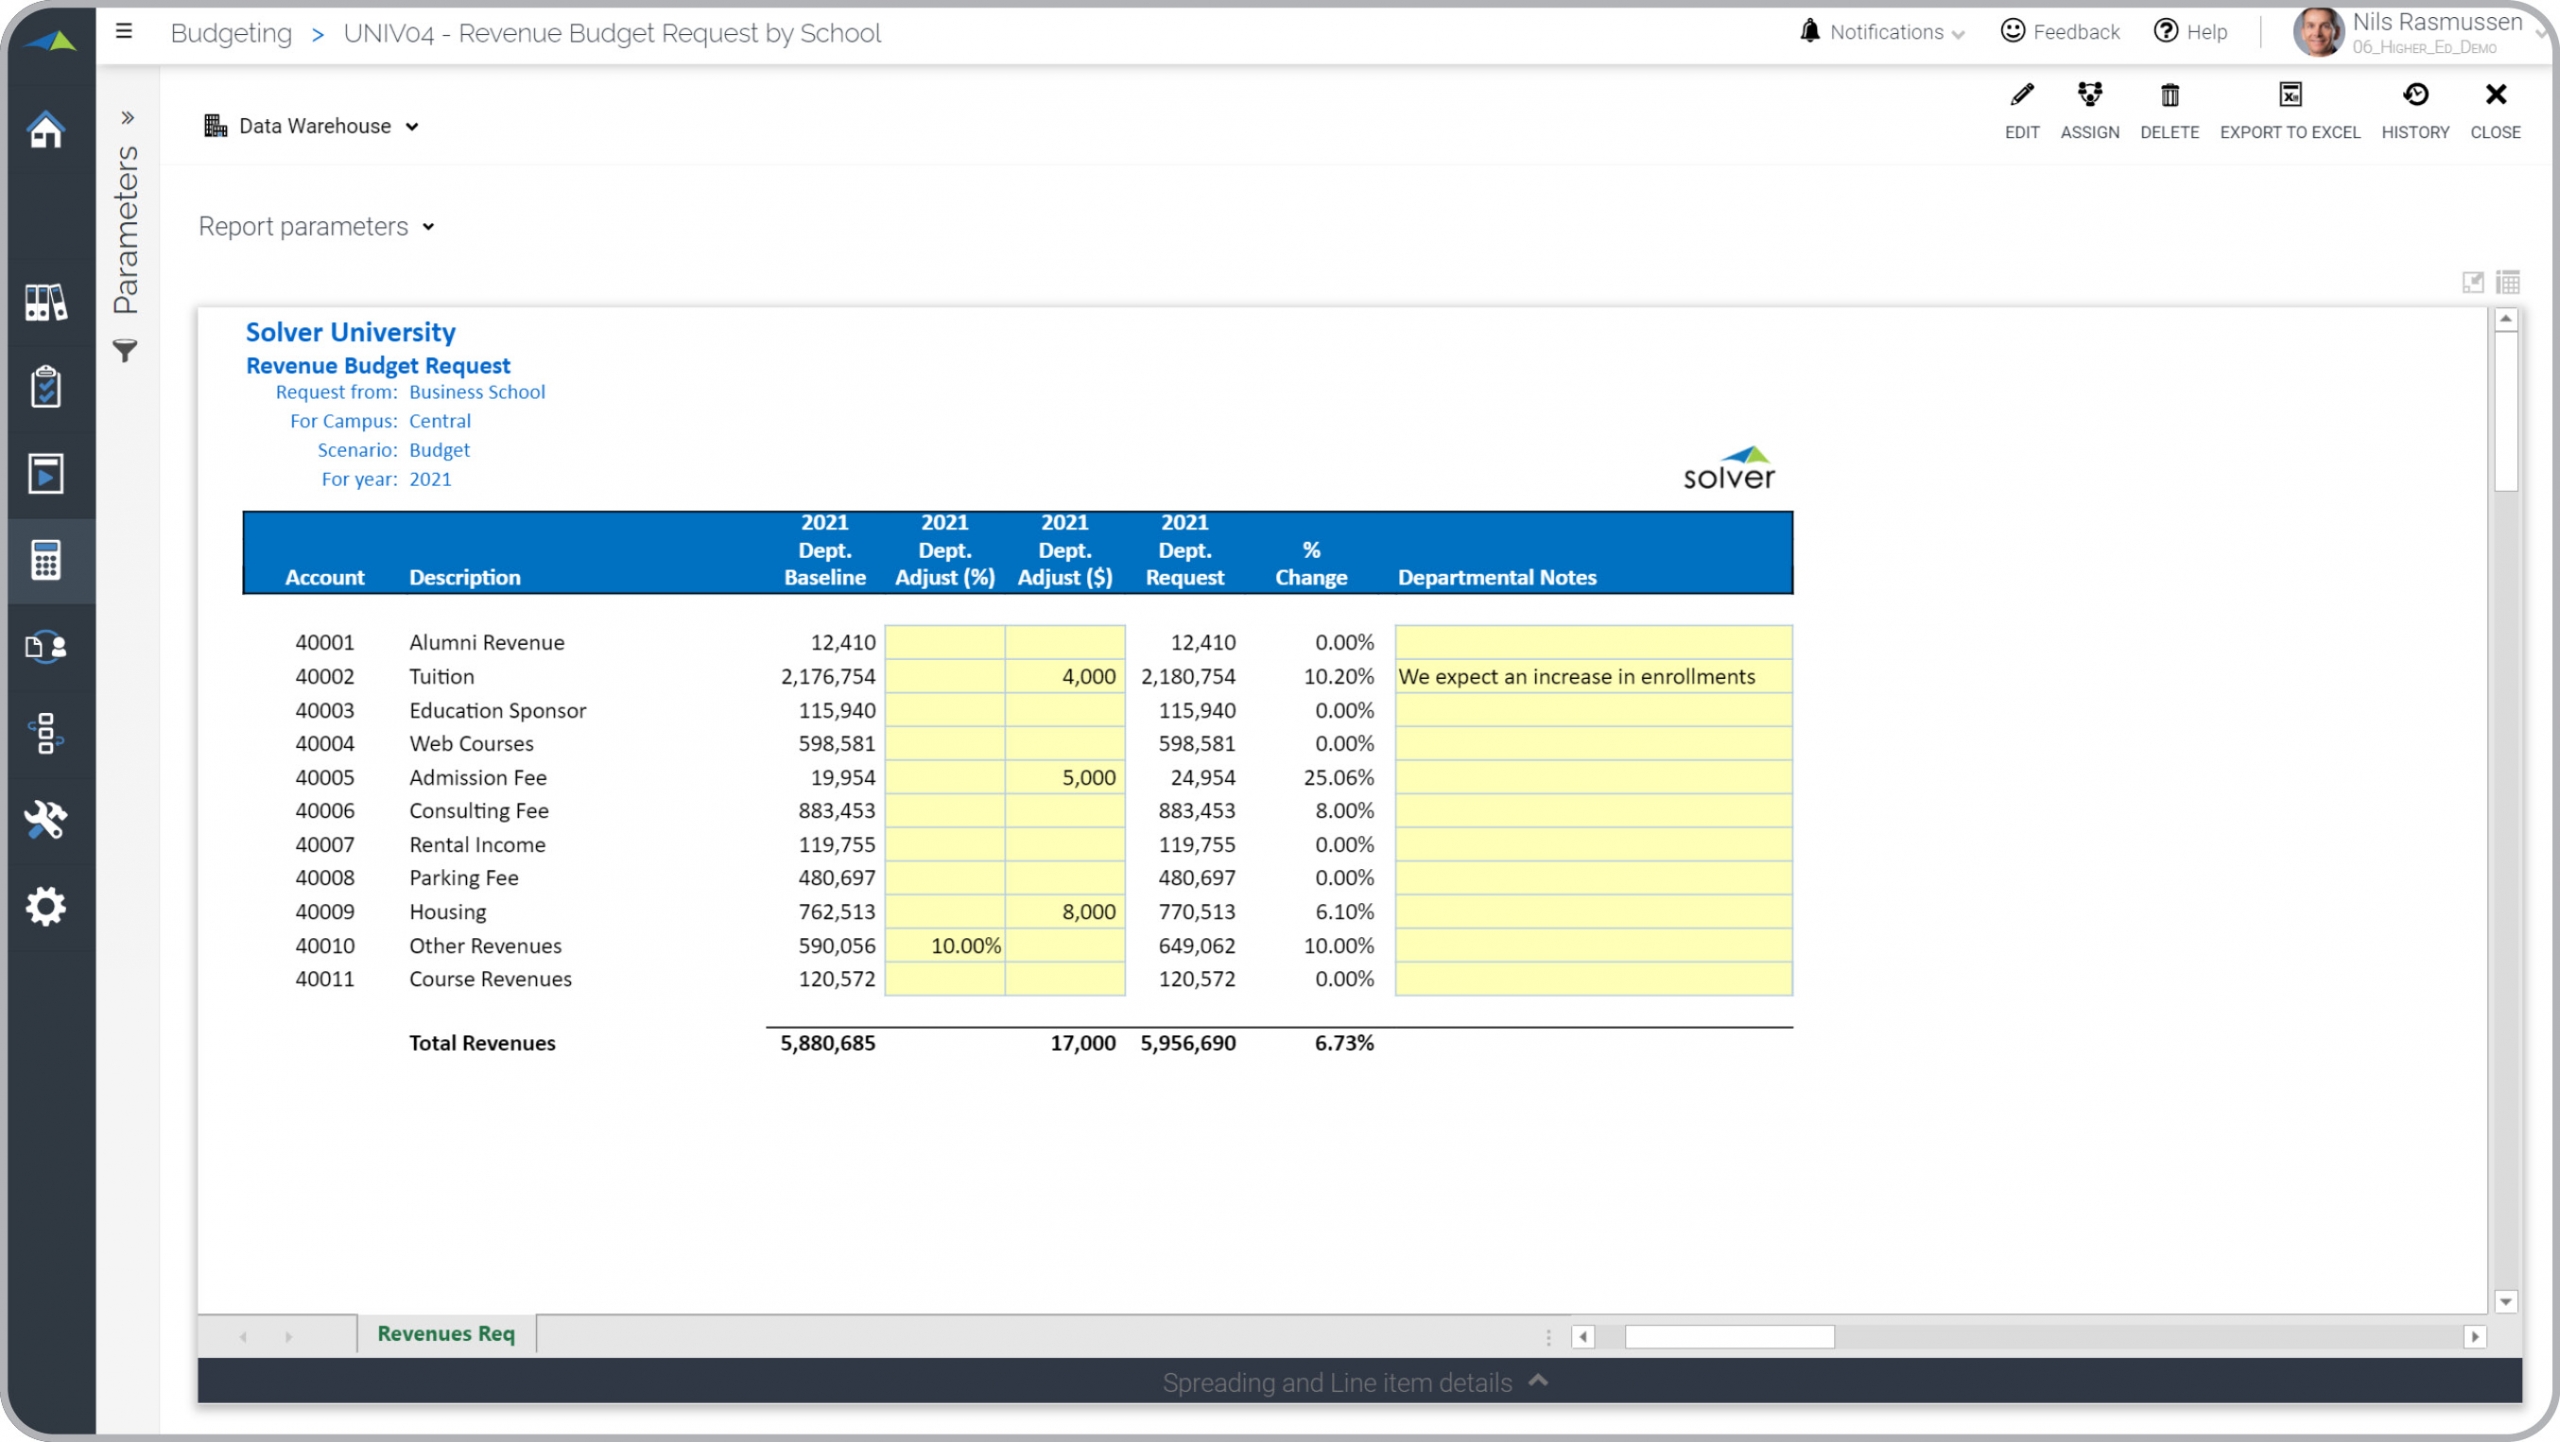
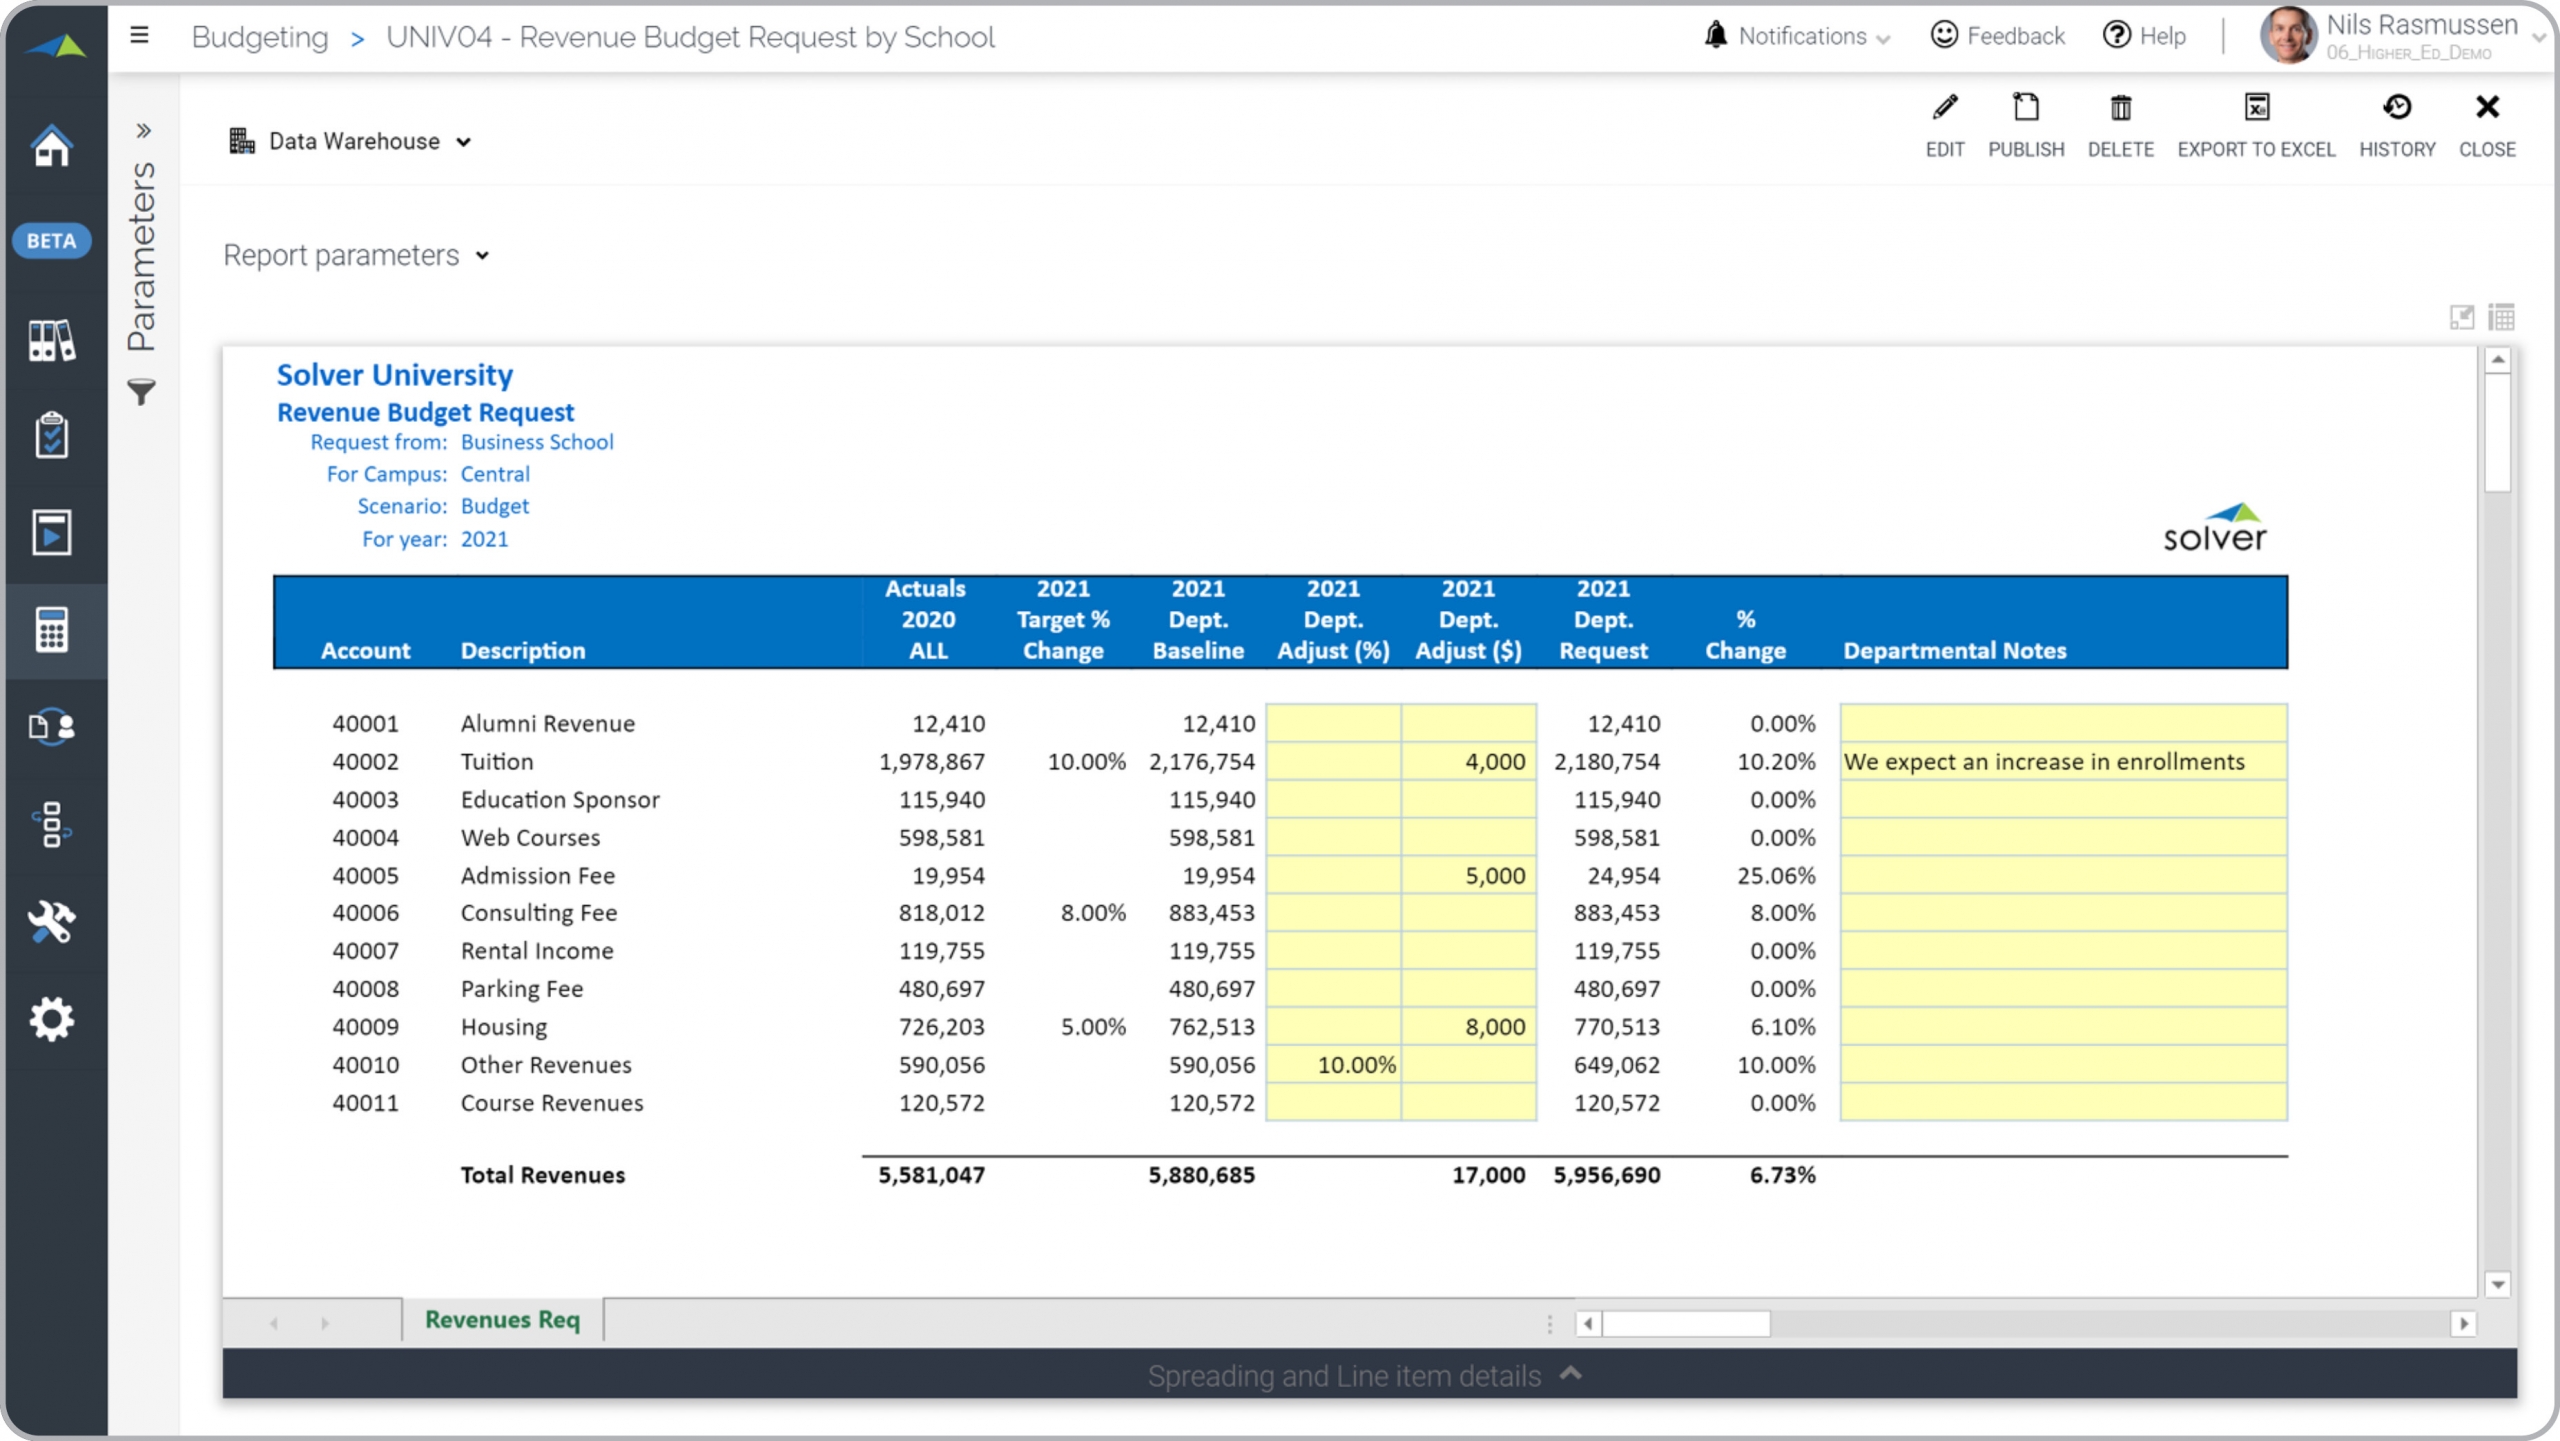
Higher Ed – Revenue Budget Request
Input of a department's proposed adjustments to the baseline budget.
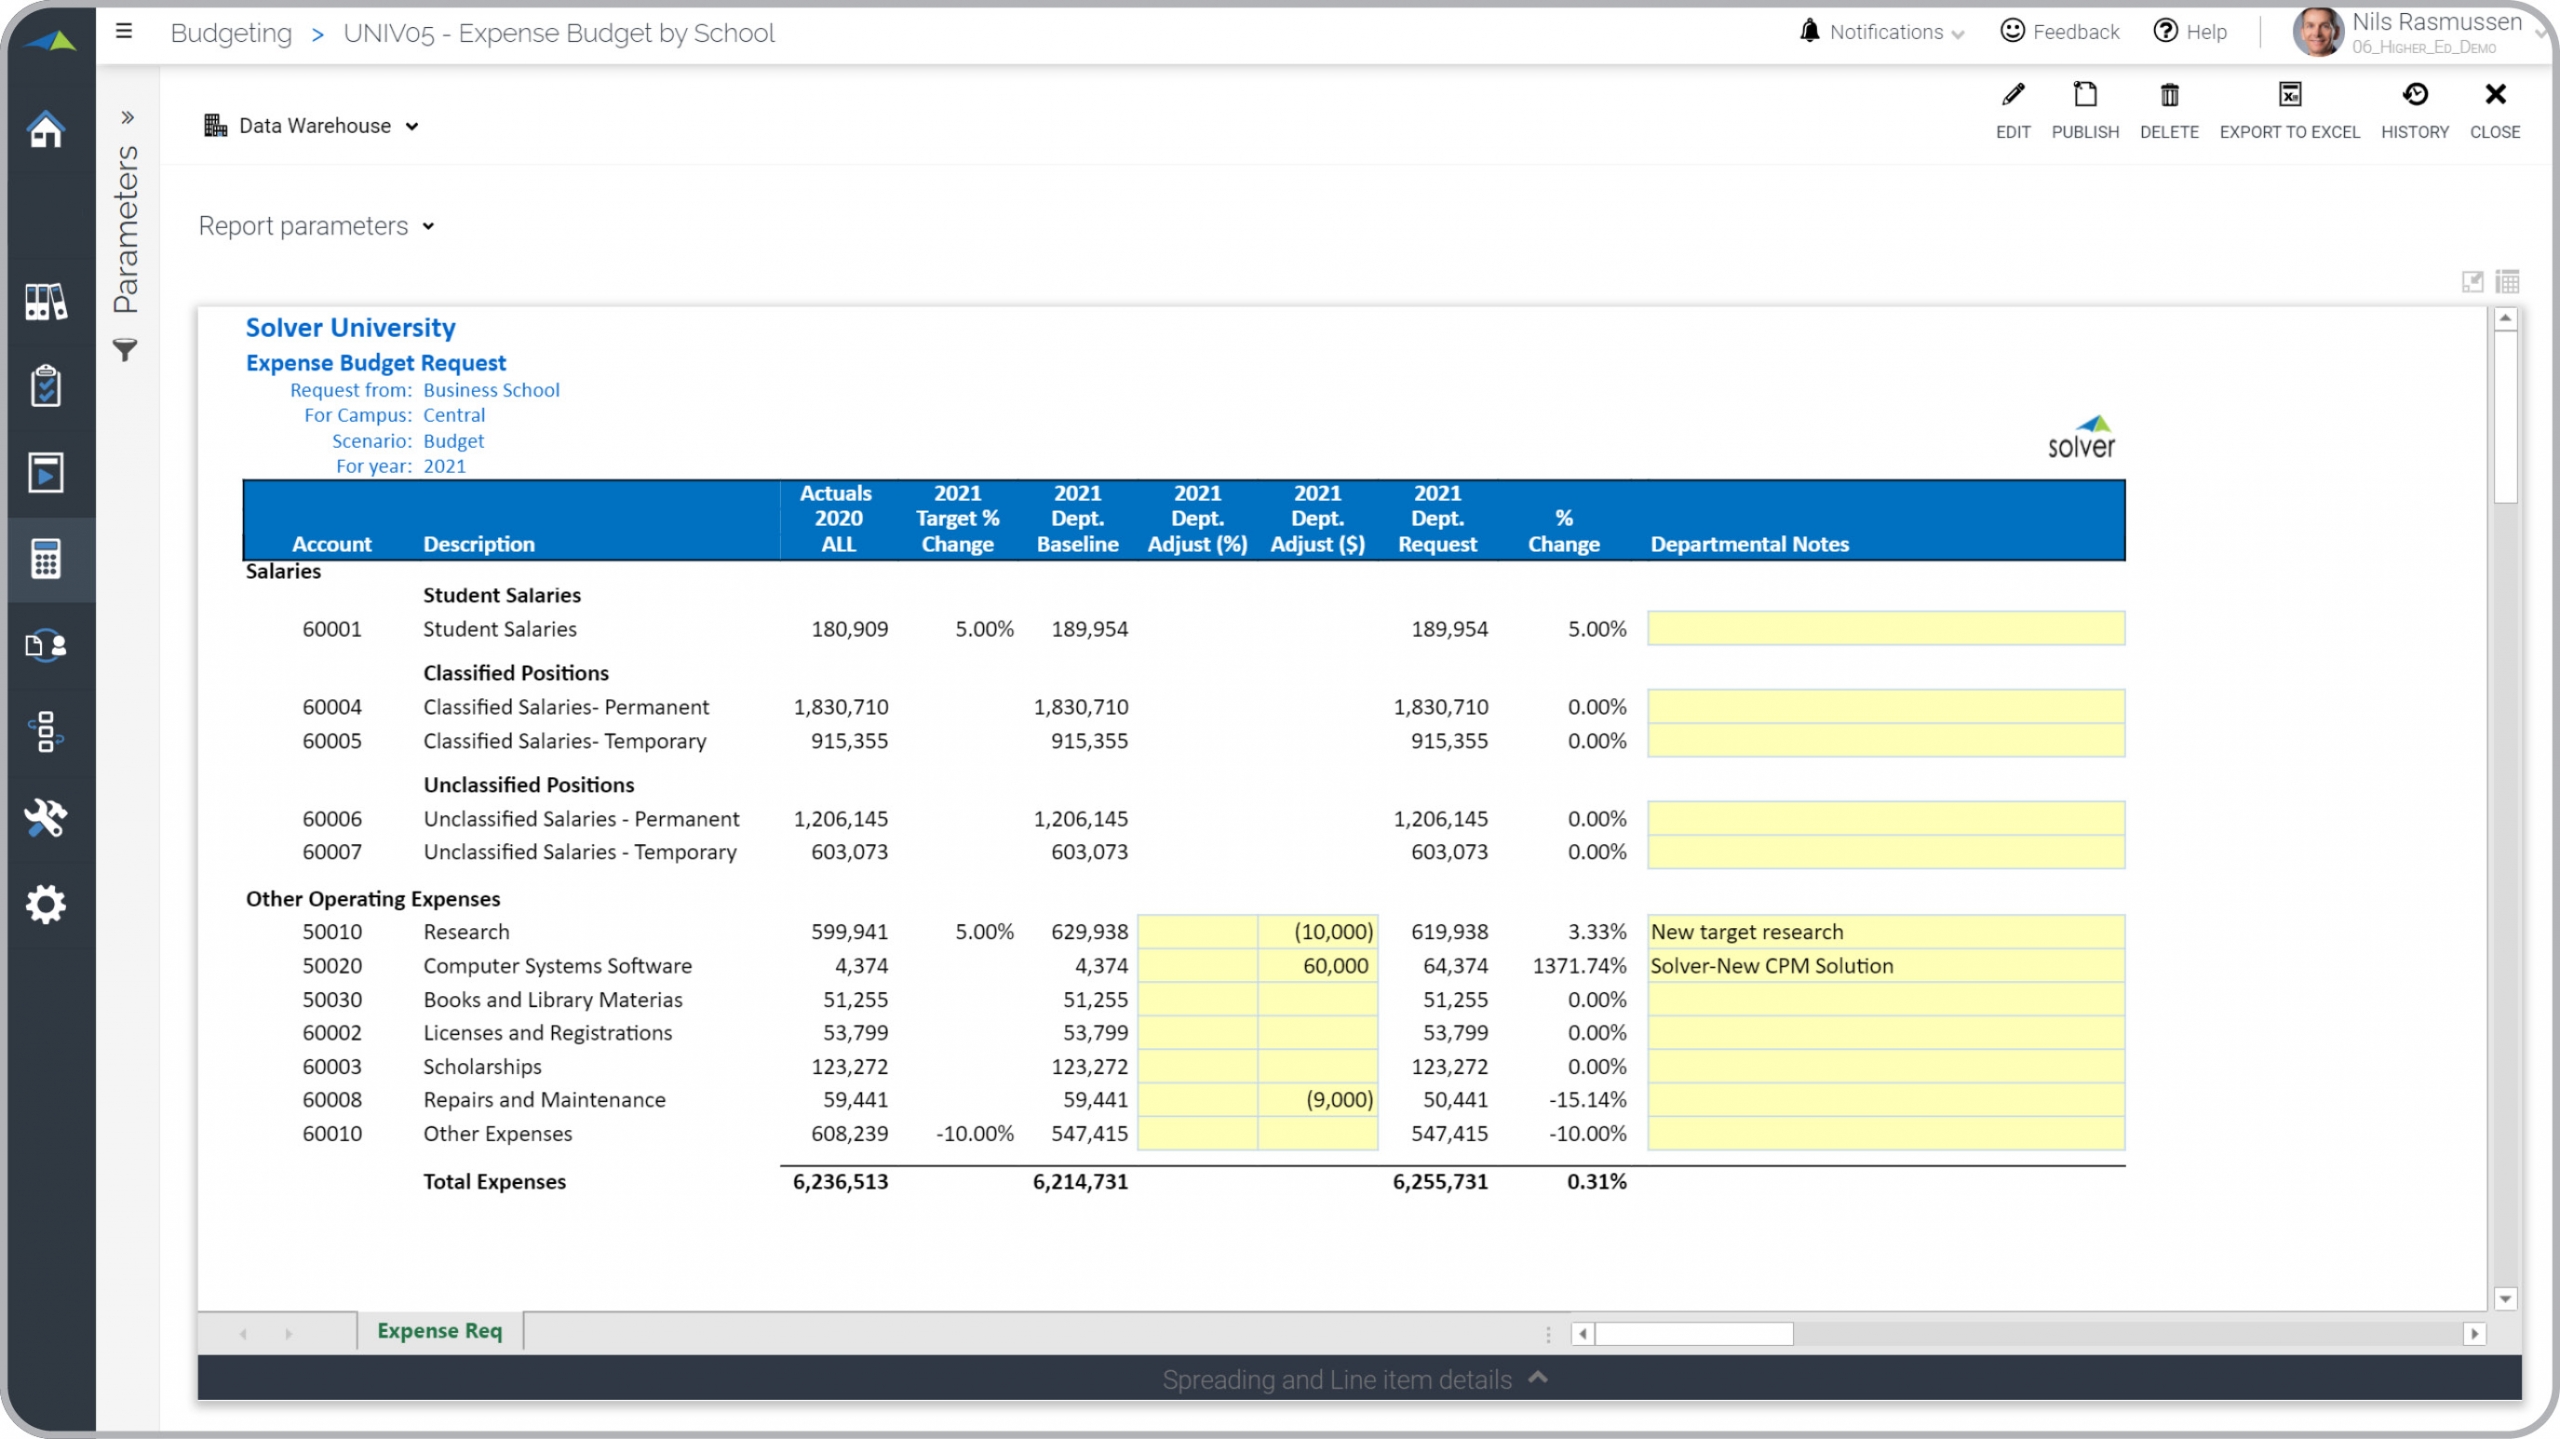
Higher Ed – Expense Budget Request
Input of a department's proposed adjustments to the baseline budget.
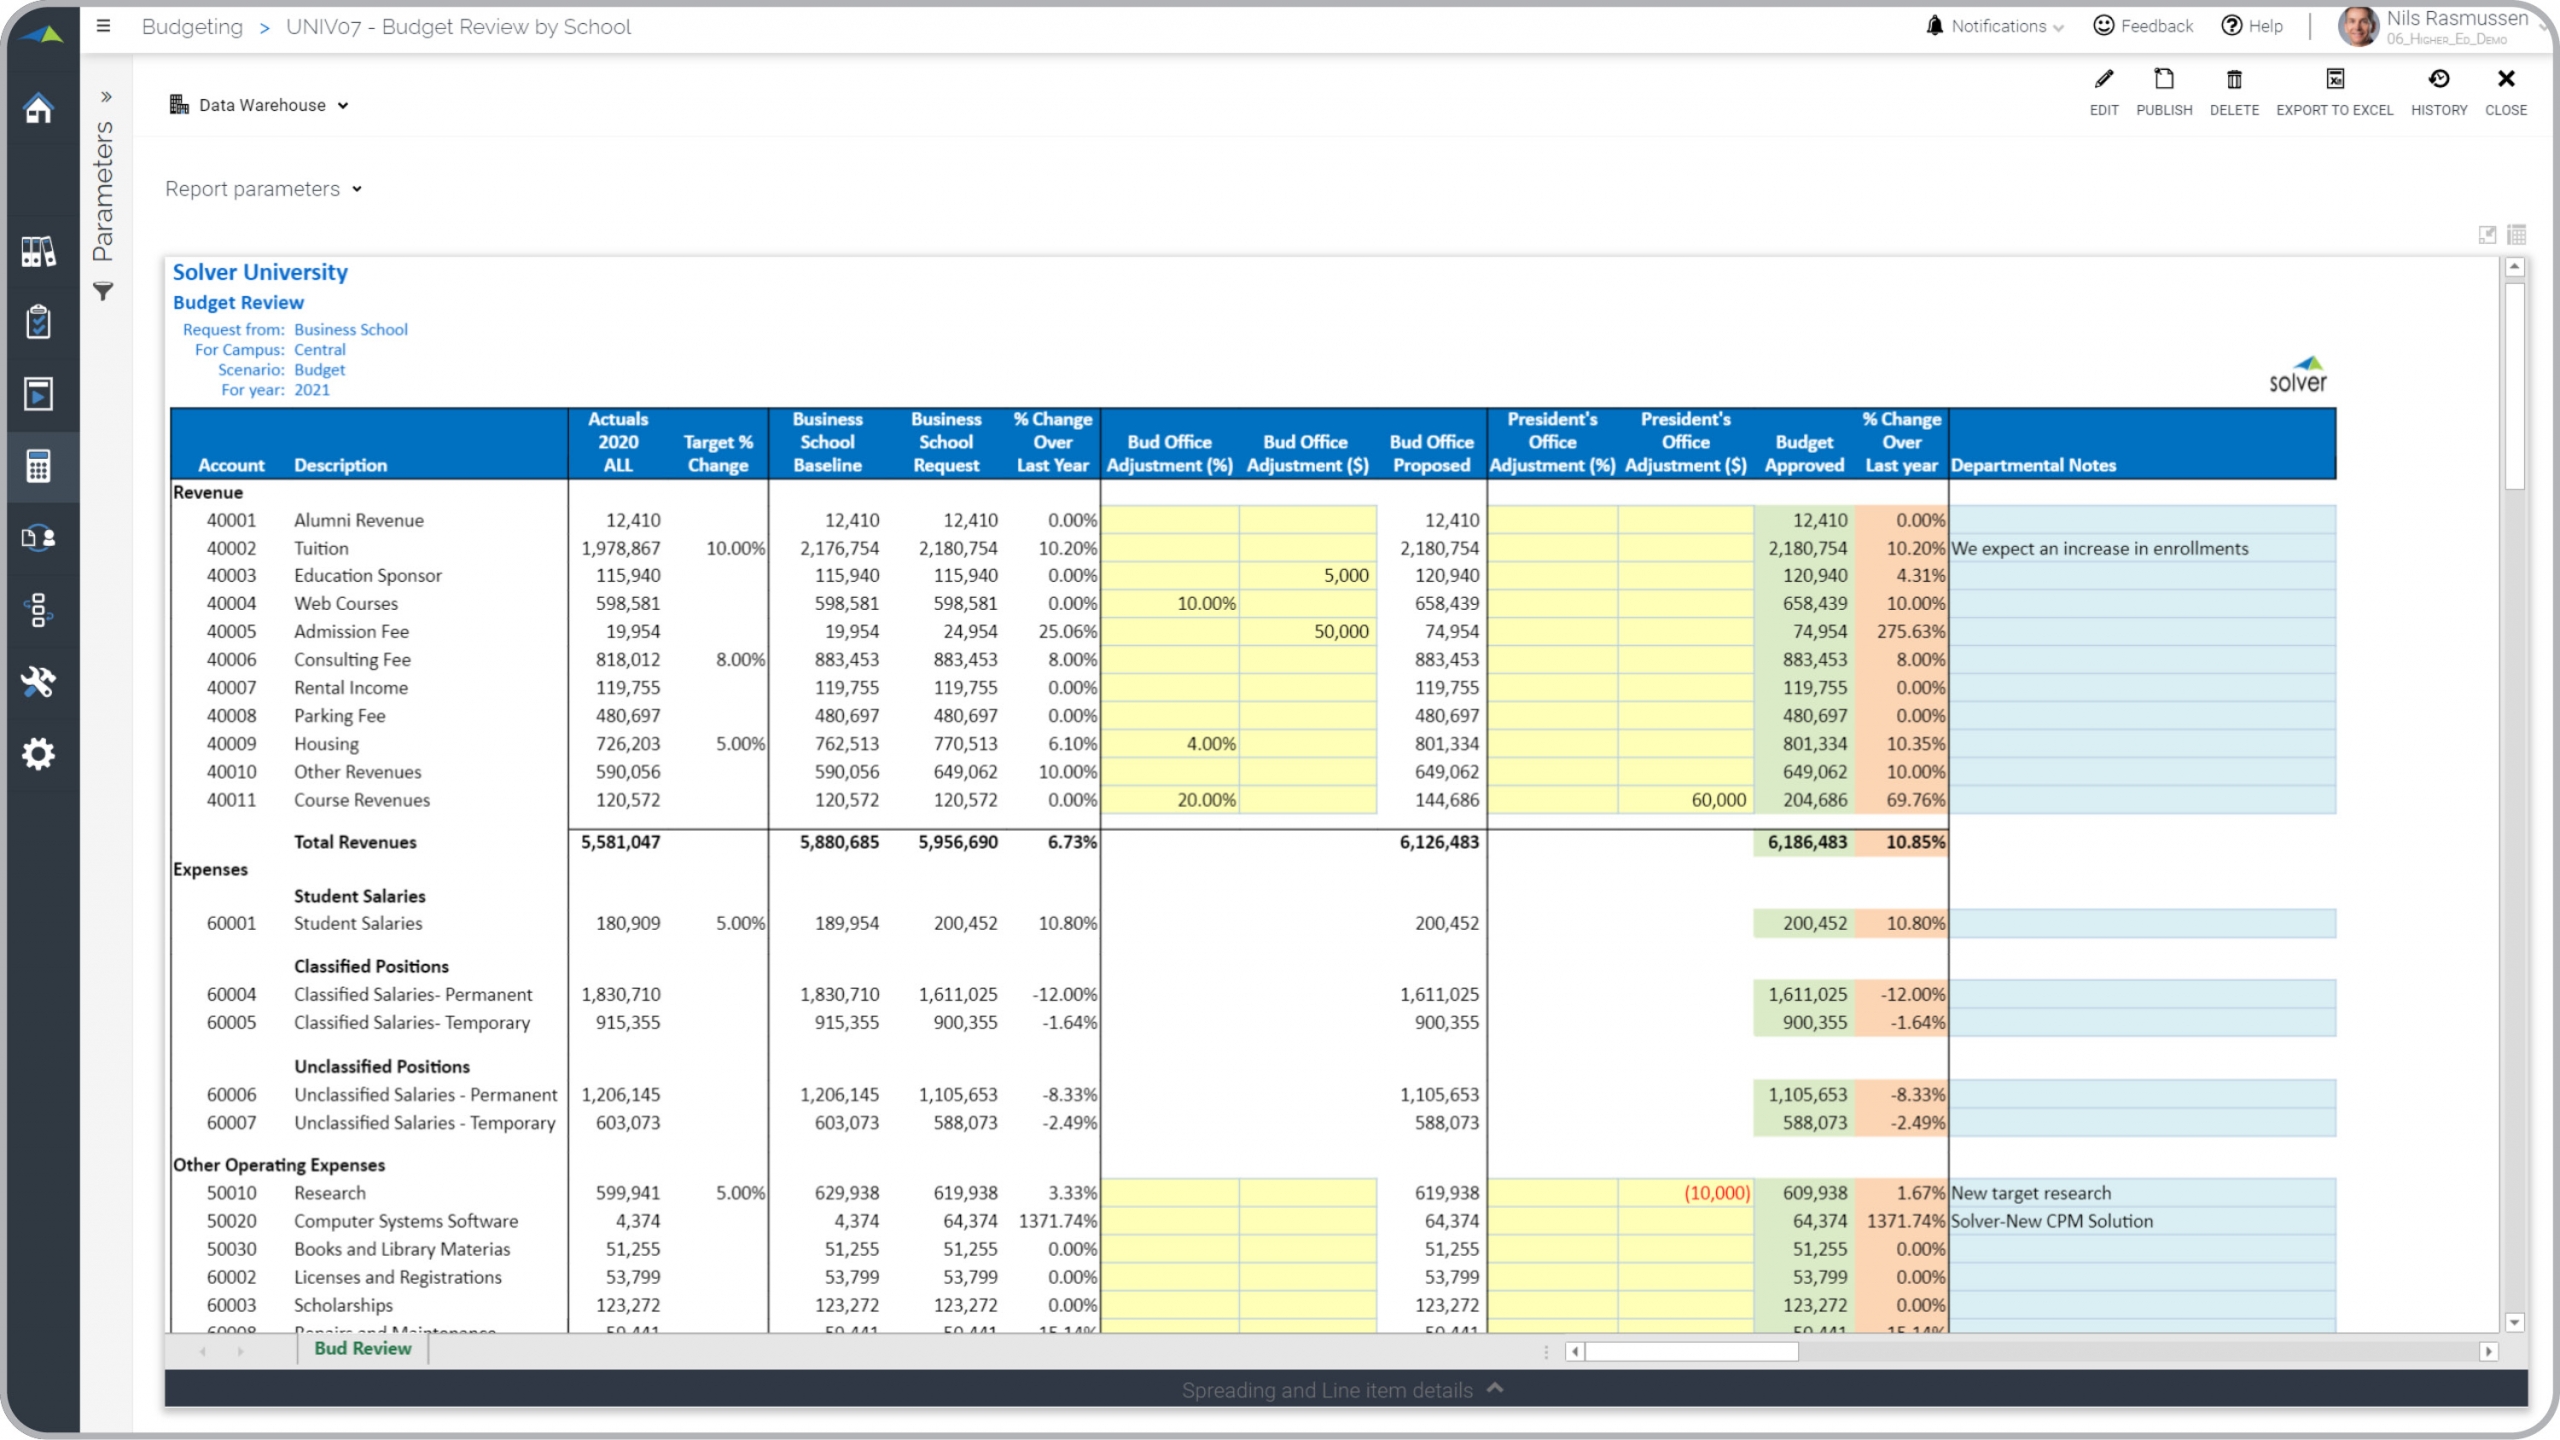
Higher Ed – Budget Review
The Budget Office uses this form to suggest their adjustments to proposed budgets.
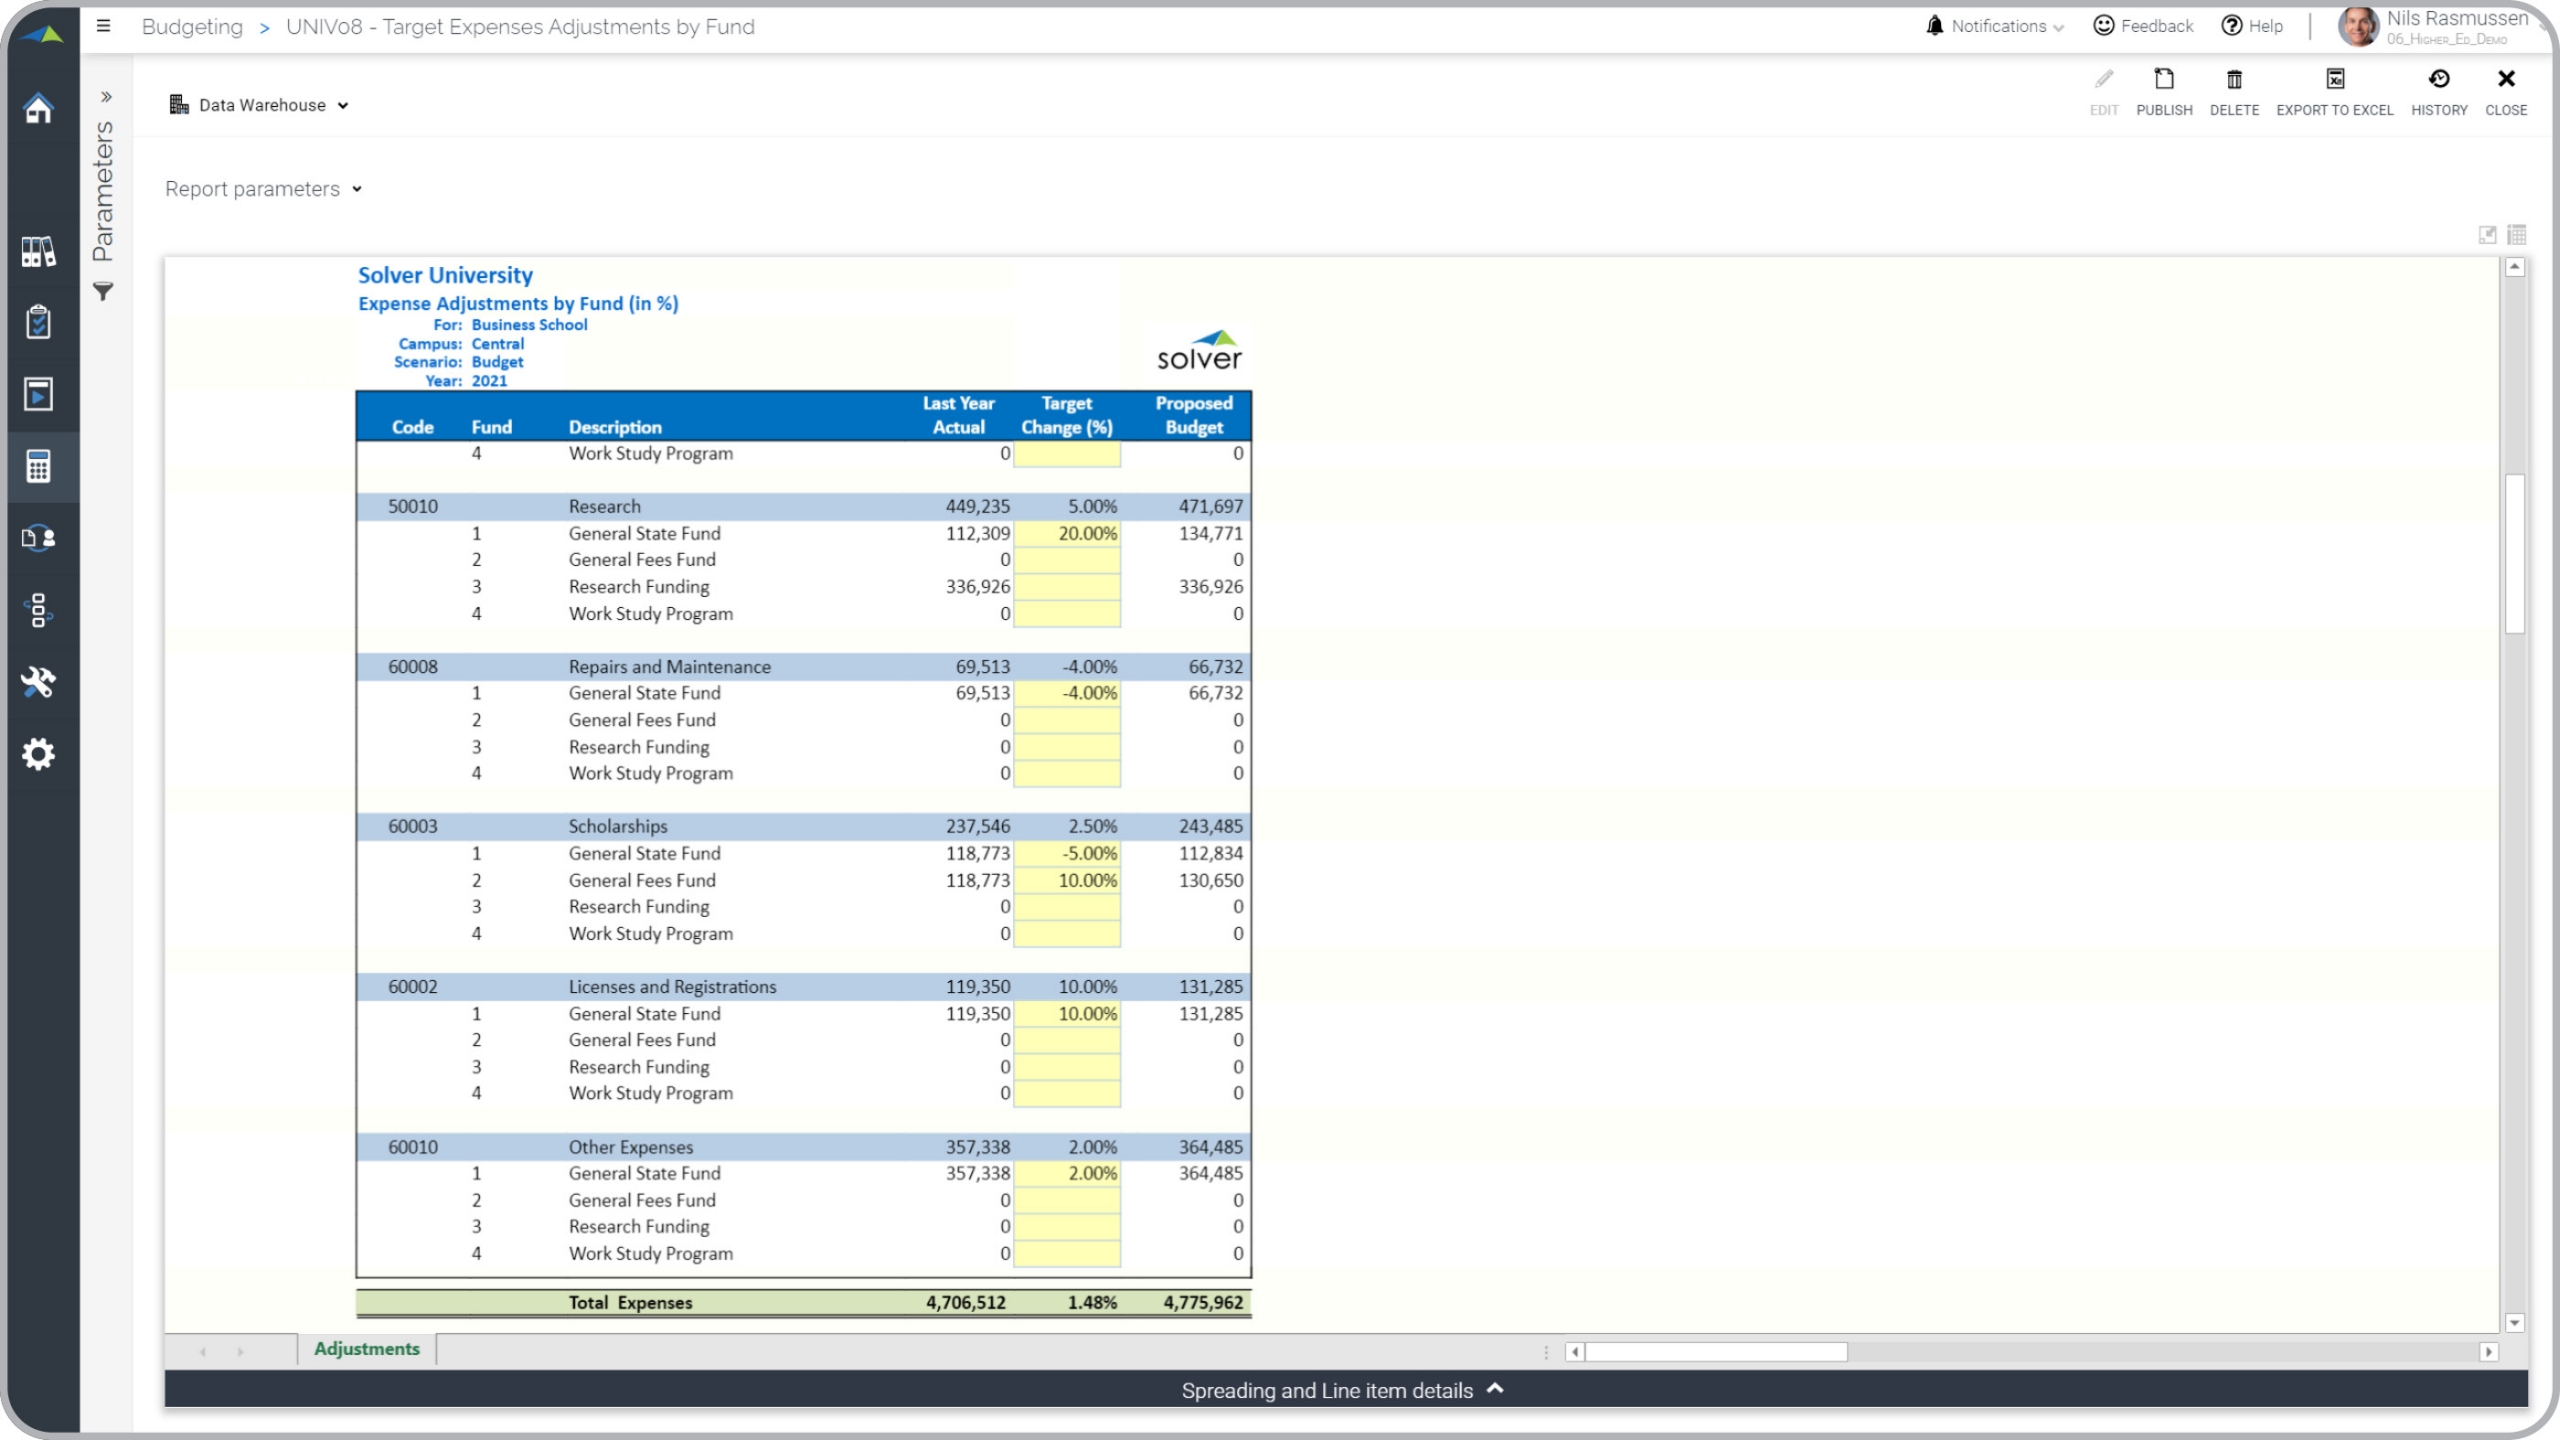
Higher Ed – Target Adjustments by Fund
Creates the proposed budget by Fund, based on adjustments over last year's actual results.
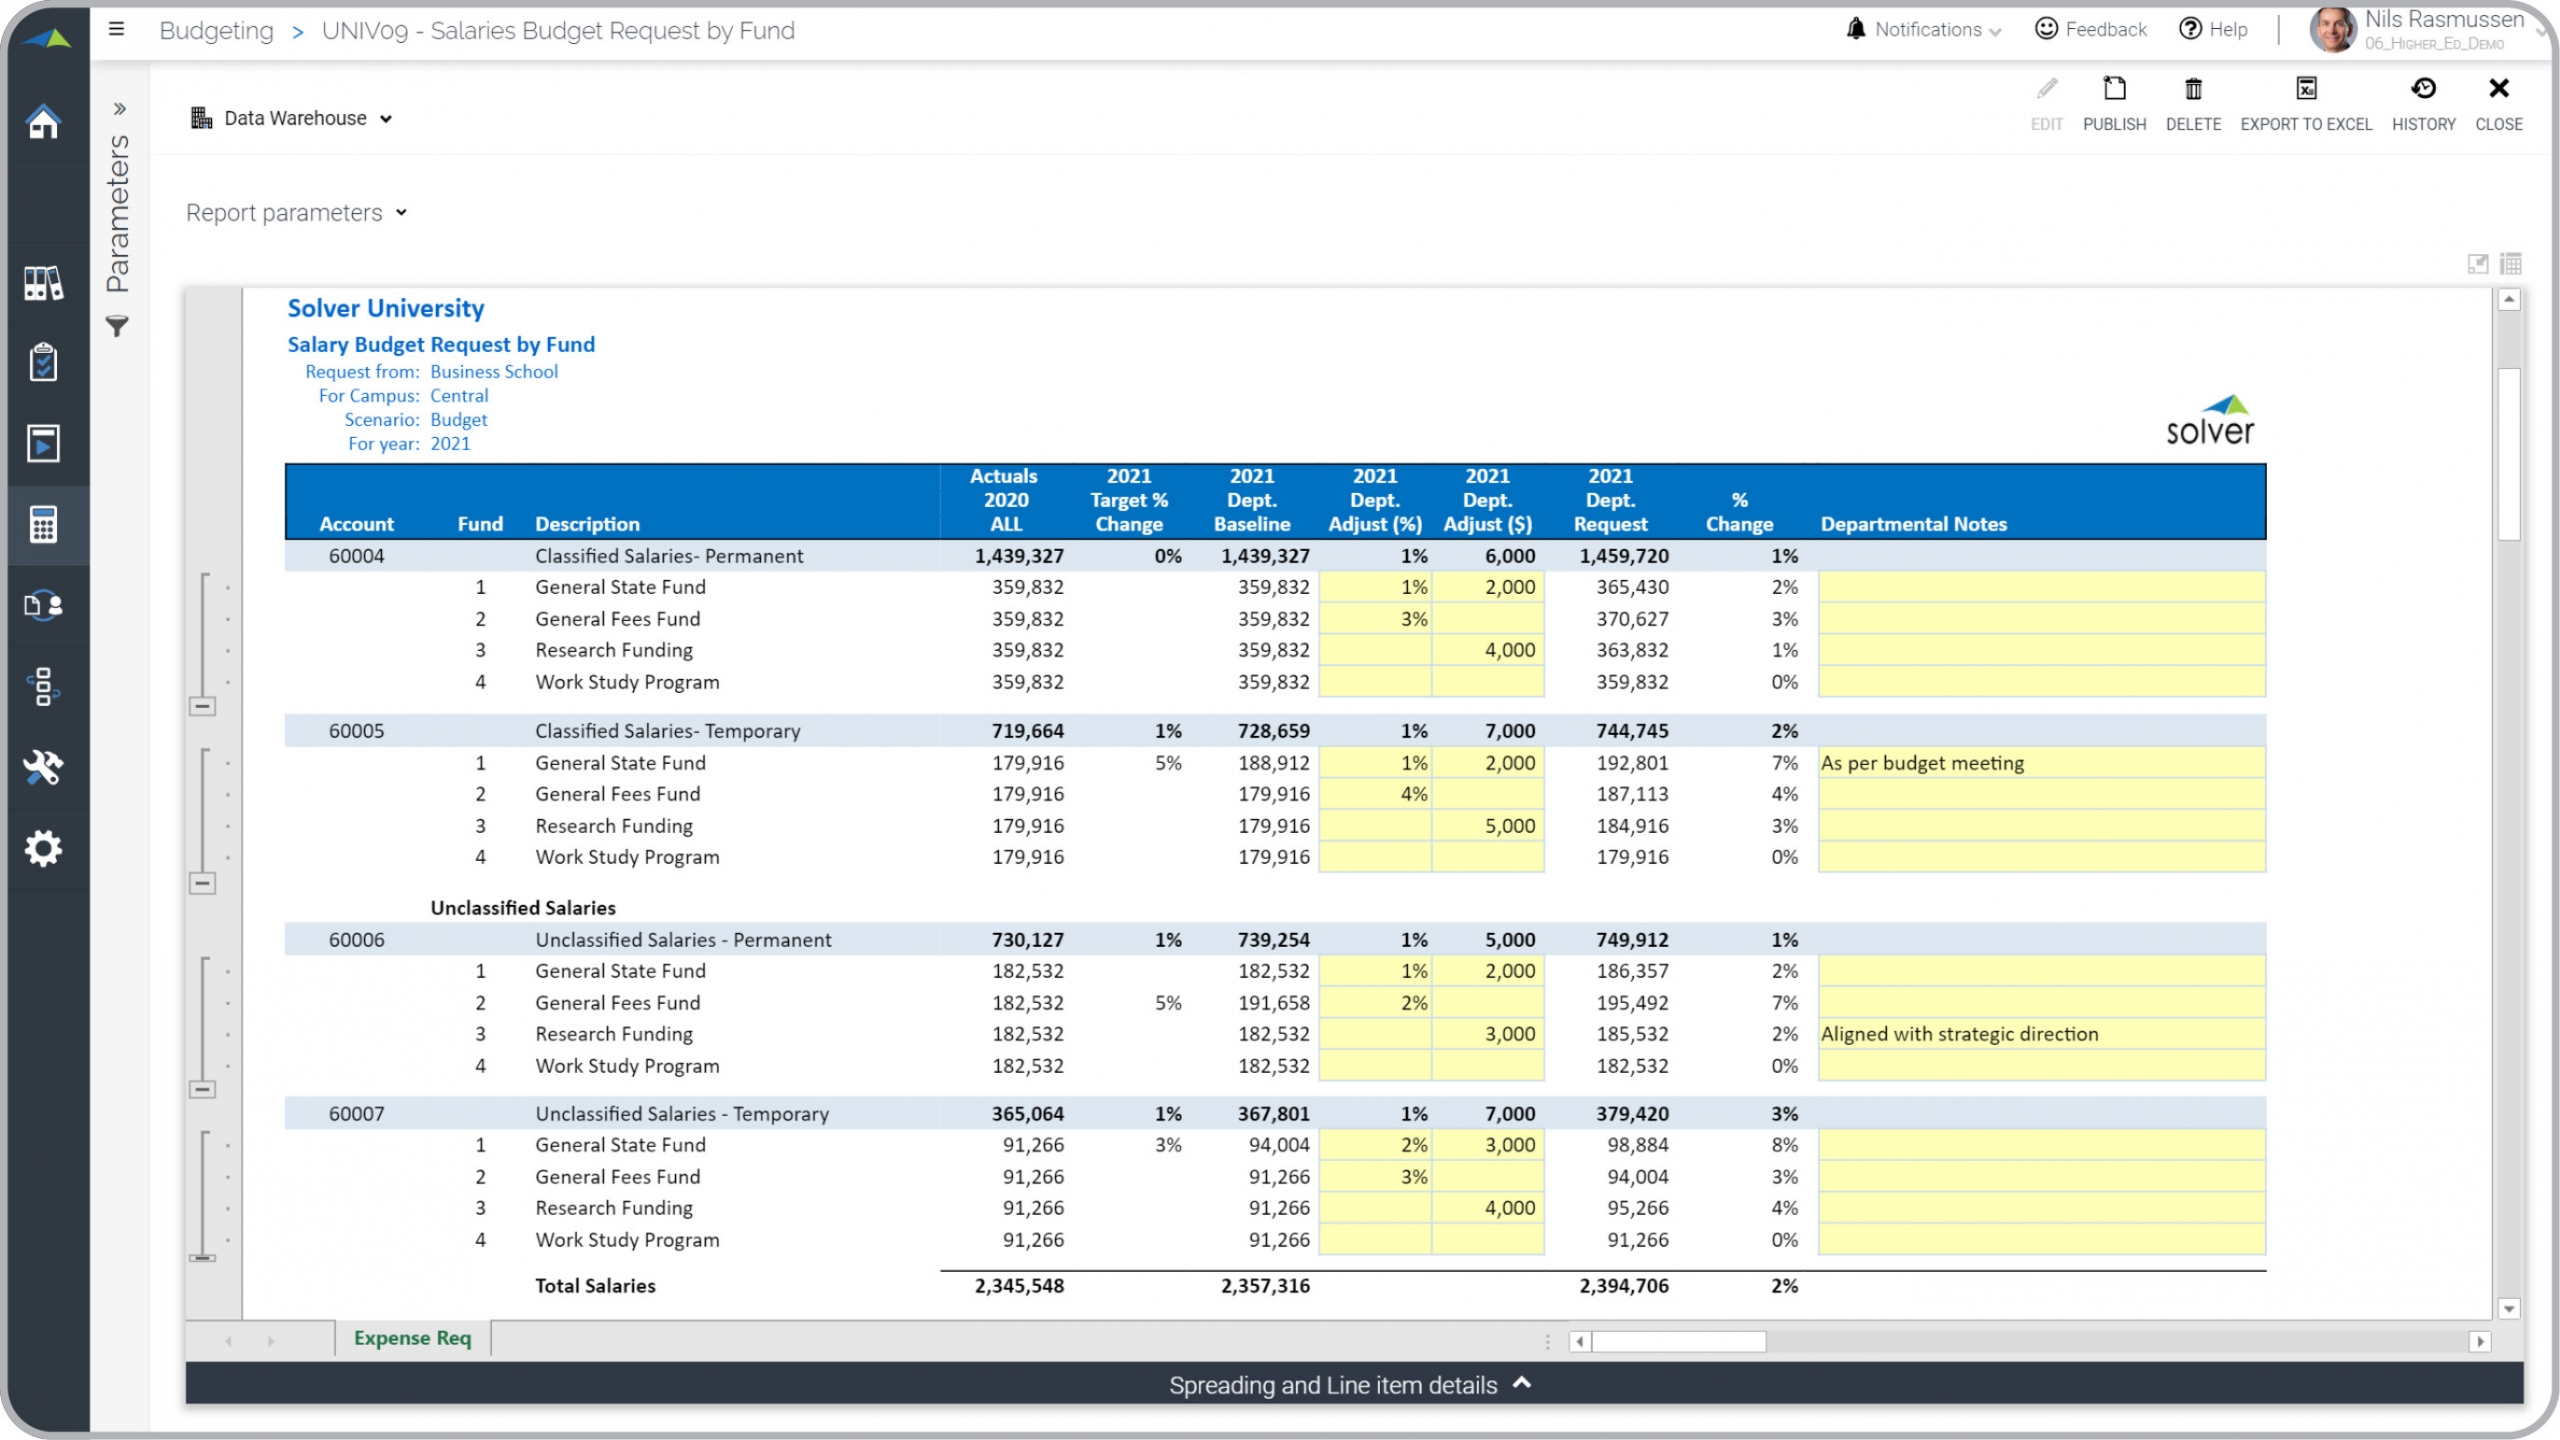
Higher Ed – Salary Budget Request by Fund
Creates budget request by Fund based on the department baseline budget.
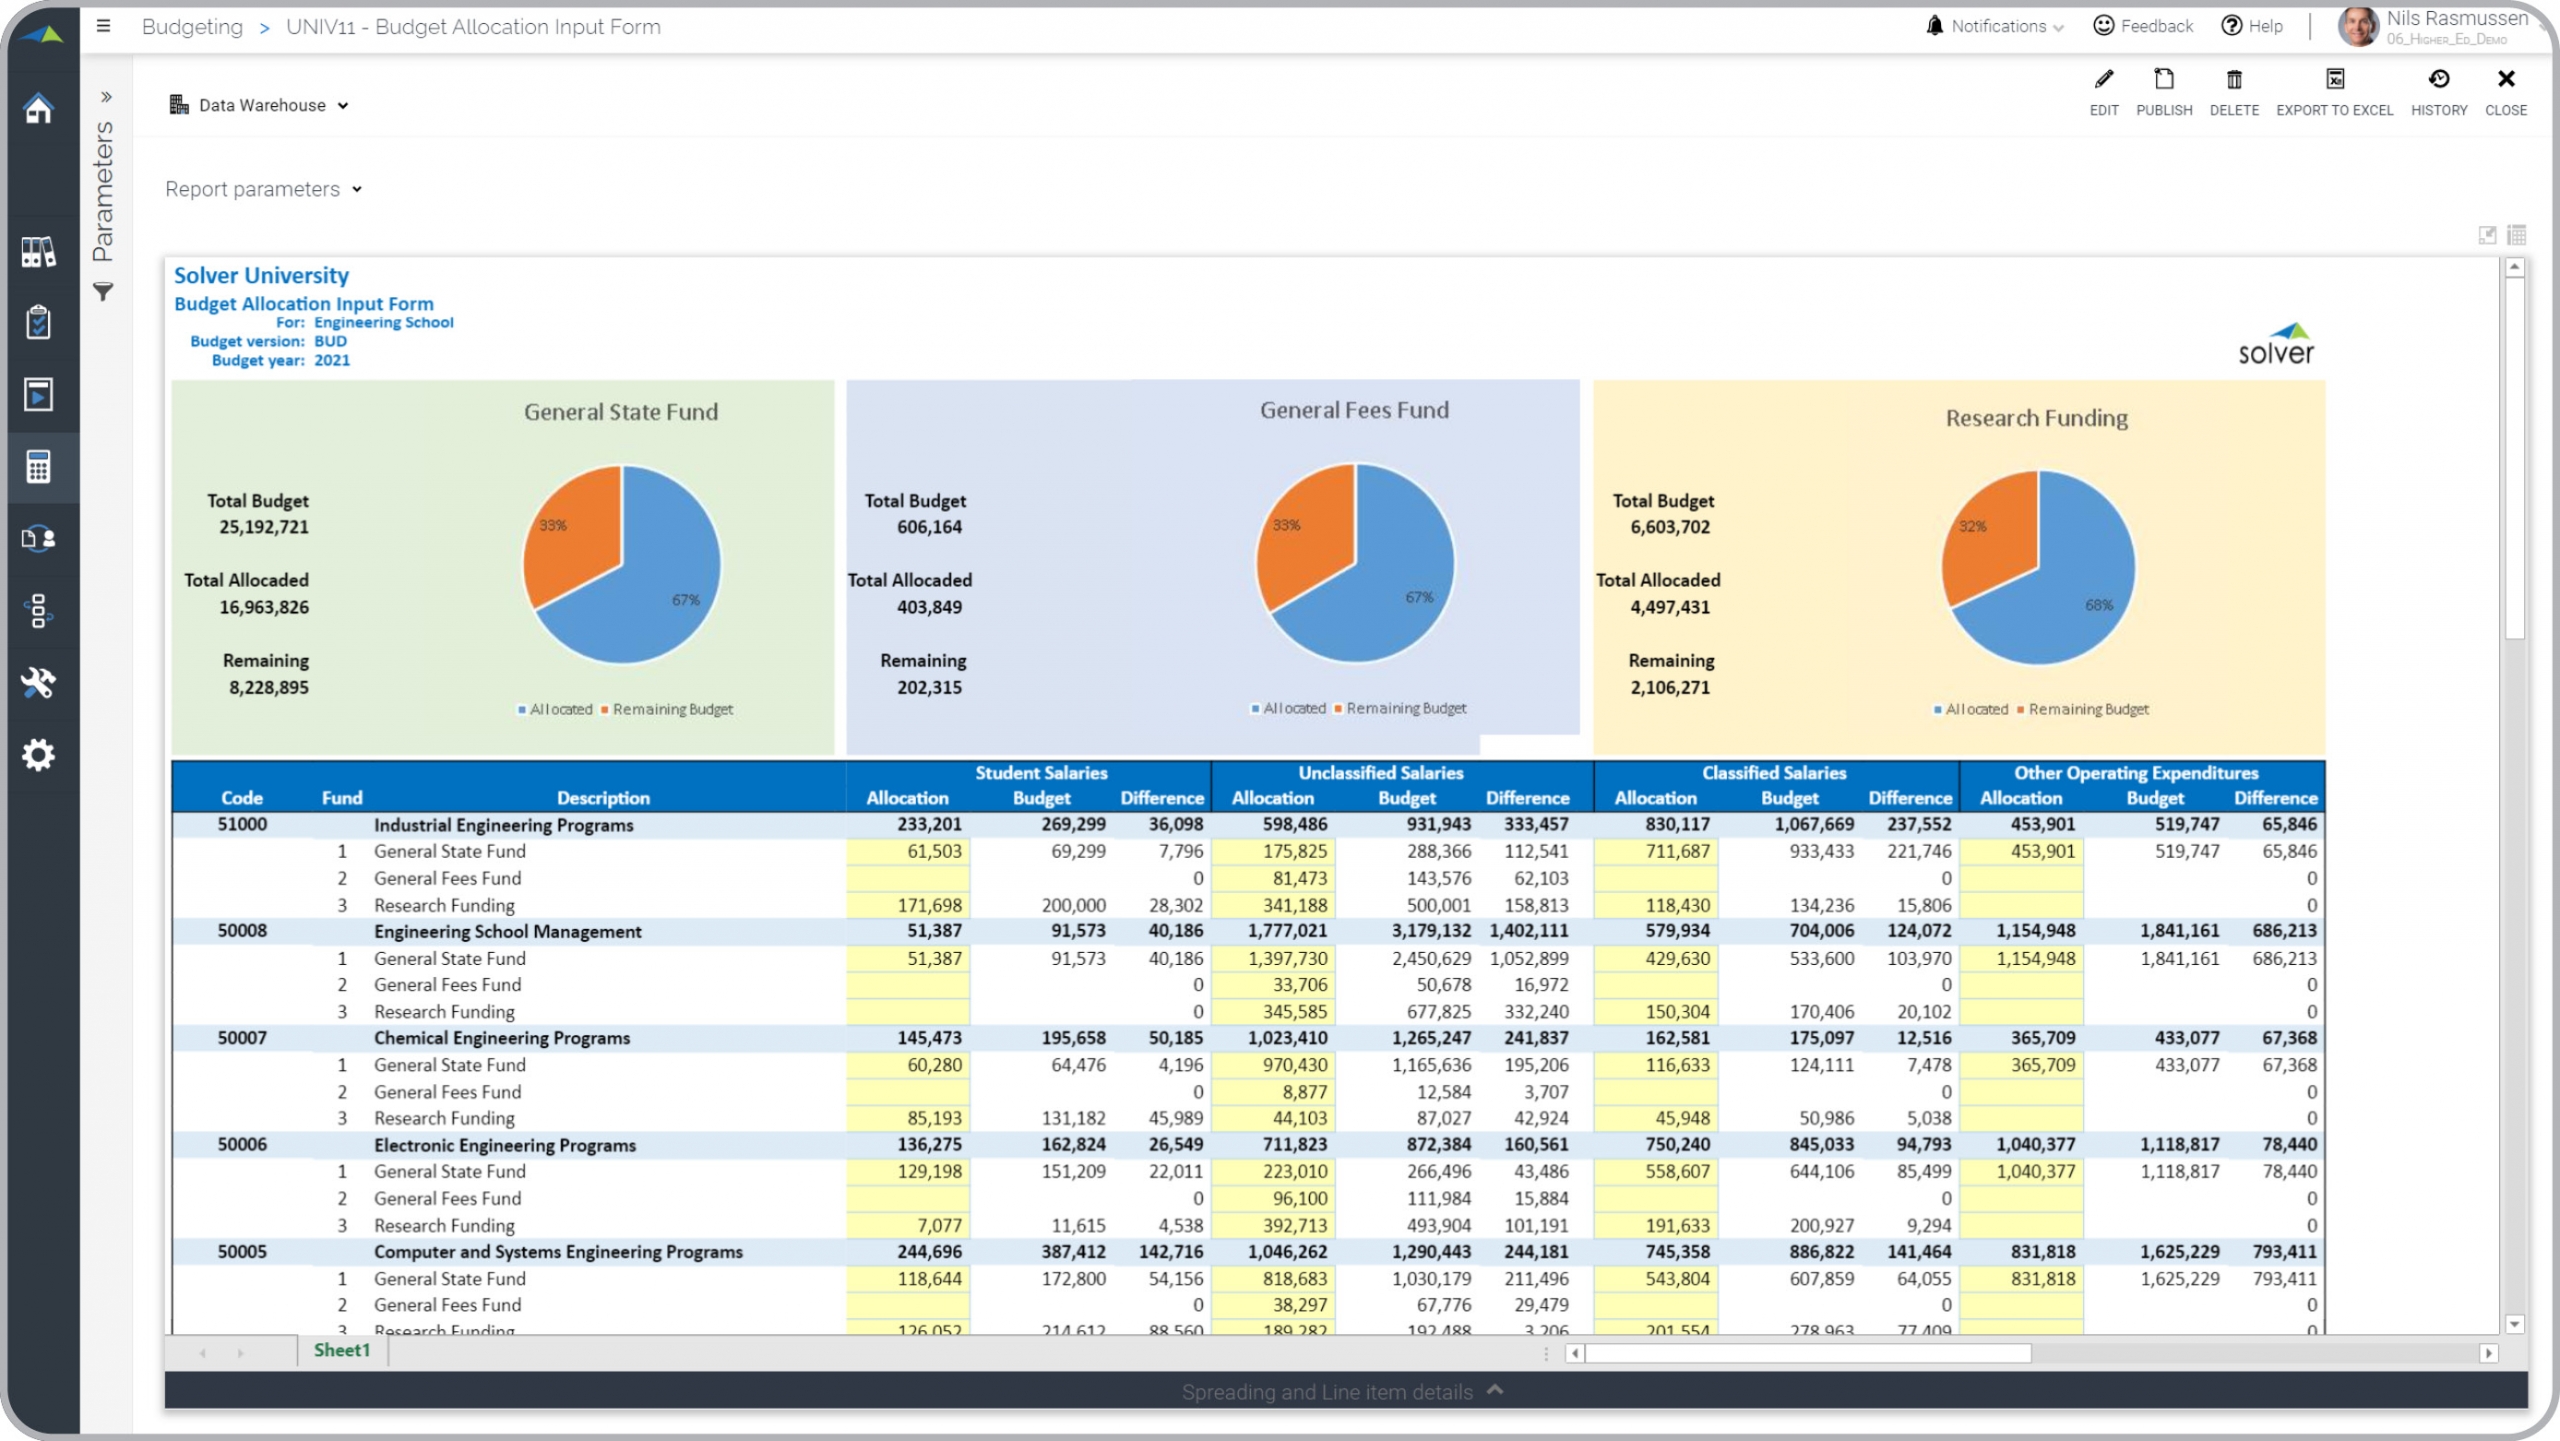
Higher Ed – Allocations to Funds
Allocation of budgets to funds, for salaries and operating expenses.
Higher Ed – Trended Revenue & Expenses
The report shows 12 months of actual or budget (user choice) trend.
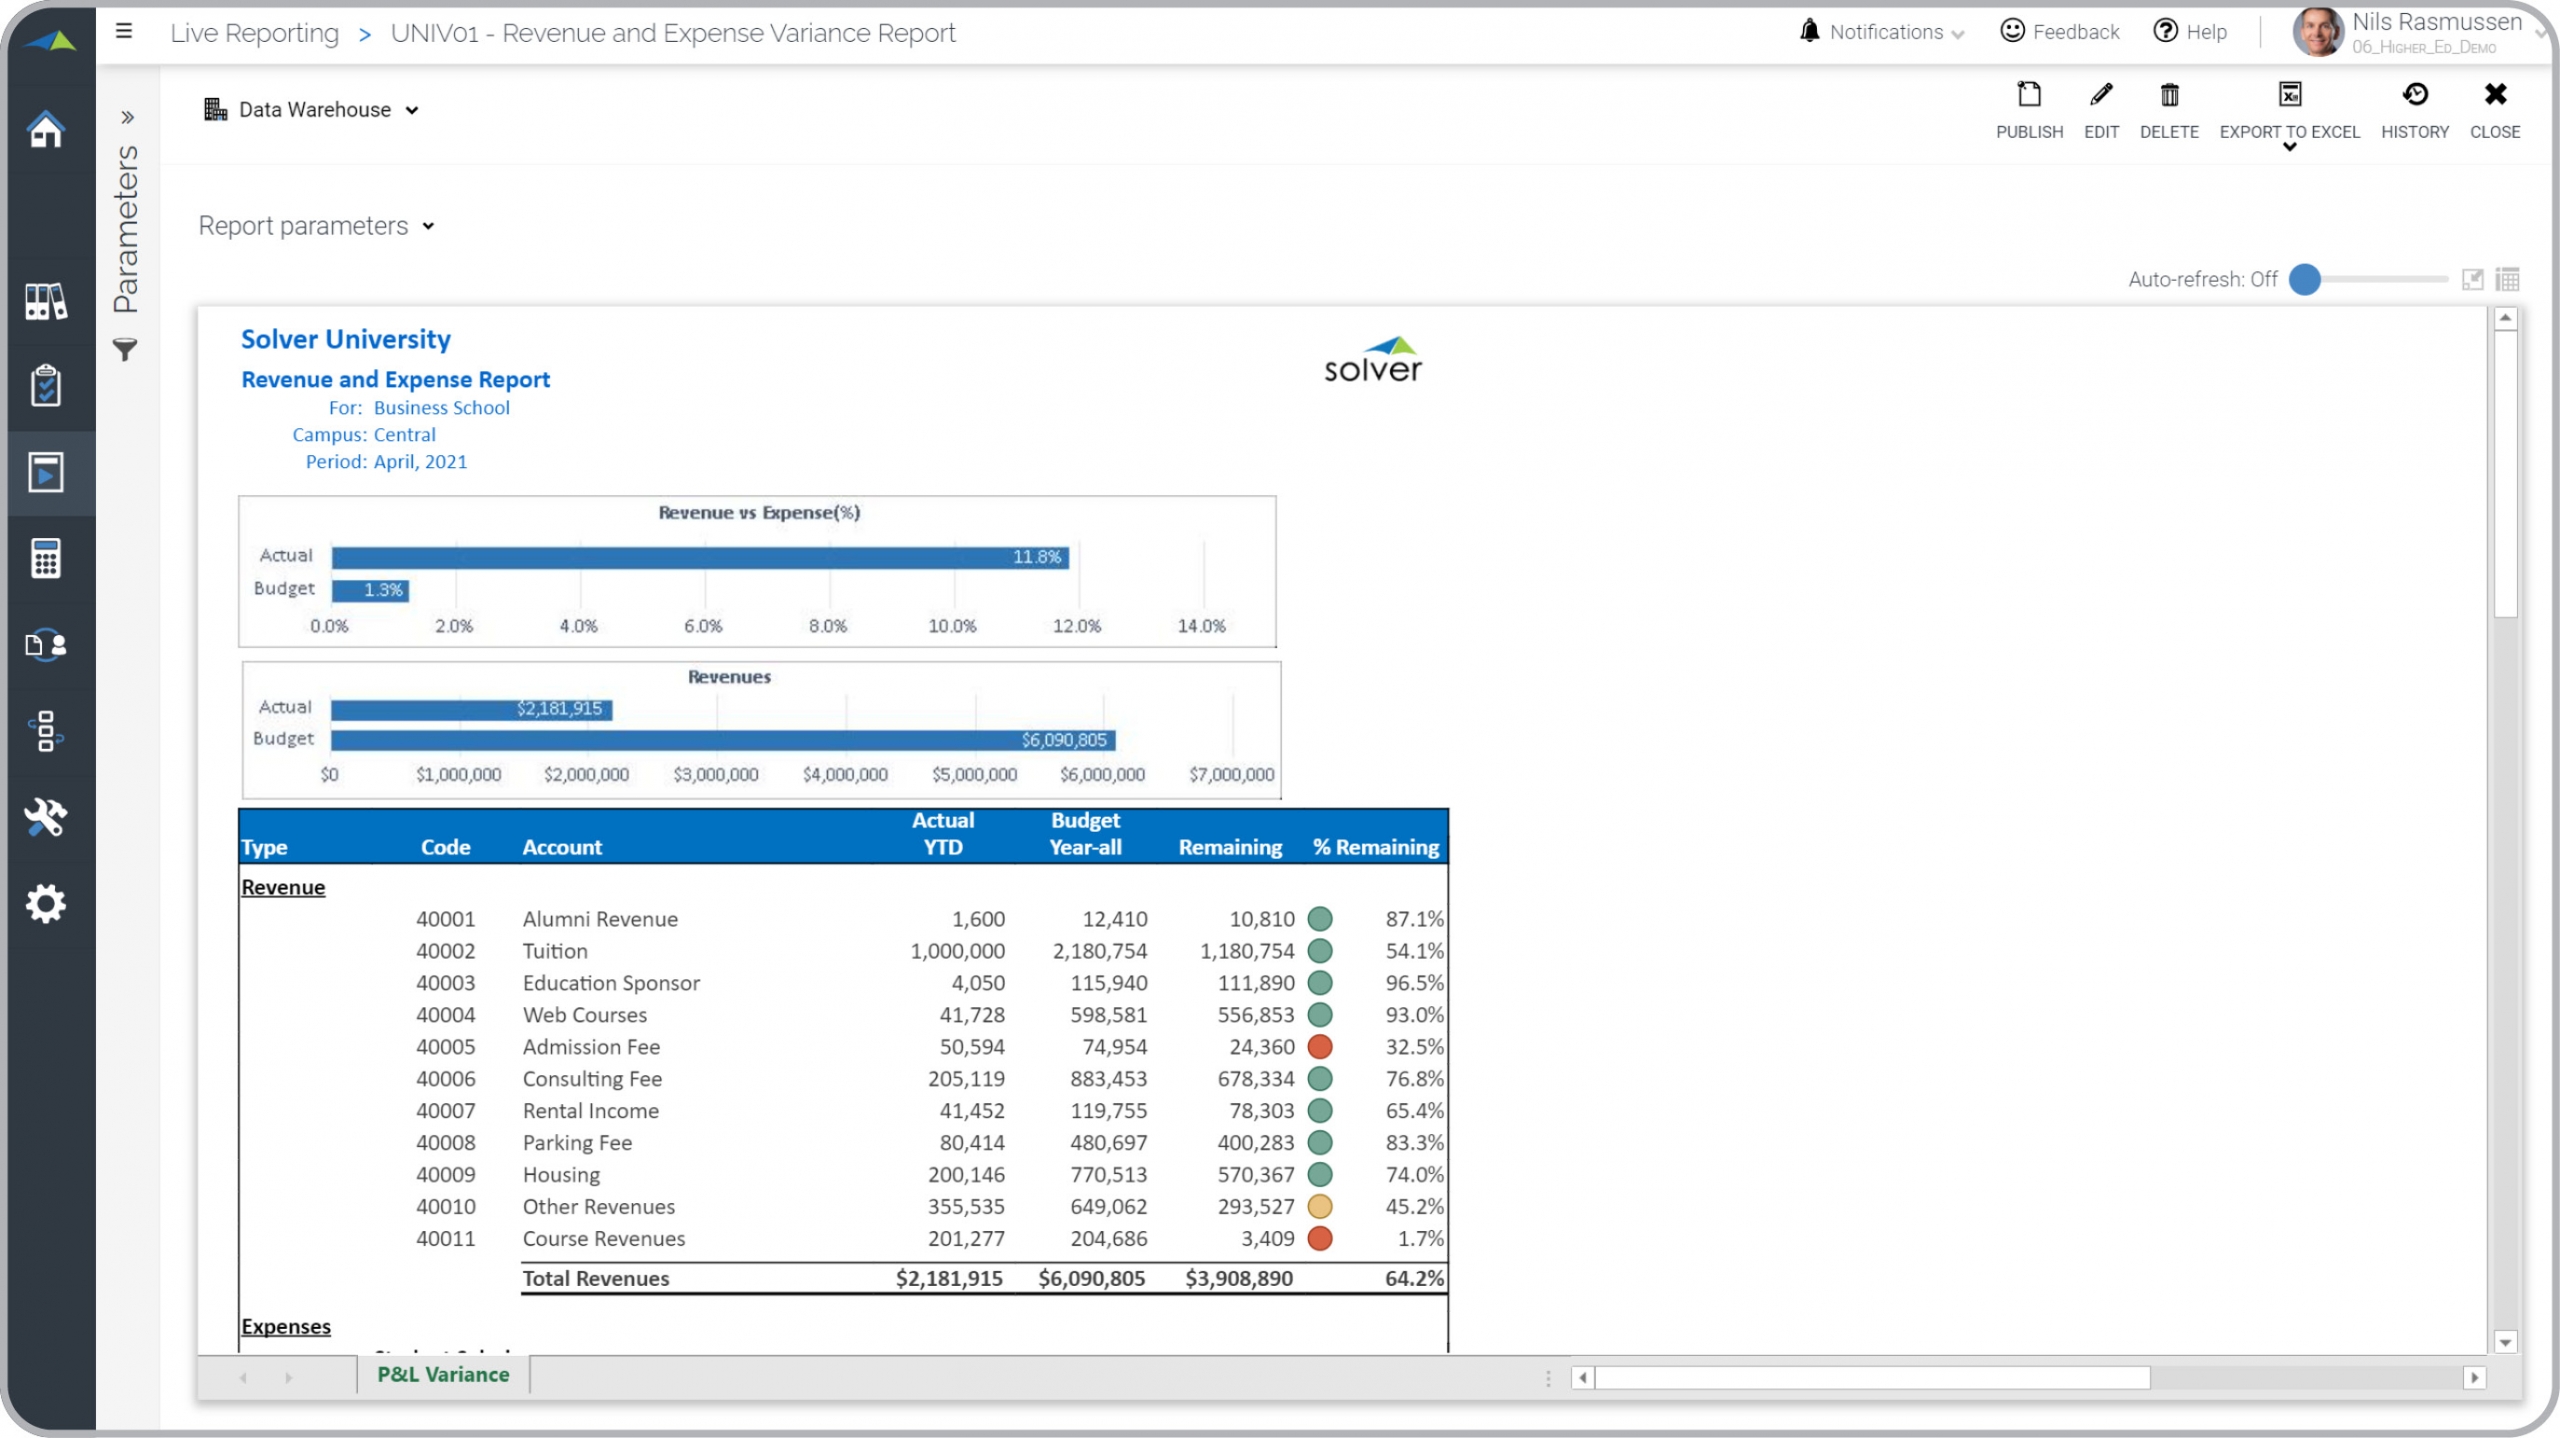
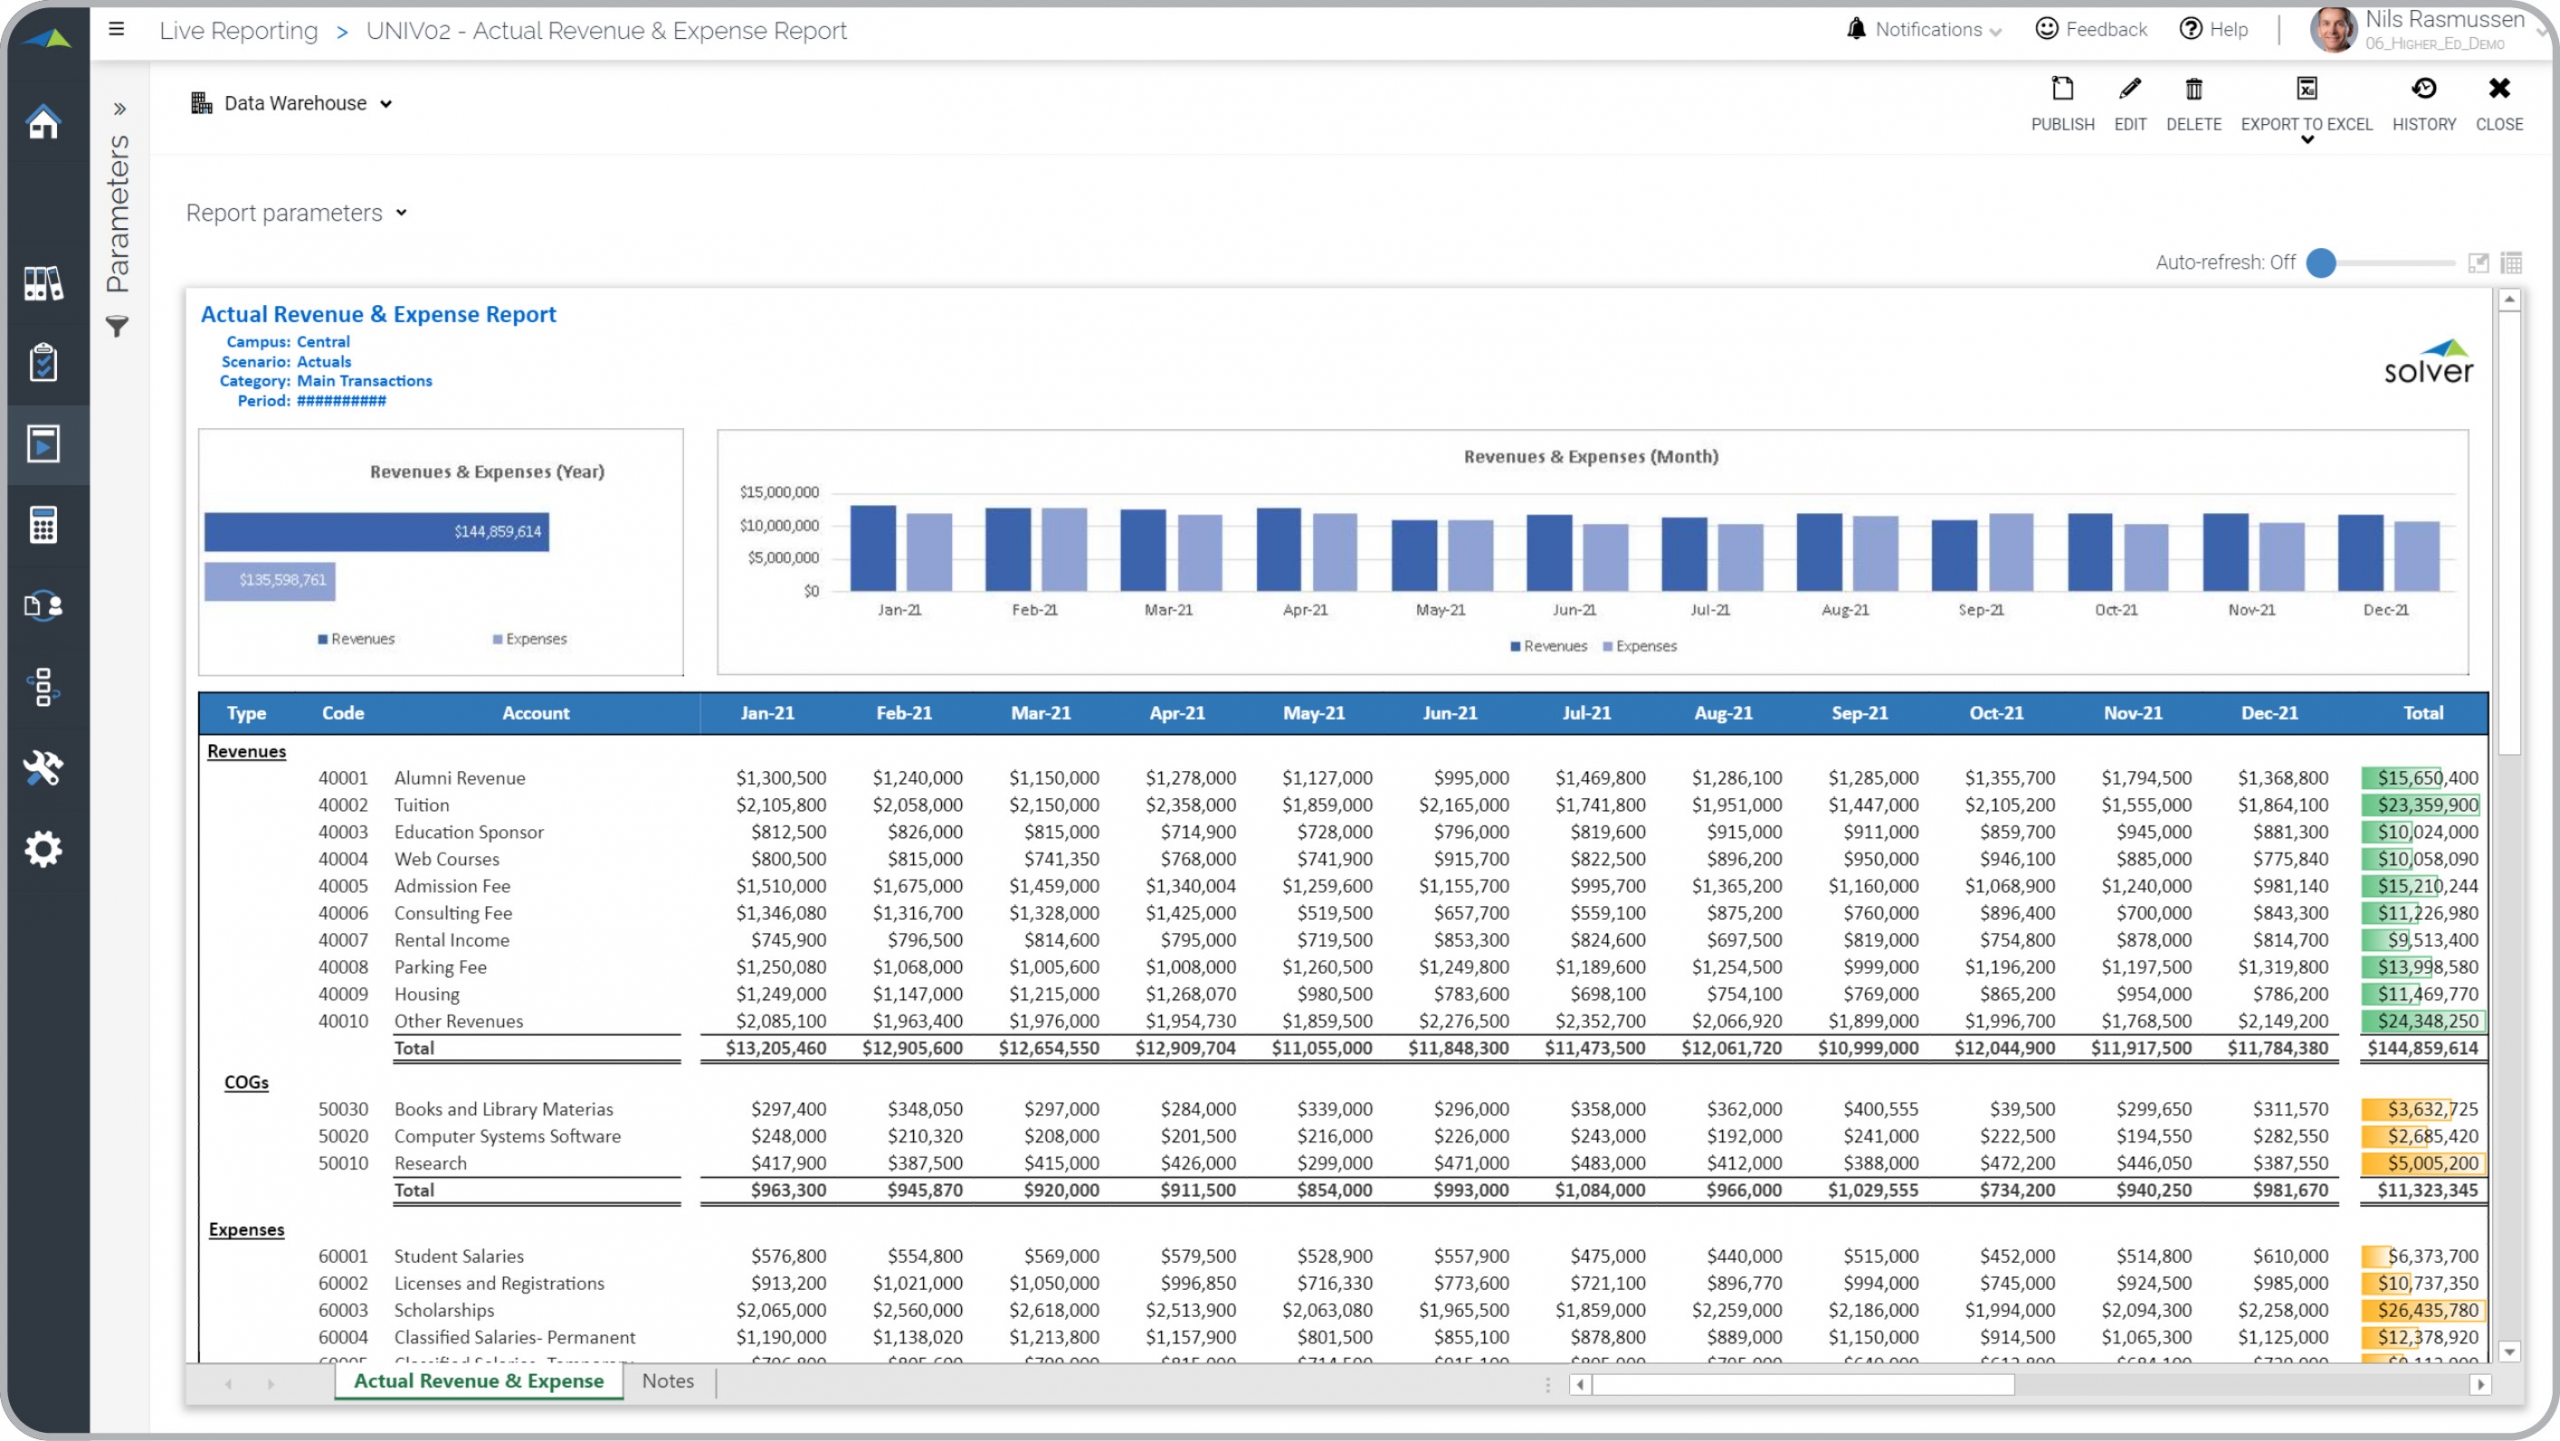
Higher Ed – Revenue & Expense Report
Shows actual YTD, full year budget and the remaining budget for revenues and expenses.
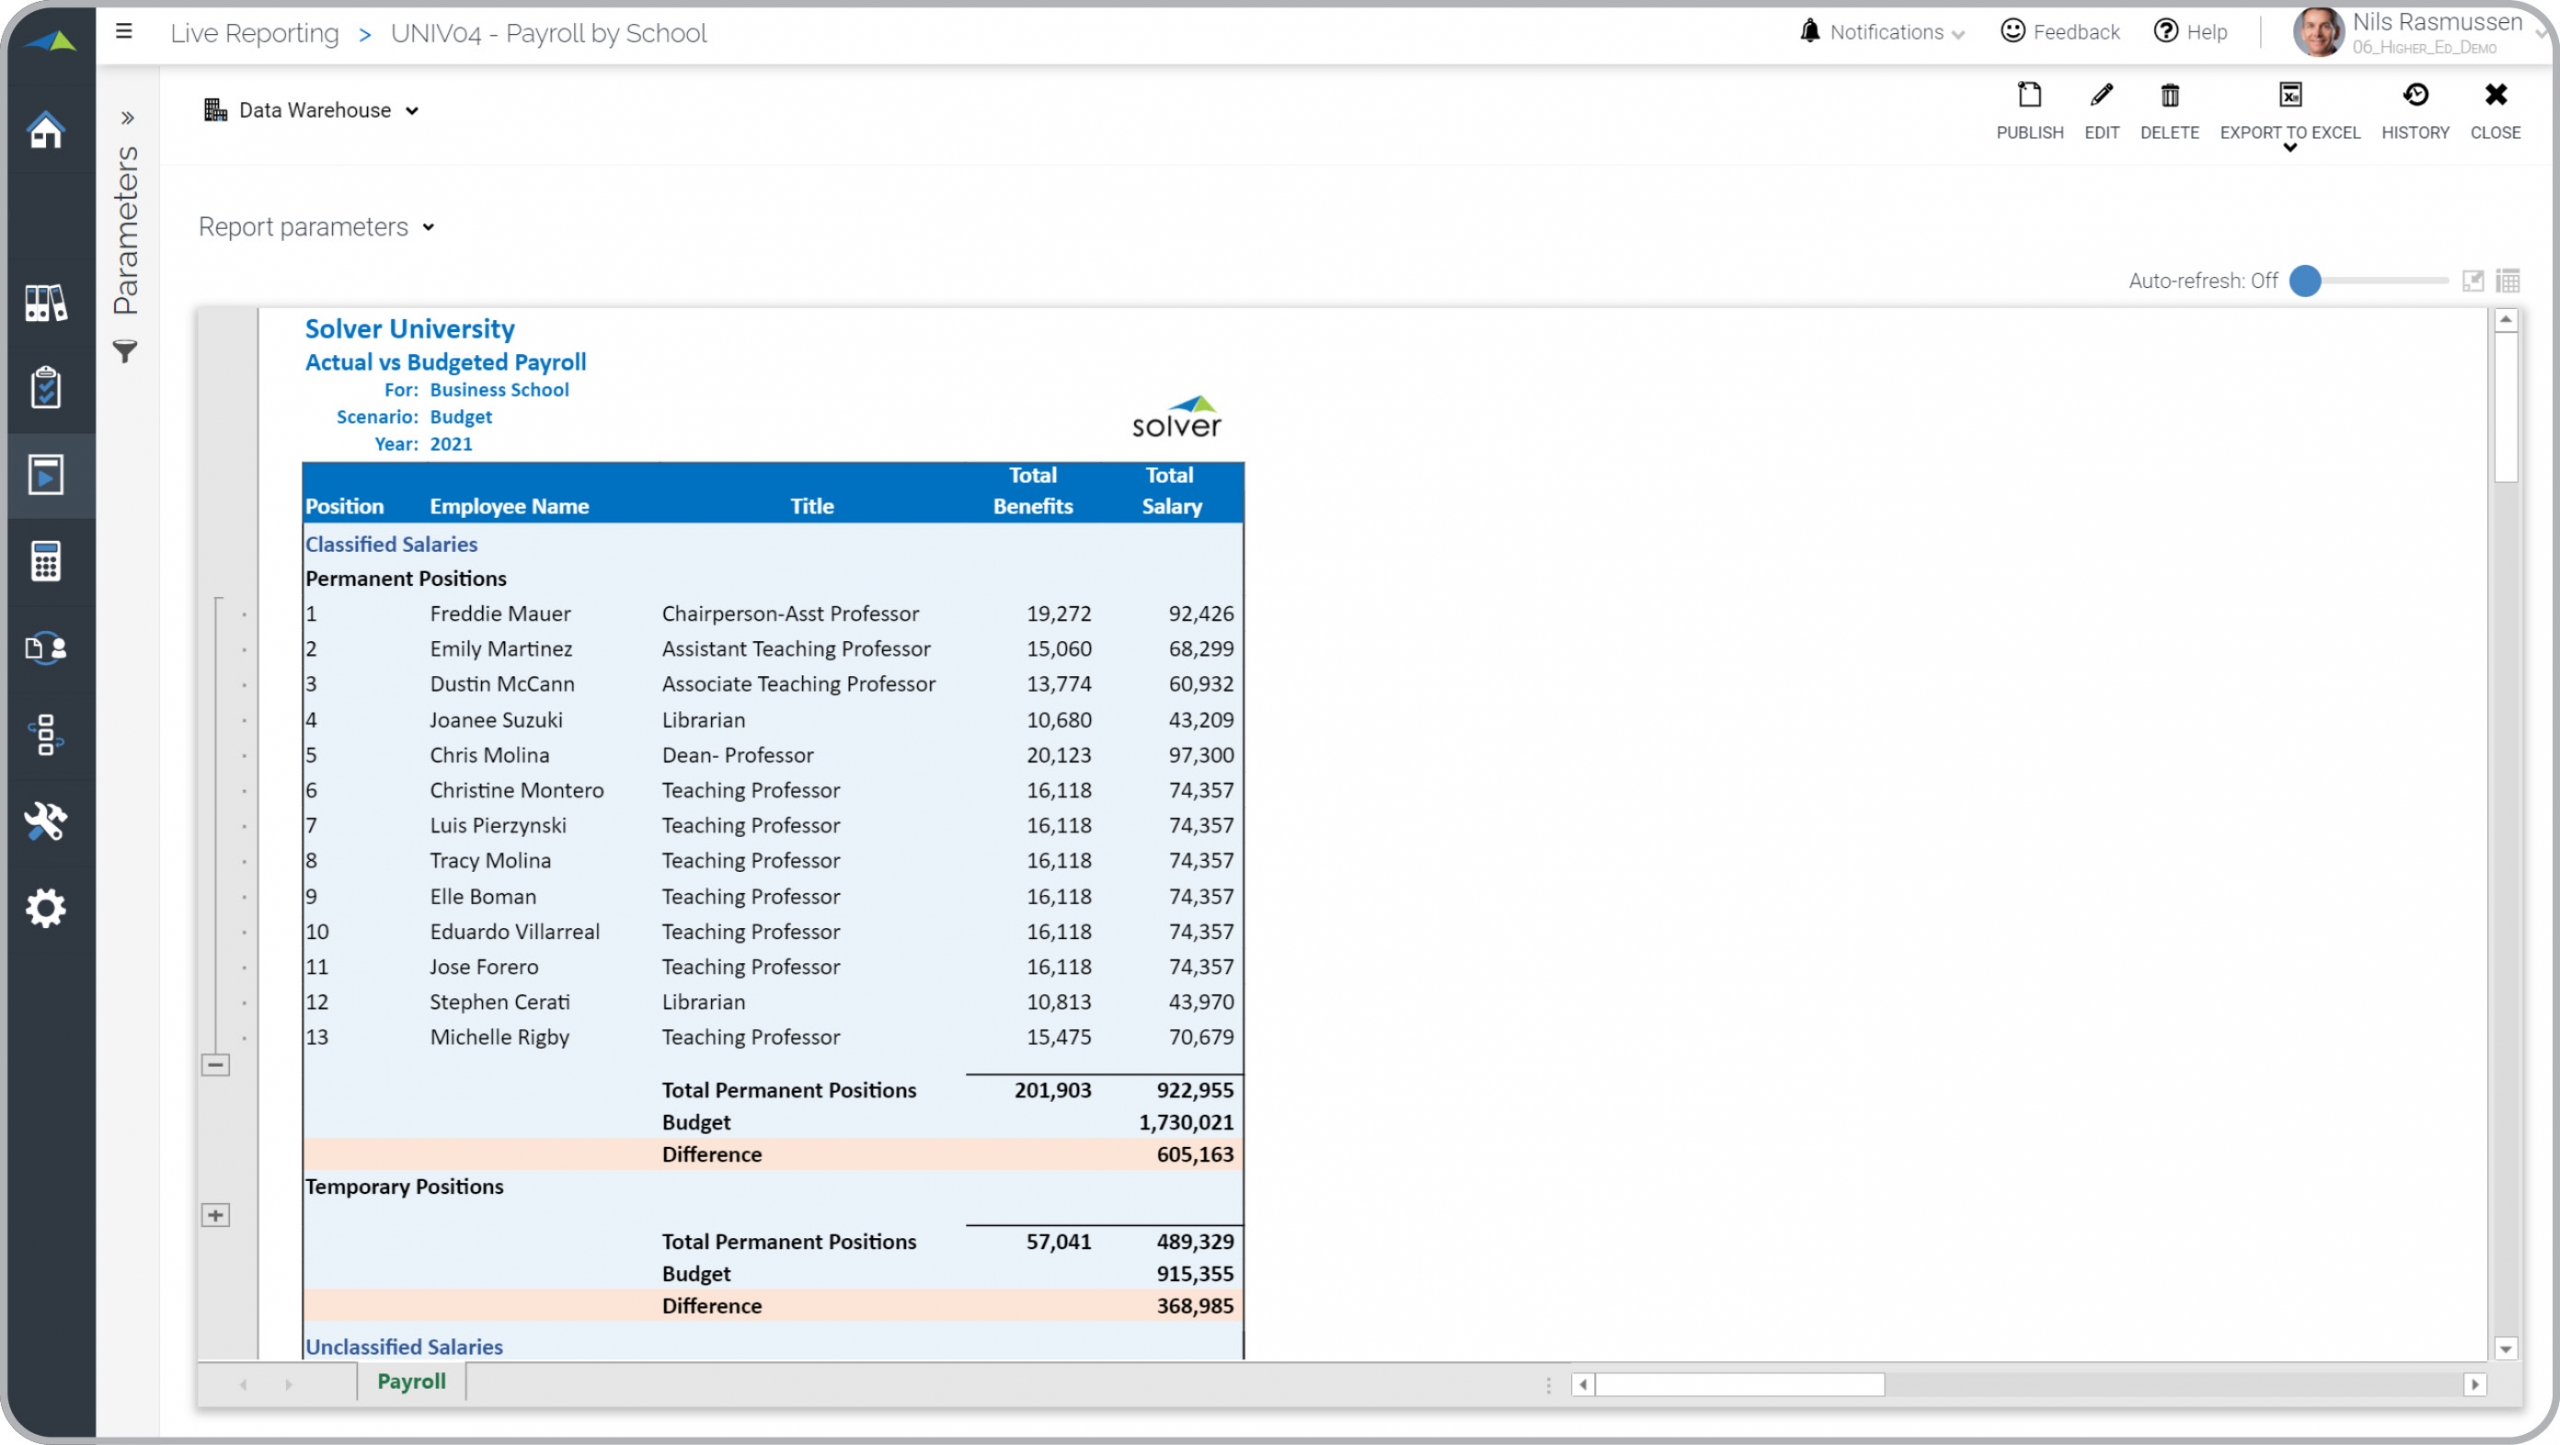
Higher Ed – Actual vs Budget Payroll
Shows detailed actual payroll by employee and compares it to the budget.
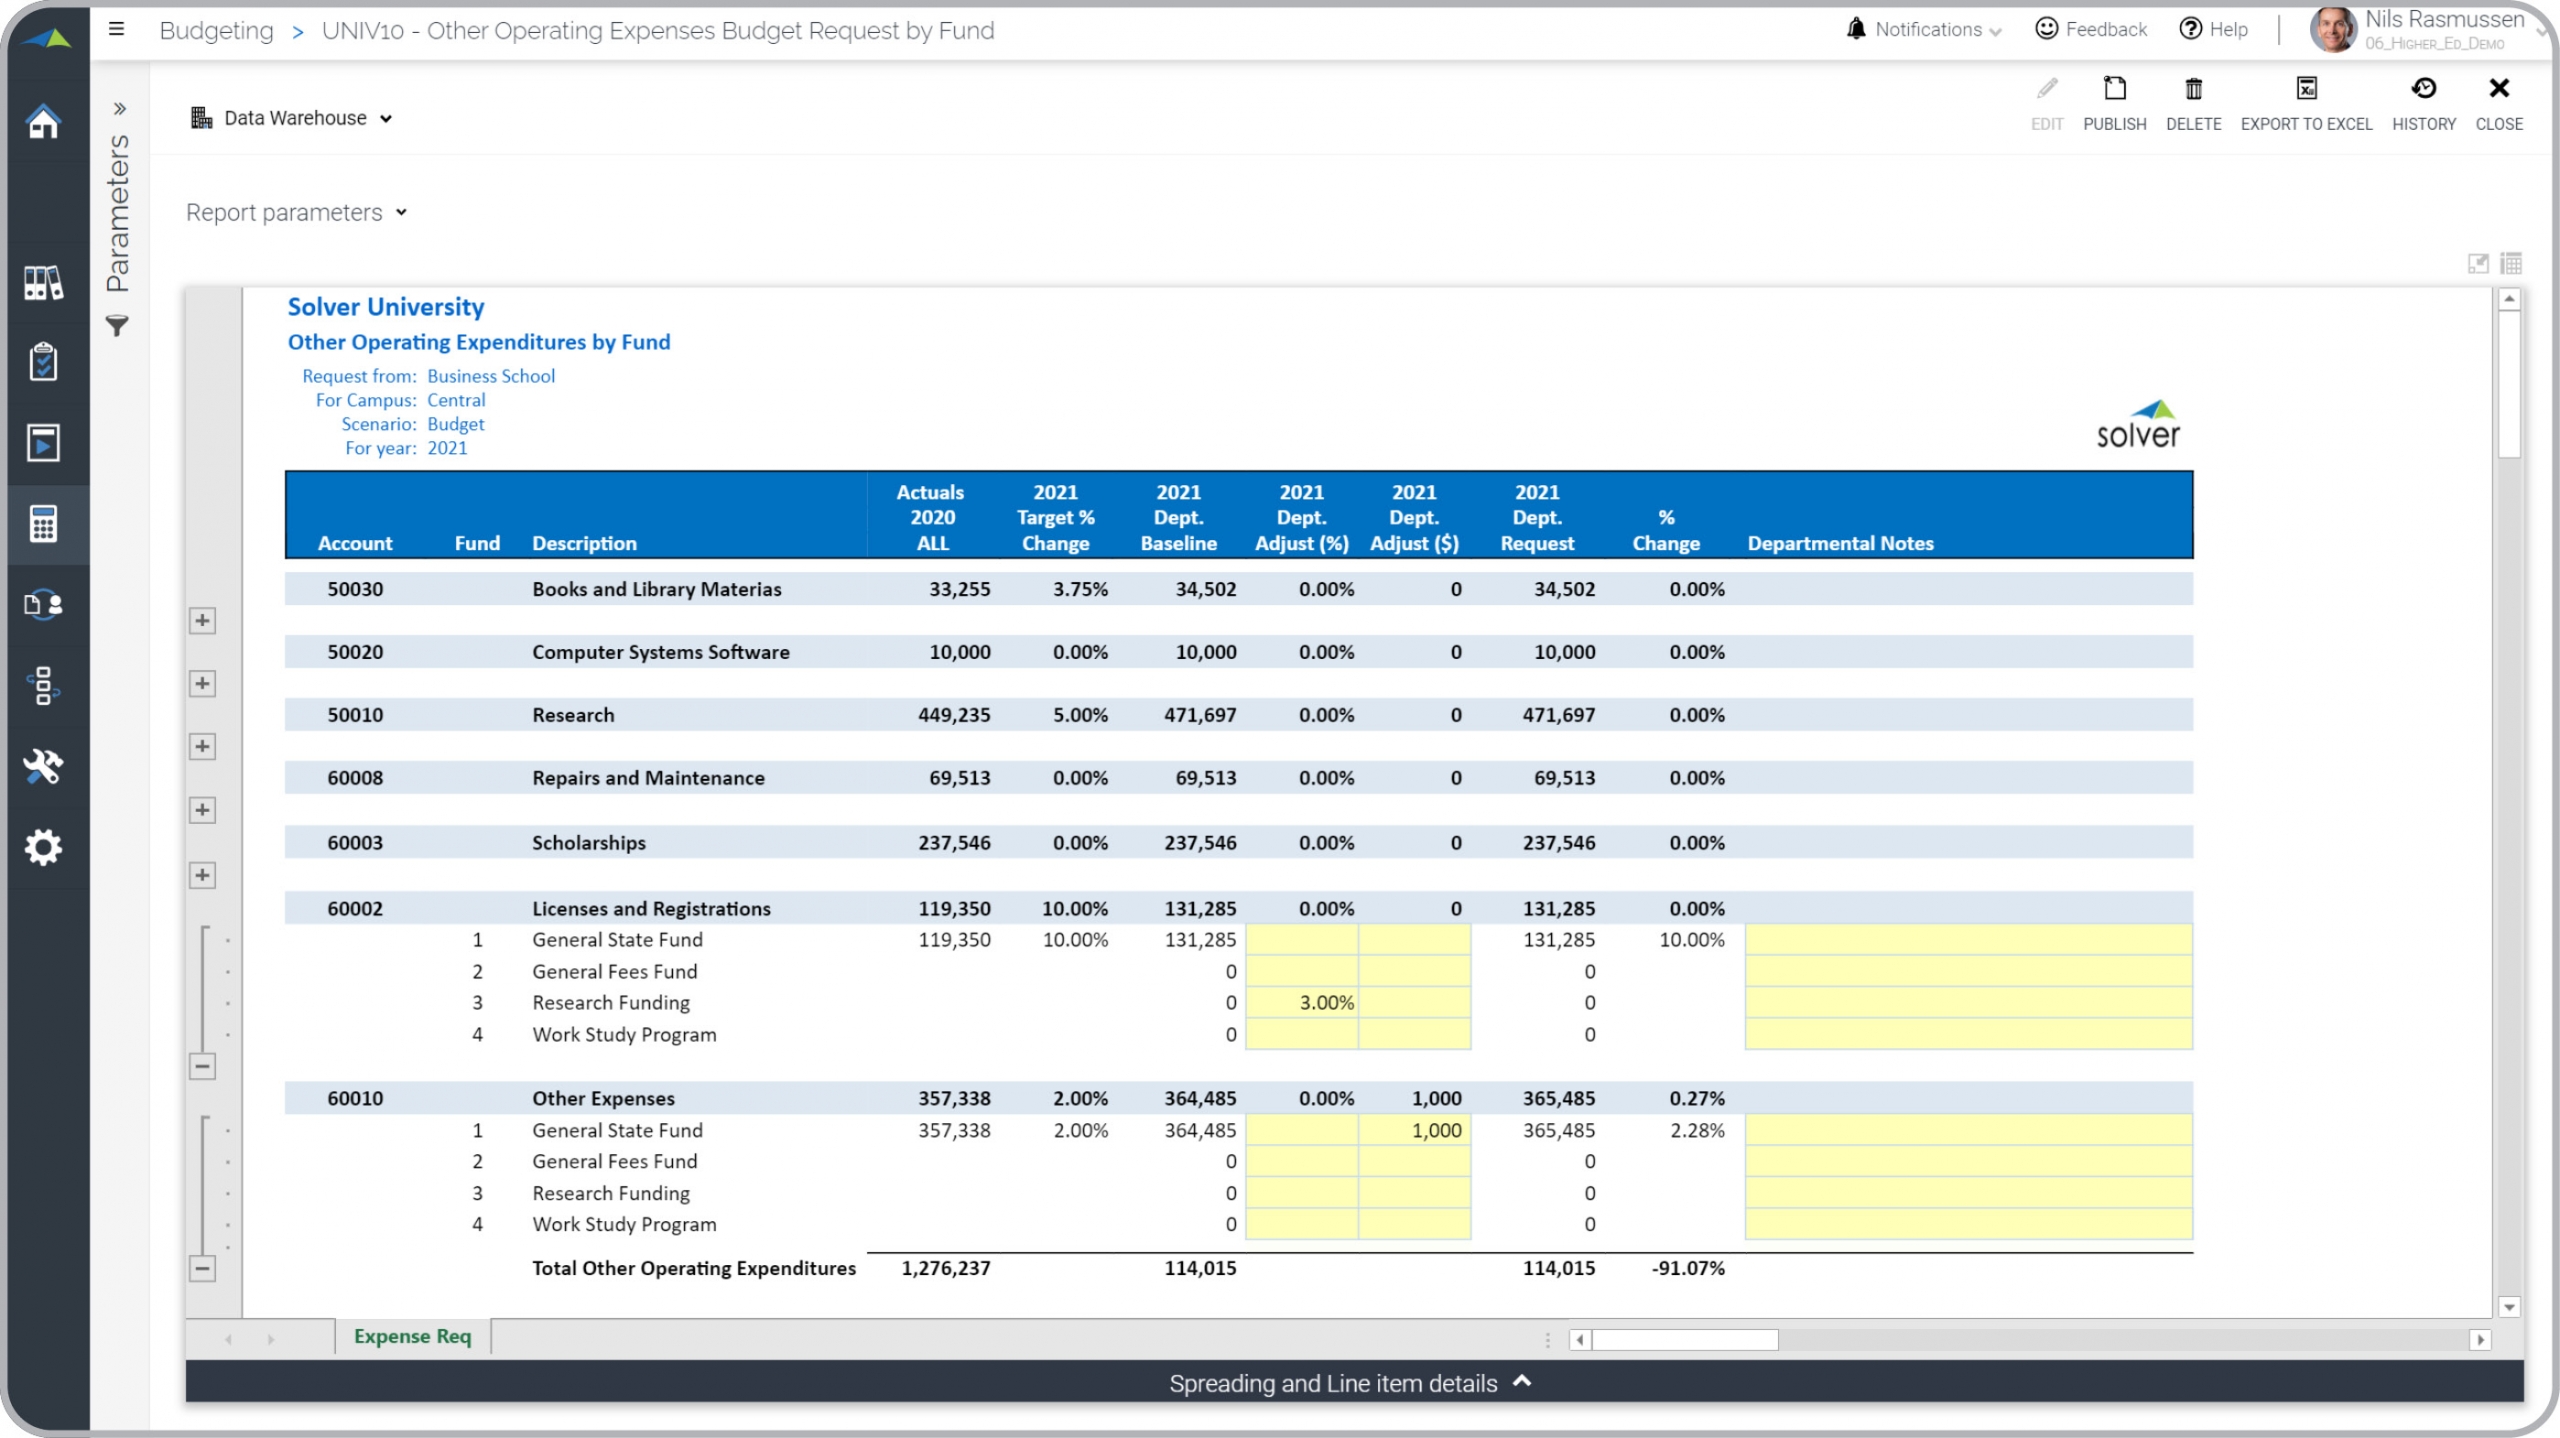
Higher Ed – Opex Budget Request by Fund
Input department budget request by Fund based on adjustments to the baseline budget.
Higher Ed – Budget Comparison
Compares current and last year's budget for operating expenses.
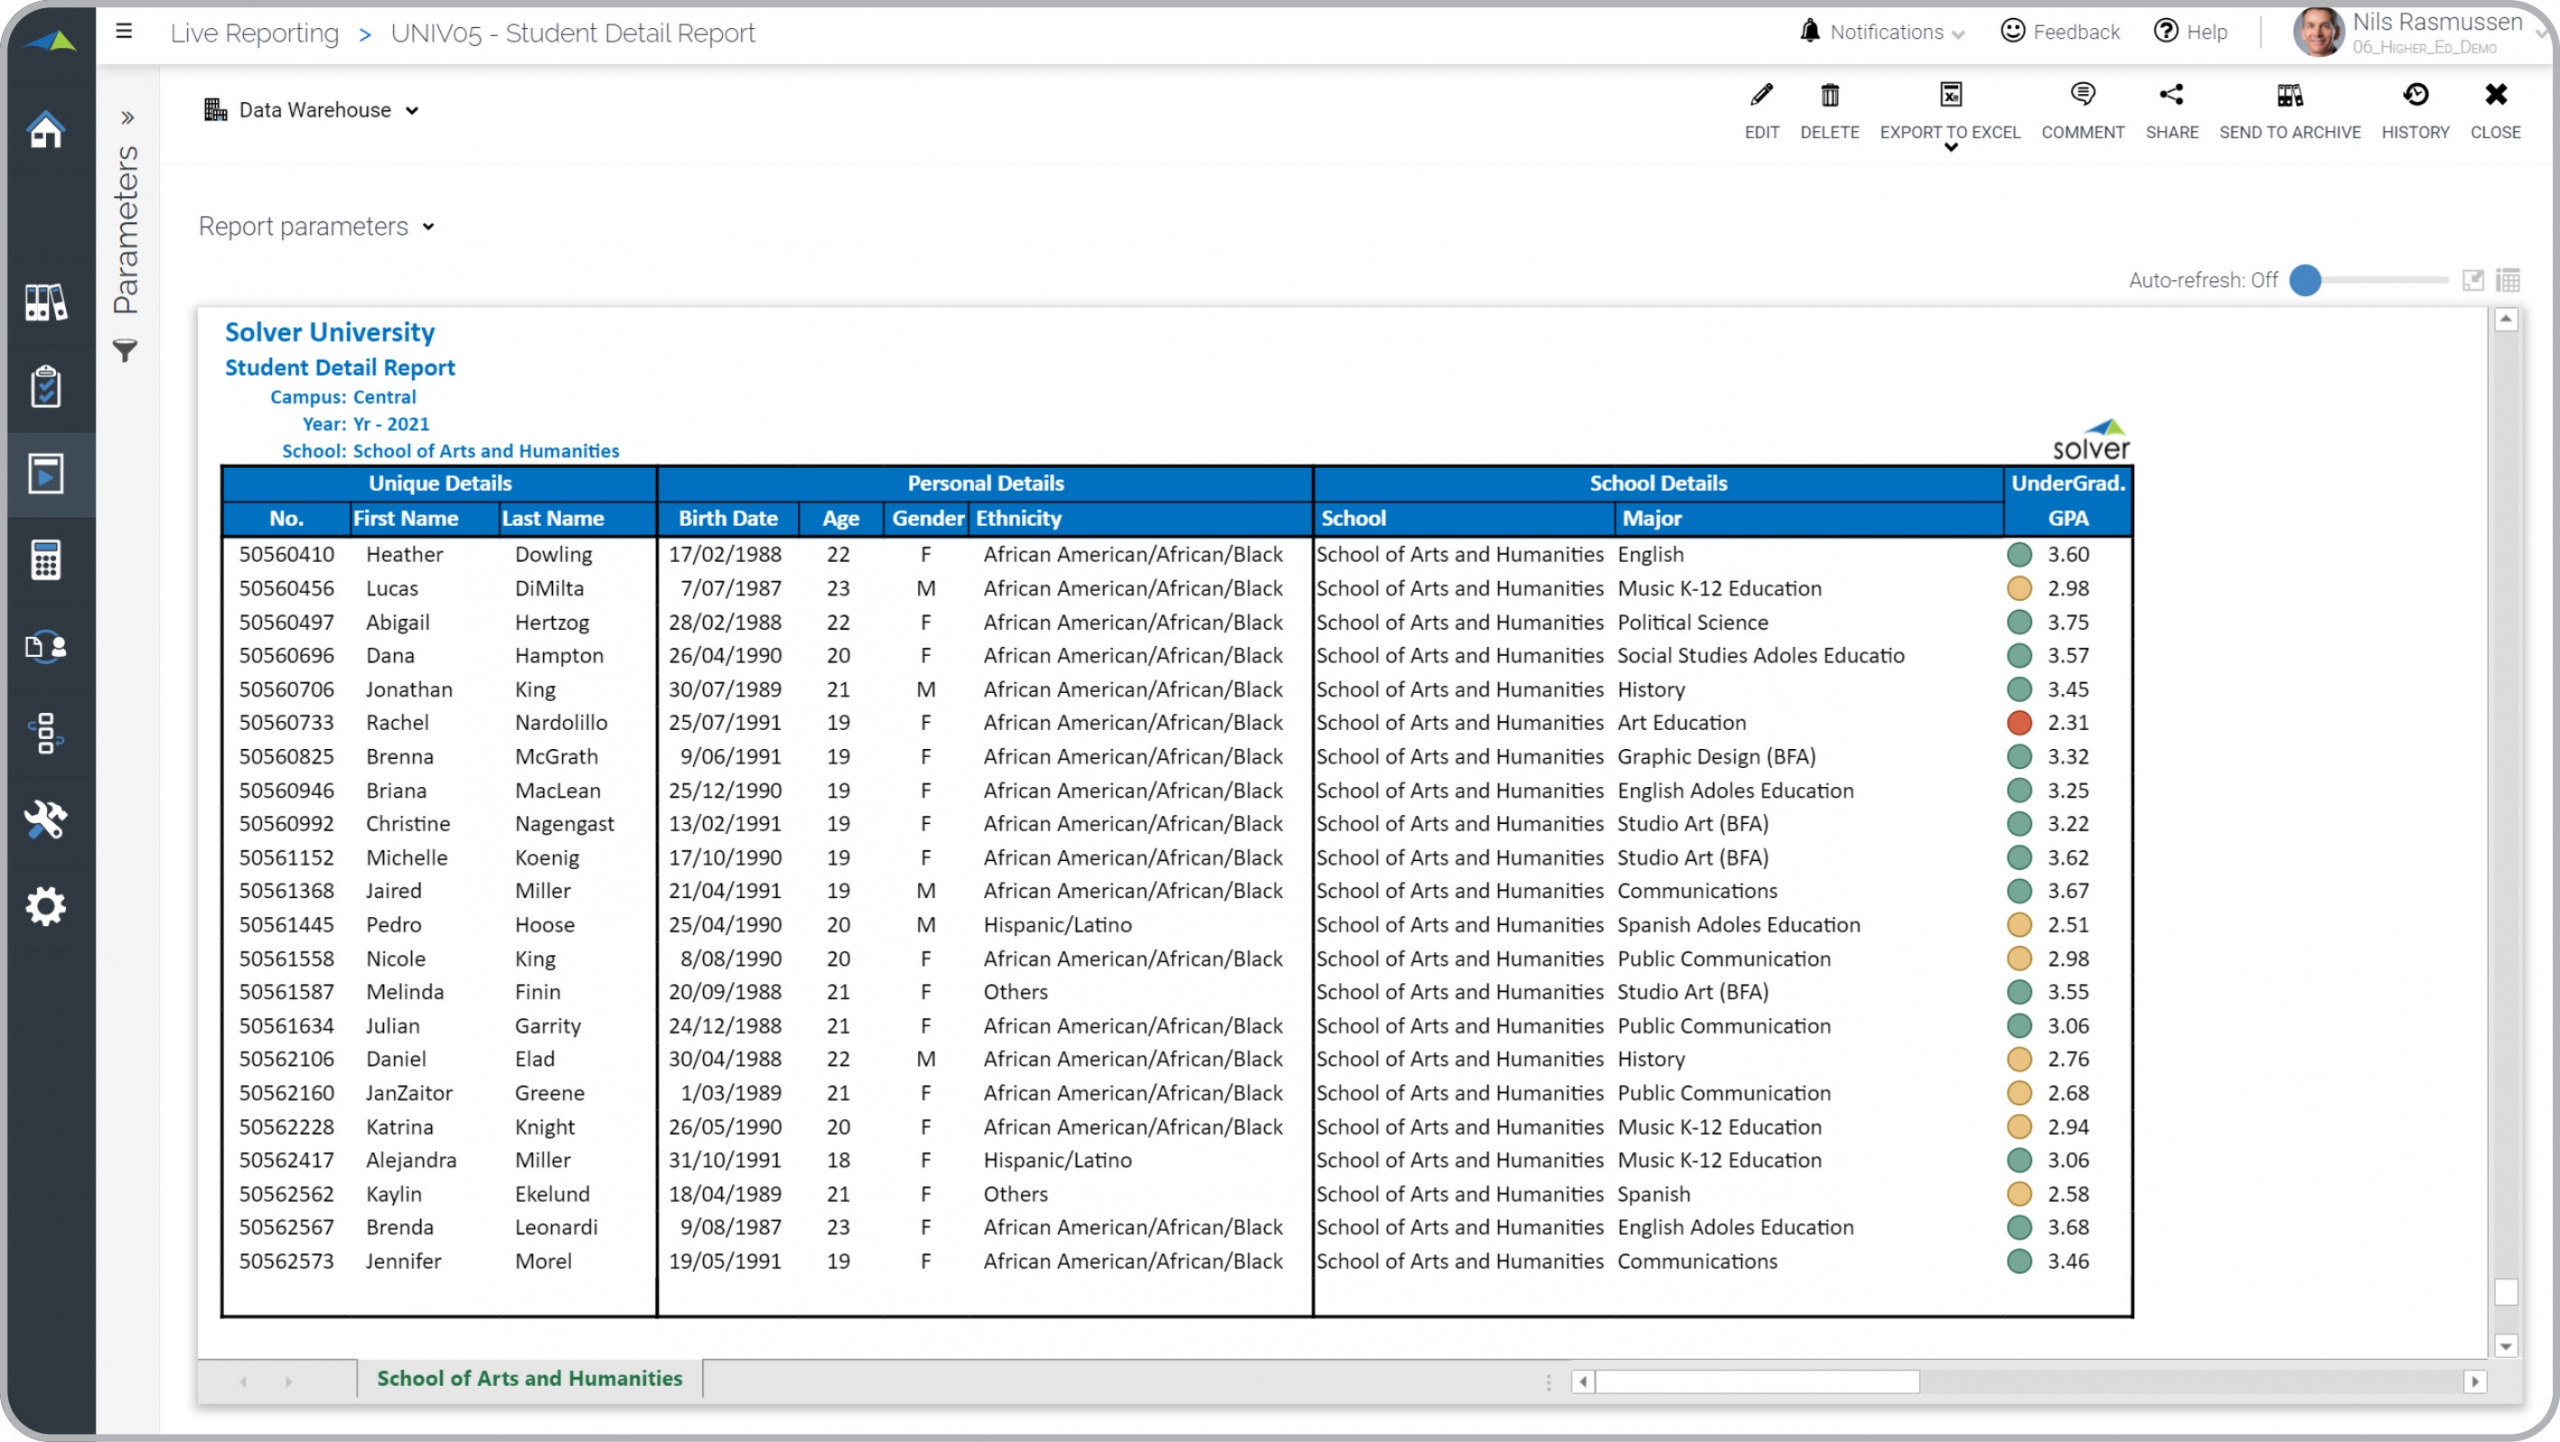
Higher Ed – Student Detail Report
Displays key data per student, such as age, gender, major and GPA.
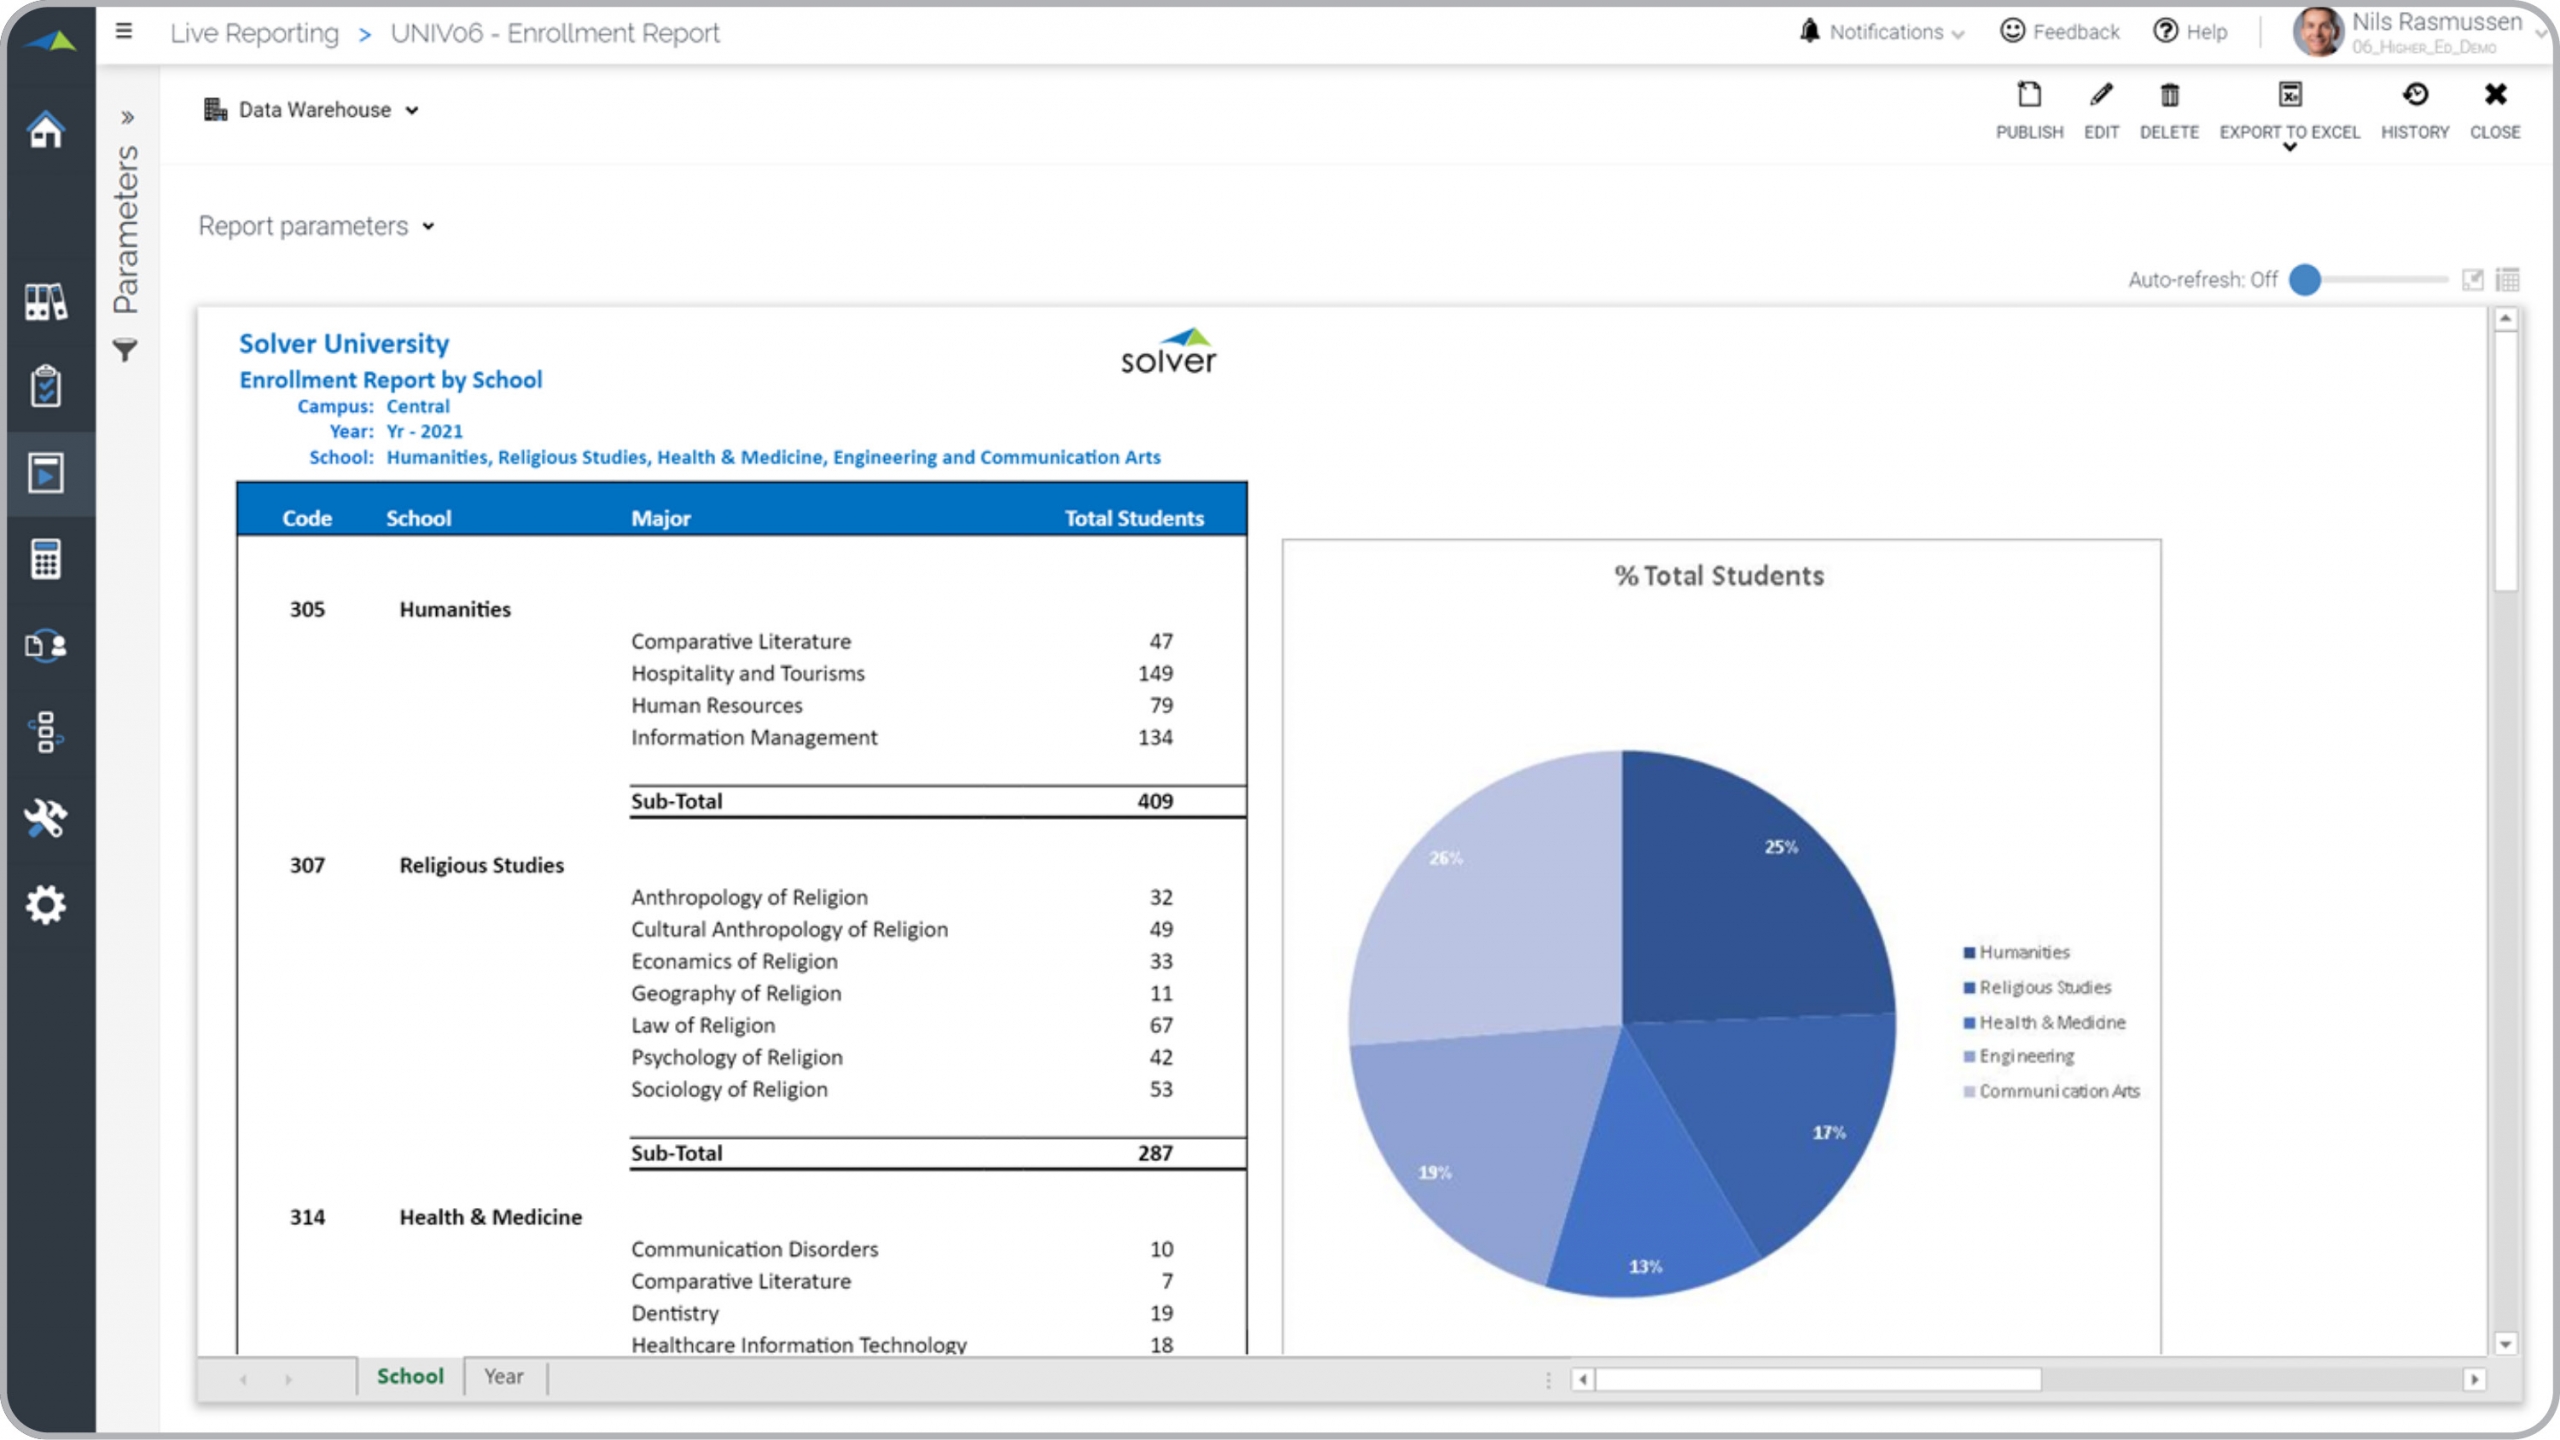
Higher Ed – Enrollment by School
Shows student count by major by school and grand total for the university.
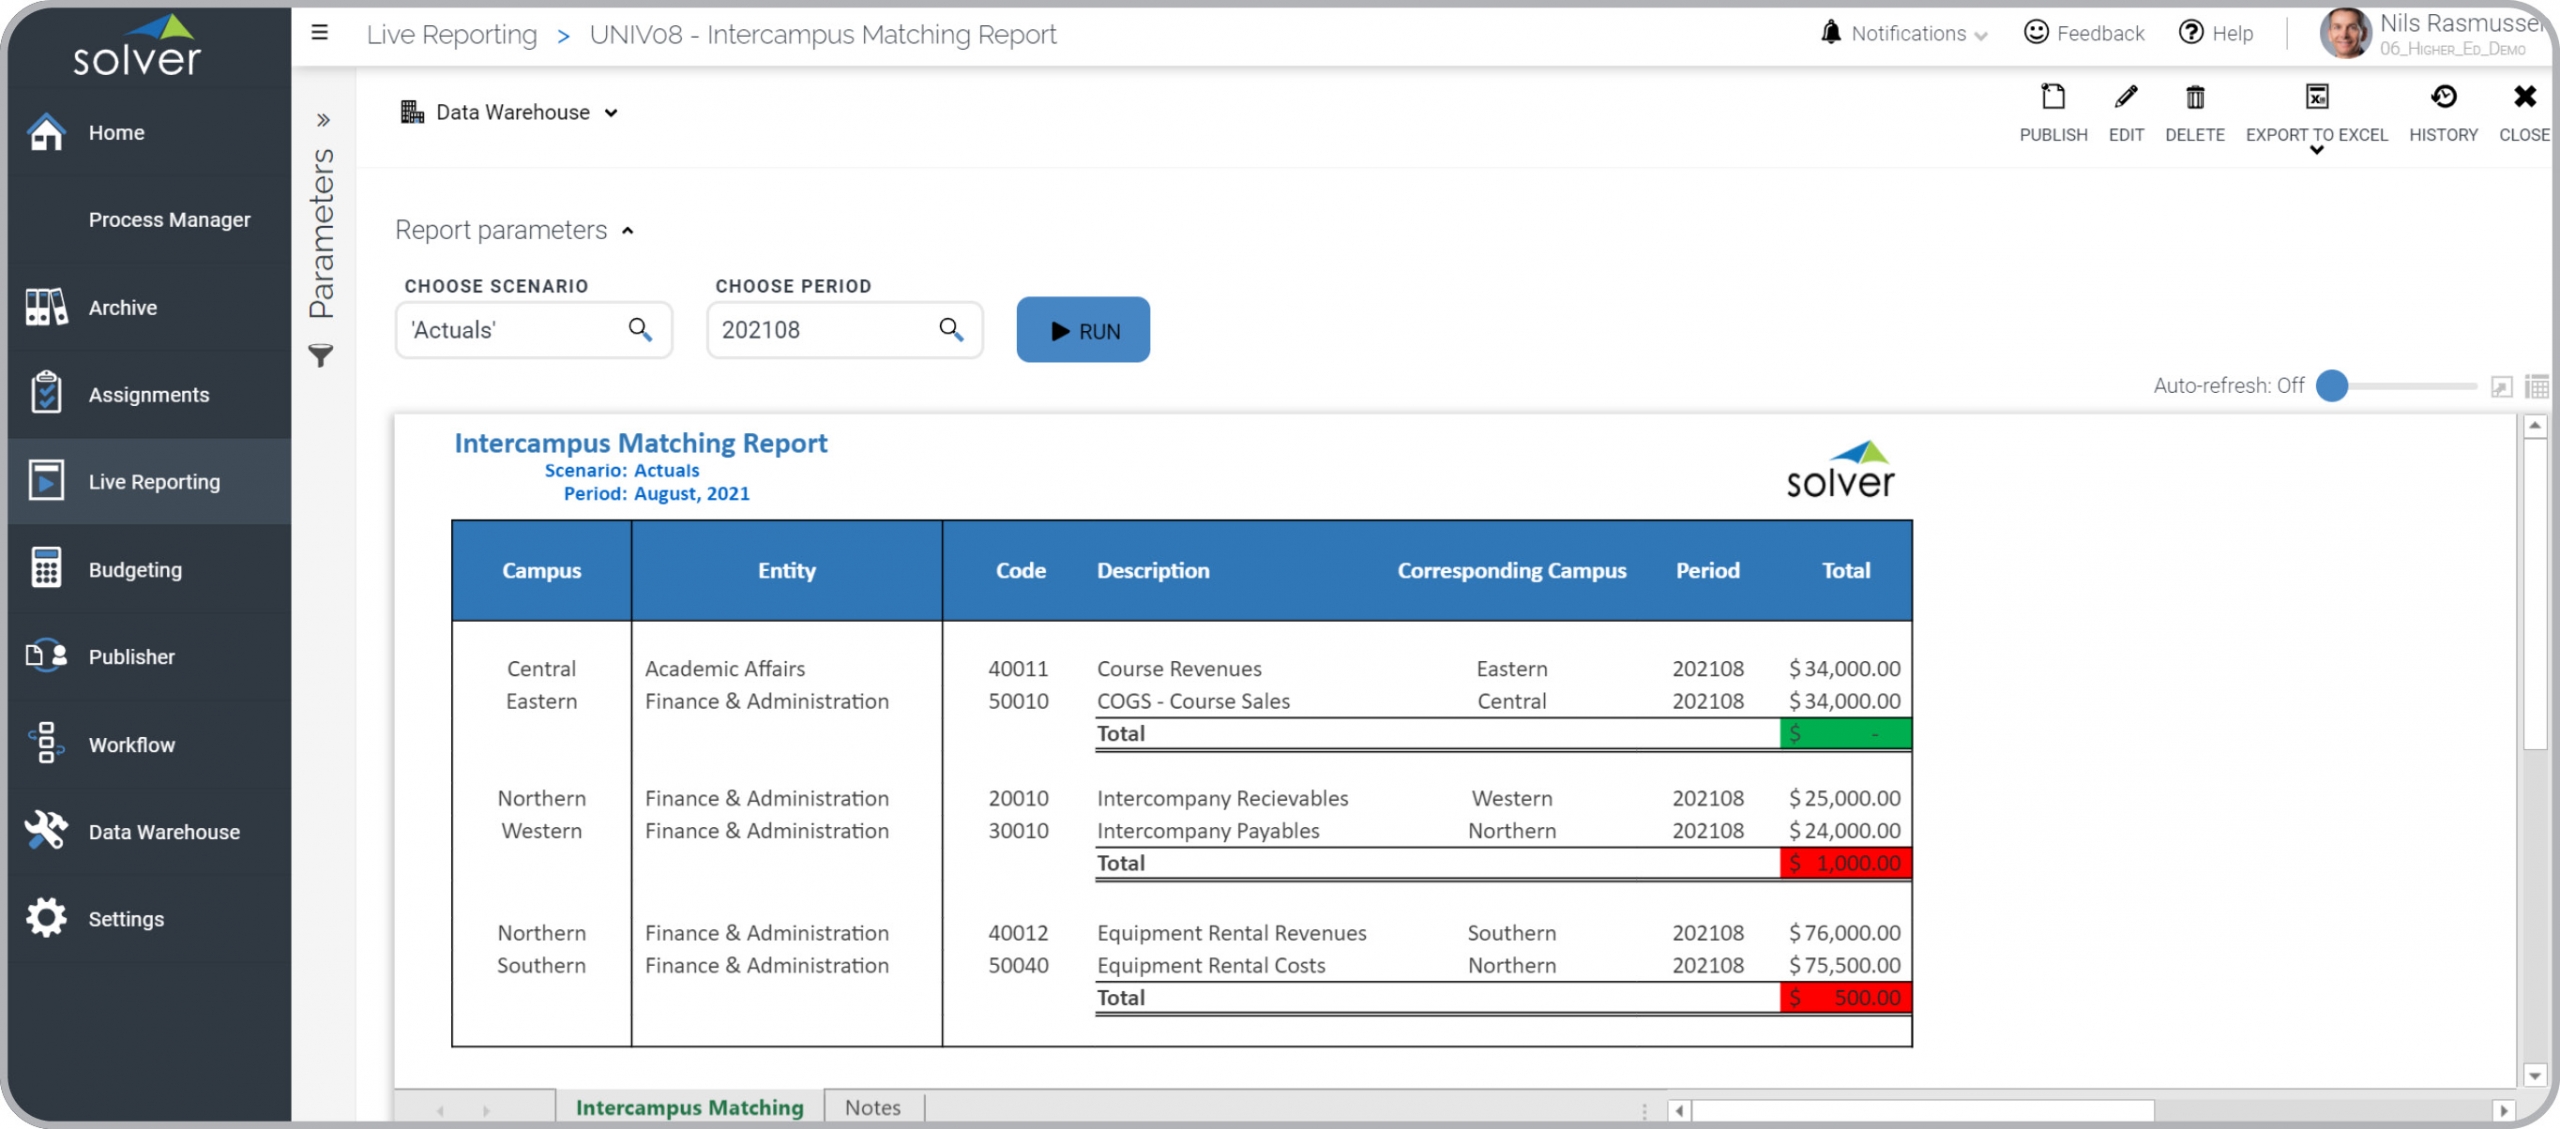
Higher Ed – Intercampus Matching Report
This report helps track internal transactions (due to, due from) between campuses.
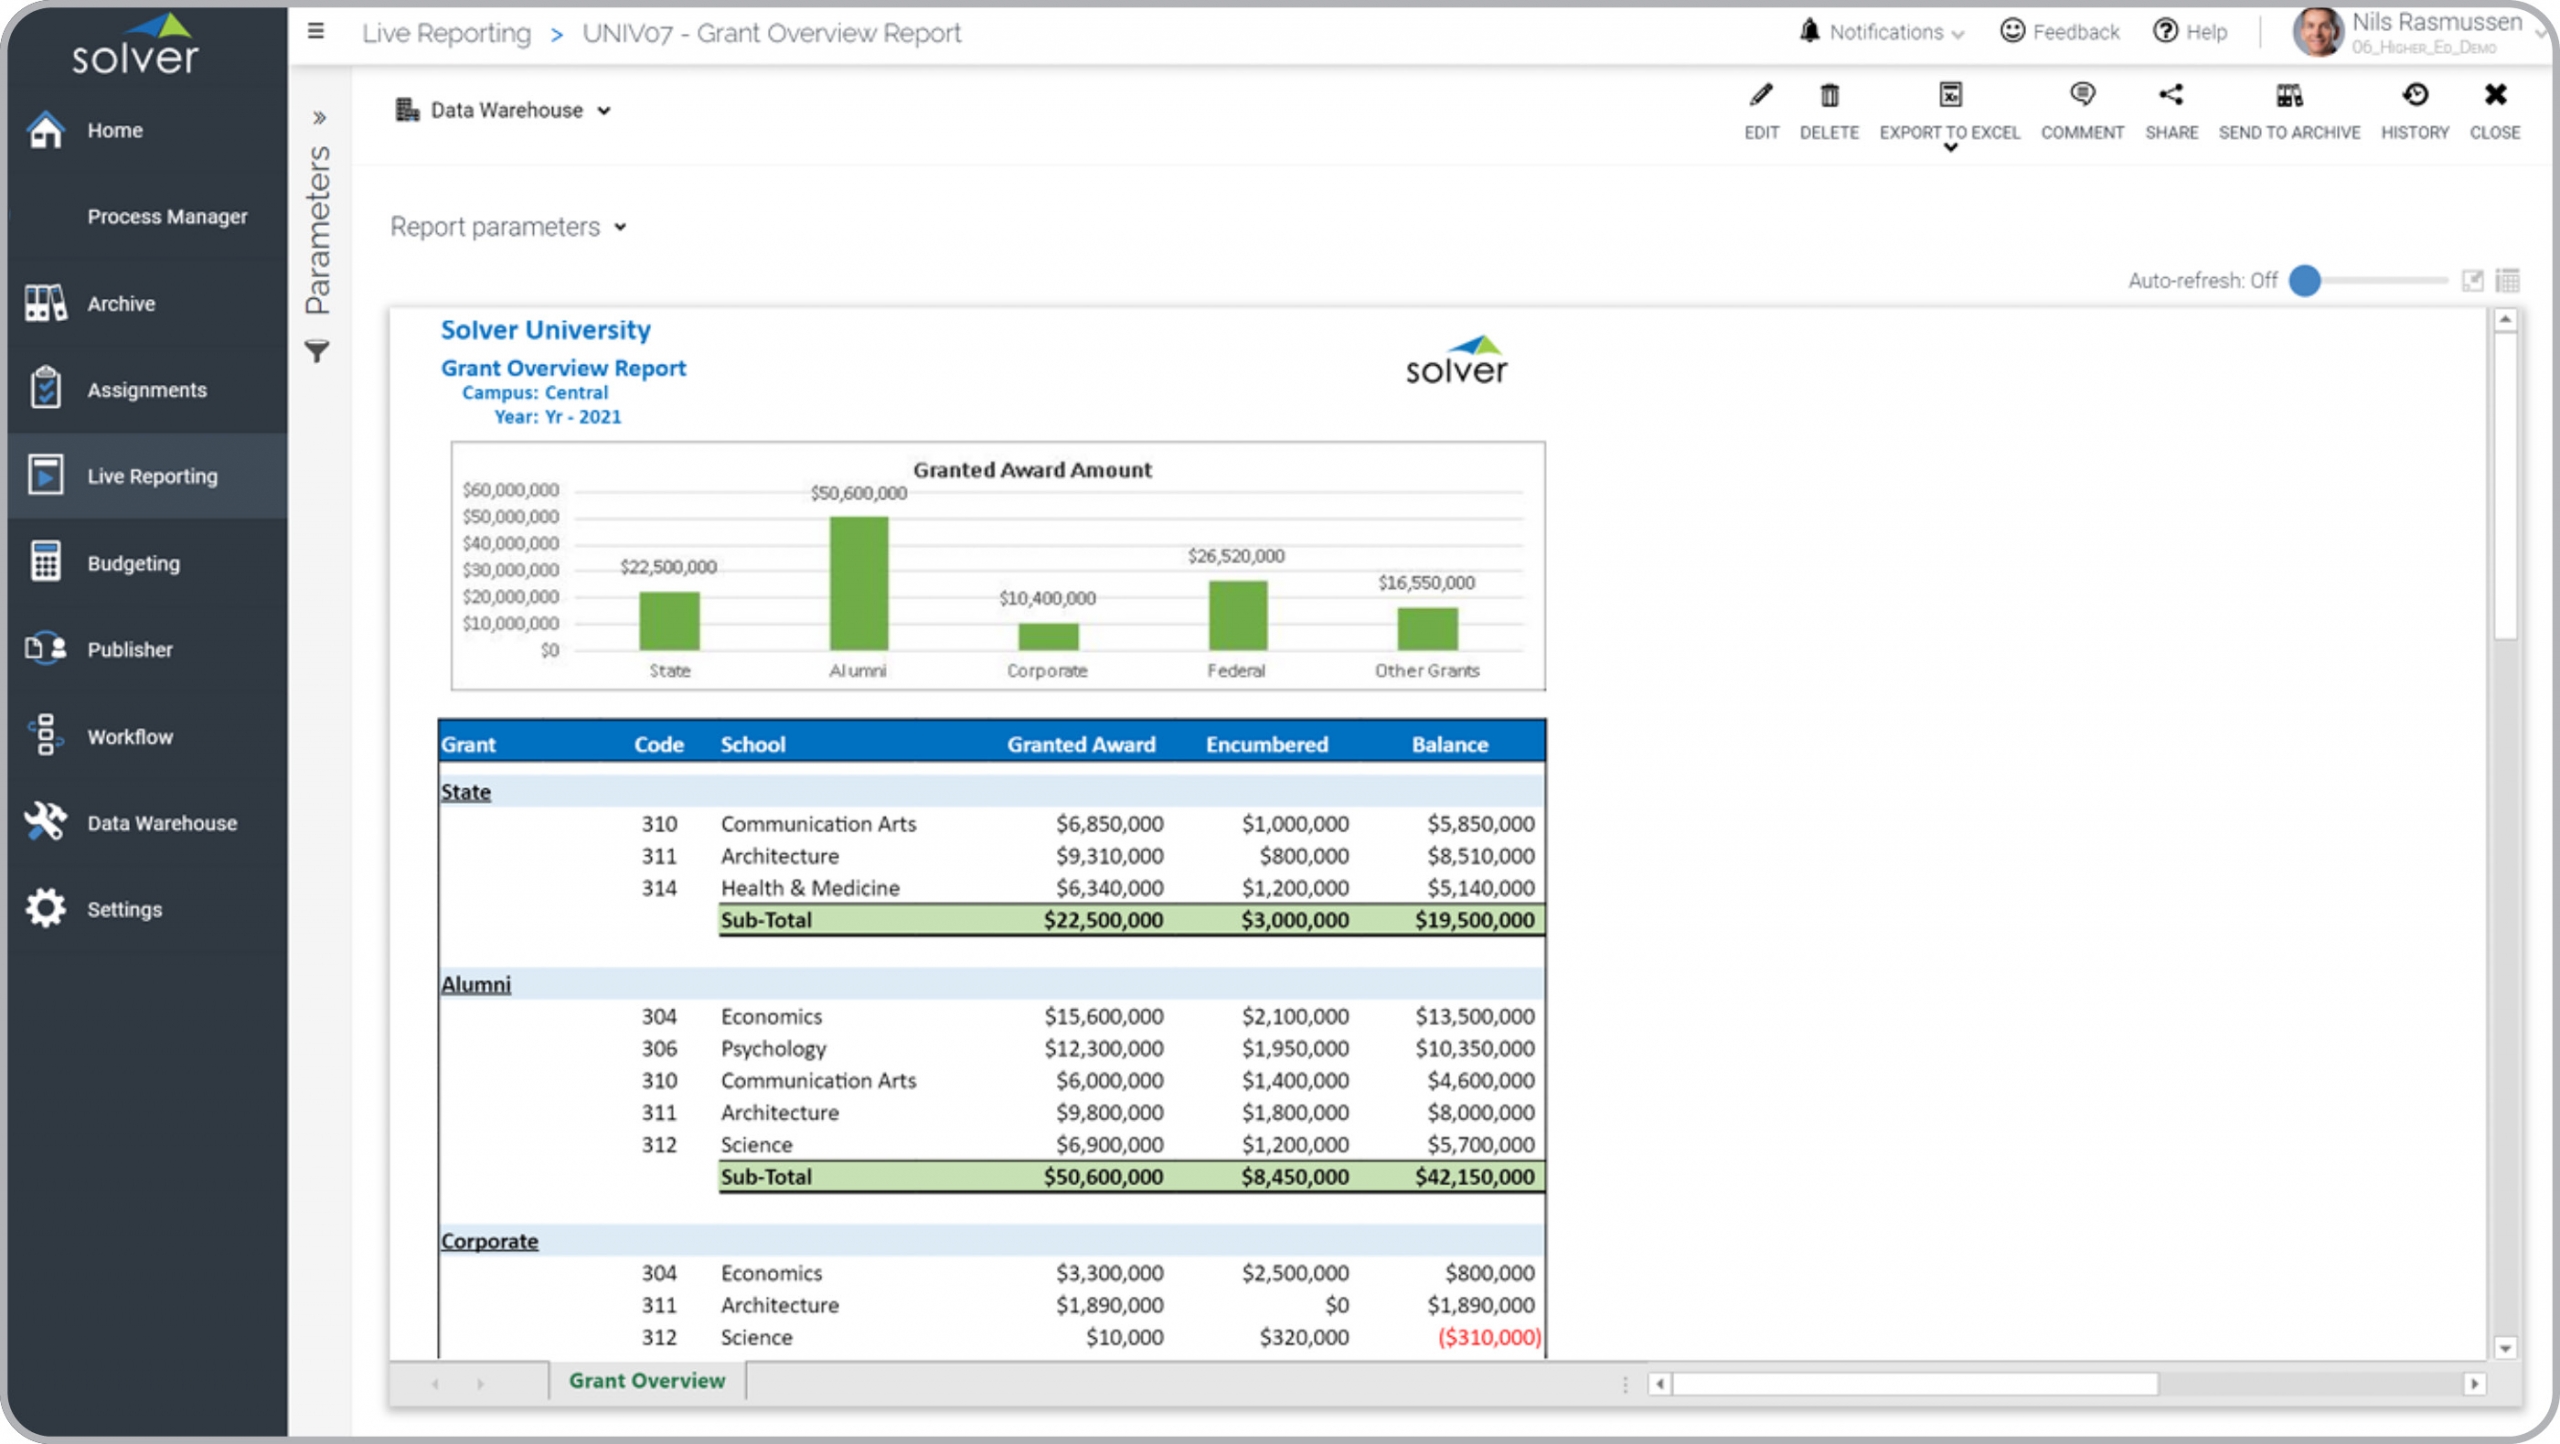
Higher Ed – Grant Overview Report
Awarded, encumbered and balance amounts by school by grant.
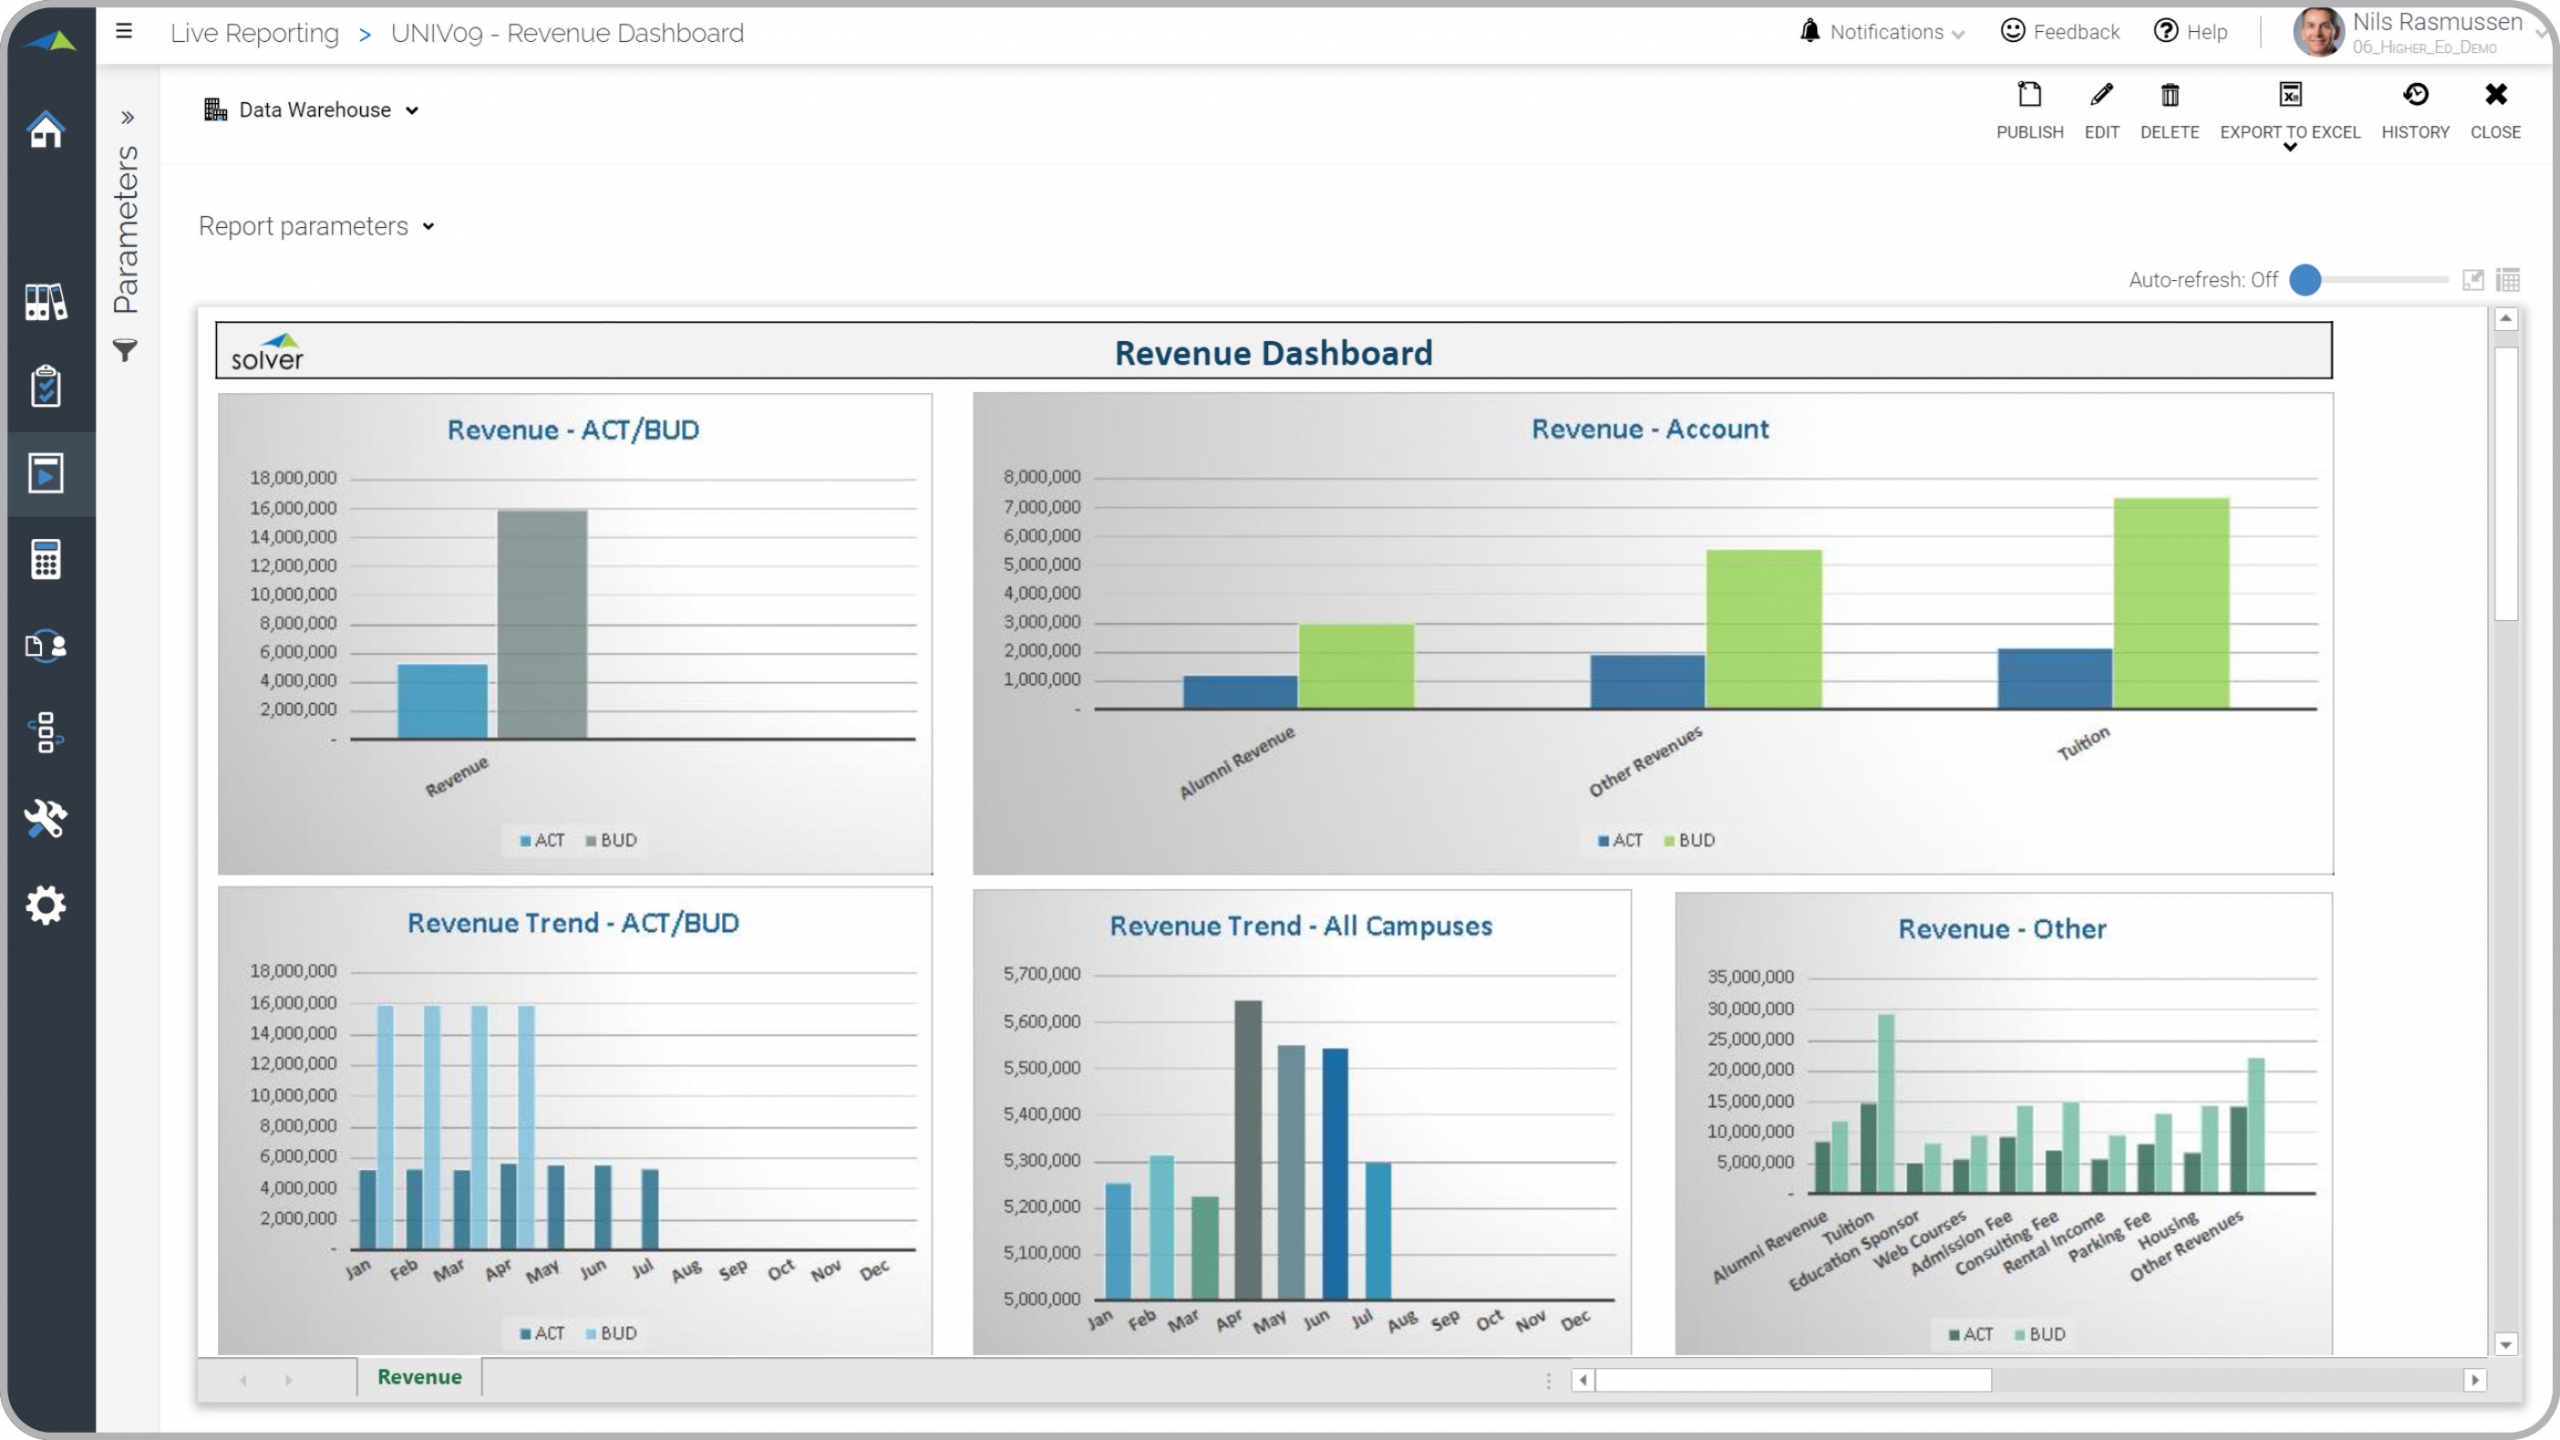
Higher Ed – Revenue Dashboard
This graphical report breaks down revenue by month, by type and actual vs budget.
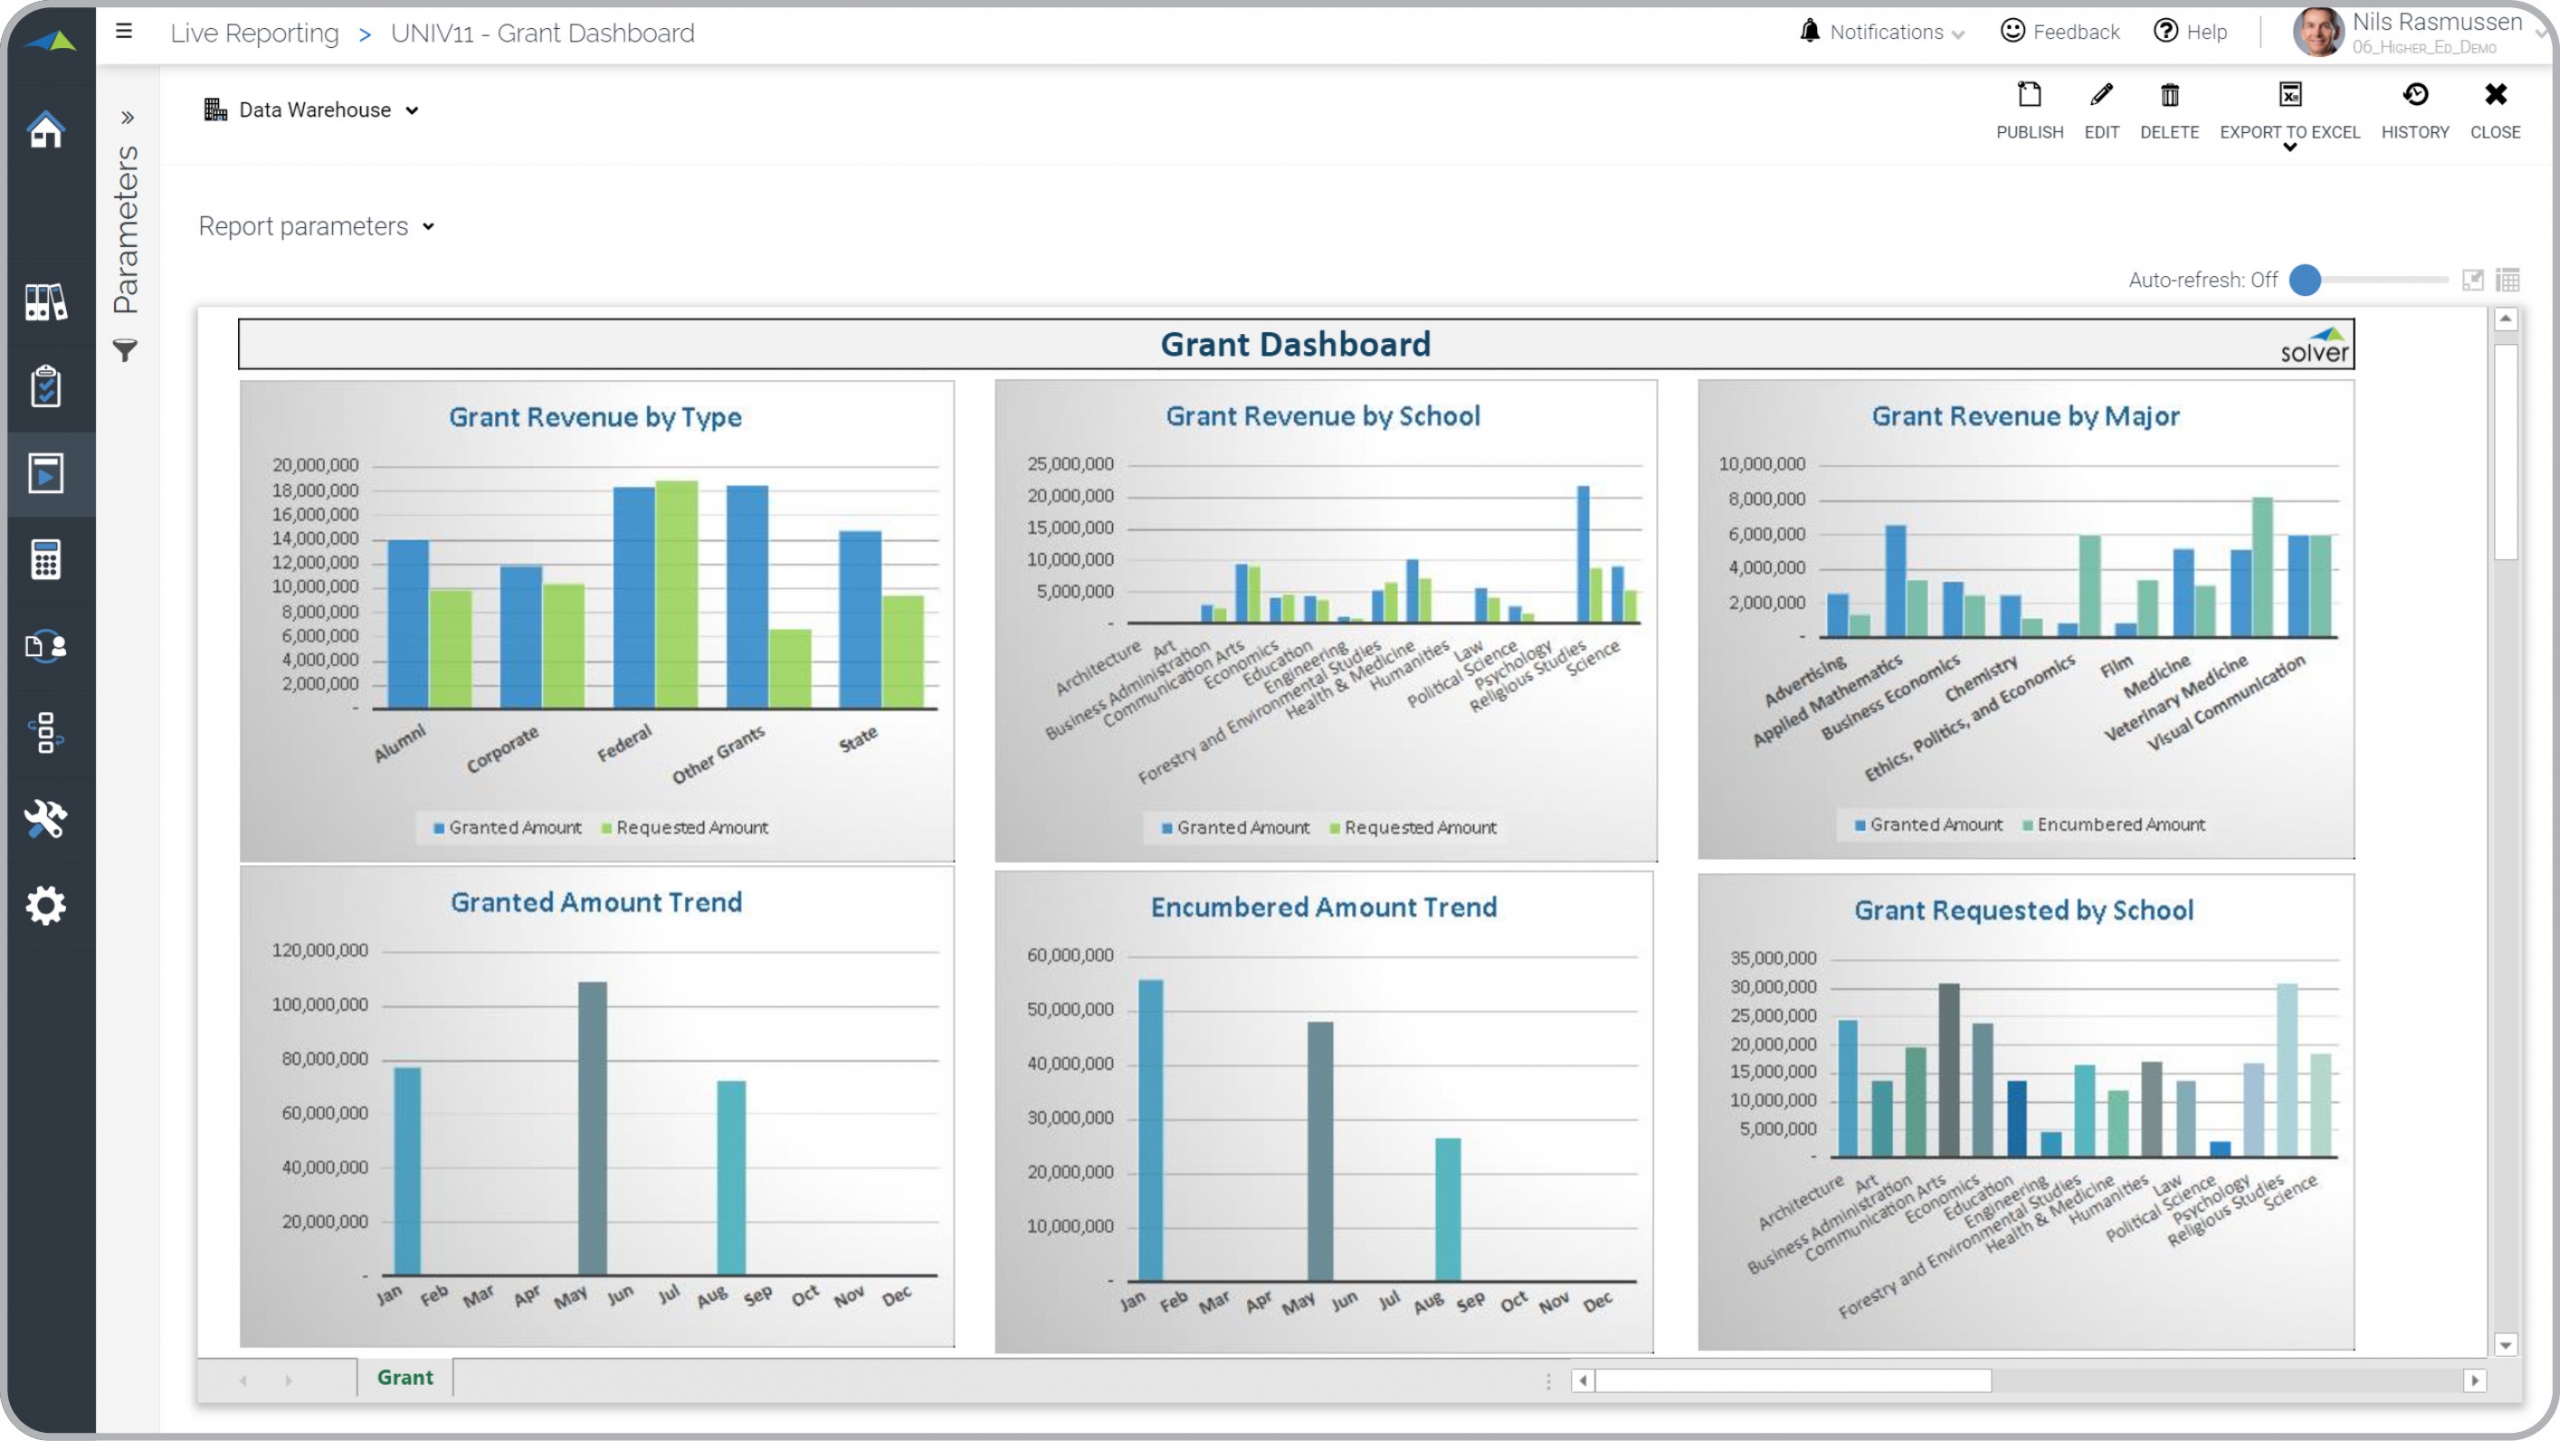
Higher Ed – Grant Dashboard
Grant analysis by type, major and granted/encumbered/requested.
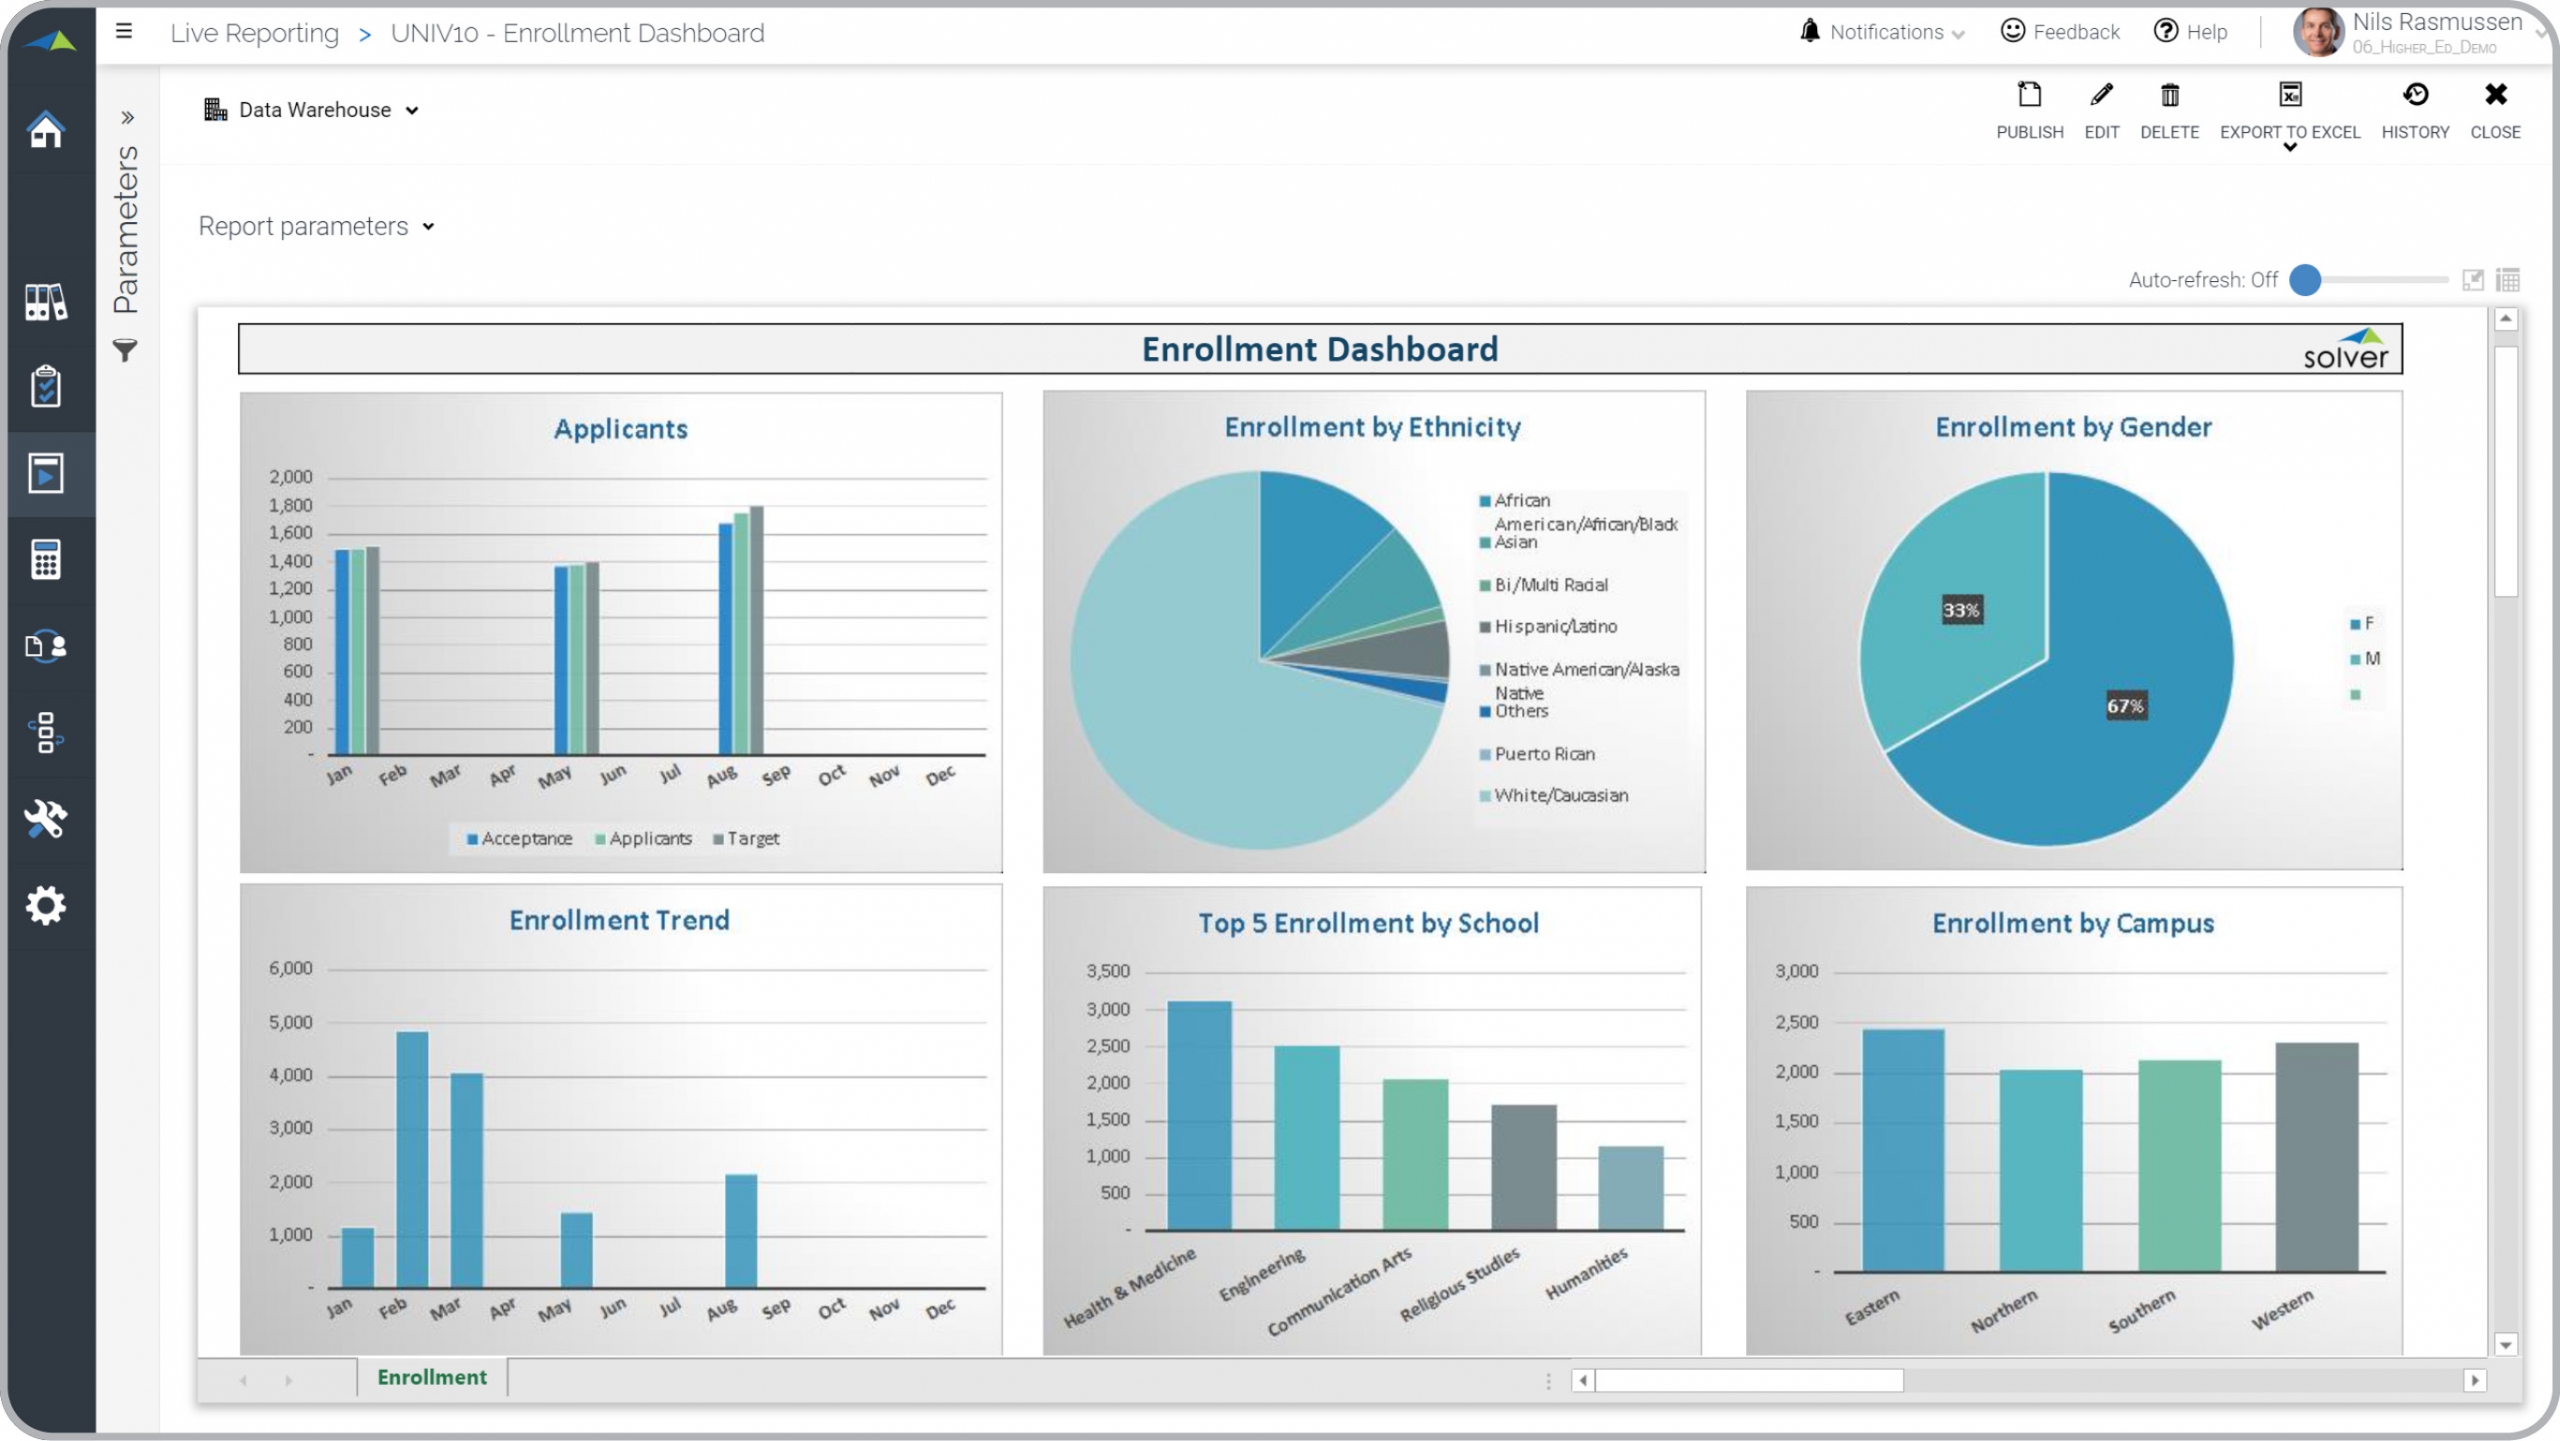
Higher Ed – Enrollment Dashboard
Enrollment analysis by applicants, ethnicity, gender, school, campus and trend.
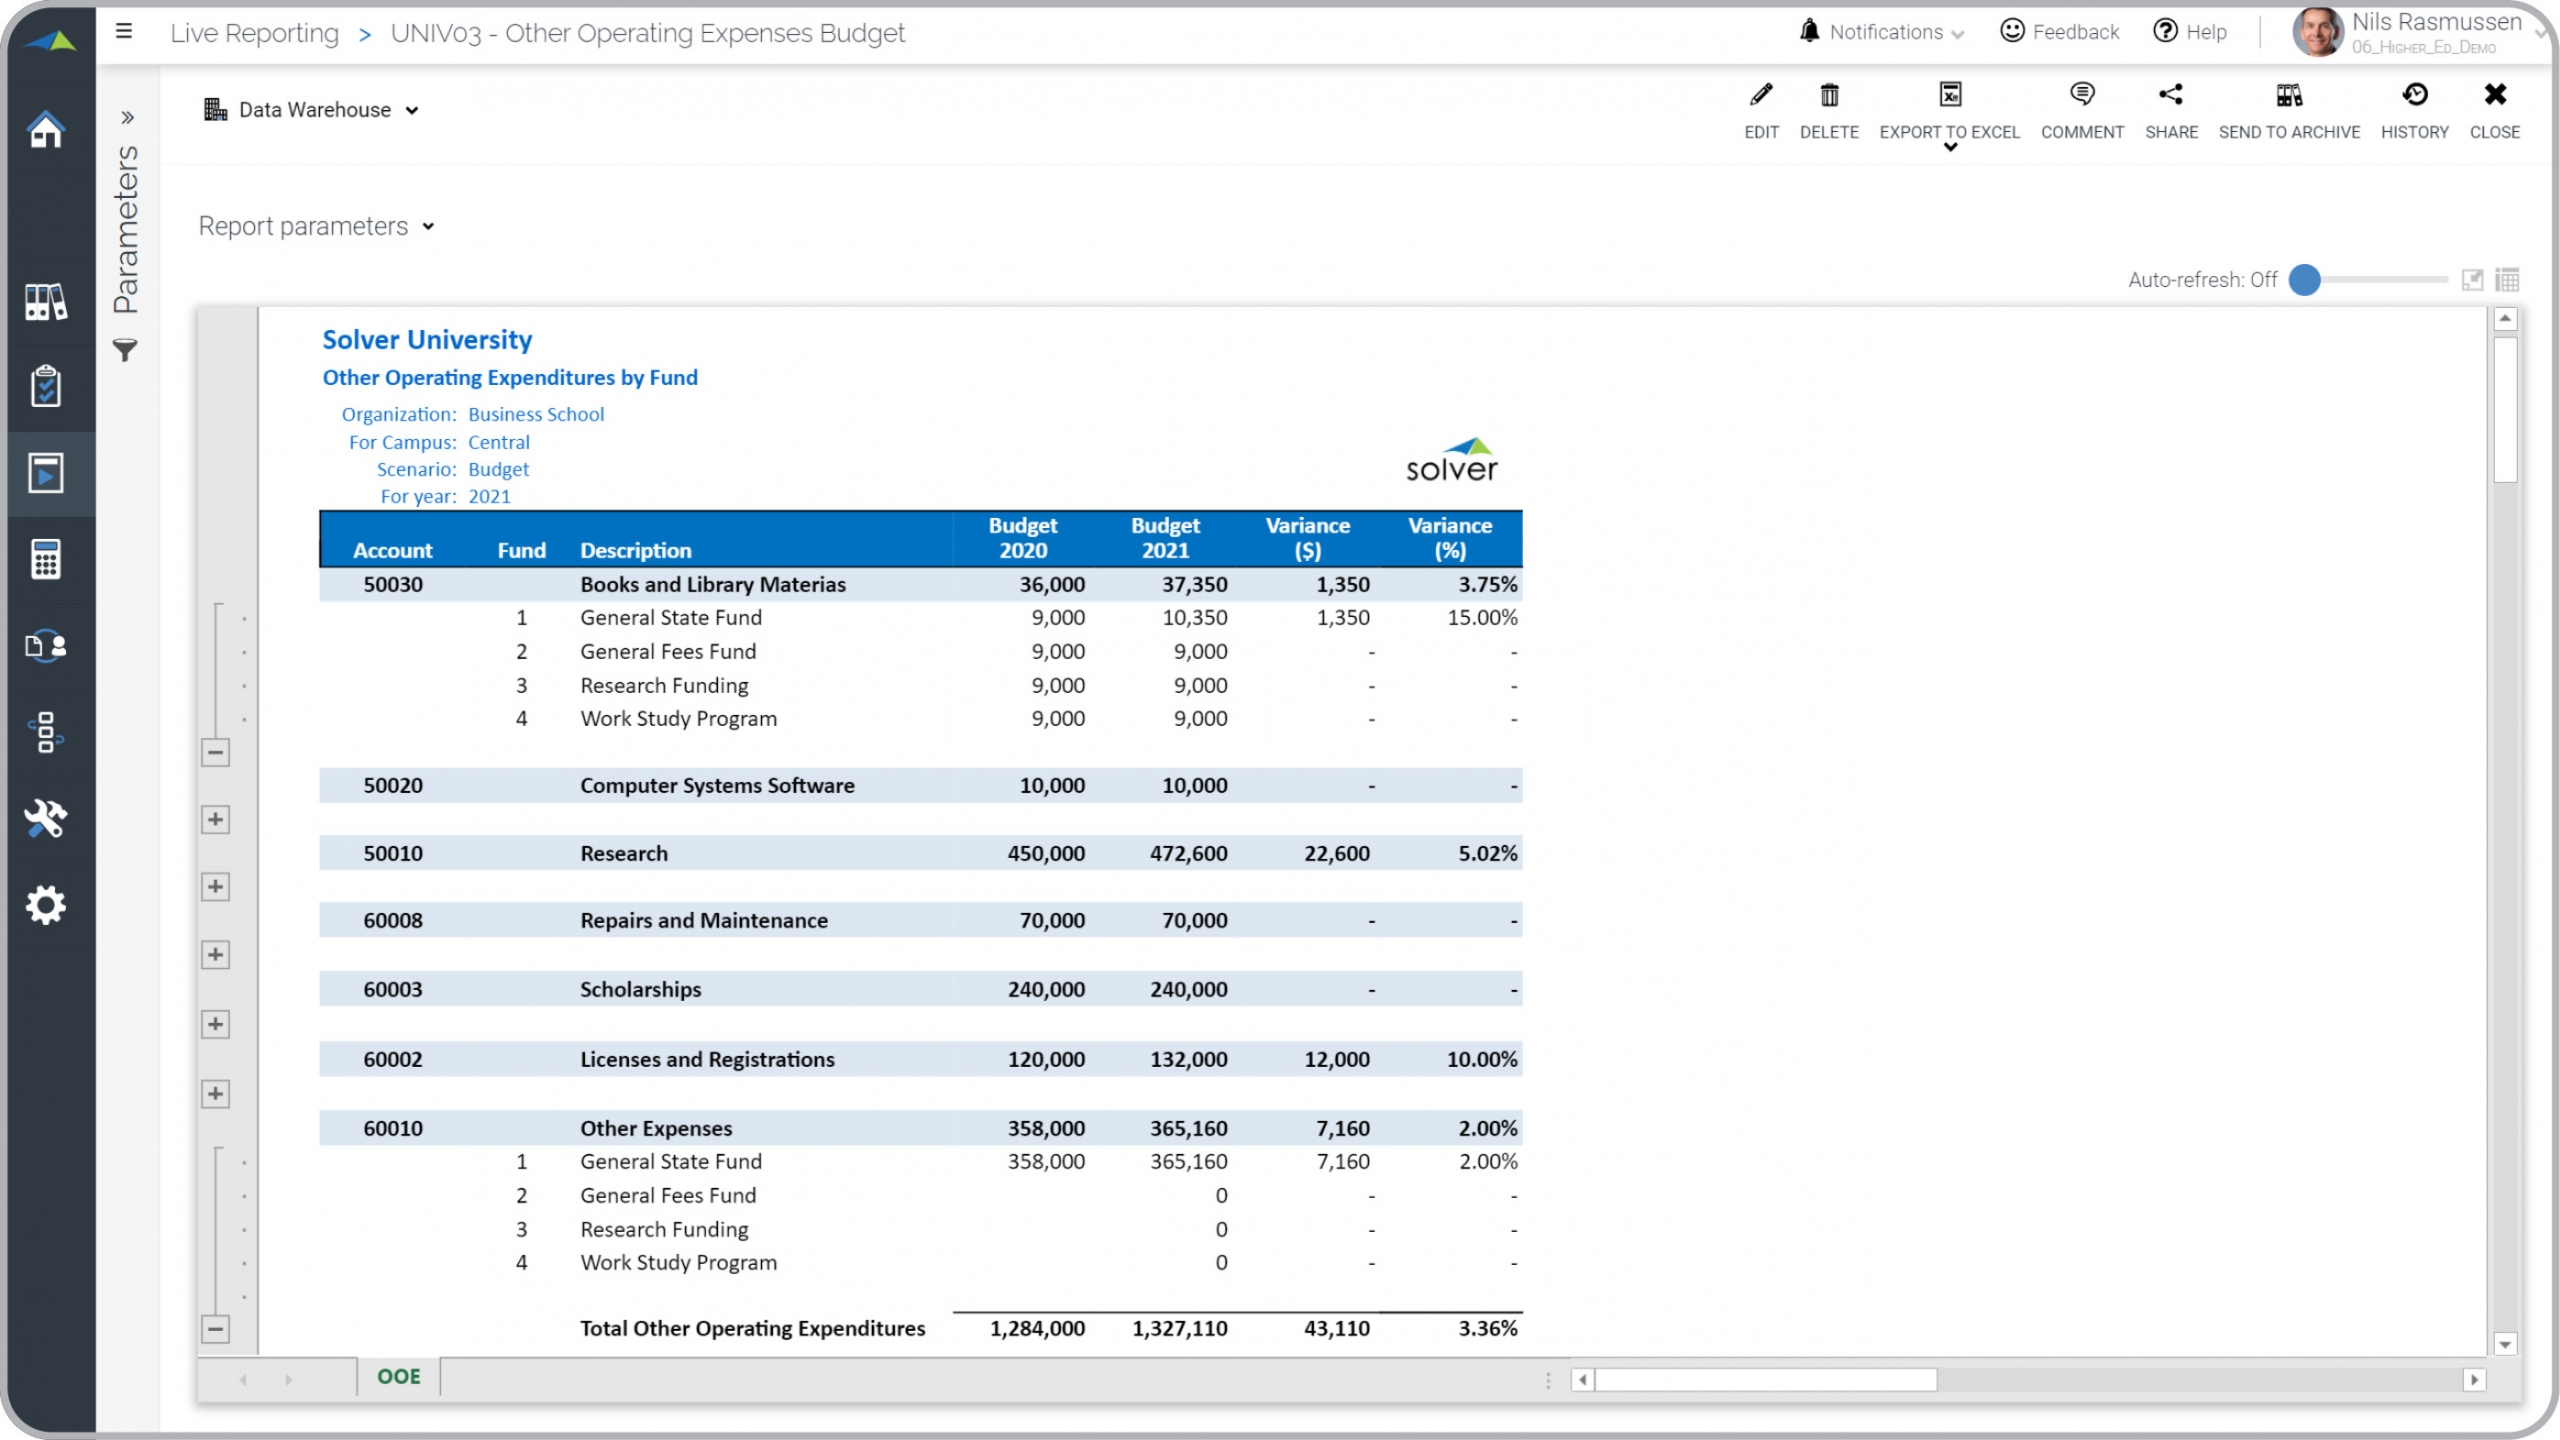
Health – Capital Expenditures Budget
Enter capital expenses by facility and department, with automated depreciation calculation.
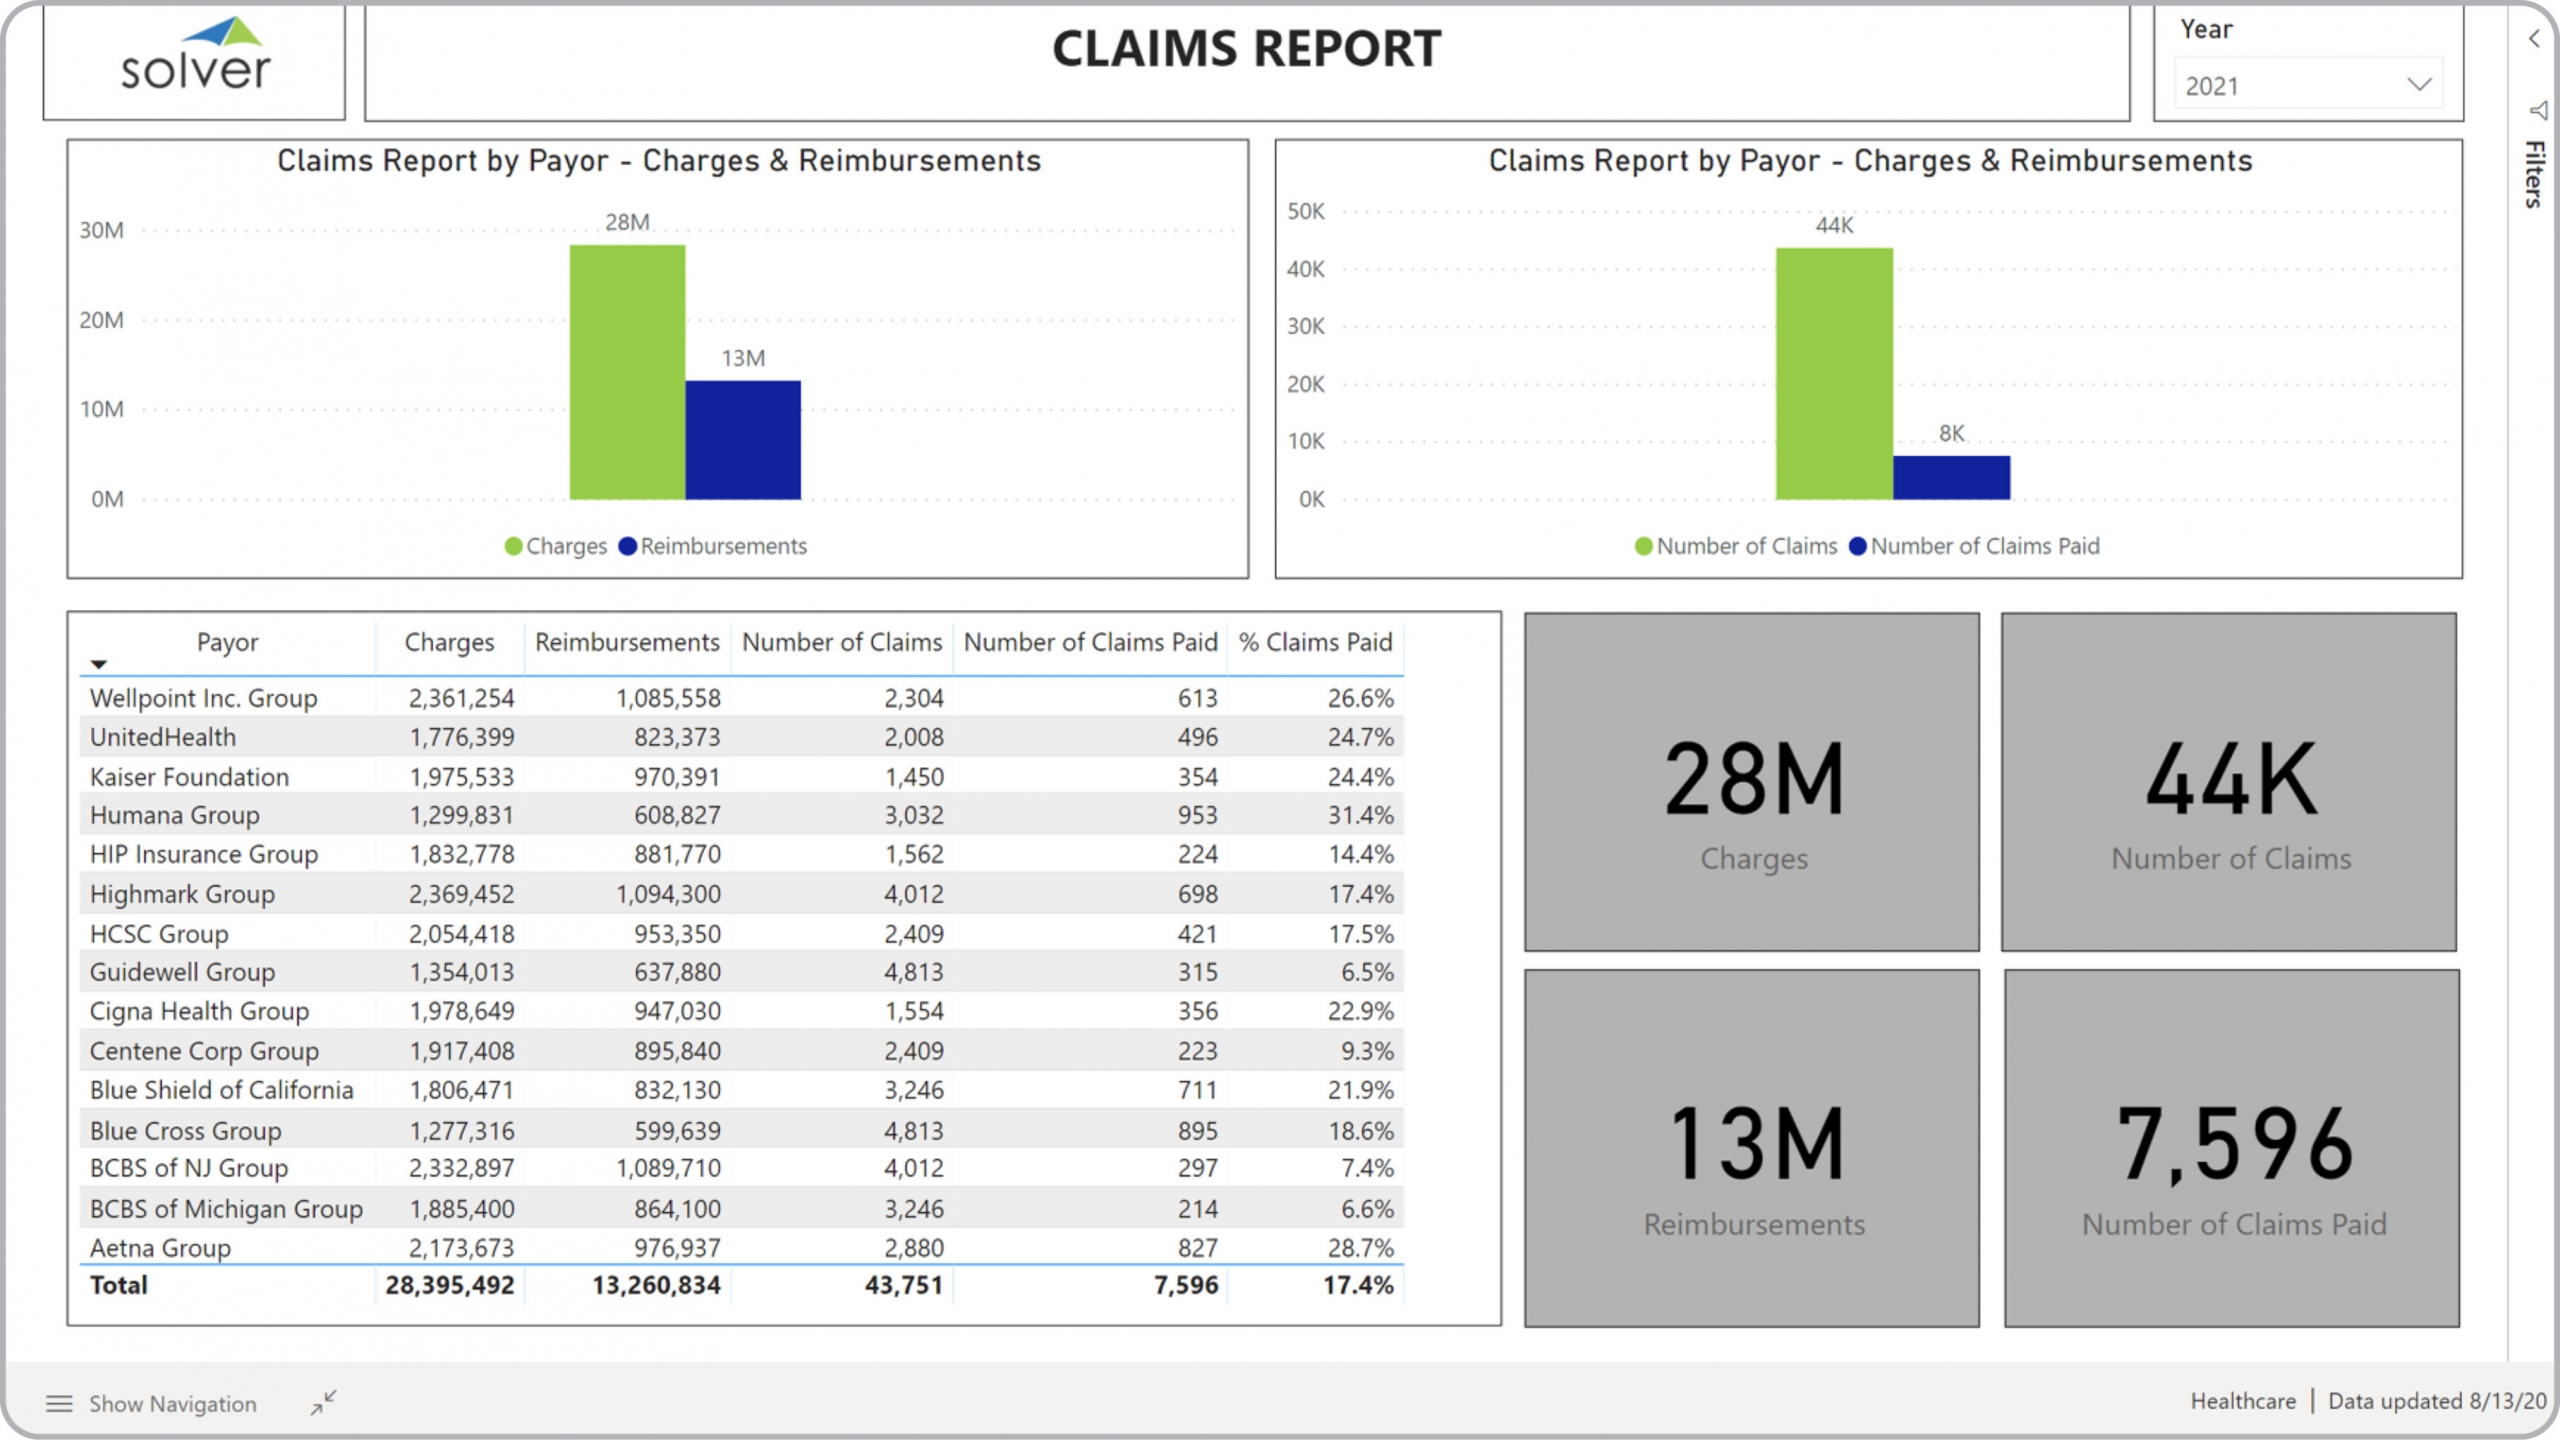
Health – Claims Analysis
Healthcare claims analysis with KPIs for charges, # of claims and paid claims, and payor metrics.
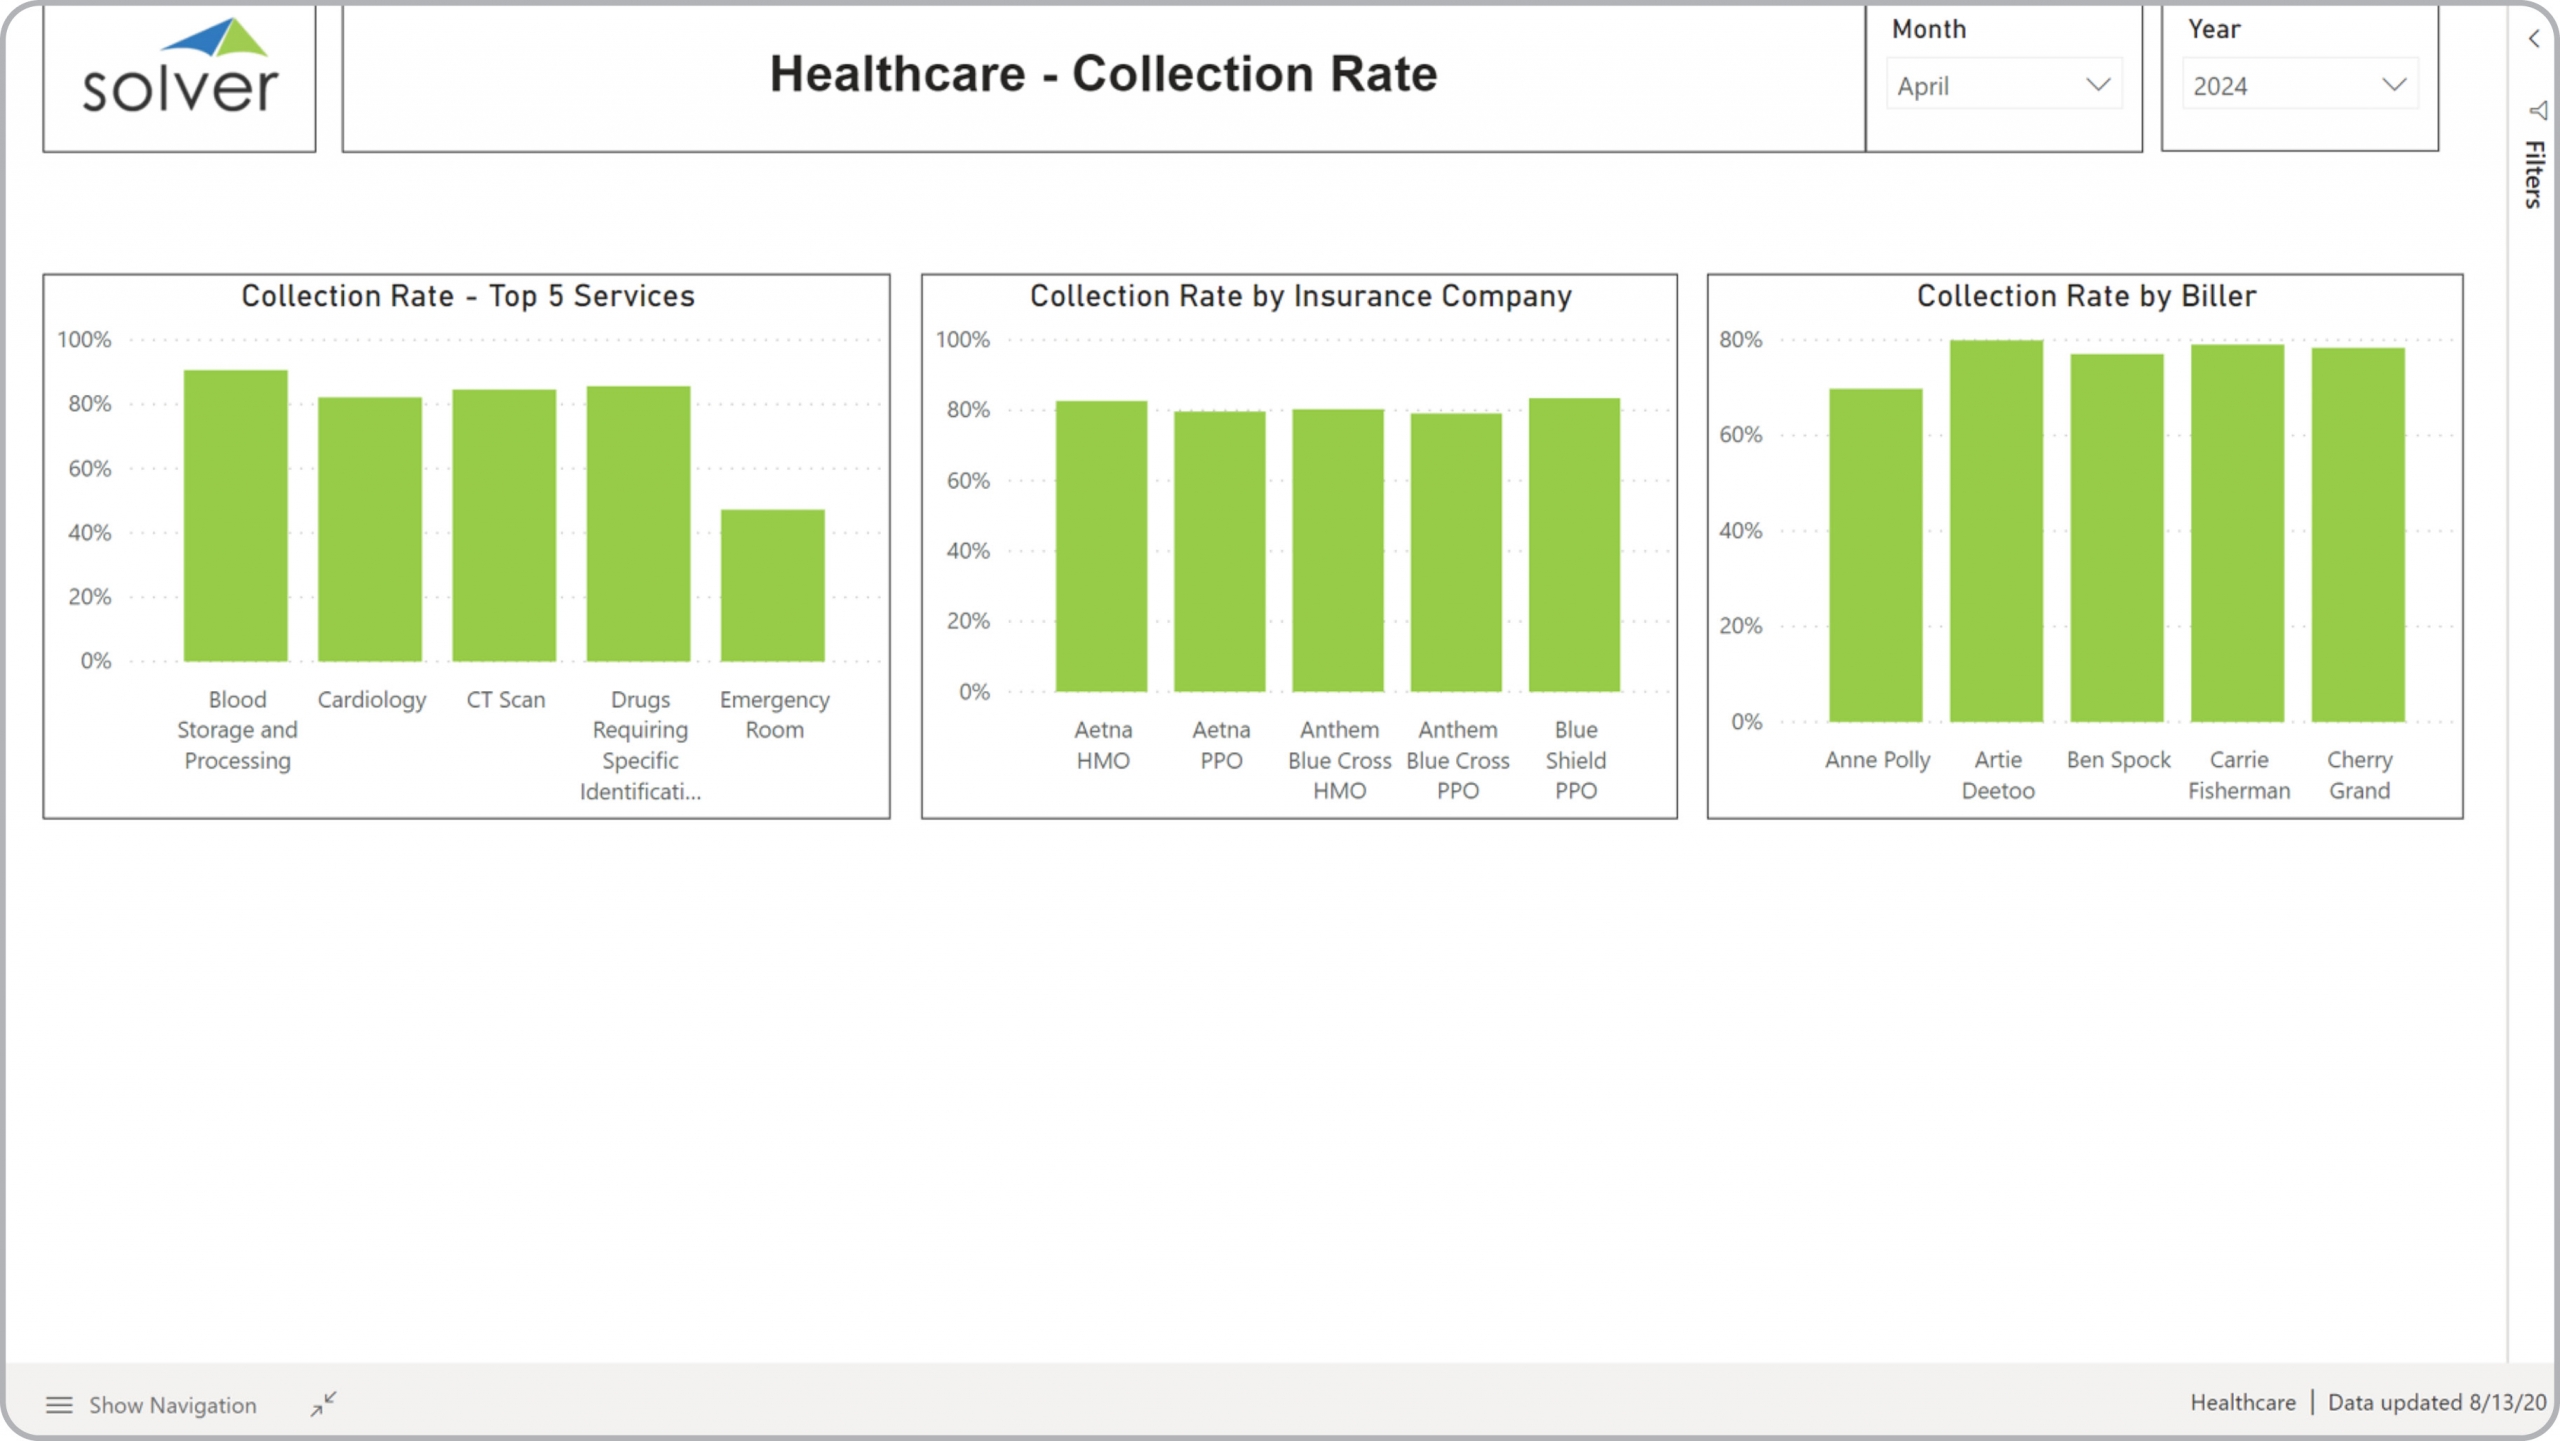
Health – Collection Rate Analysis
Healthcare collection rate by services, payor (insurance company), and biller.
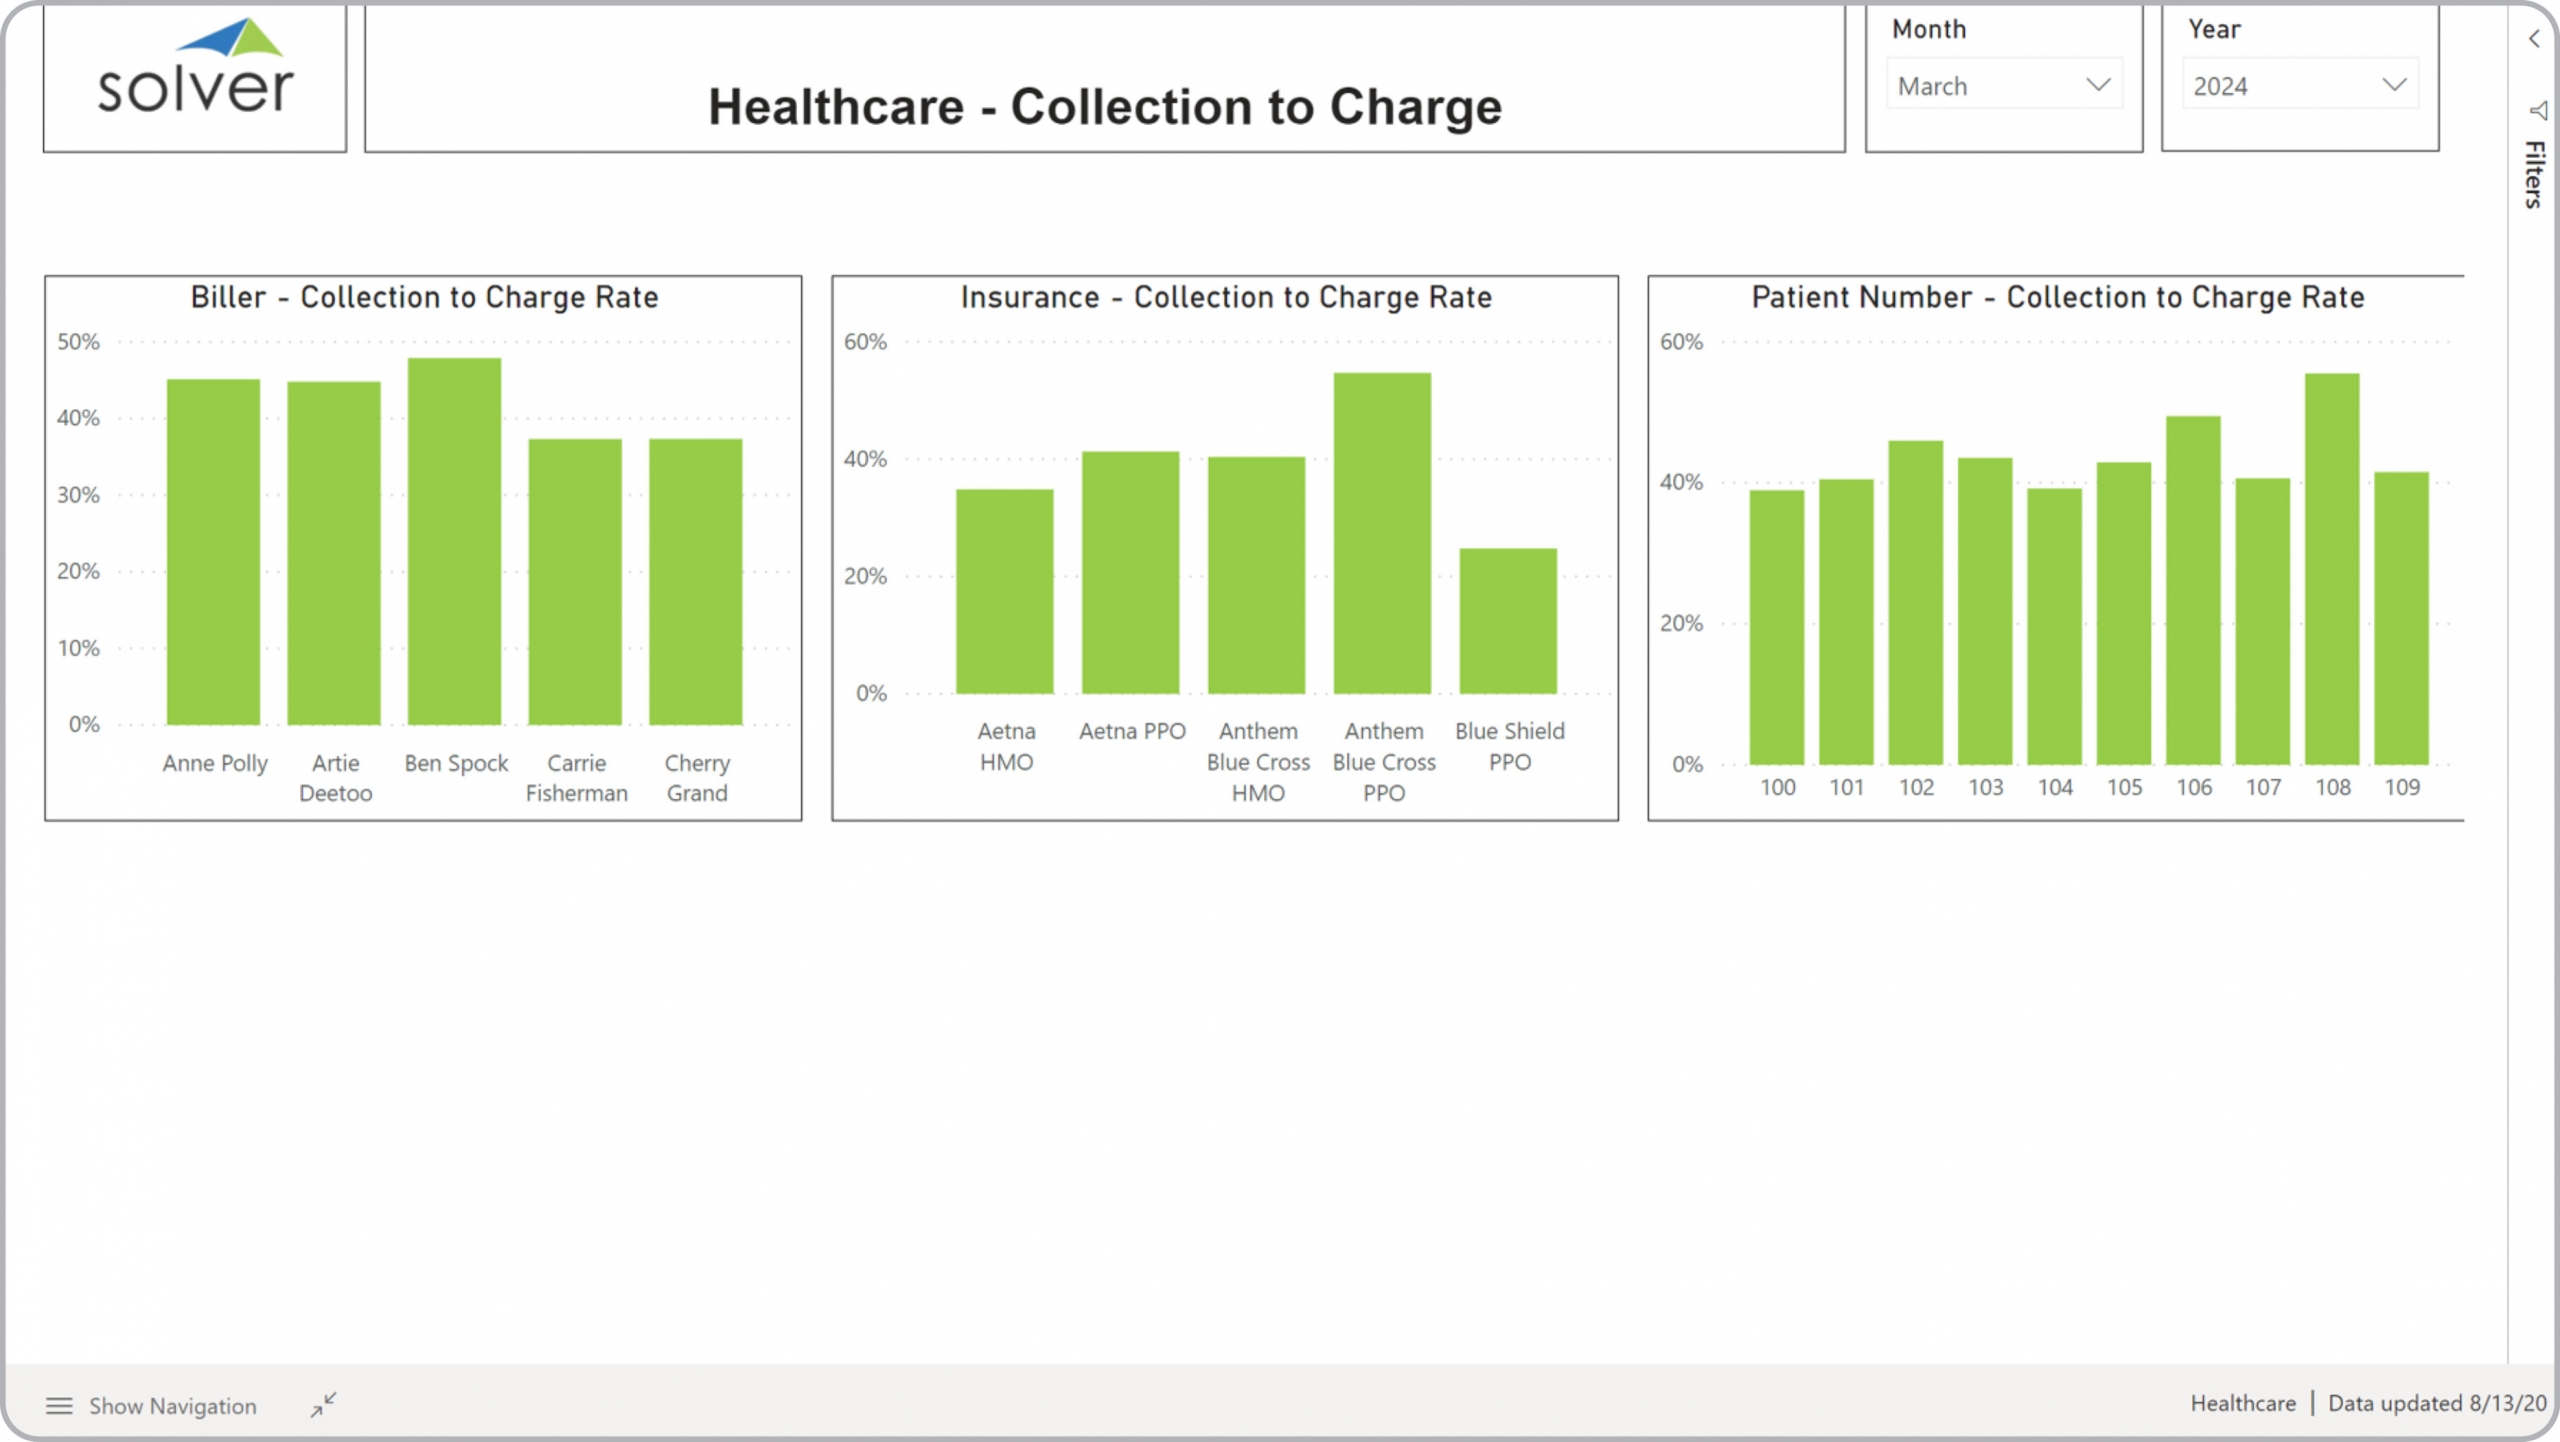
Health – Collection to Charge Analysis
Collection to charge rate for a healthcare clinic, by biller, payor (insurance), patient.
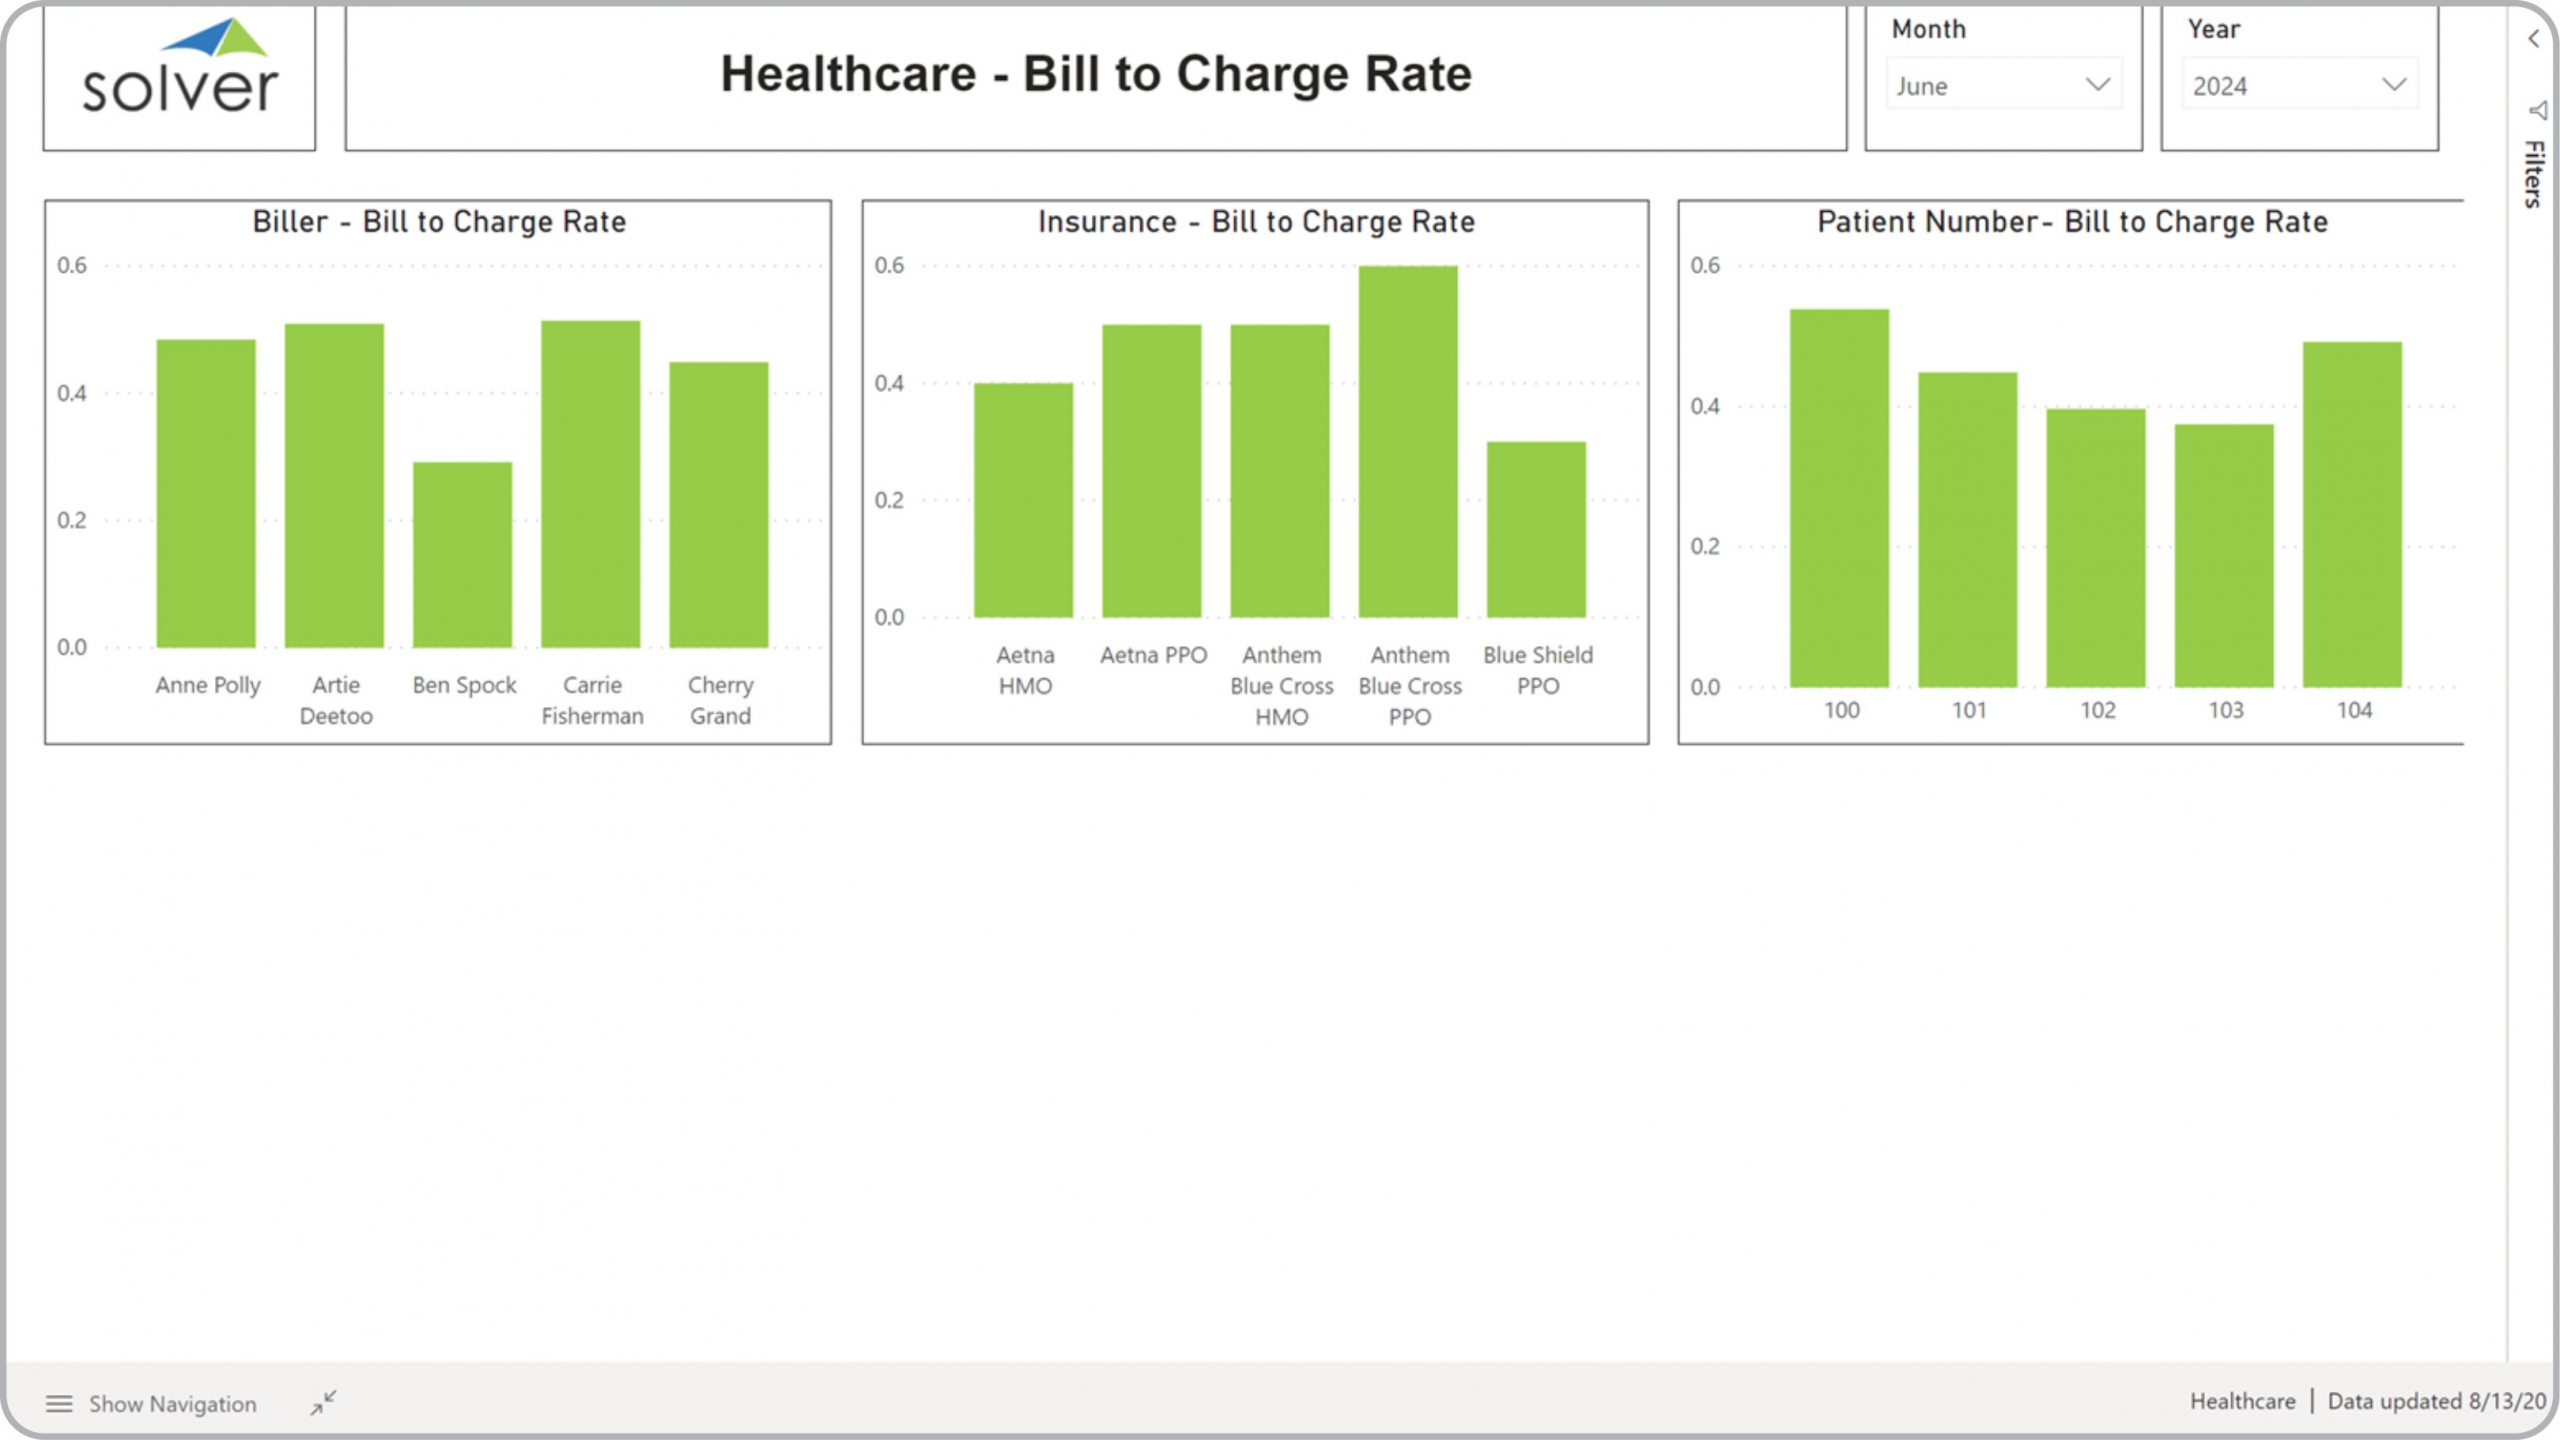
Health – Bill to Charge Rate Analysis
Bill to Charge Rate for a healthcare clinic. Analysis by biller, payor (insurance), and patient.
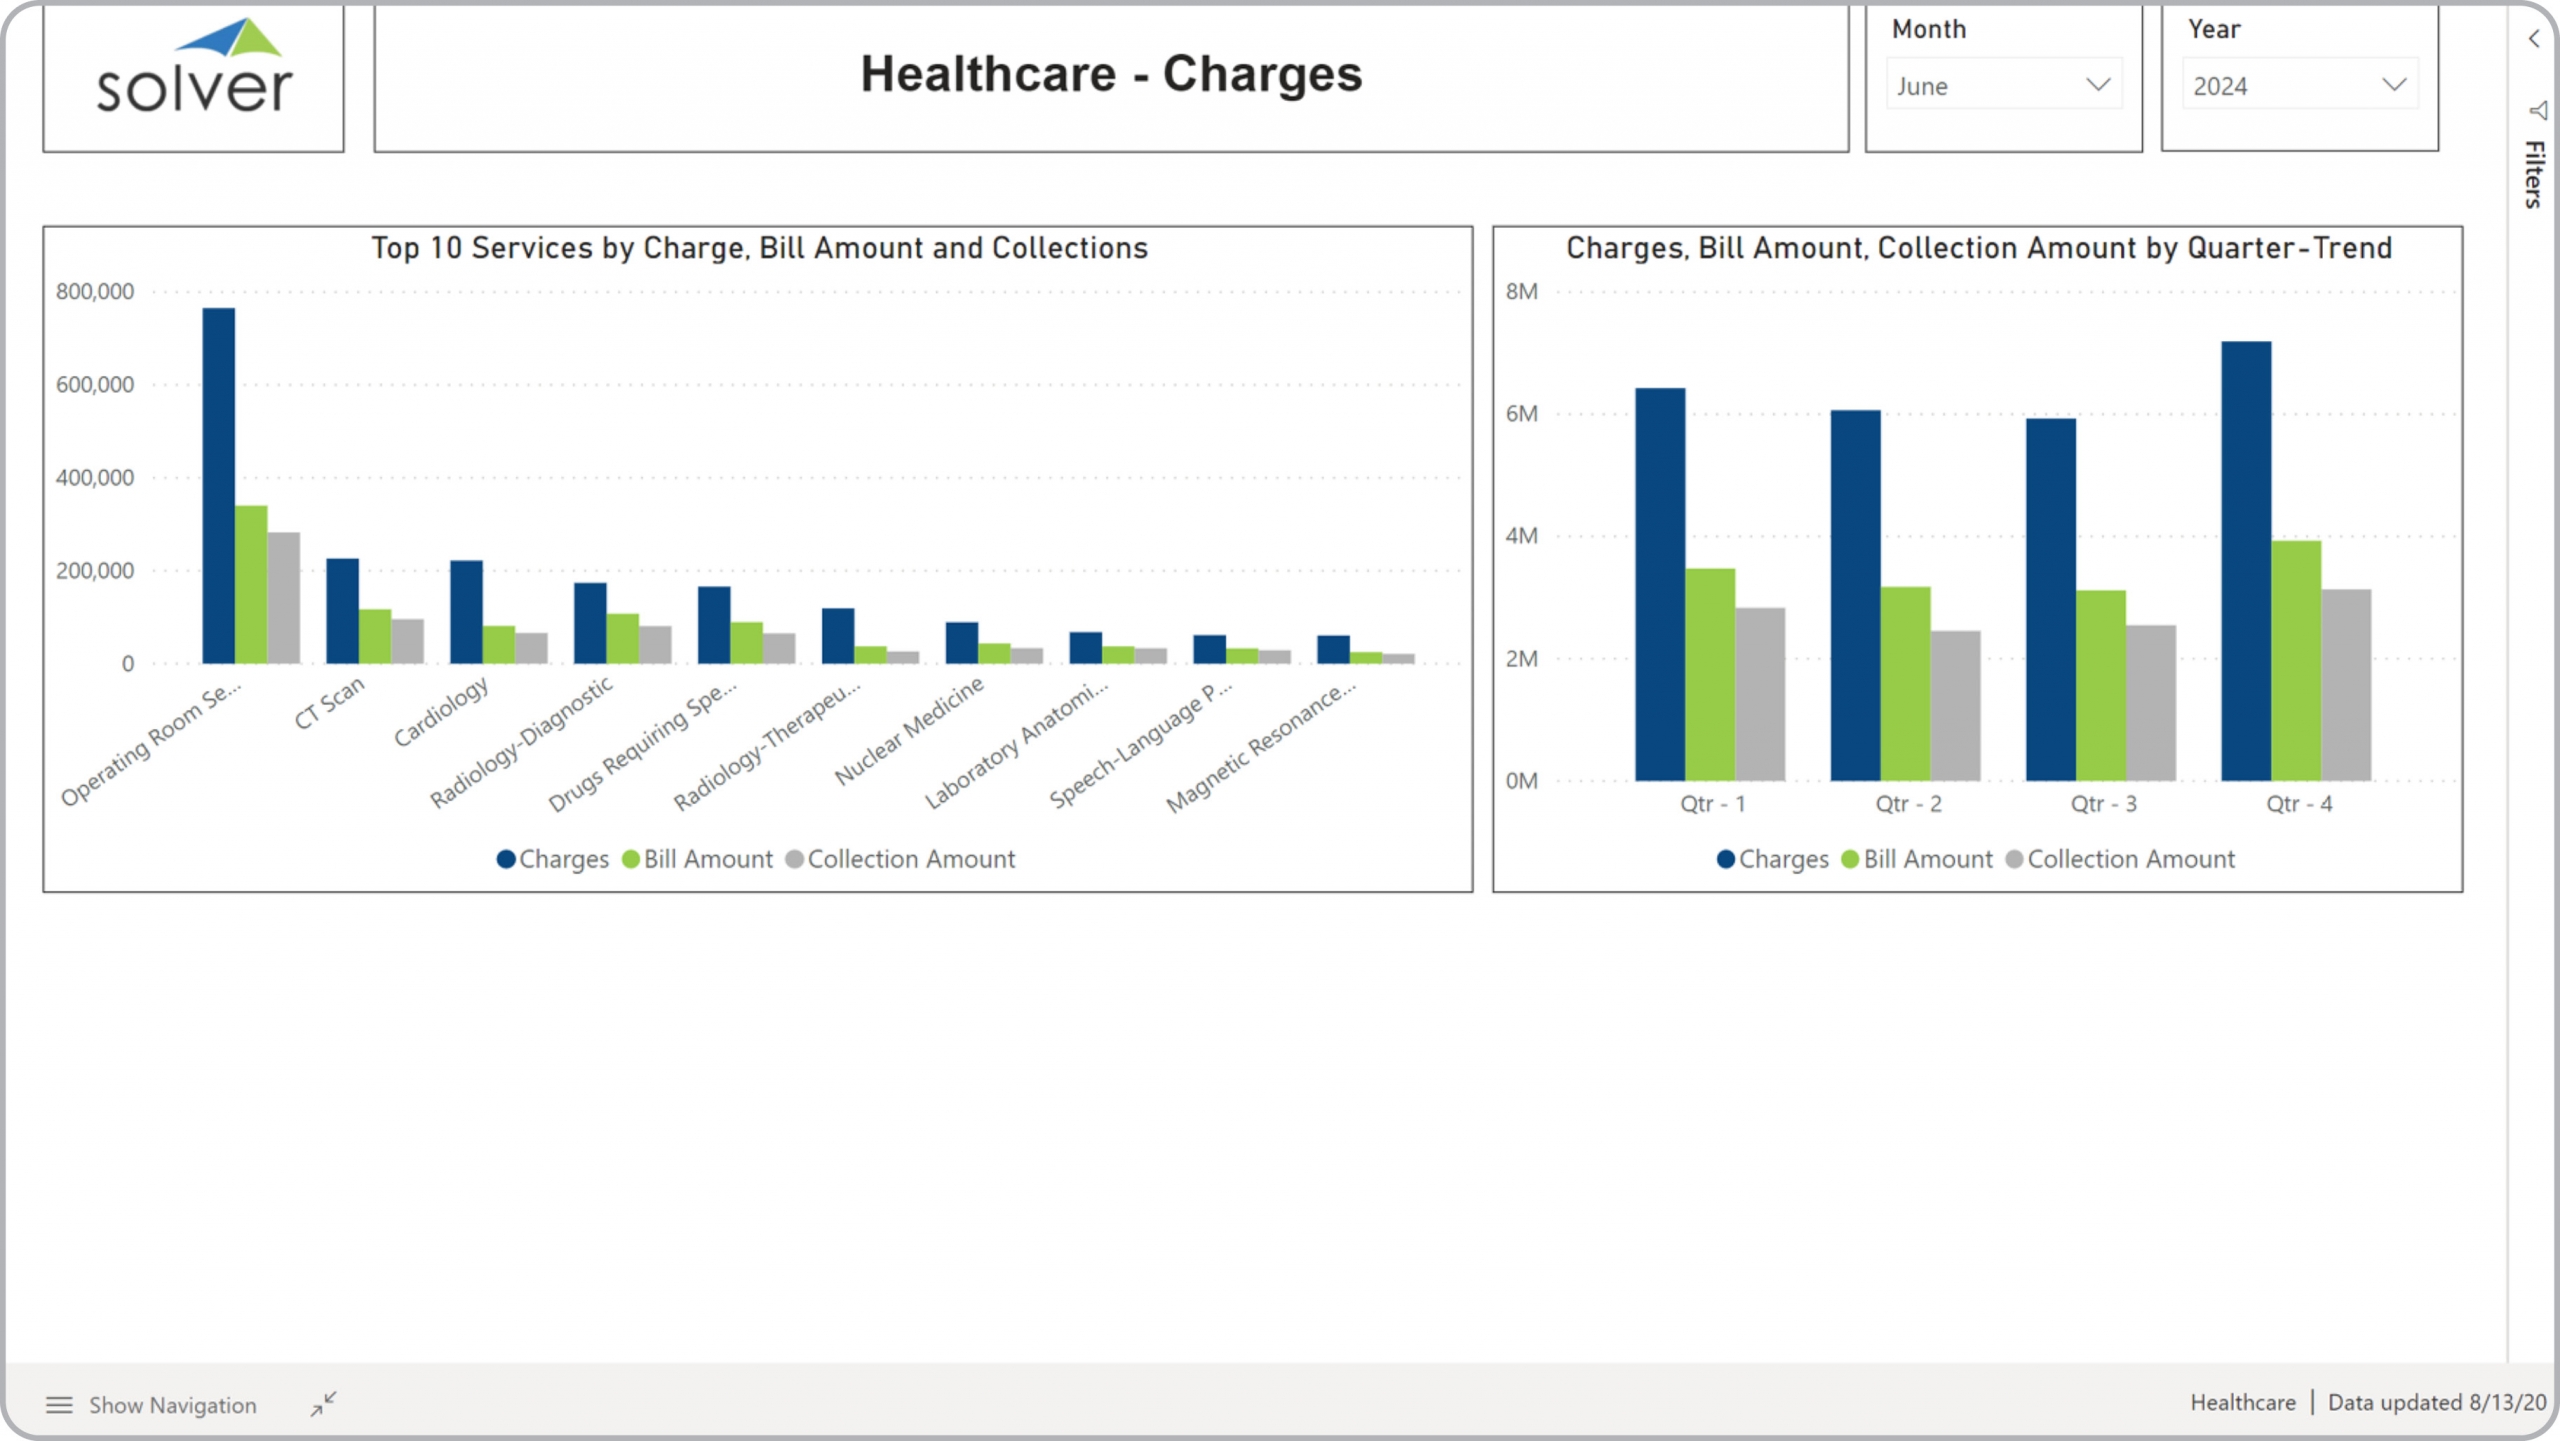
Health – Charges Dashboard
Healthcare services by charge, bill amount and collections. Quarterly trend.
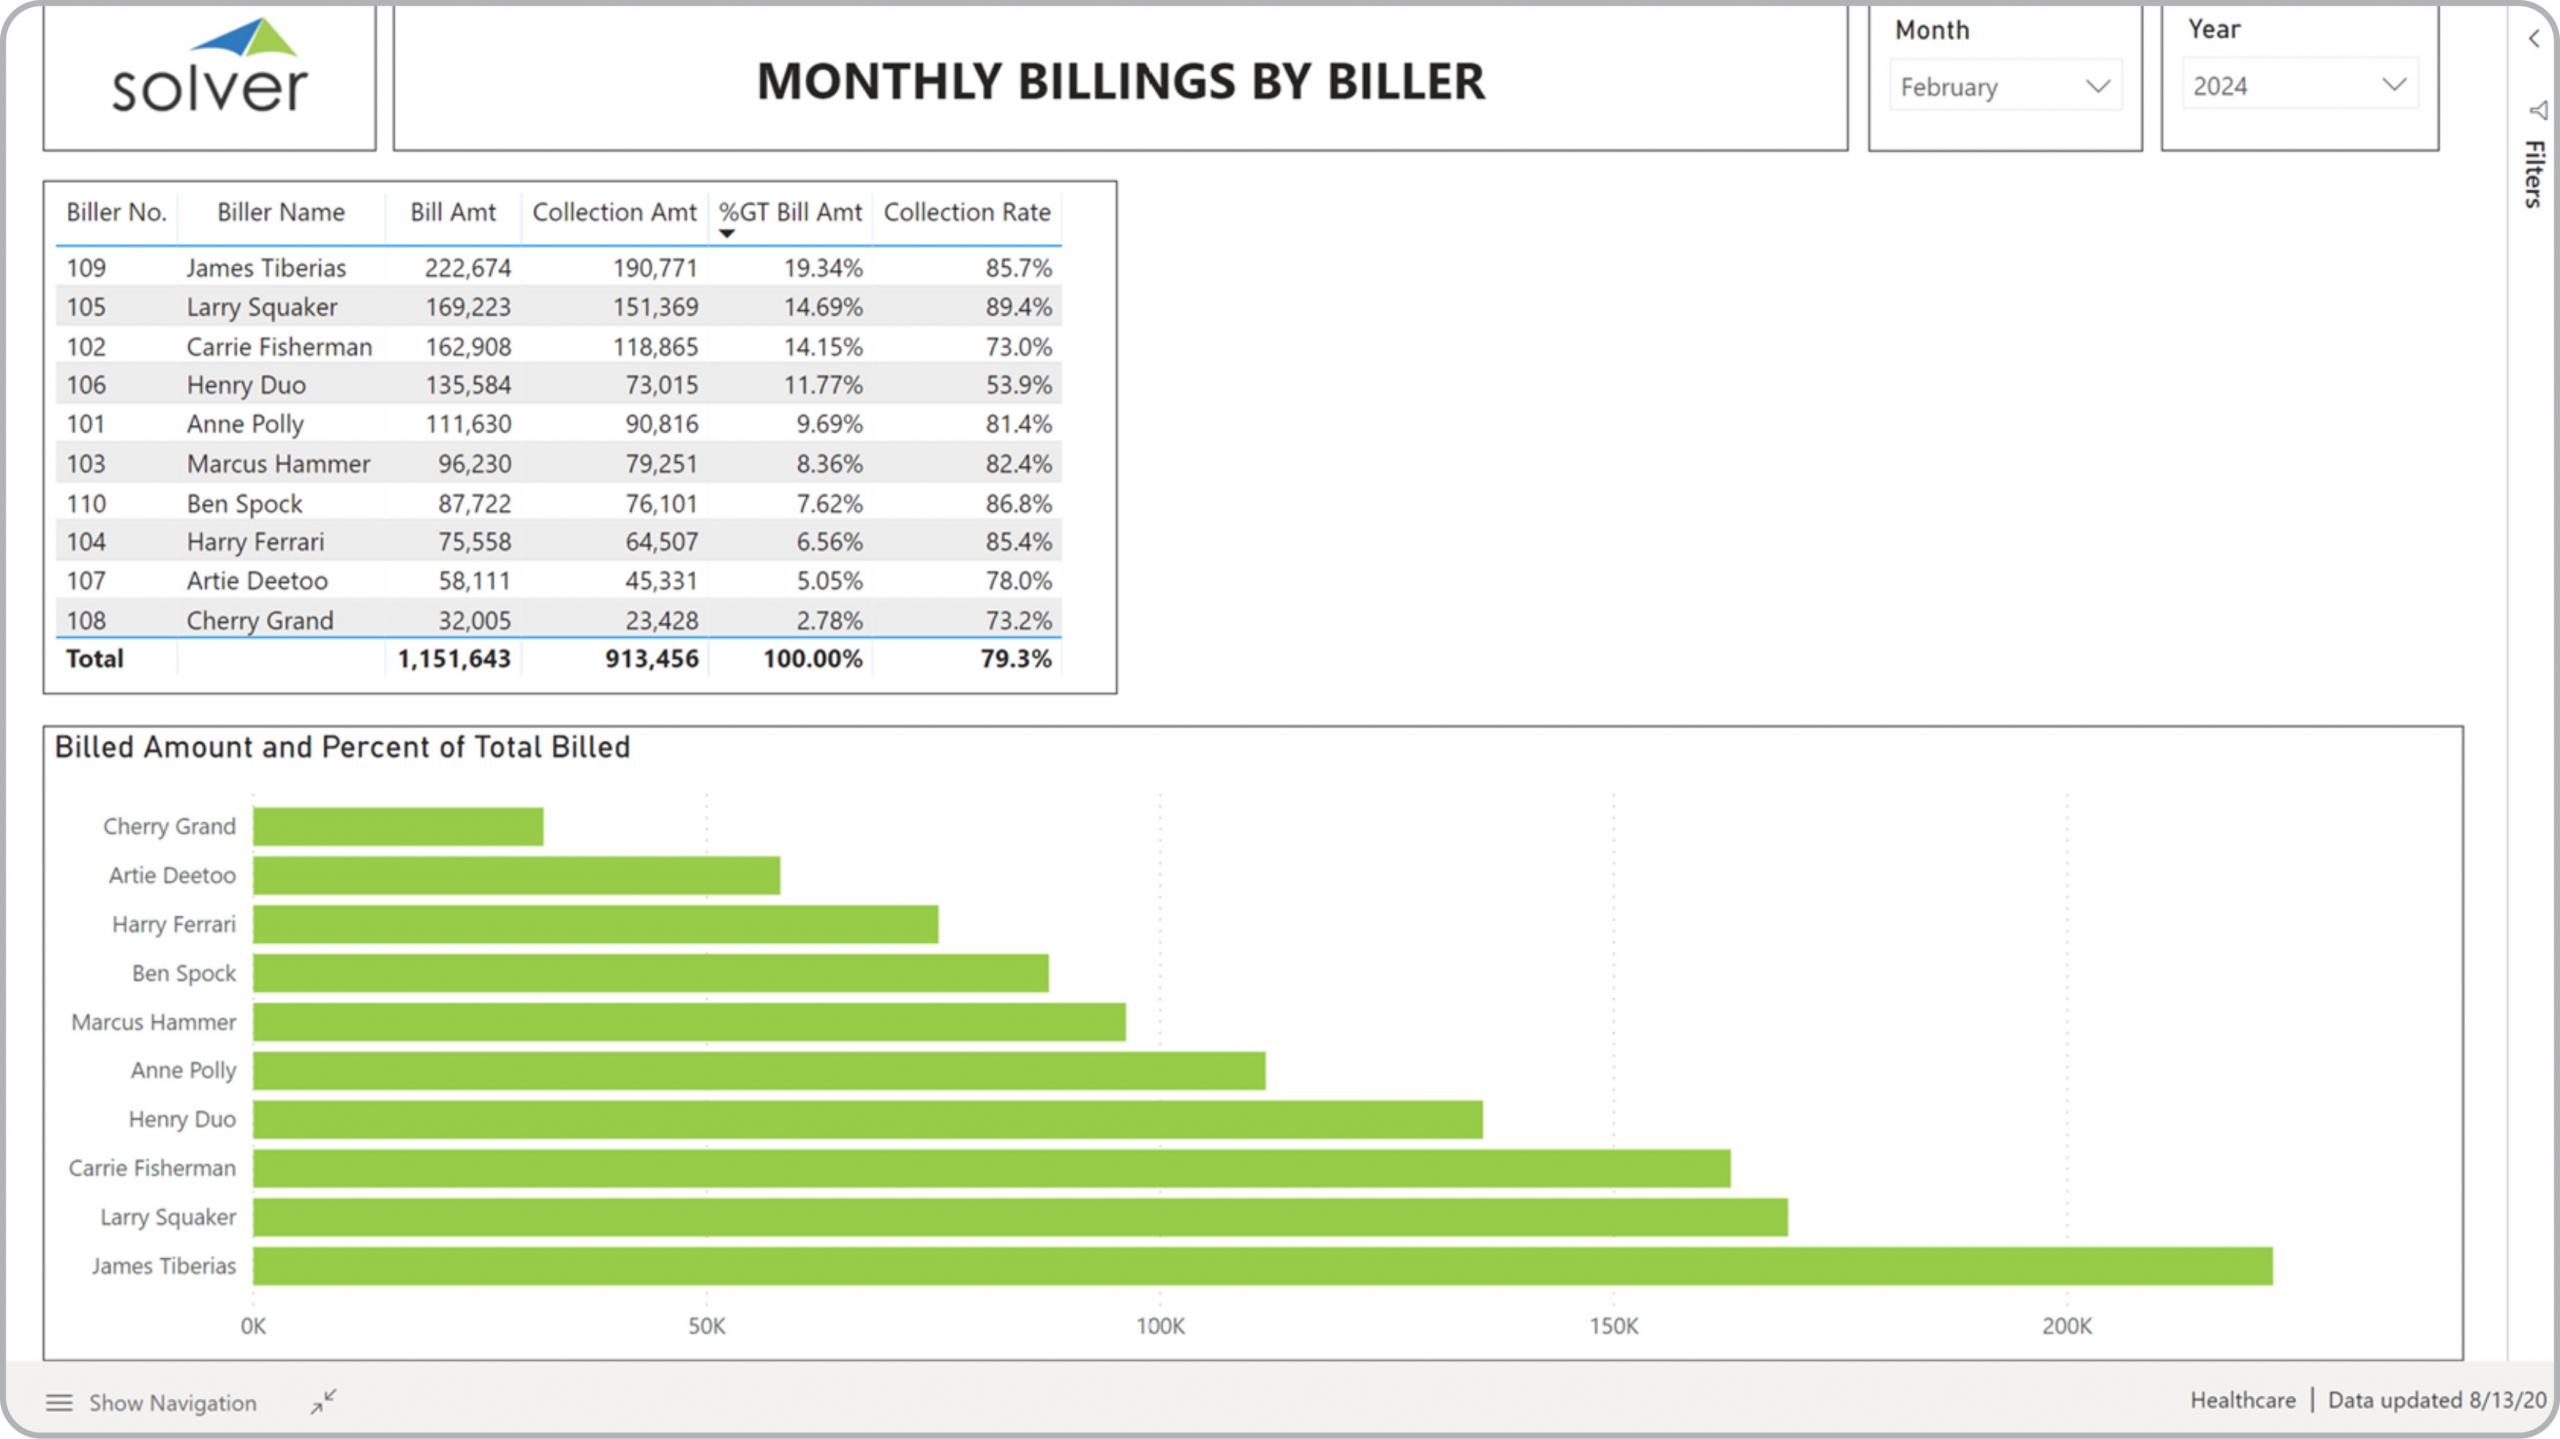
Health – Monthly Billings by Biller
Healthcare dashboard with billed amount, collection rate, etc. by physician.
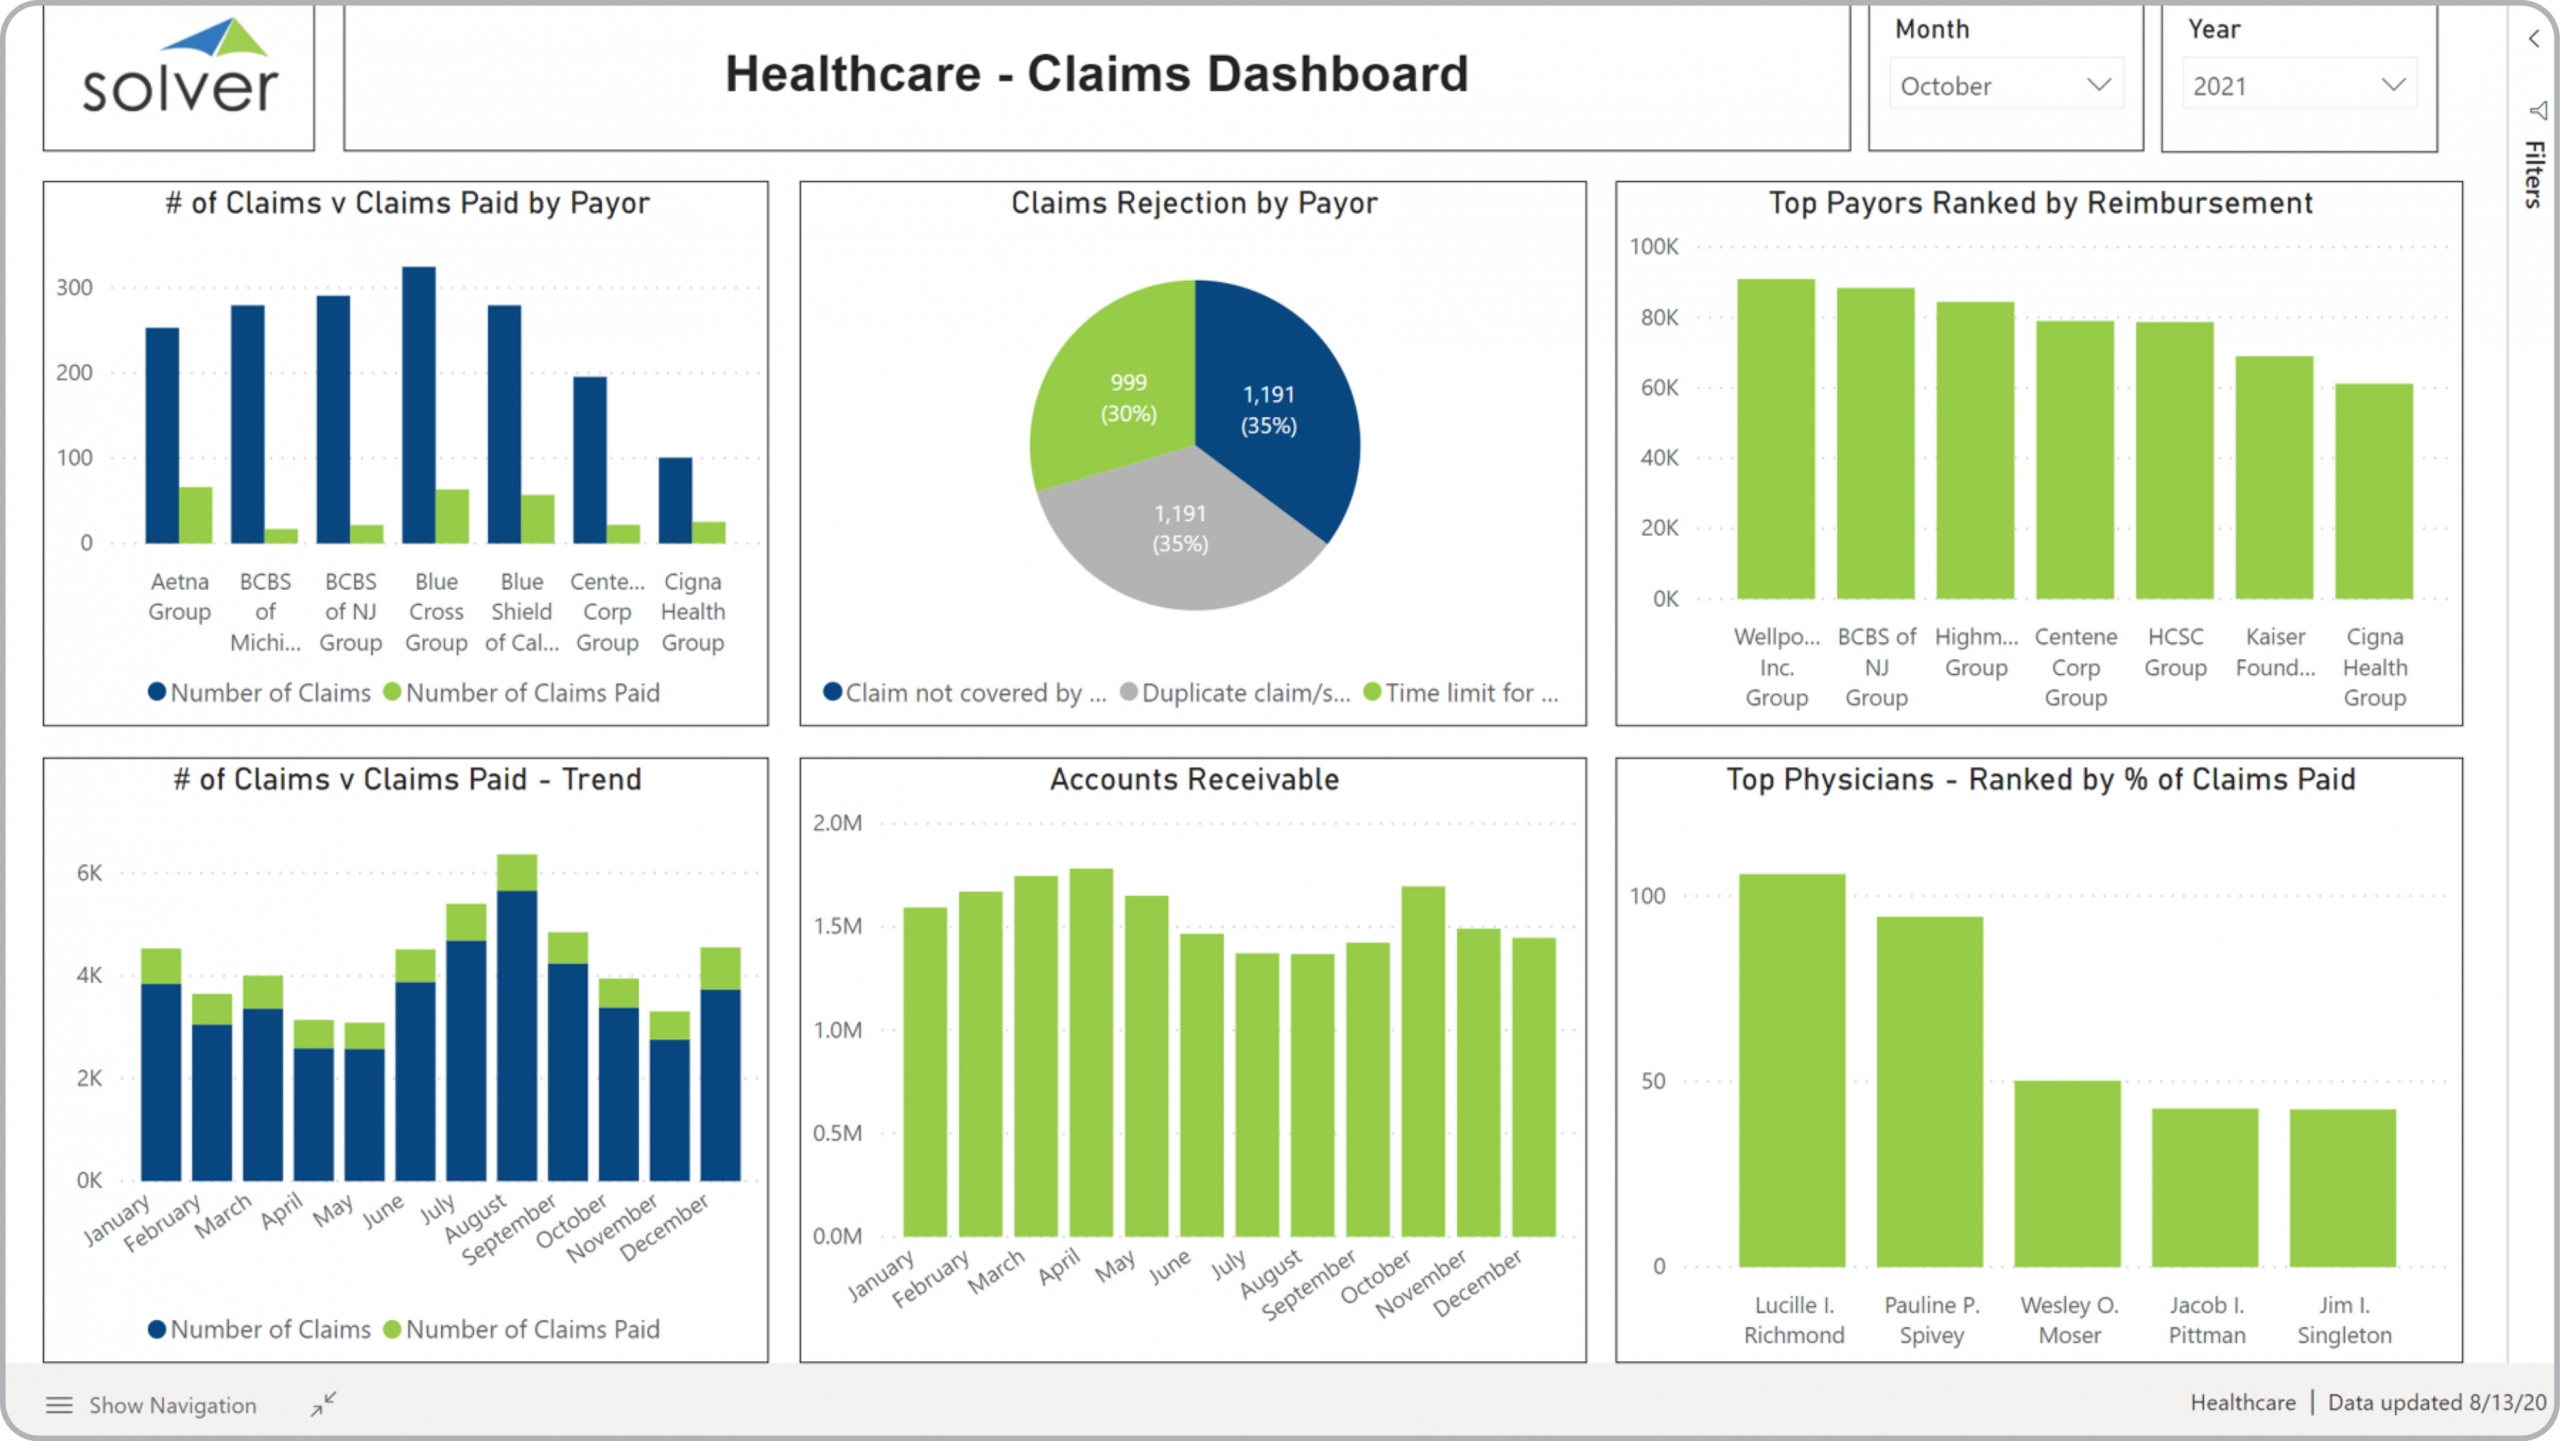
Health – Claims Dashboard
Analysis of healthcare claims vs claims paid, top payers, claims rejection, receivables.
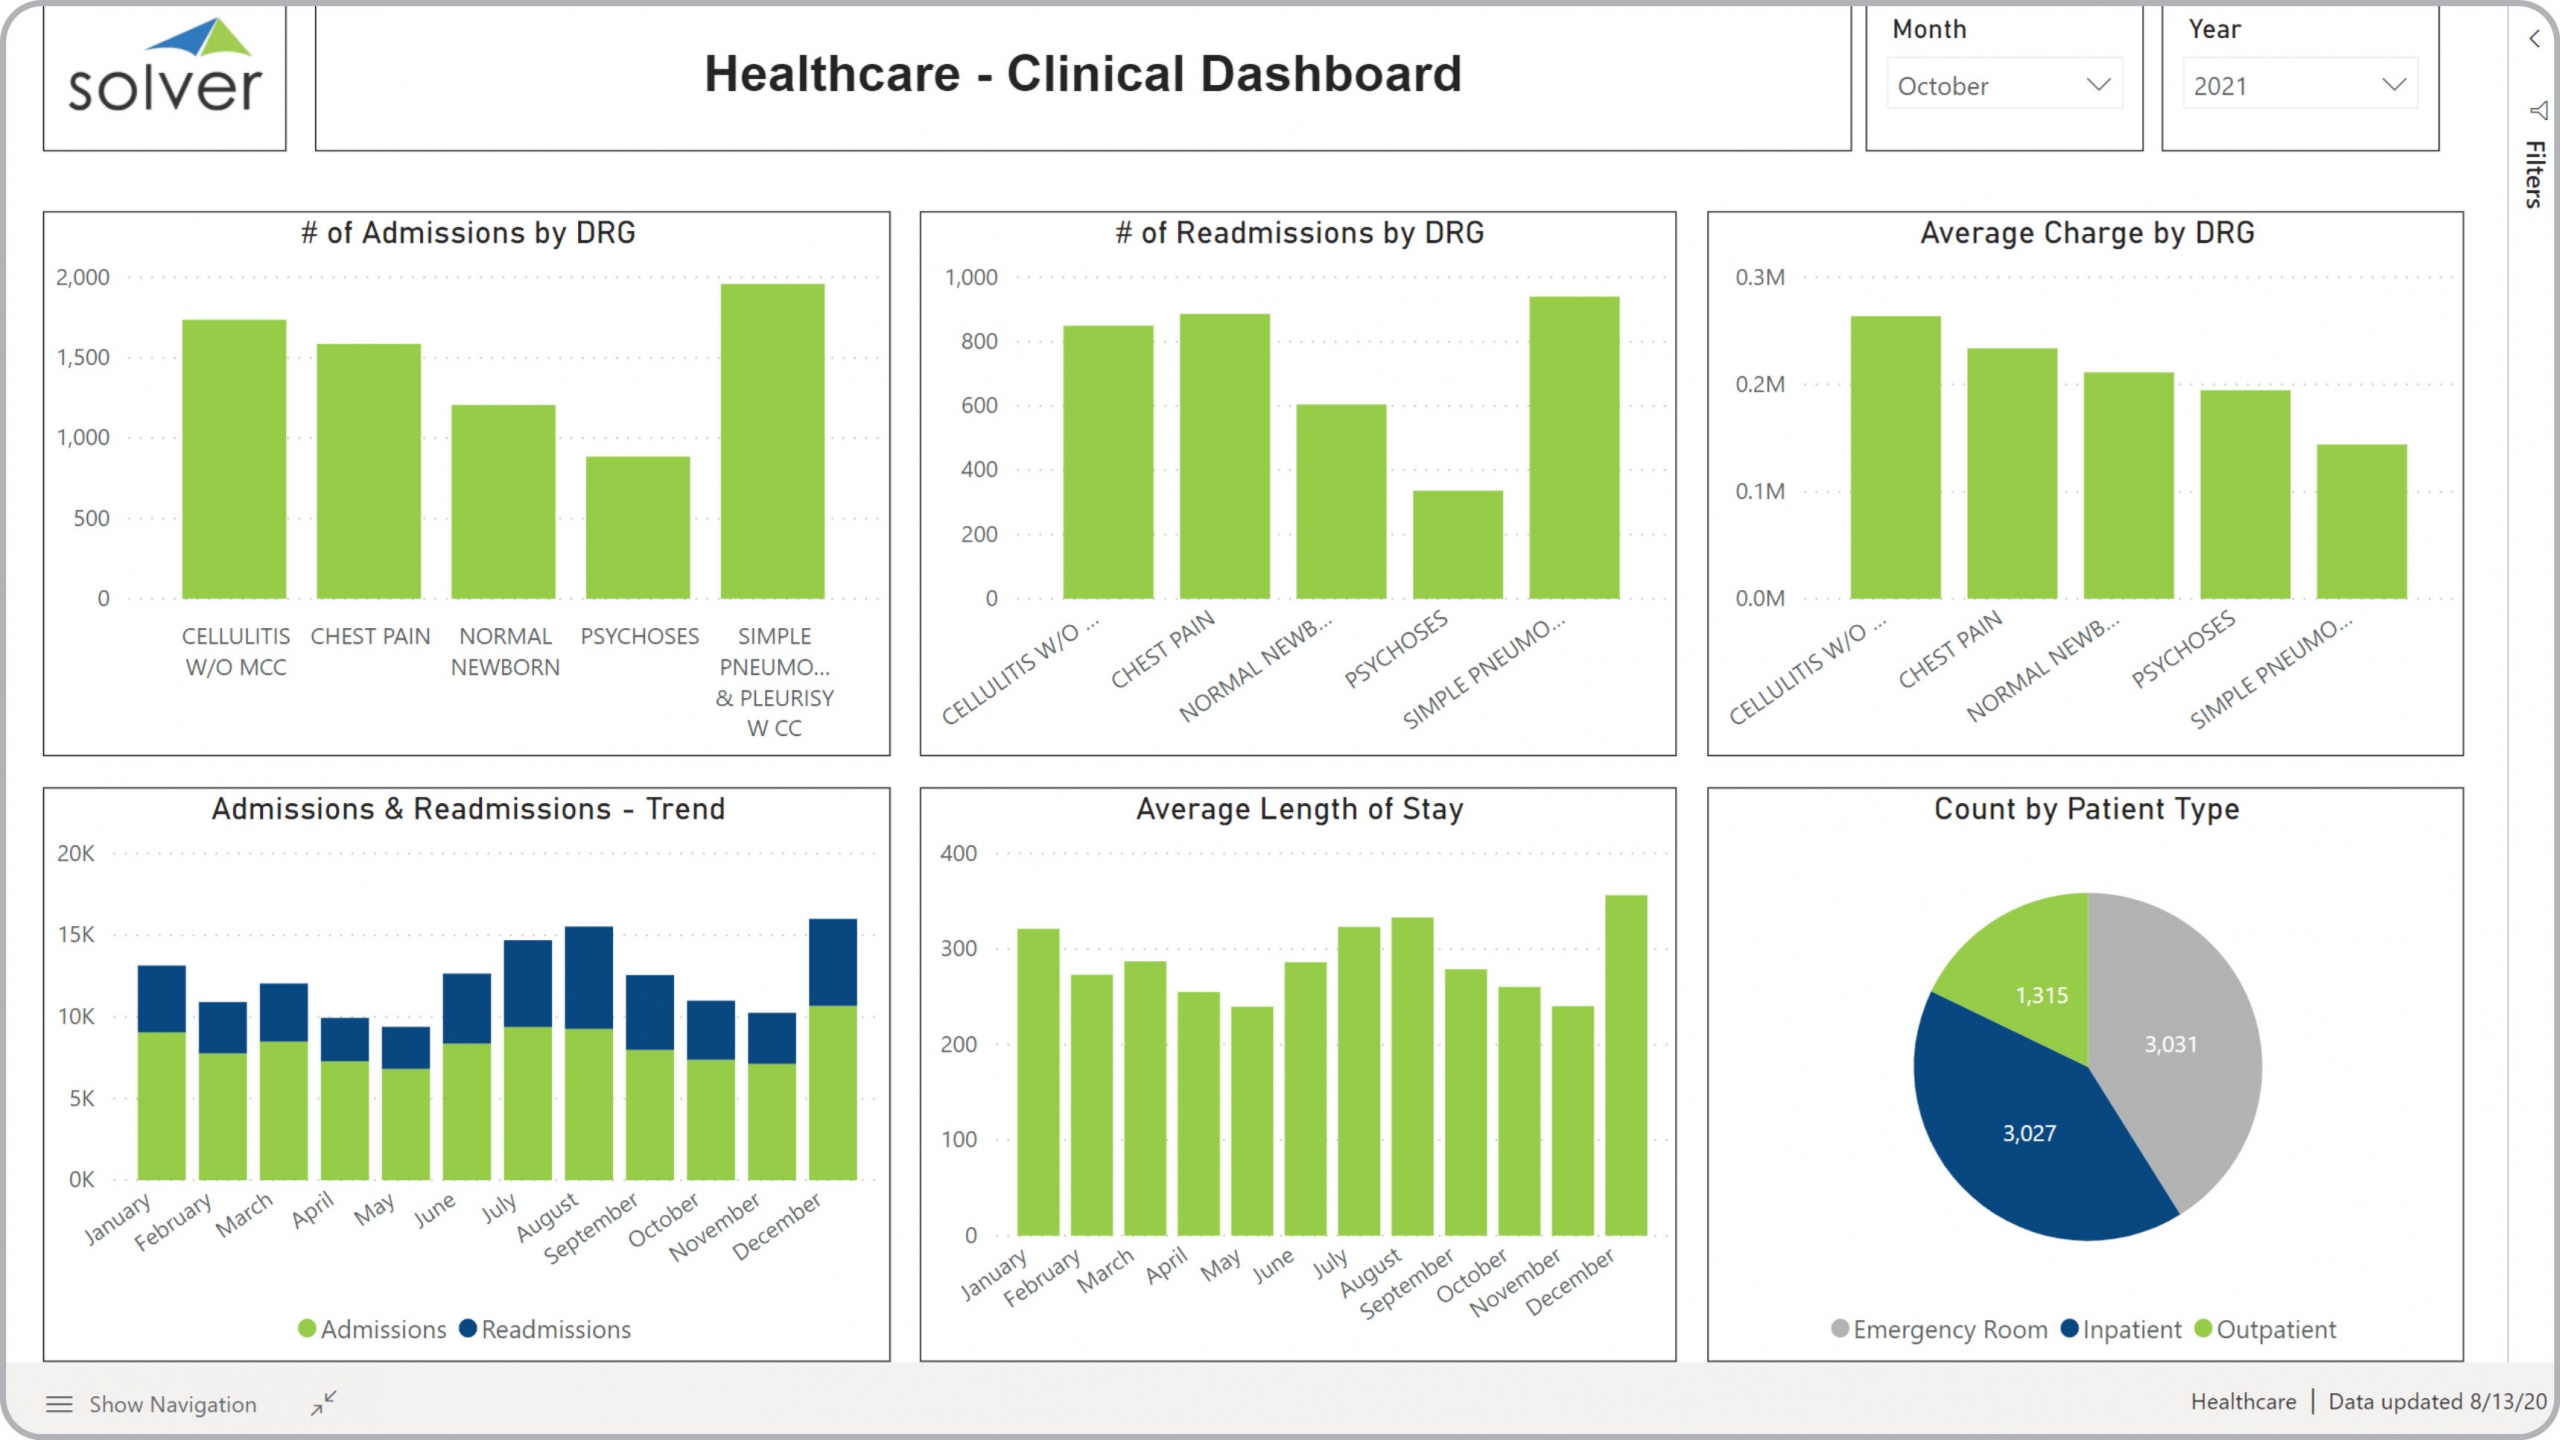
Health – Clinical Dashboard
Clinical healthcare metrics, including admissions by DRG, patient count, average charge, etc.
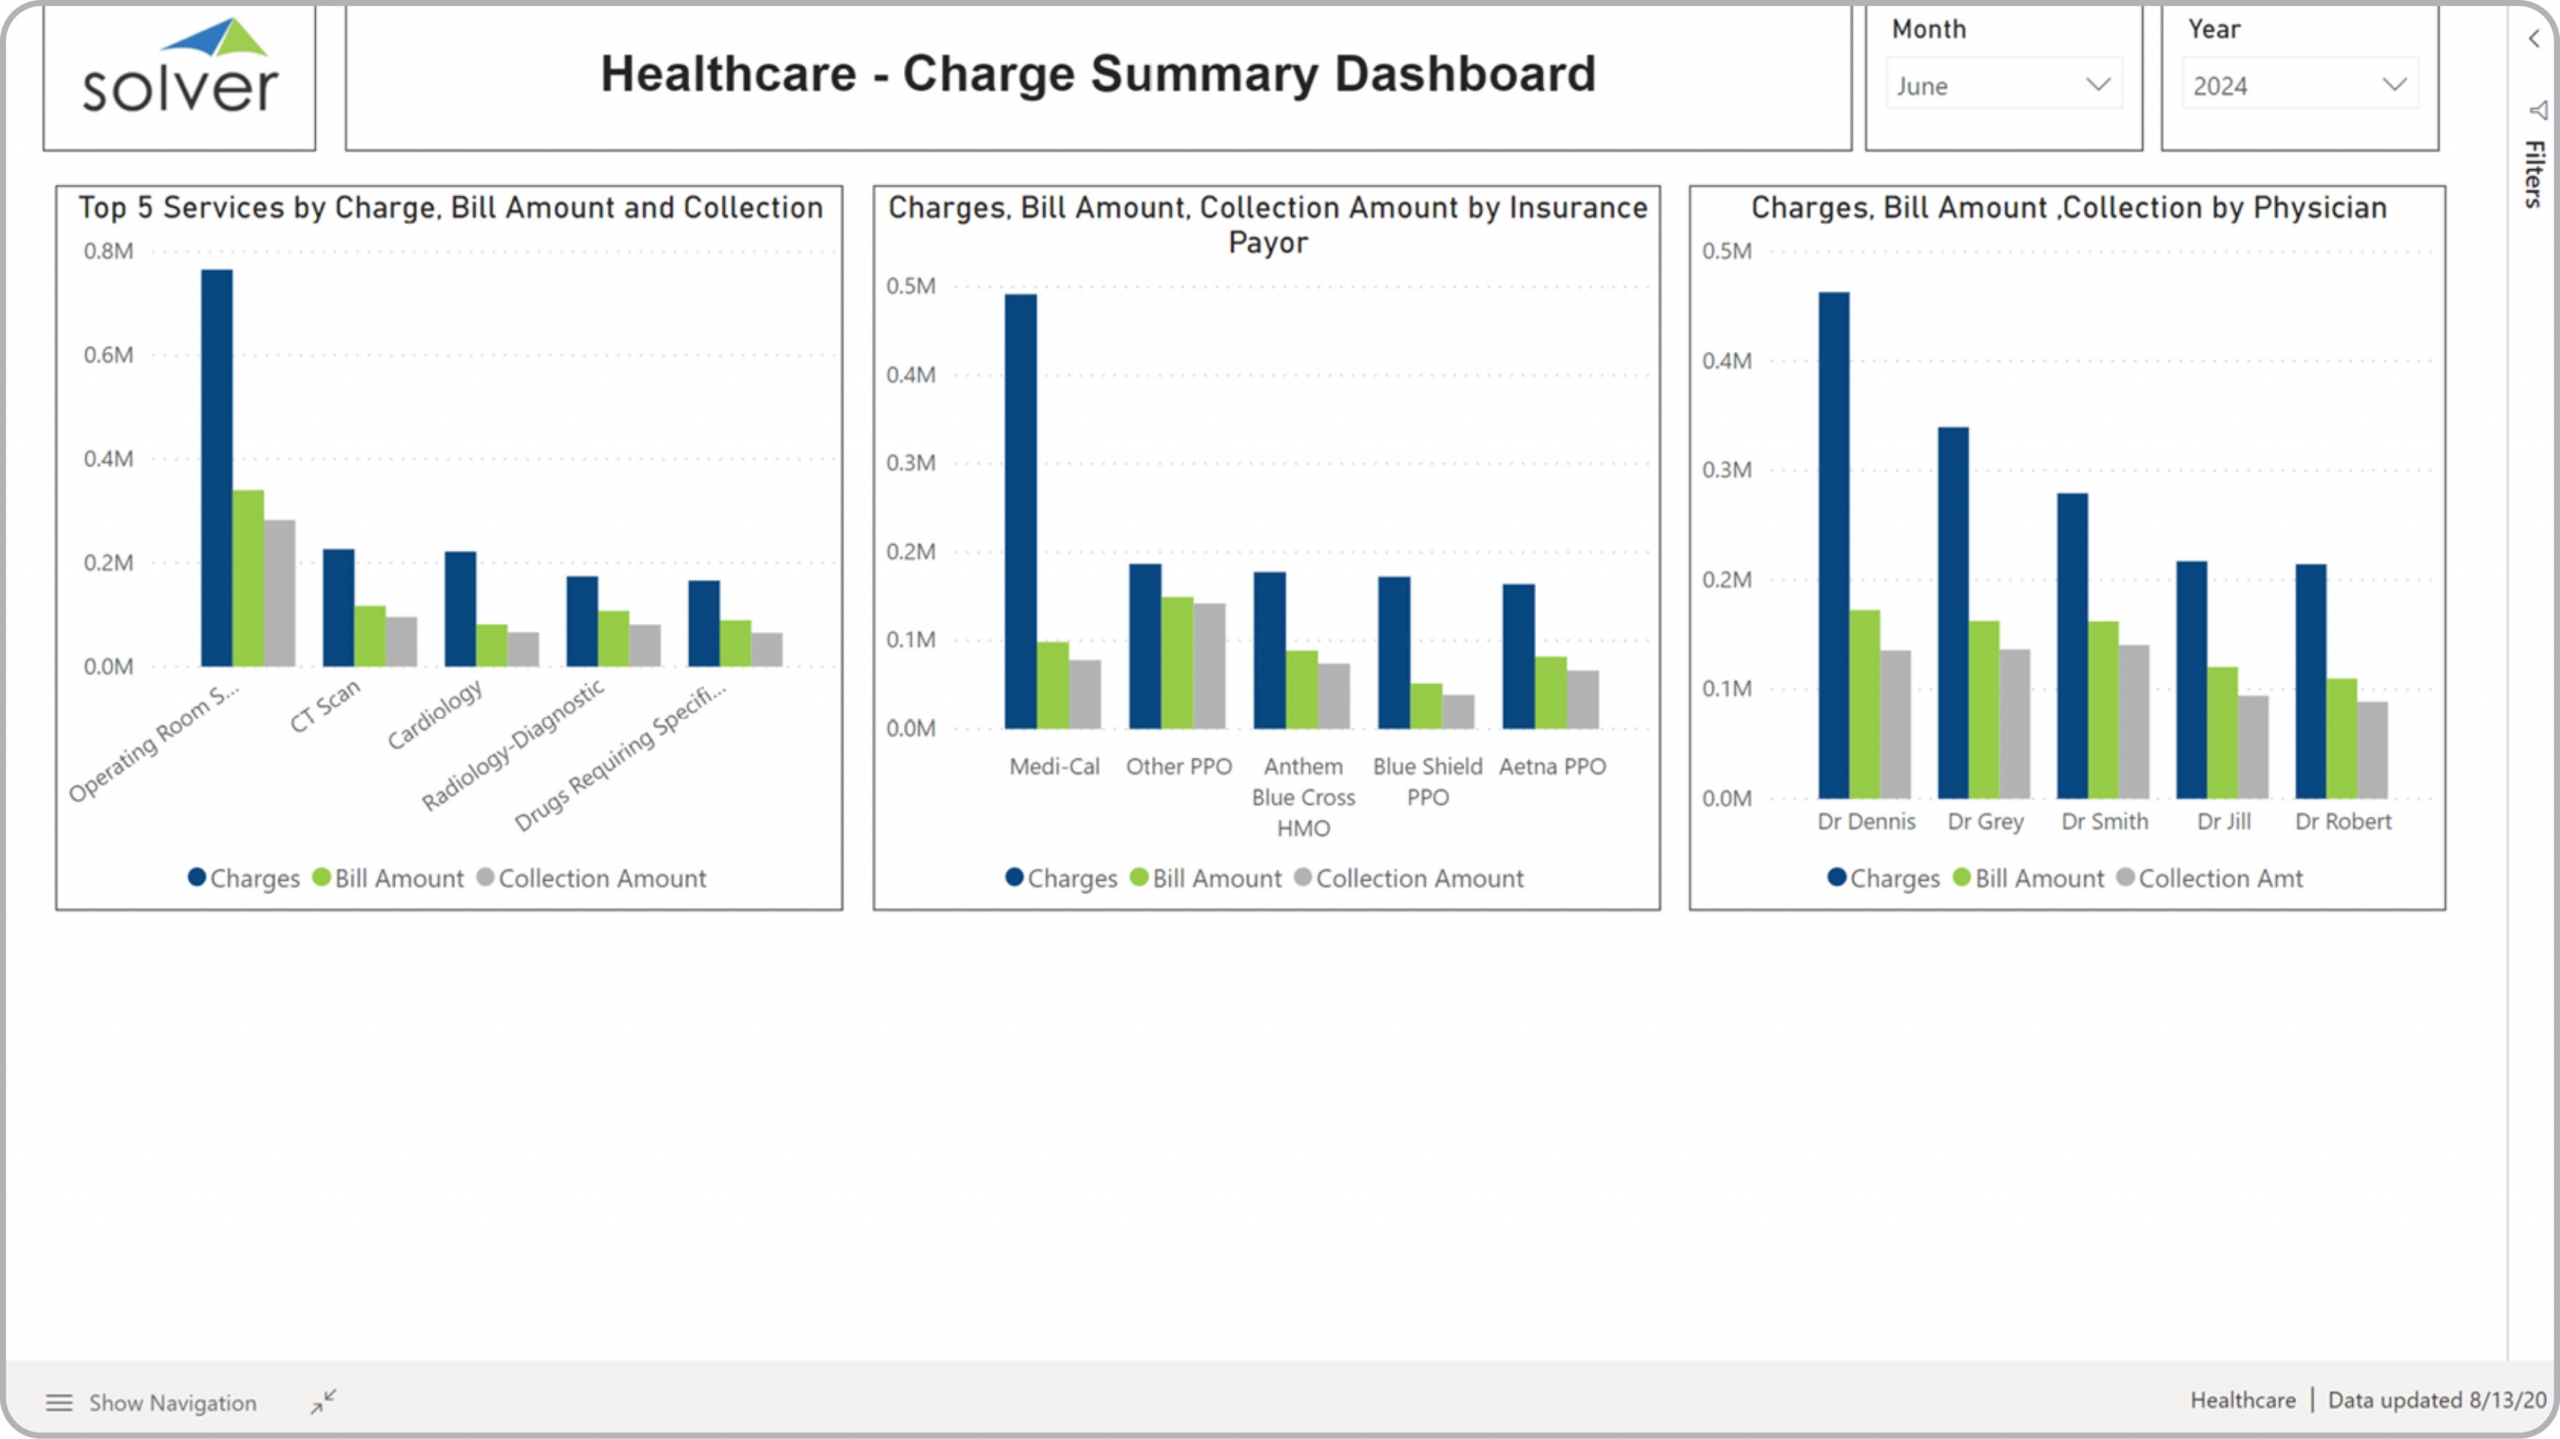
Health – Charge Summary Dashboard
Analysis of charges, billing amount and collections by services provided, payor and physician.
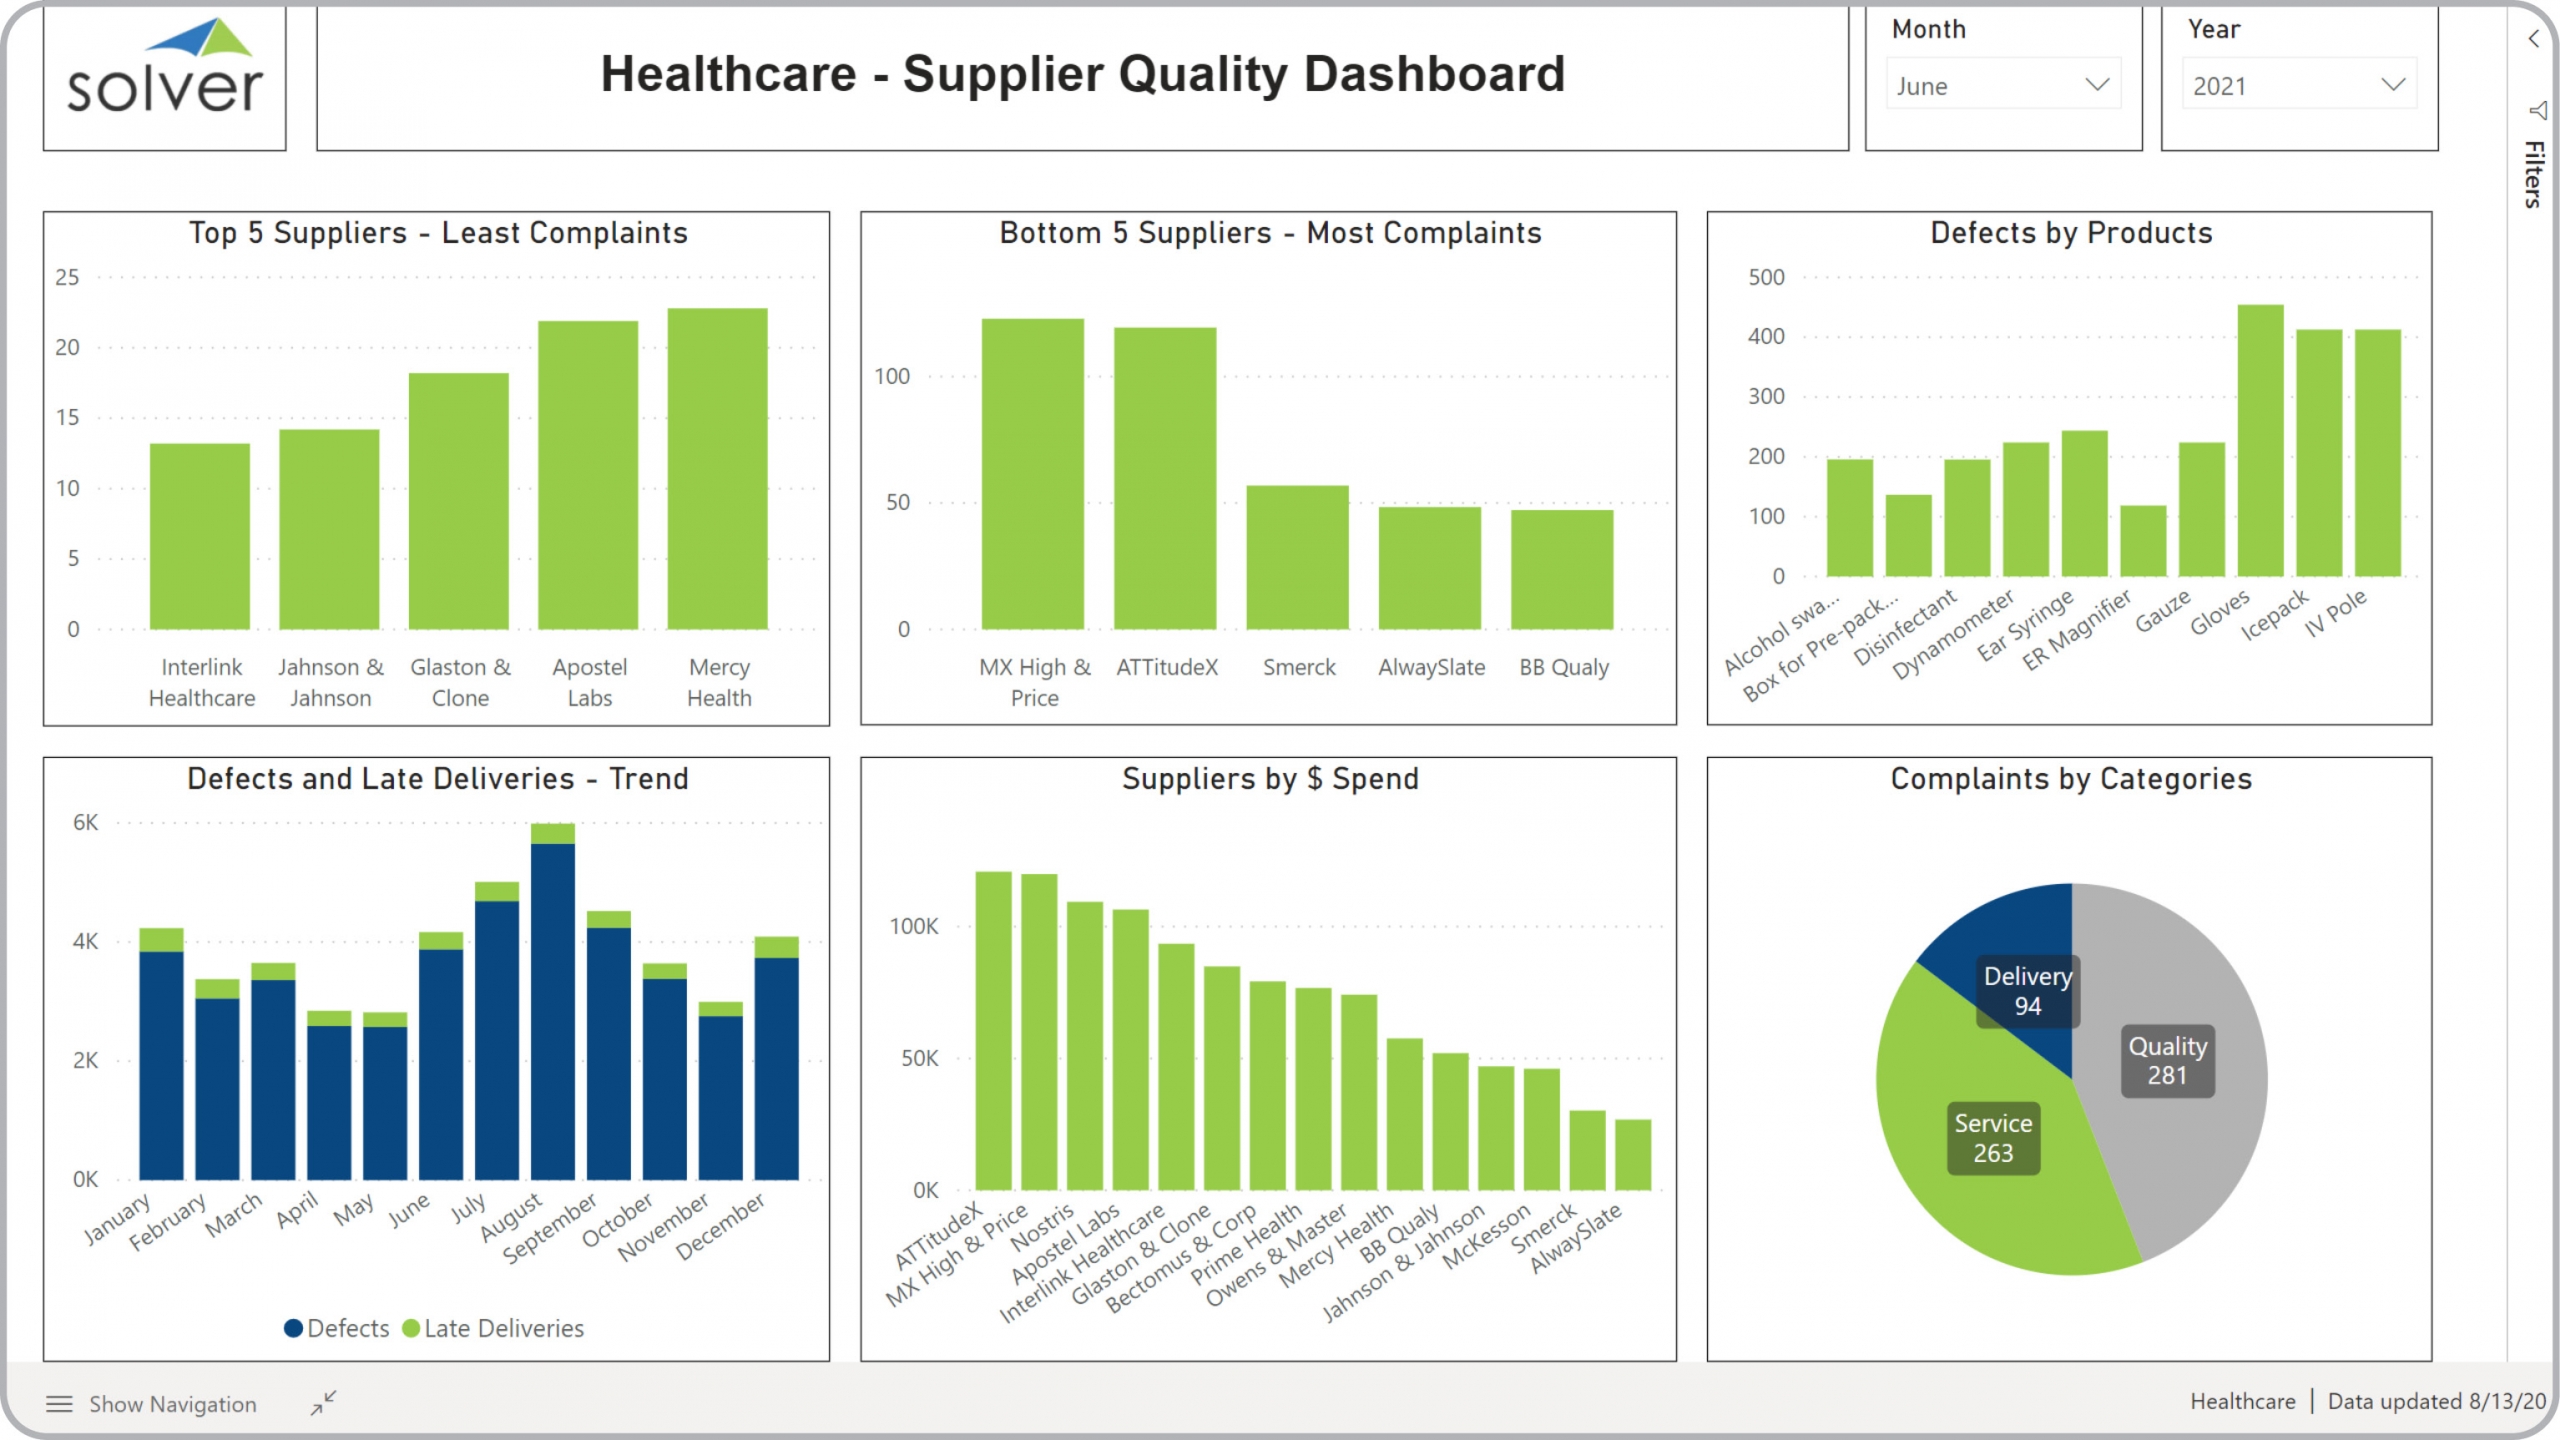
Health – Supplier Quality Dashboard
Analysis of healthcare supplier stats for complaints, quality, spend, and late deliveries.
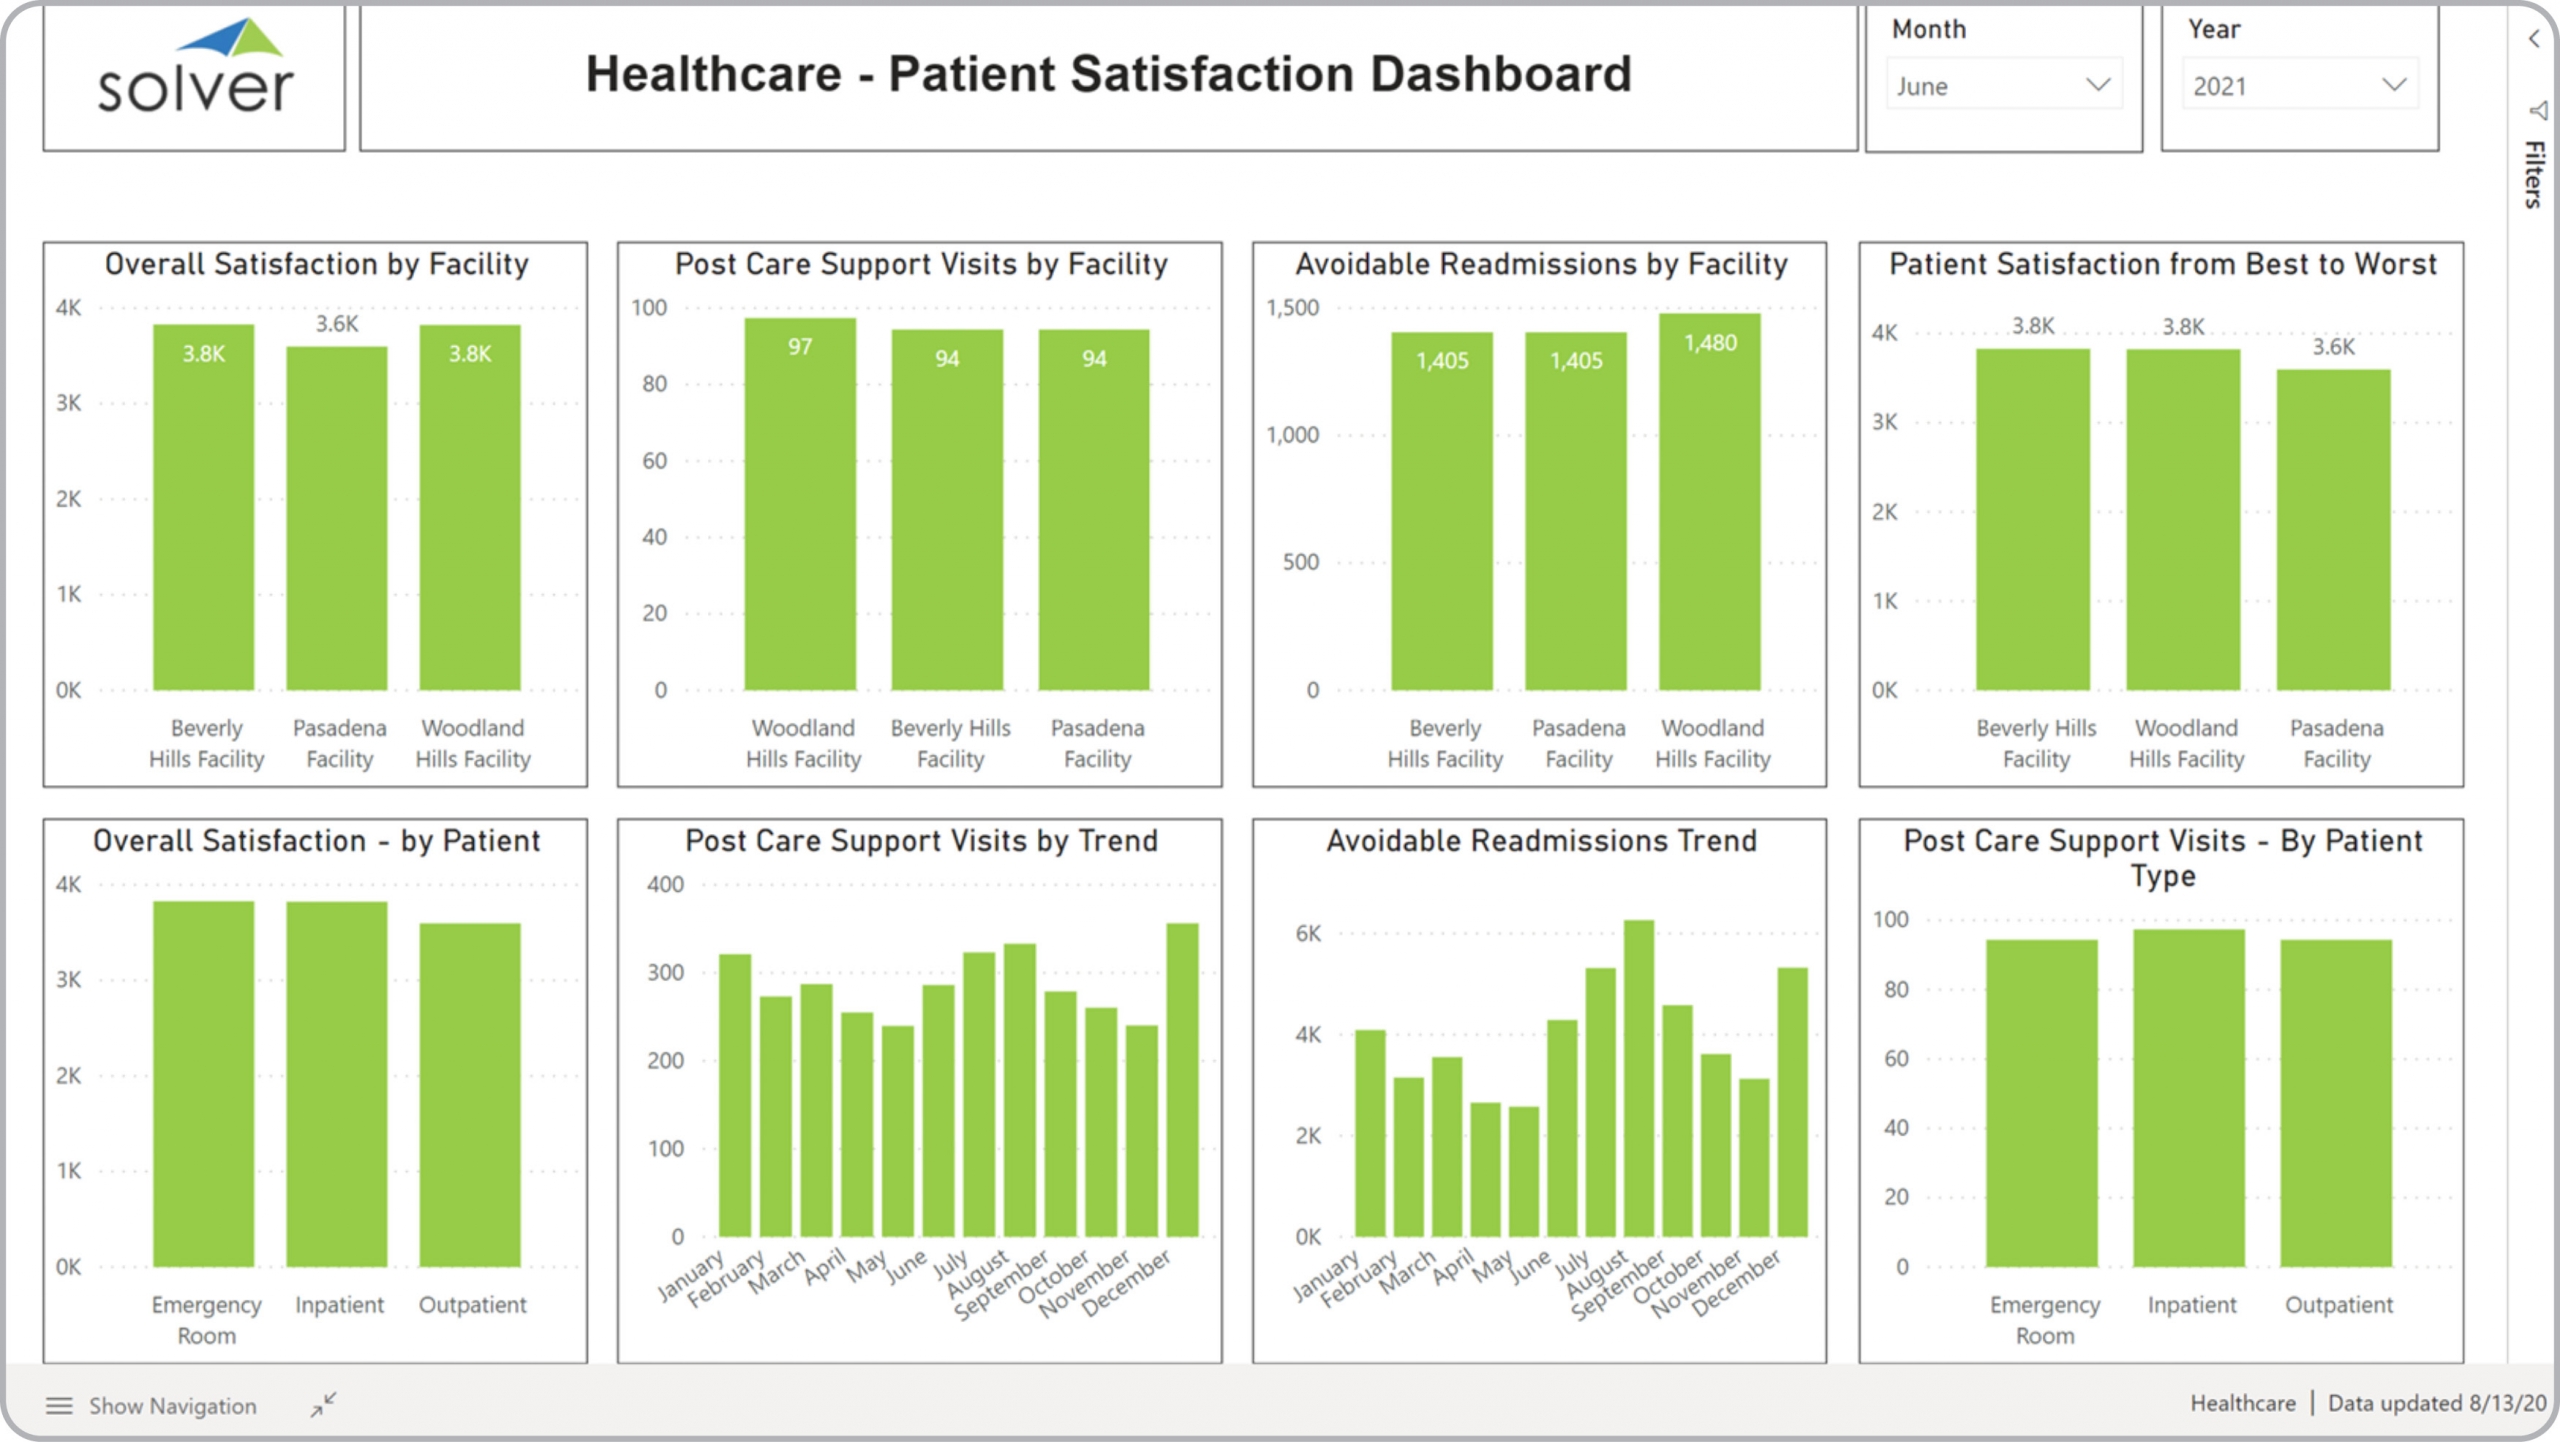
Health – Patient Satisfaction Dashboard
Healthcare KPIs for patient satisfaction by inpatient, outpatient, readmission, post care, etc.
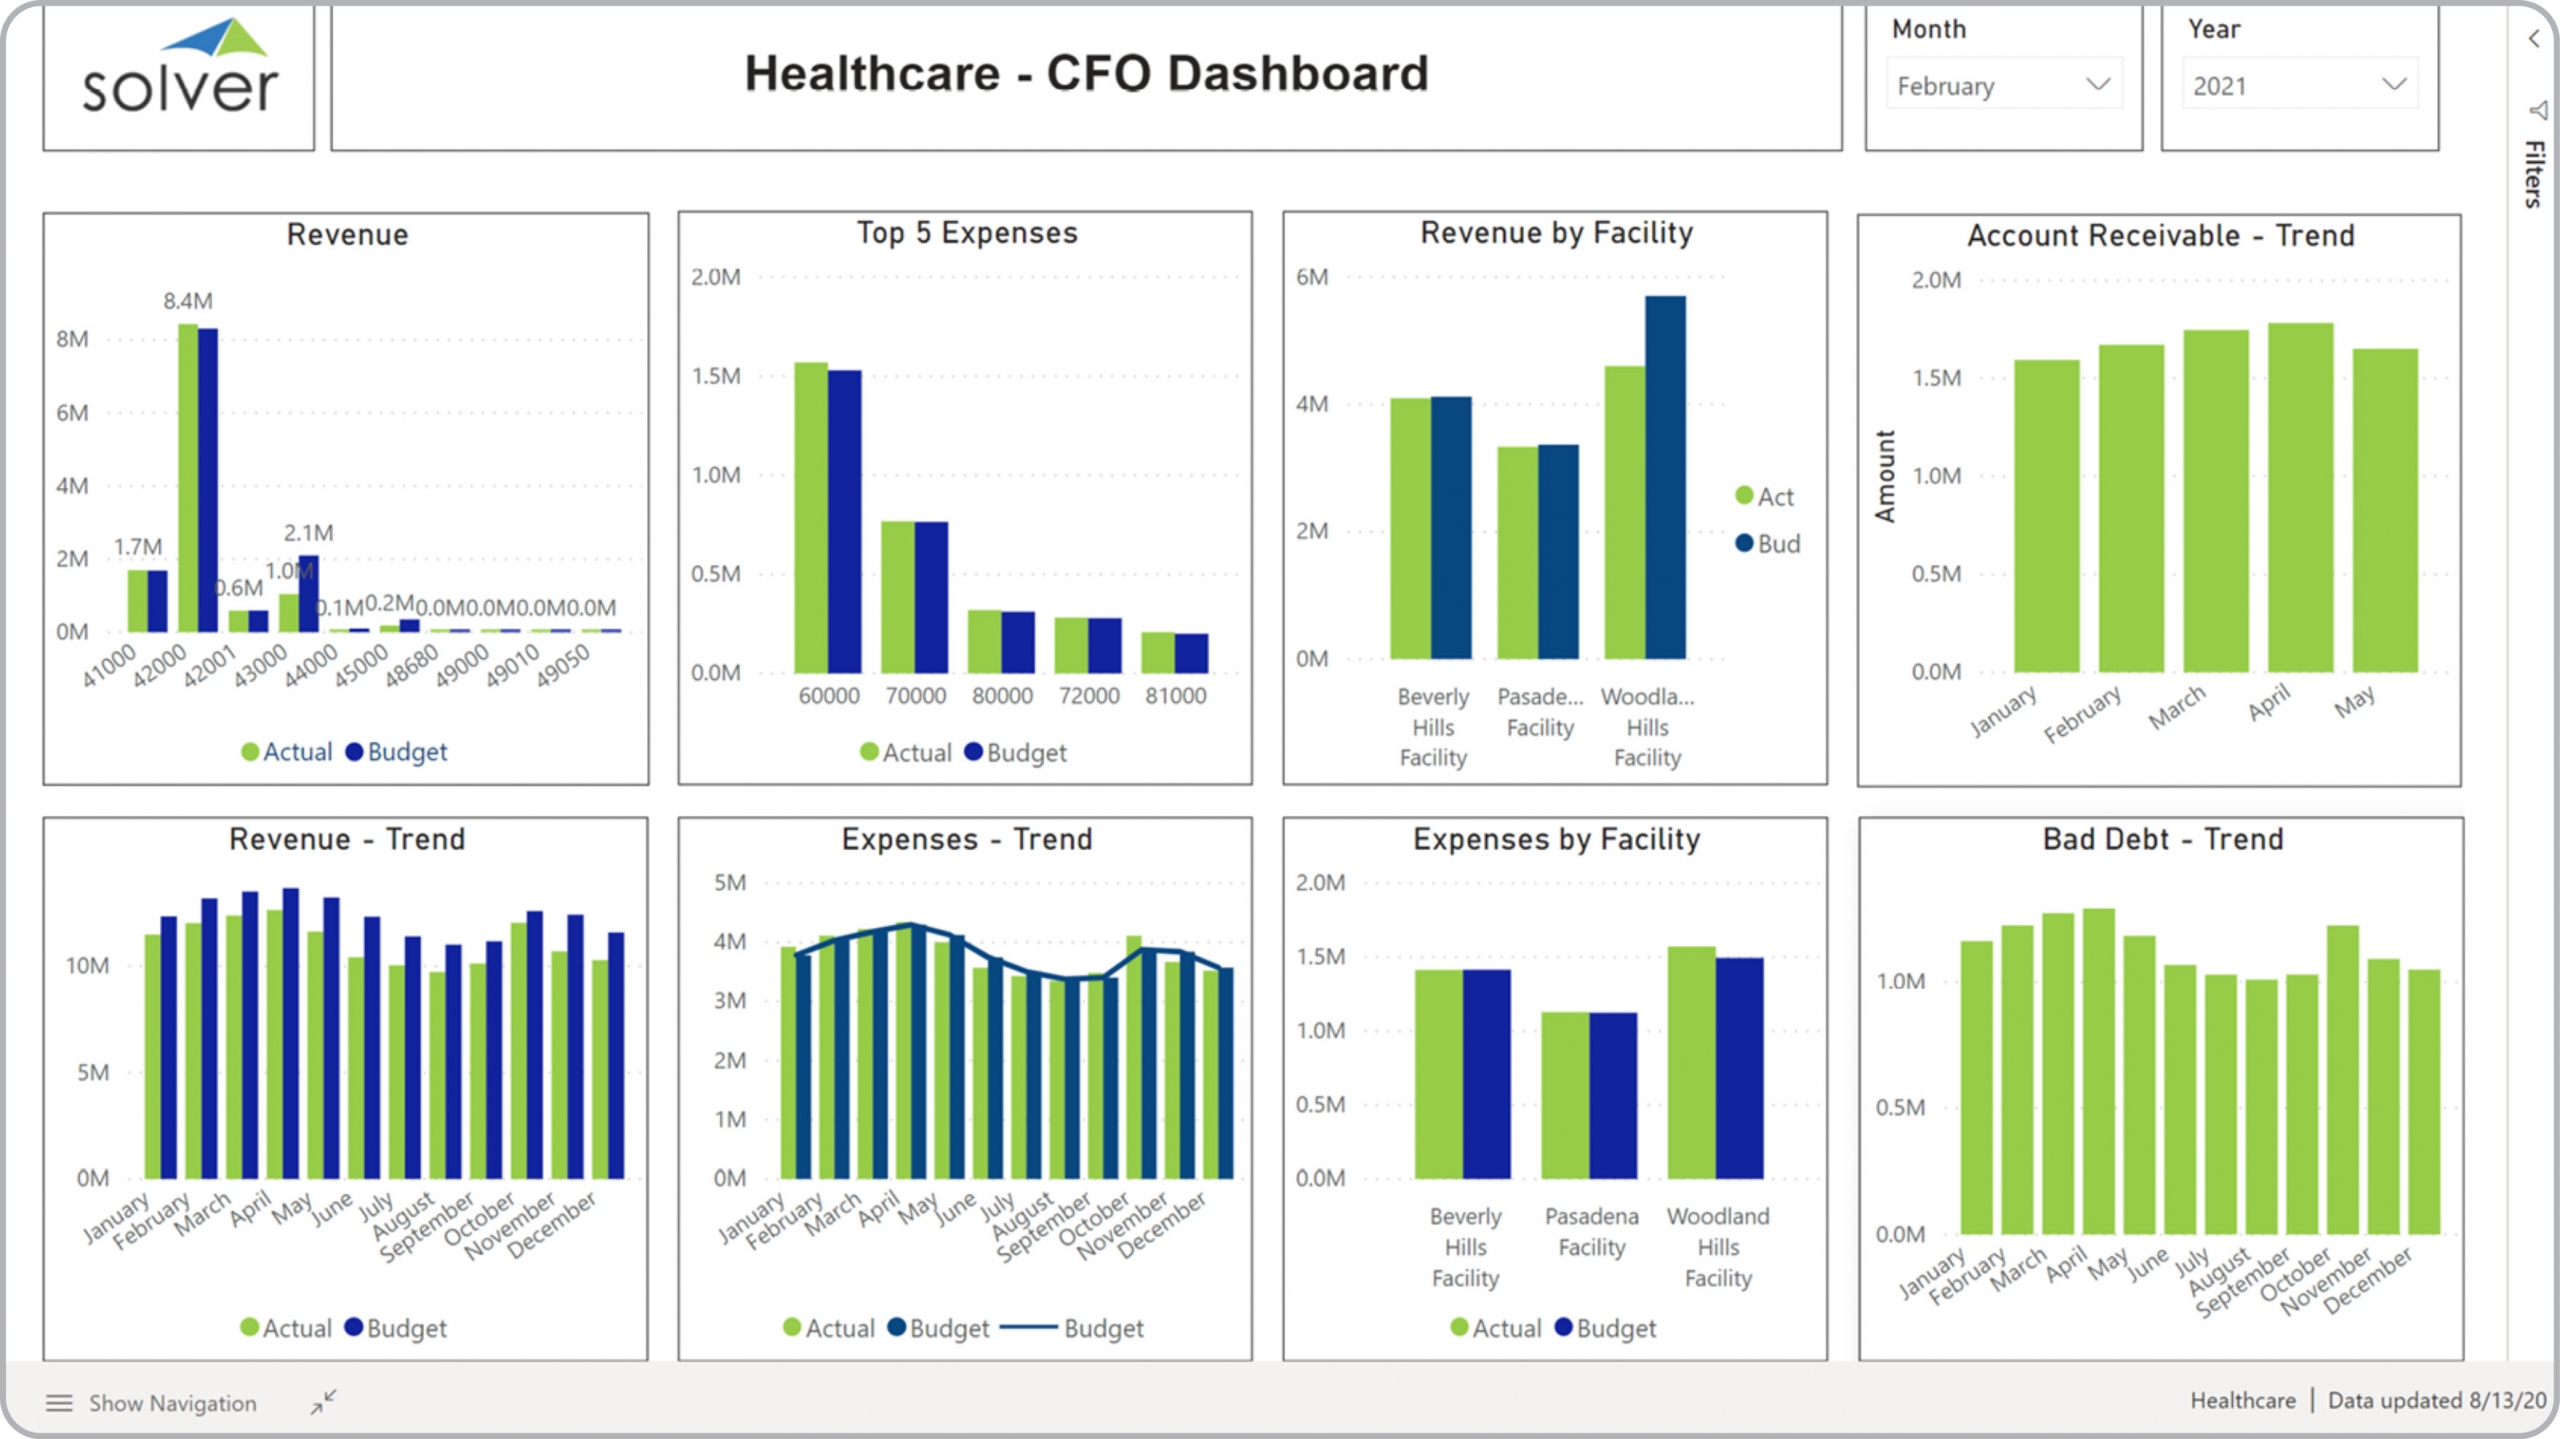
Health – CFO Dashboard
Financial metrics for healthcare CFOs, including revenues, expenses, bad debt and AR.
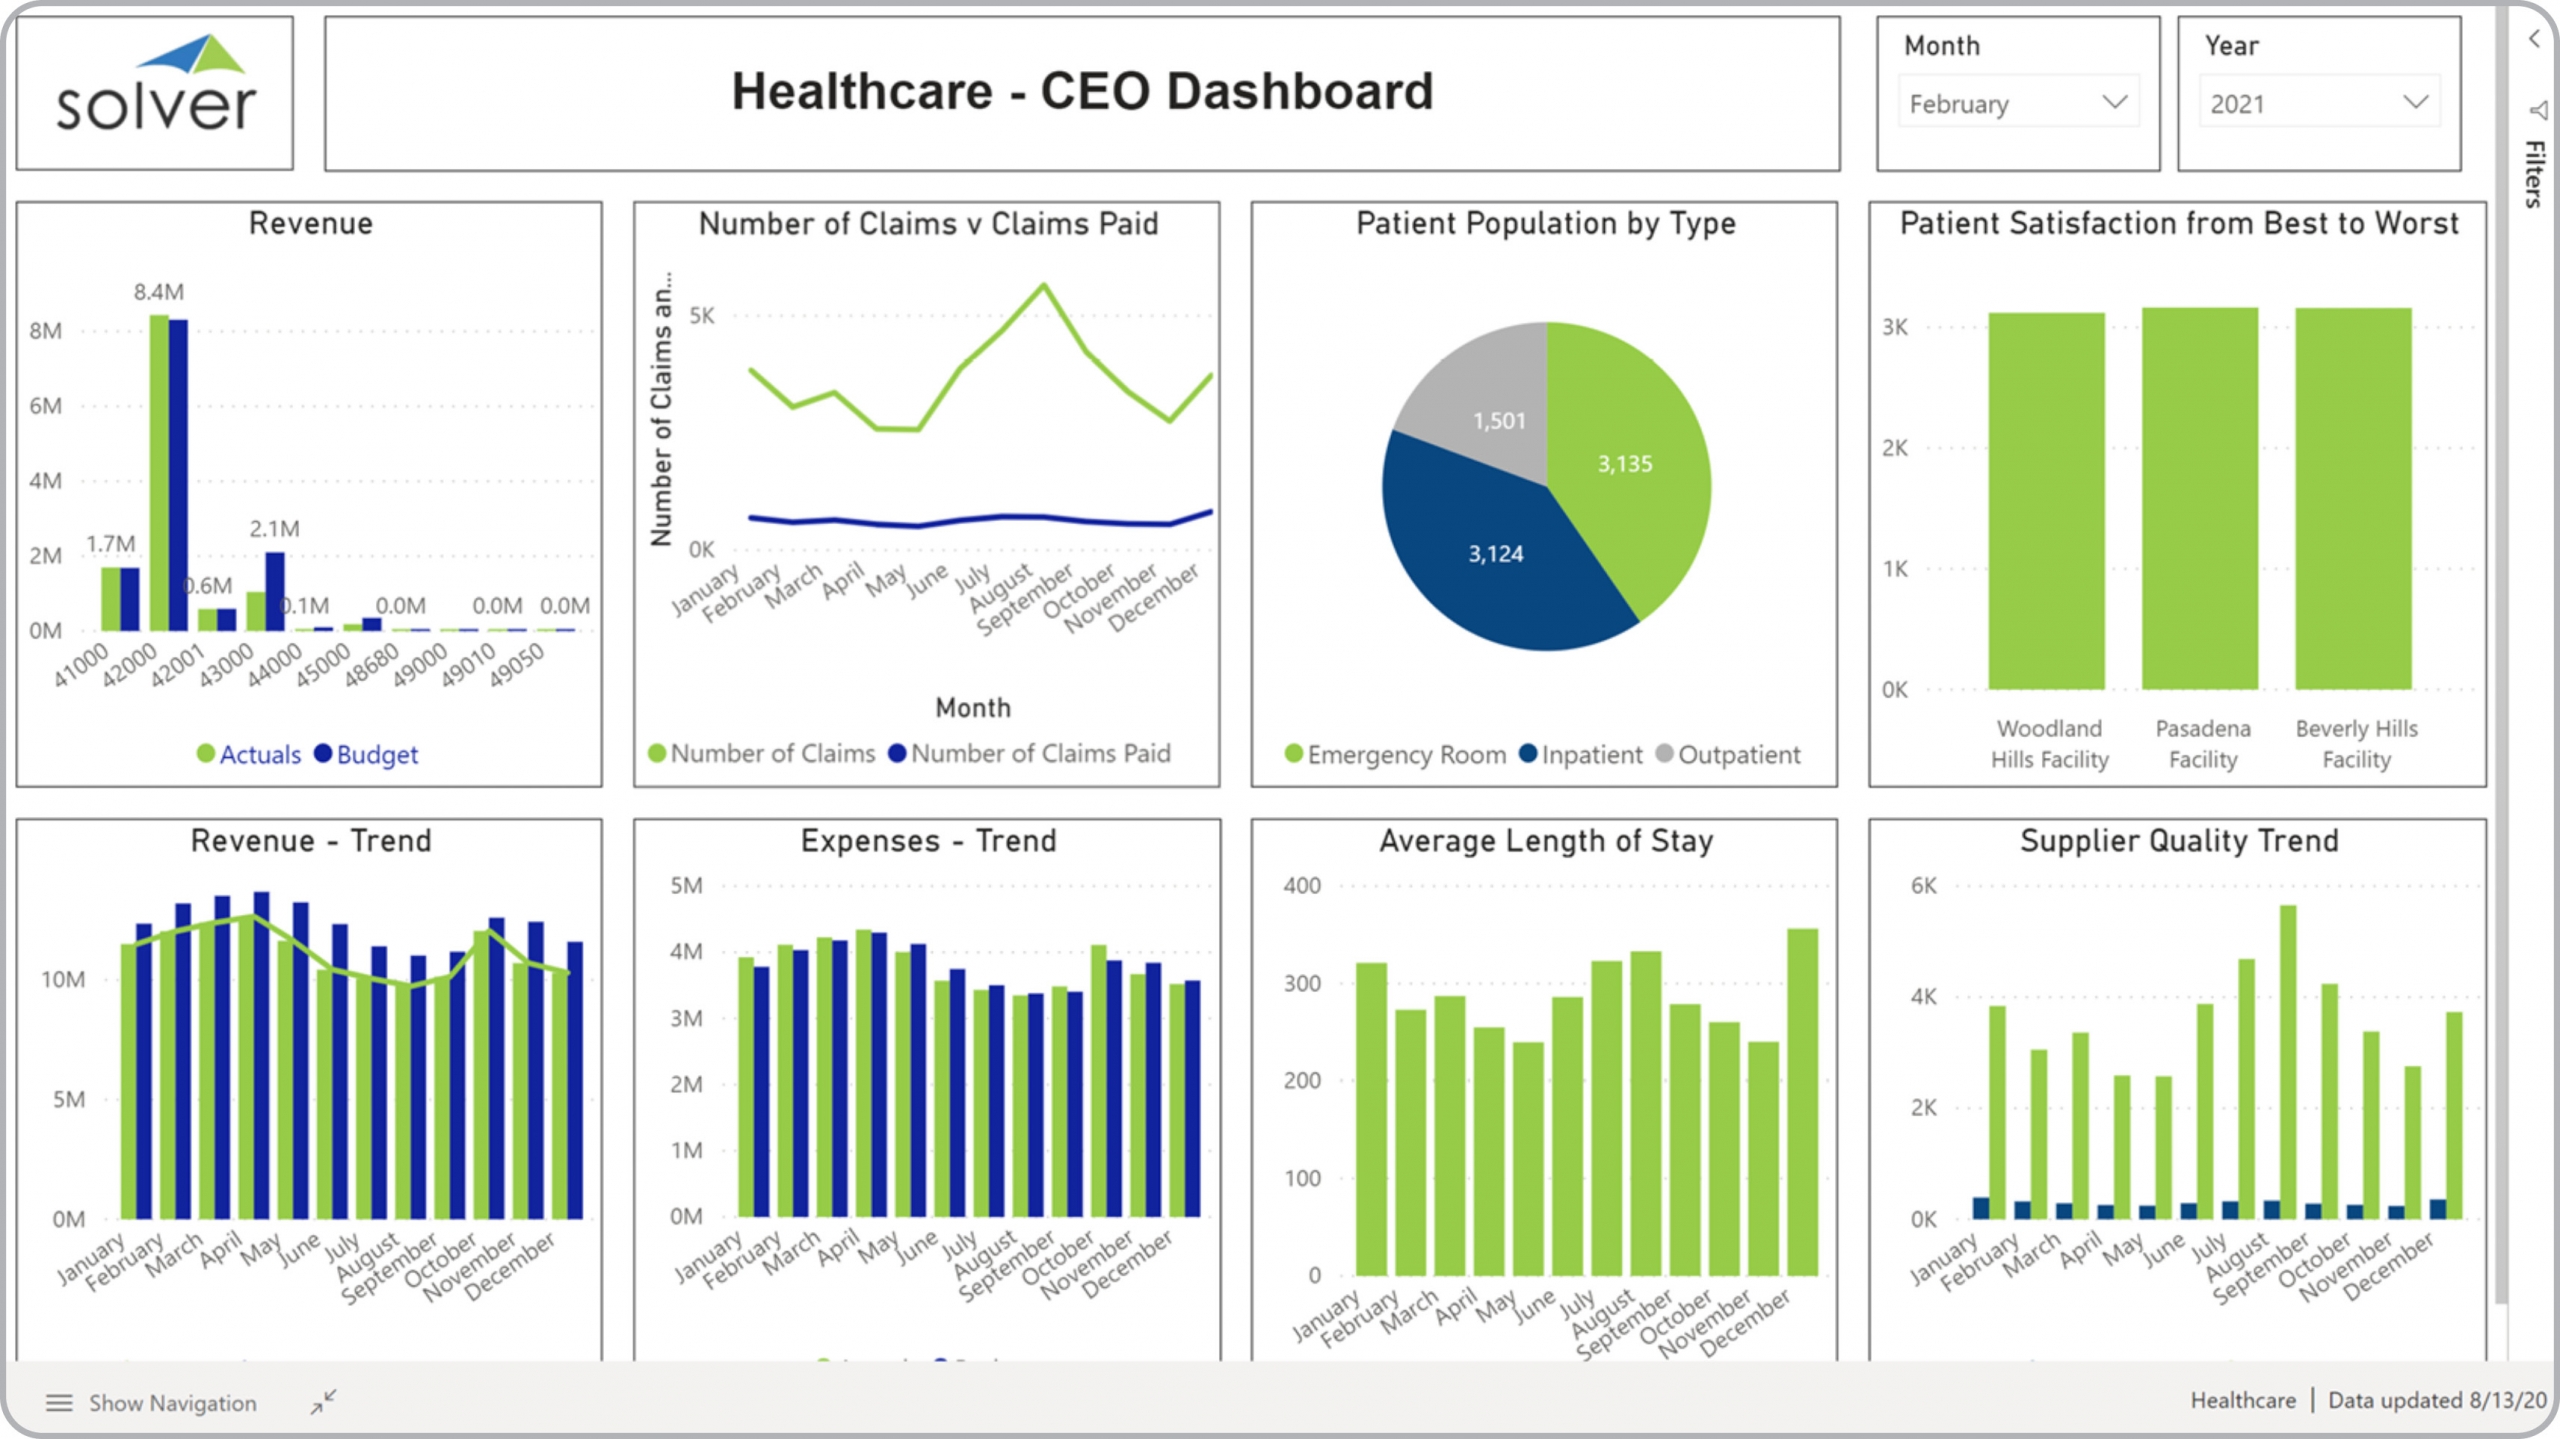
Health – CEO Dashboard
Key metrics for healthcare execs, such as revenue, patient stats, claims and ALOS.
Media – Monthly Profit & Loss Report
P&L report with actual, budget, last year and variance.
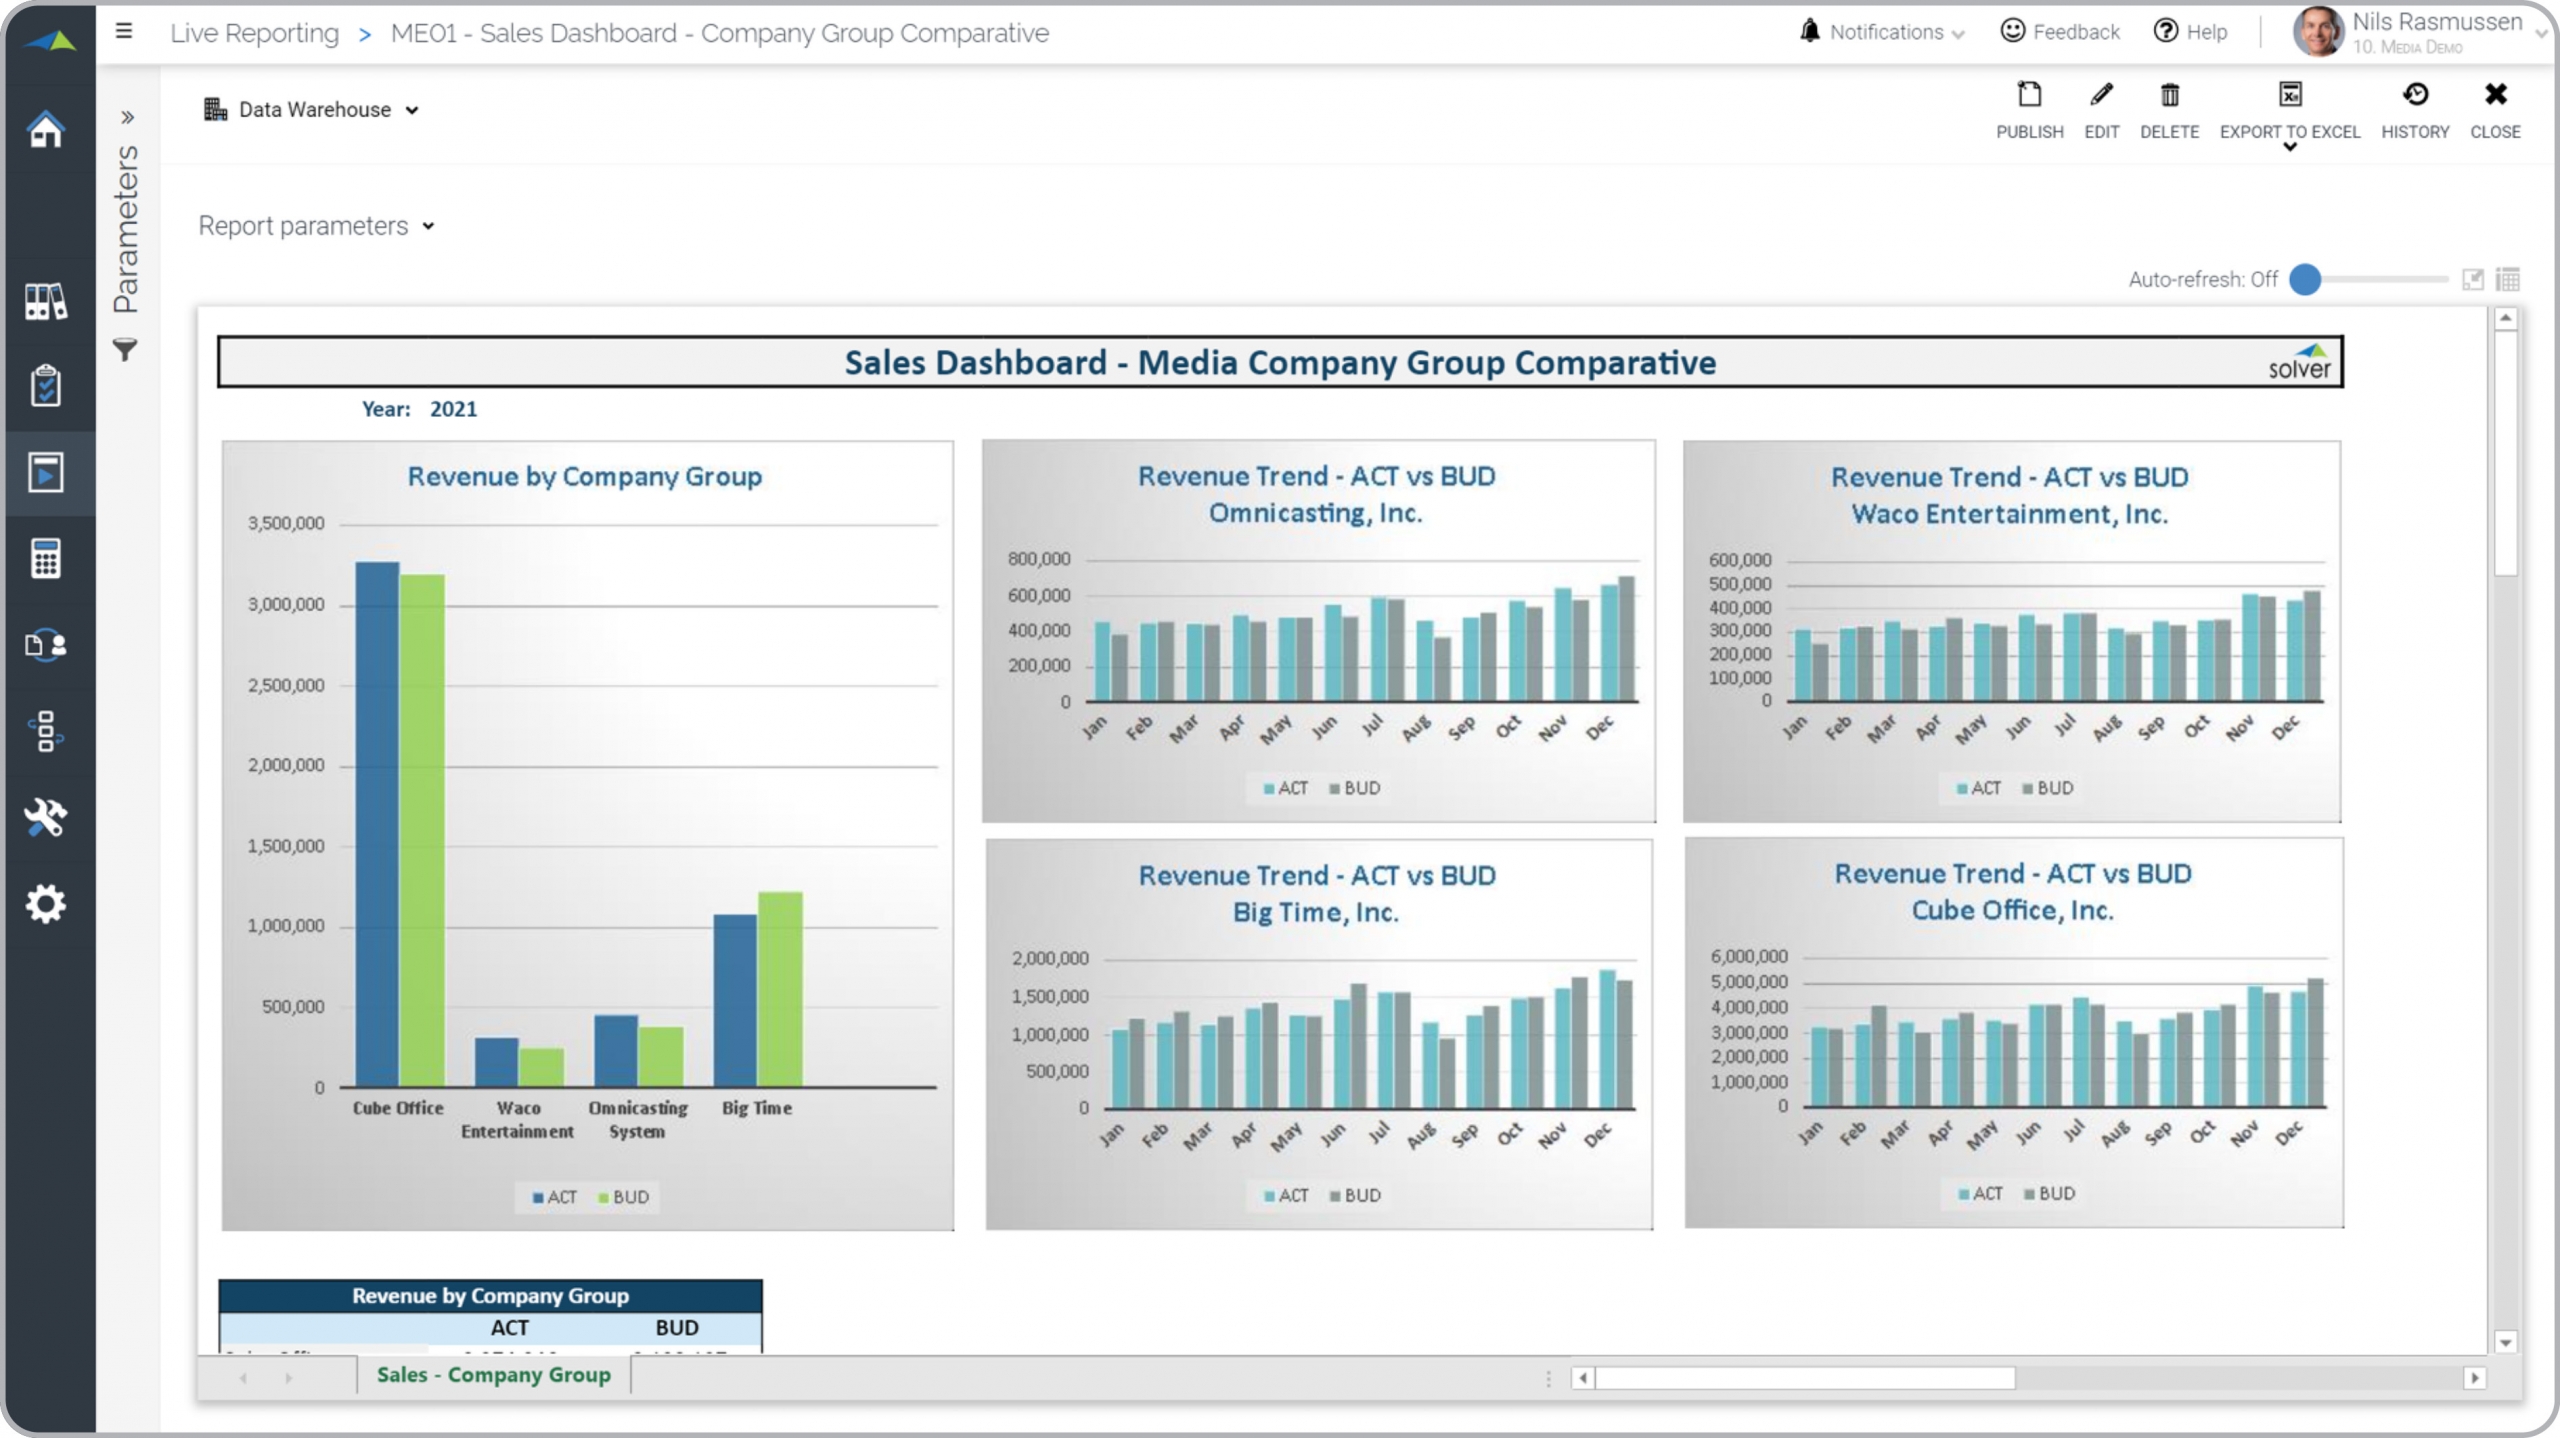
Media – Sales Dashboard
Actual versus budget monthly trend per company as well as company comparison.
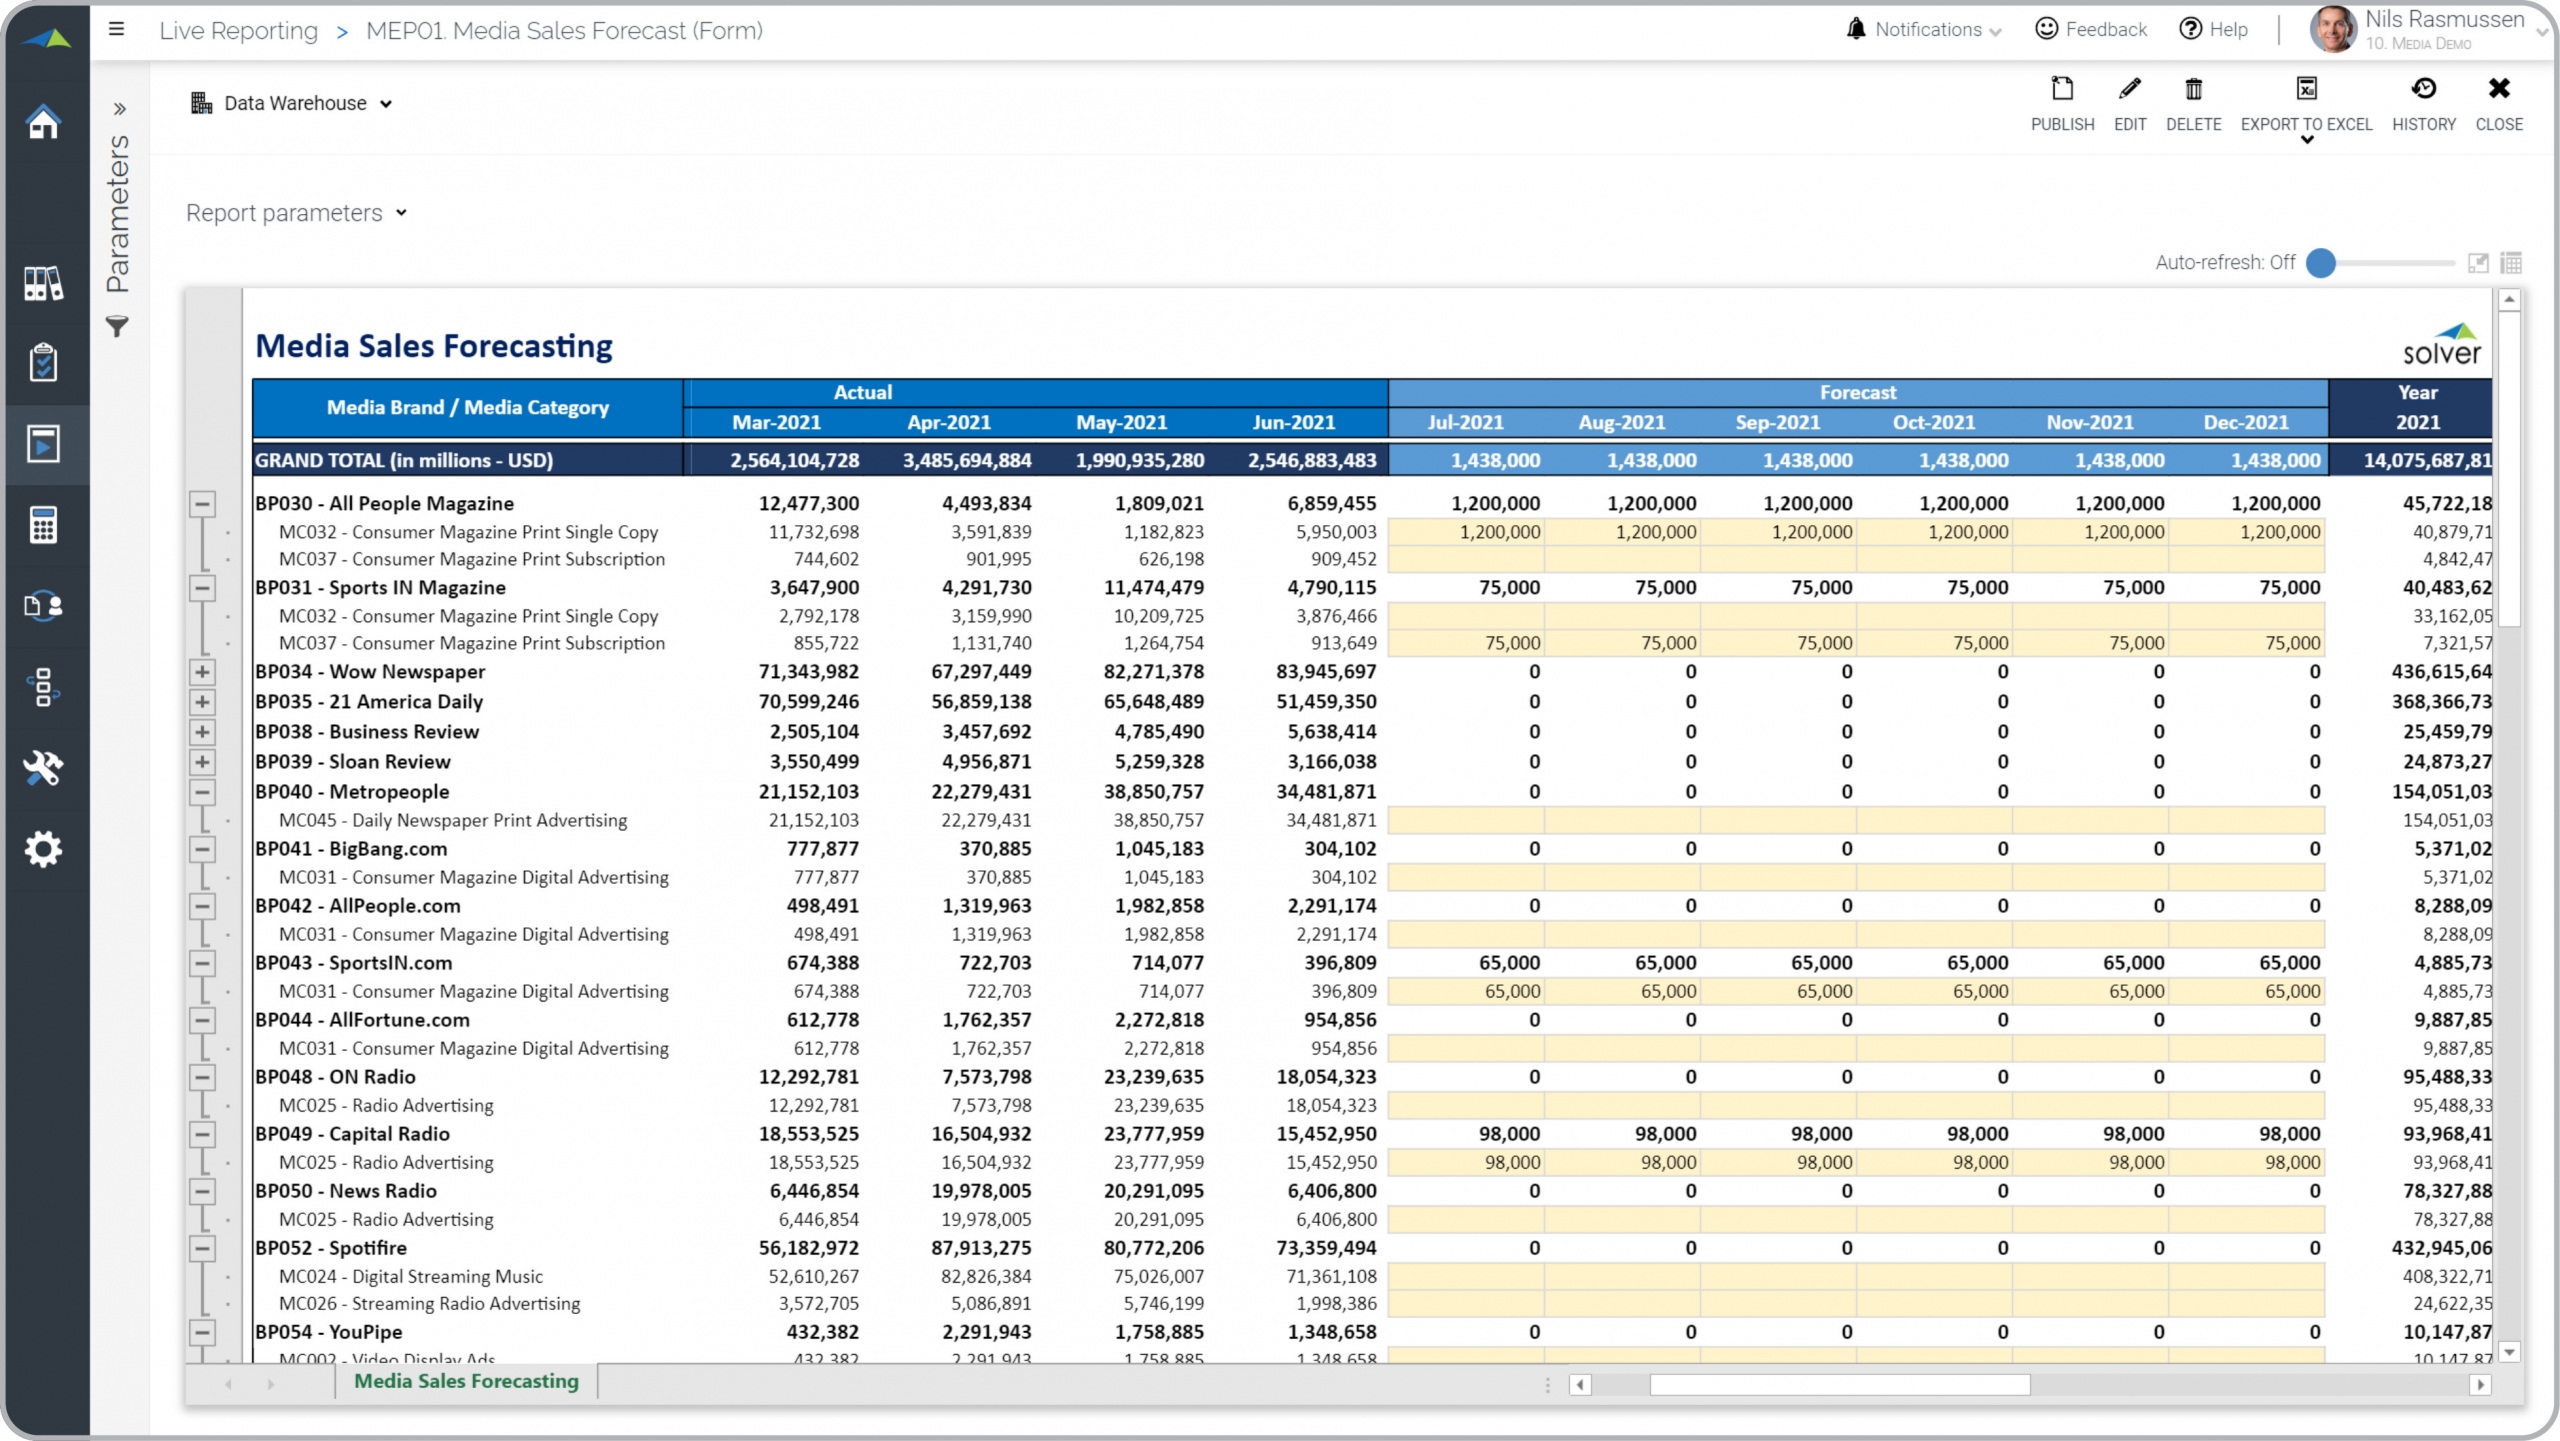
Media – Sales Forecasting
Sales forecast input by brand and category.
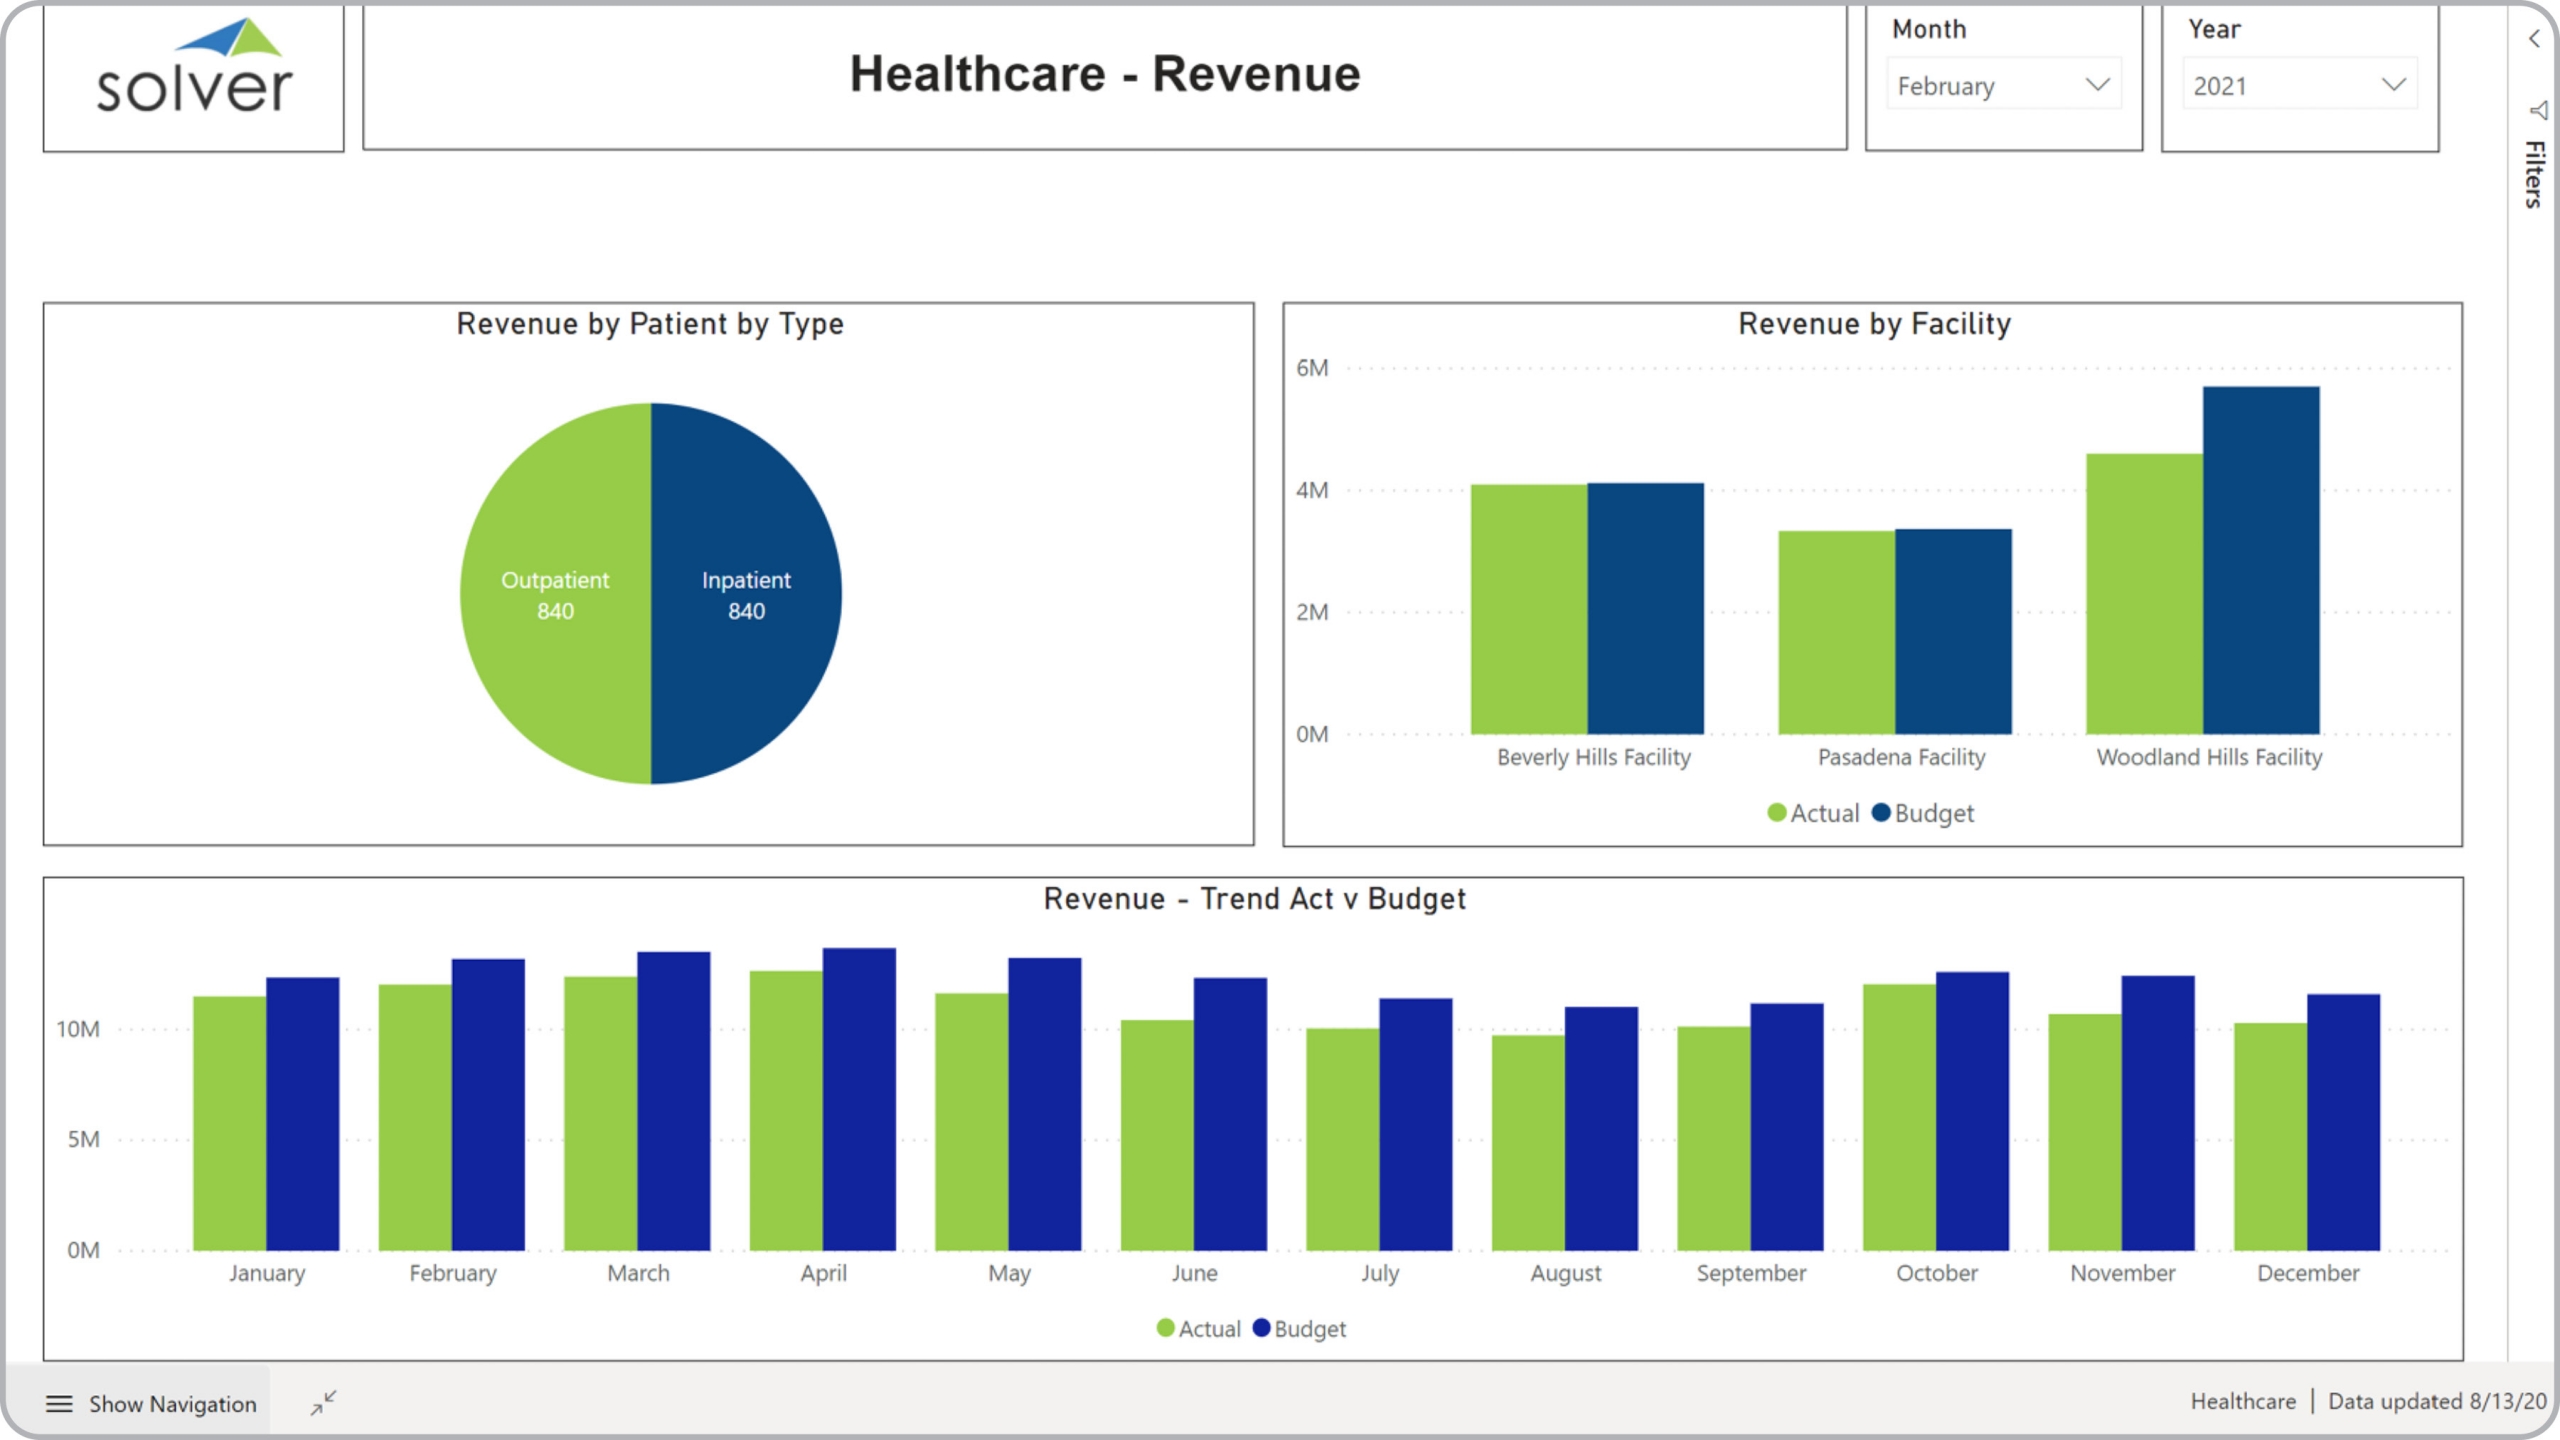
Health – Revenue Dashboard
Analysis with trends and comparisons of revenues from patients, facility and budgets.
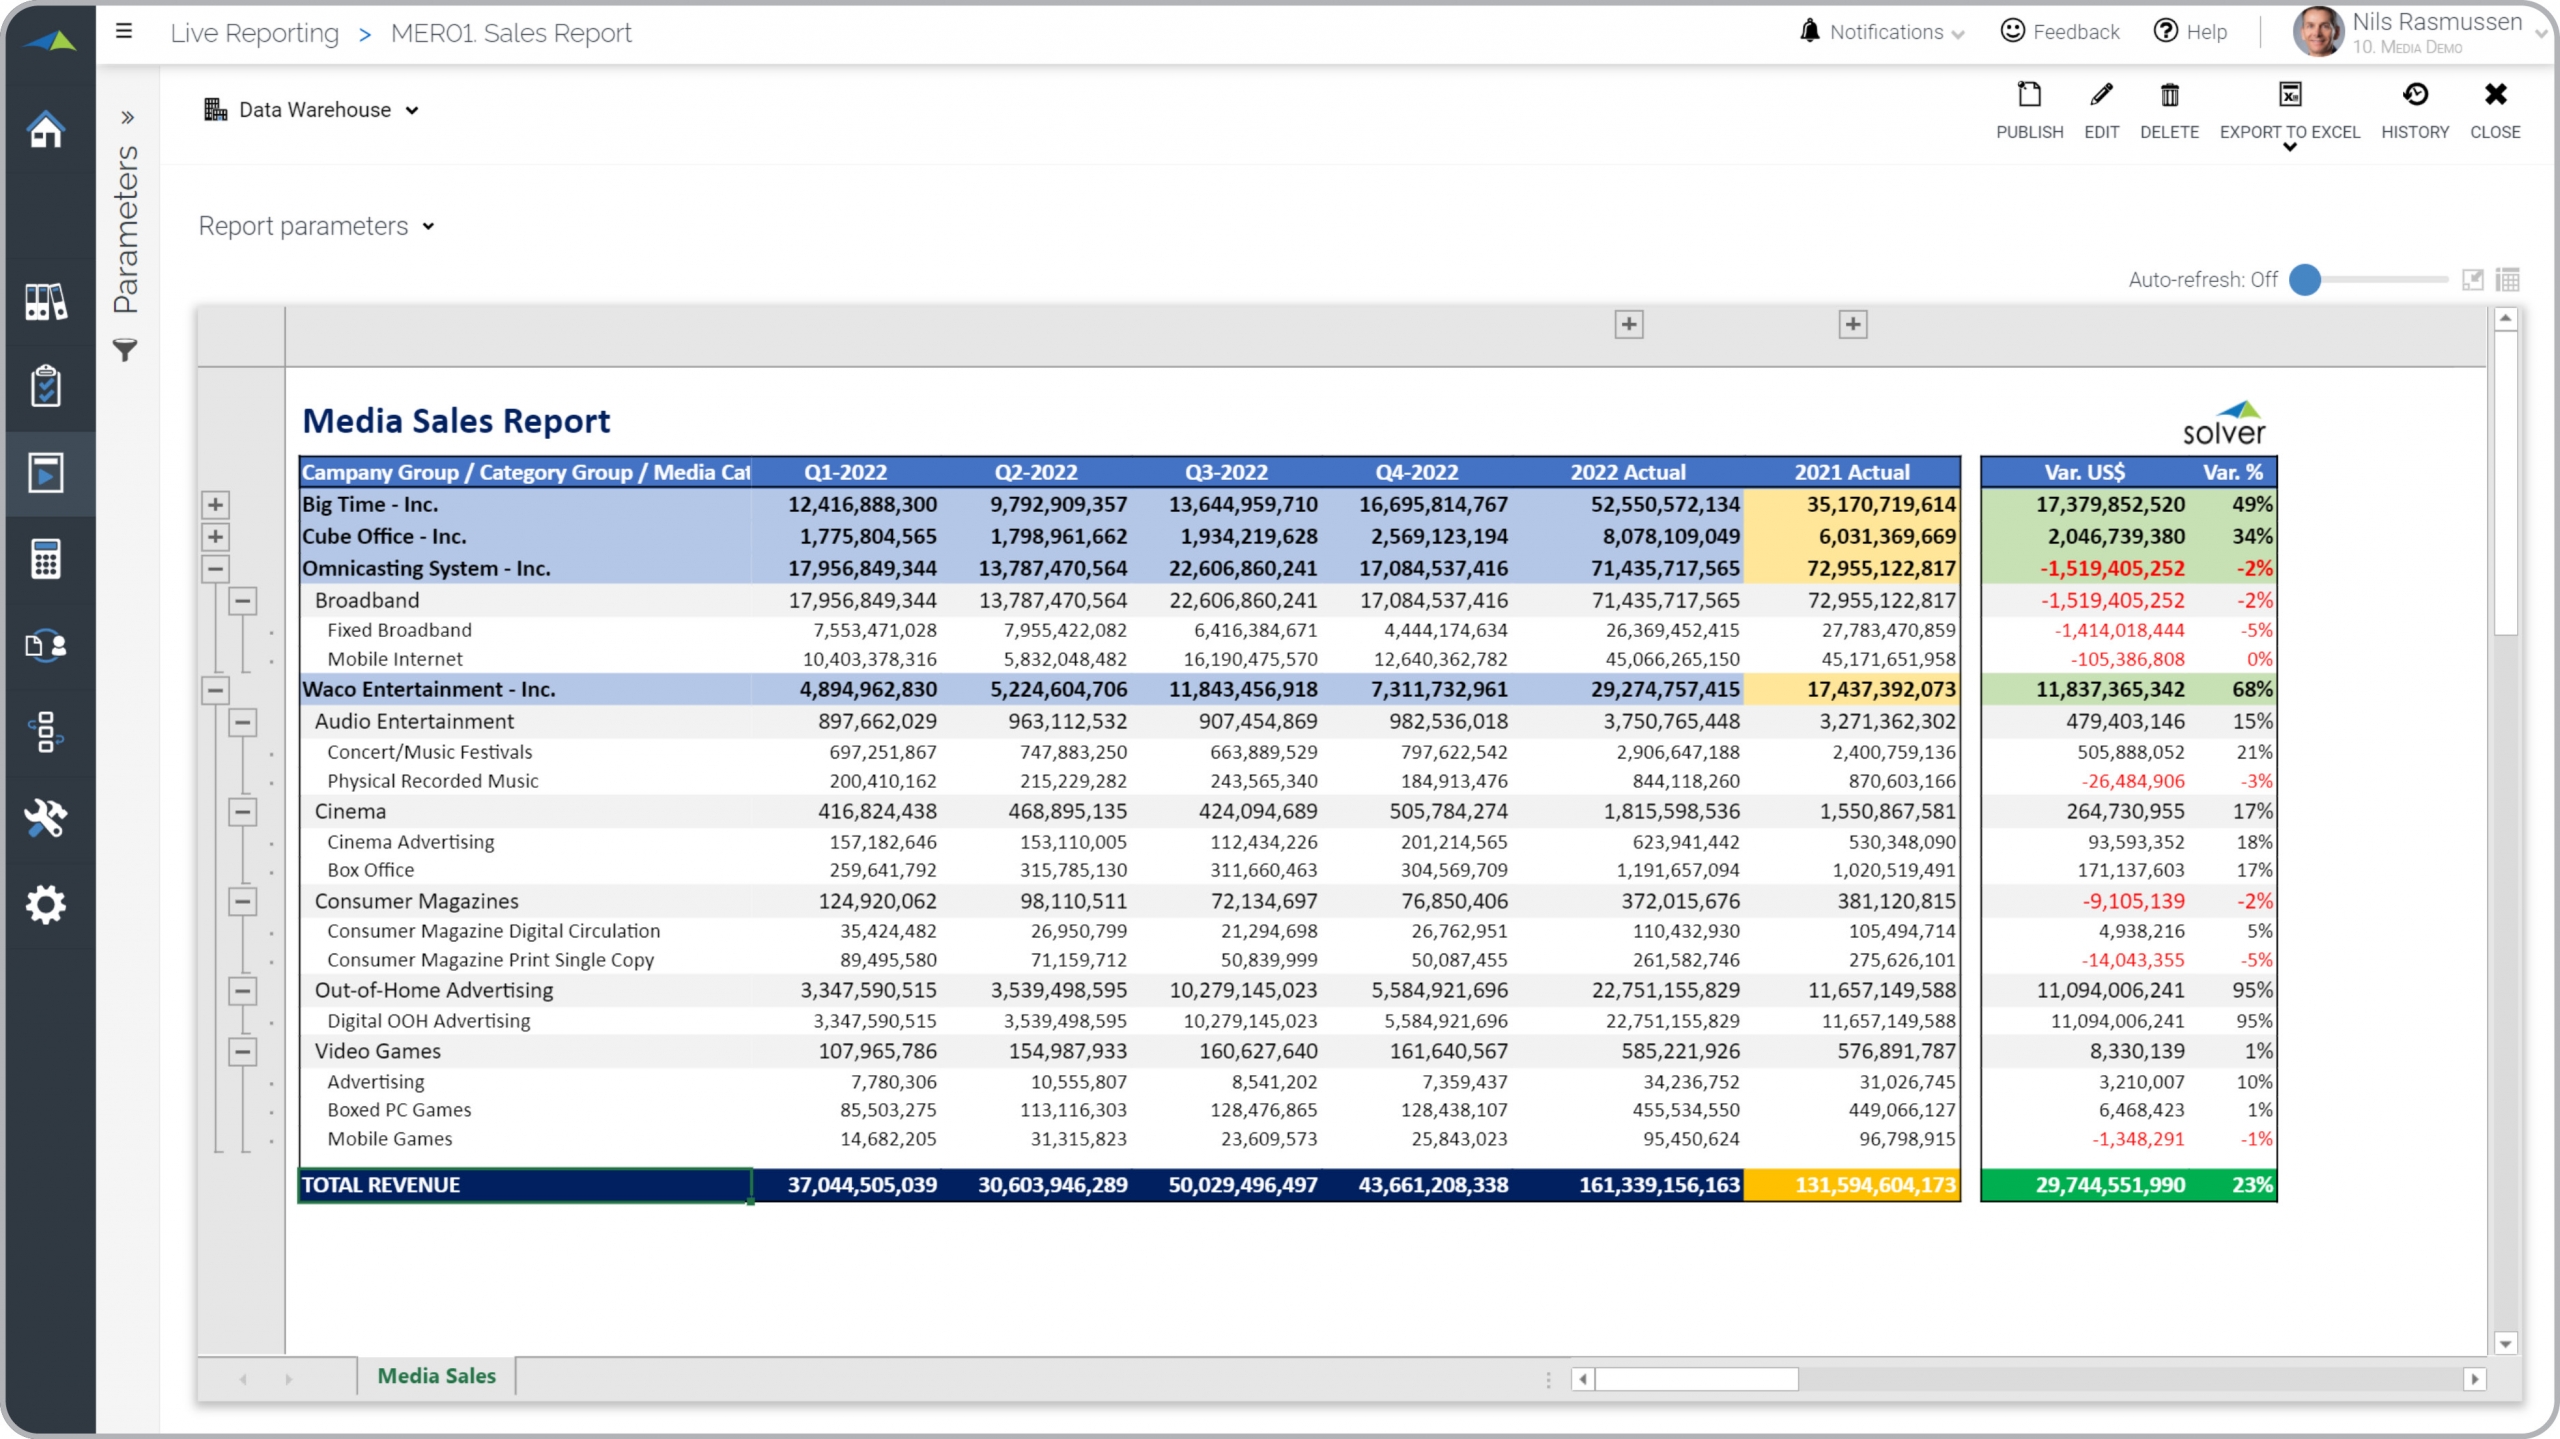
Media – Sales Report
Current year versus last year sales analysis by company and category.
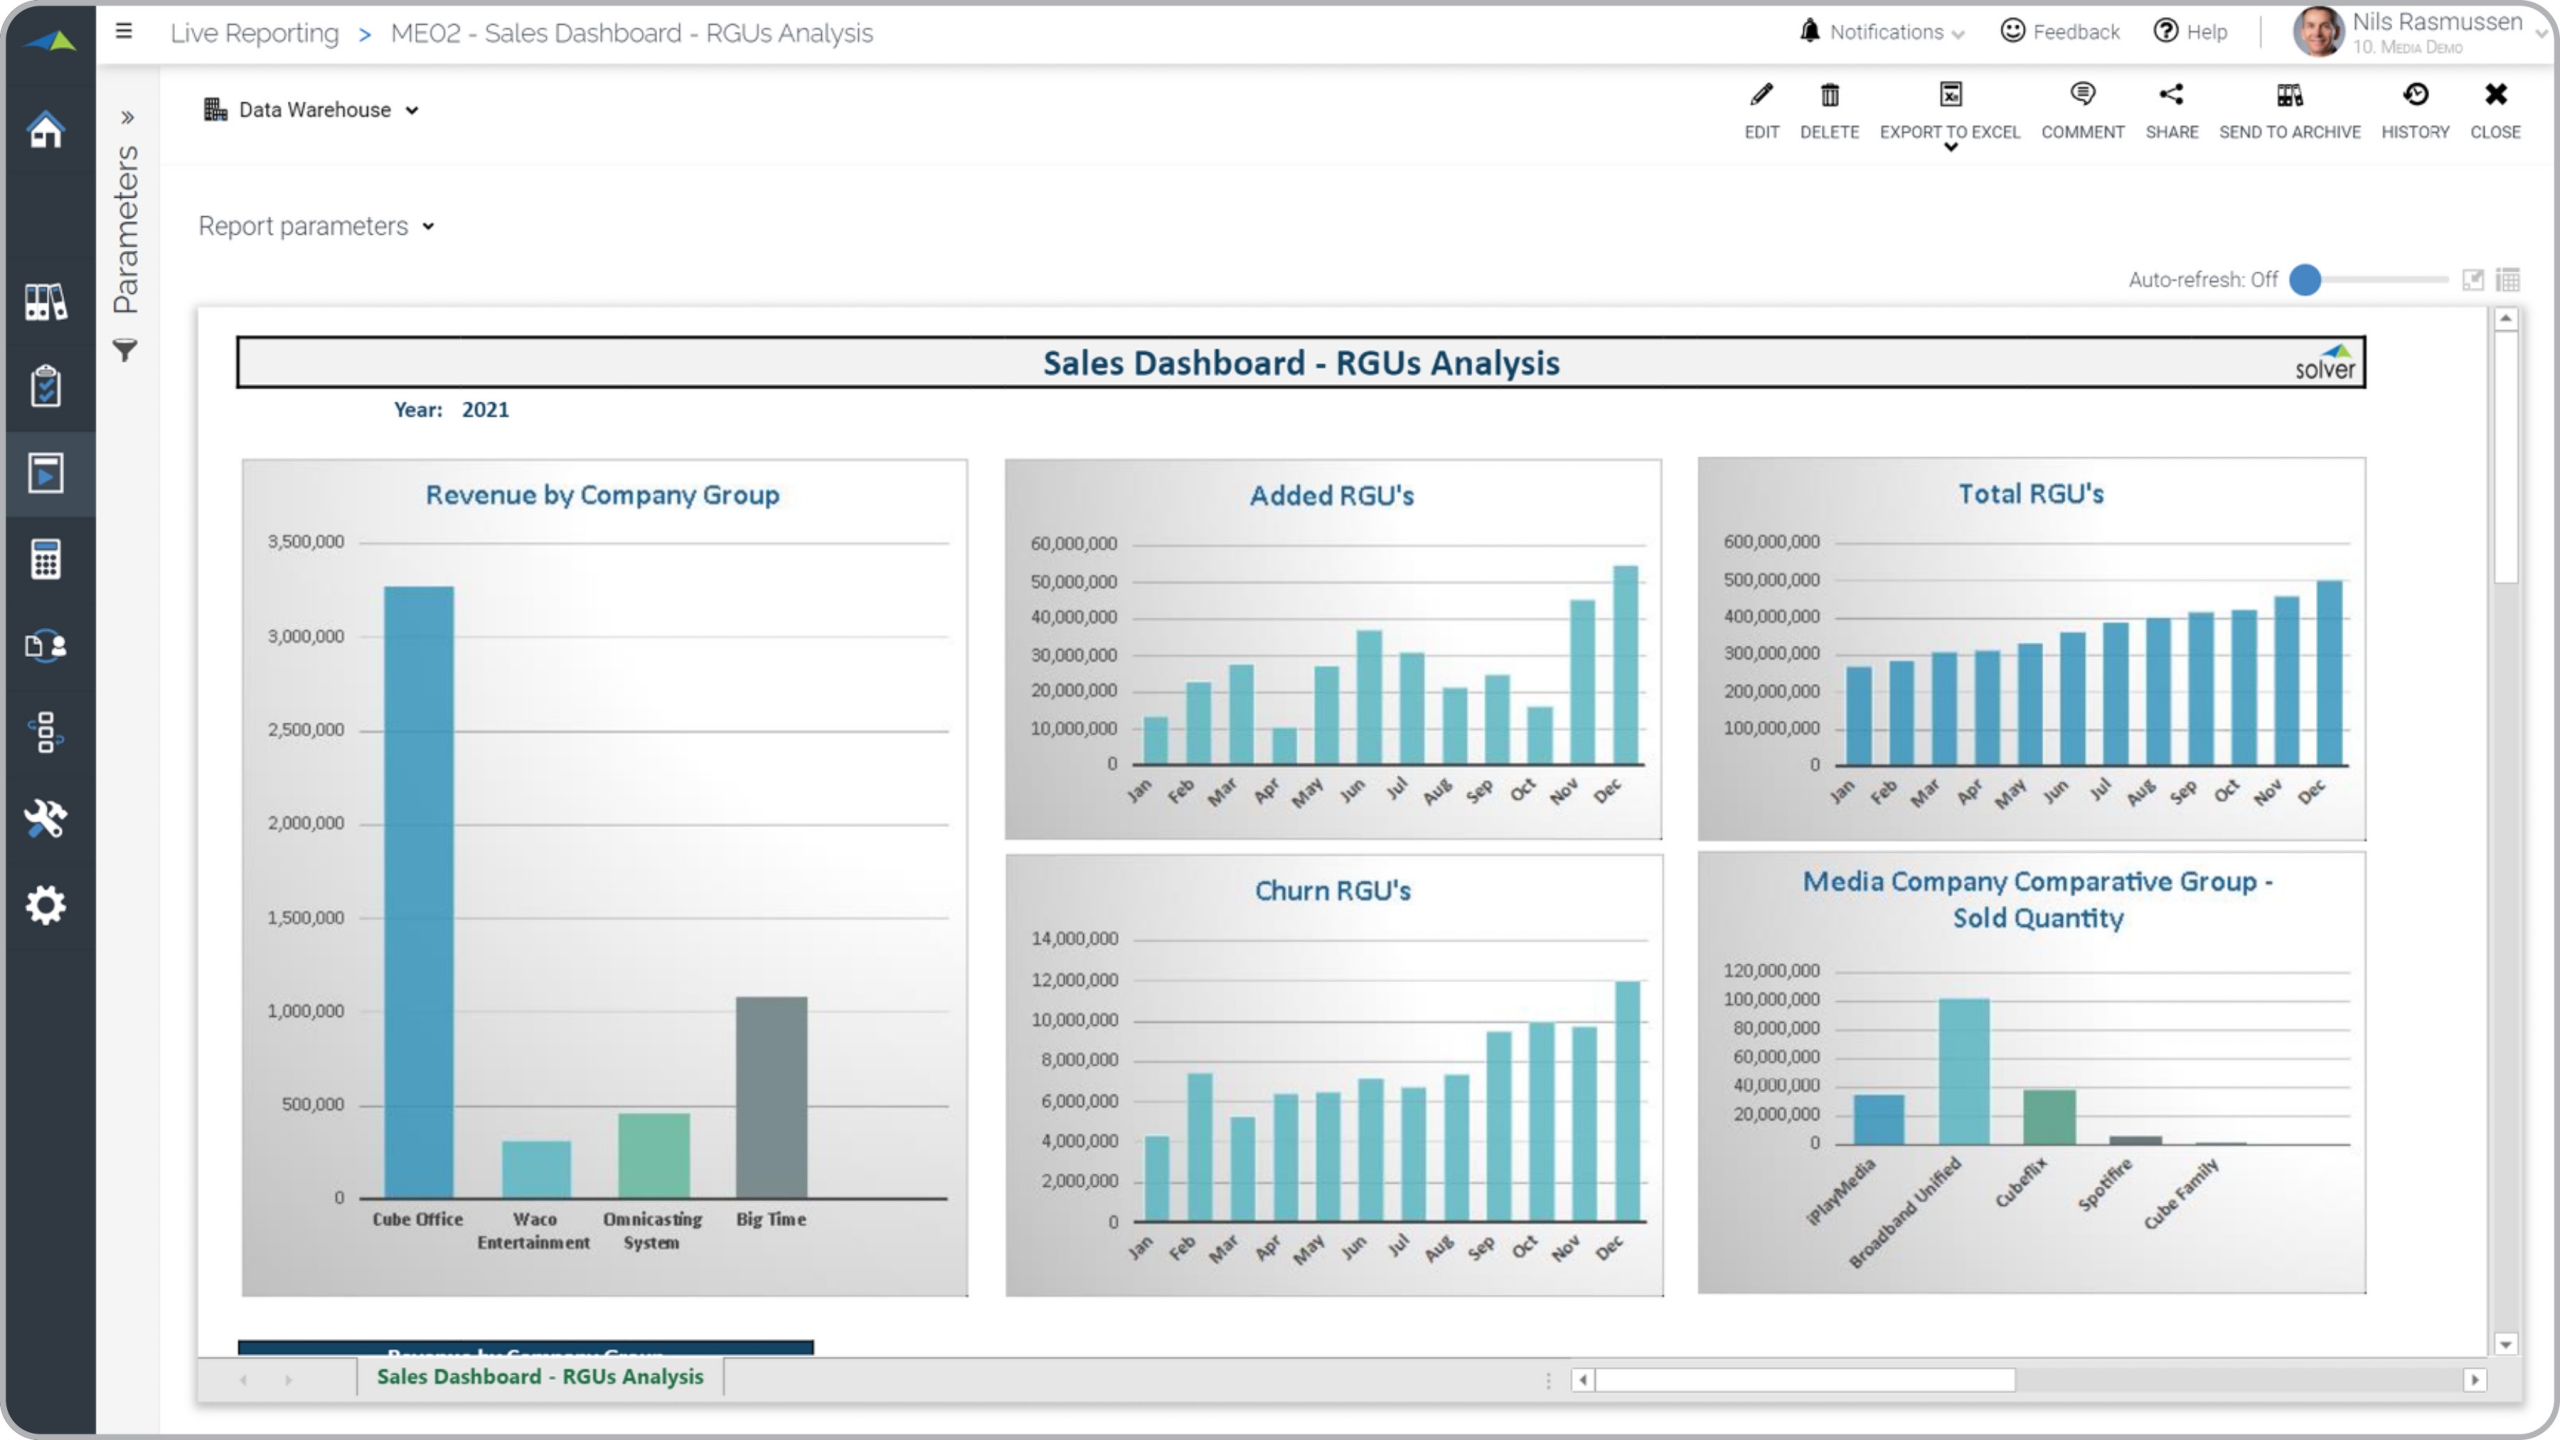
Media – RGU Sales Analysis
Added/Churn in Revenue Generating Units with total RGUs and company comparisons.
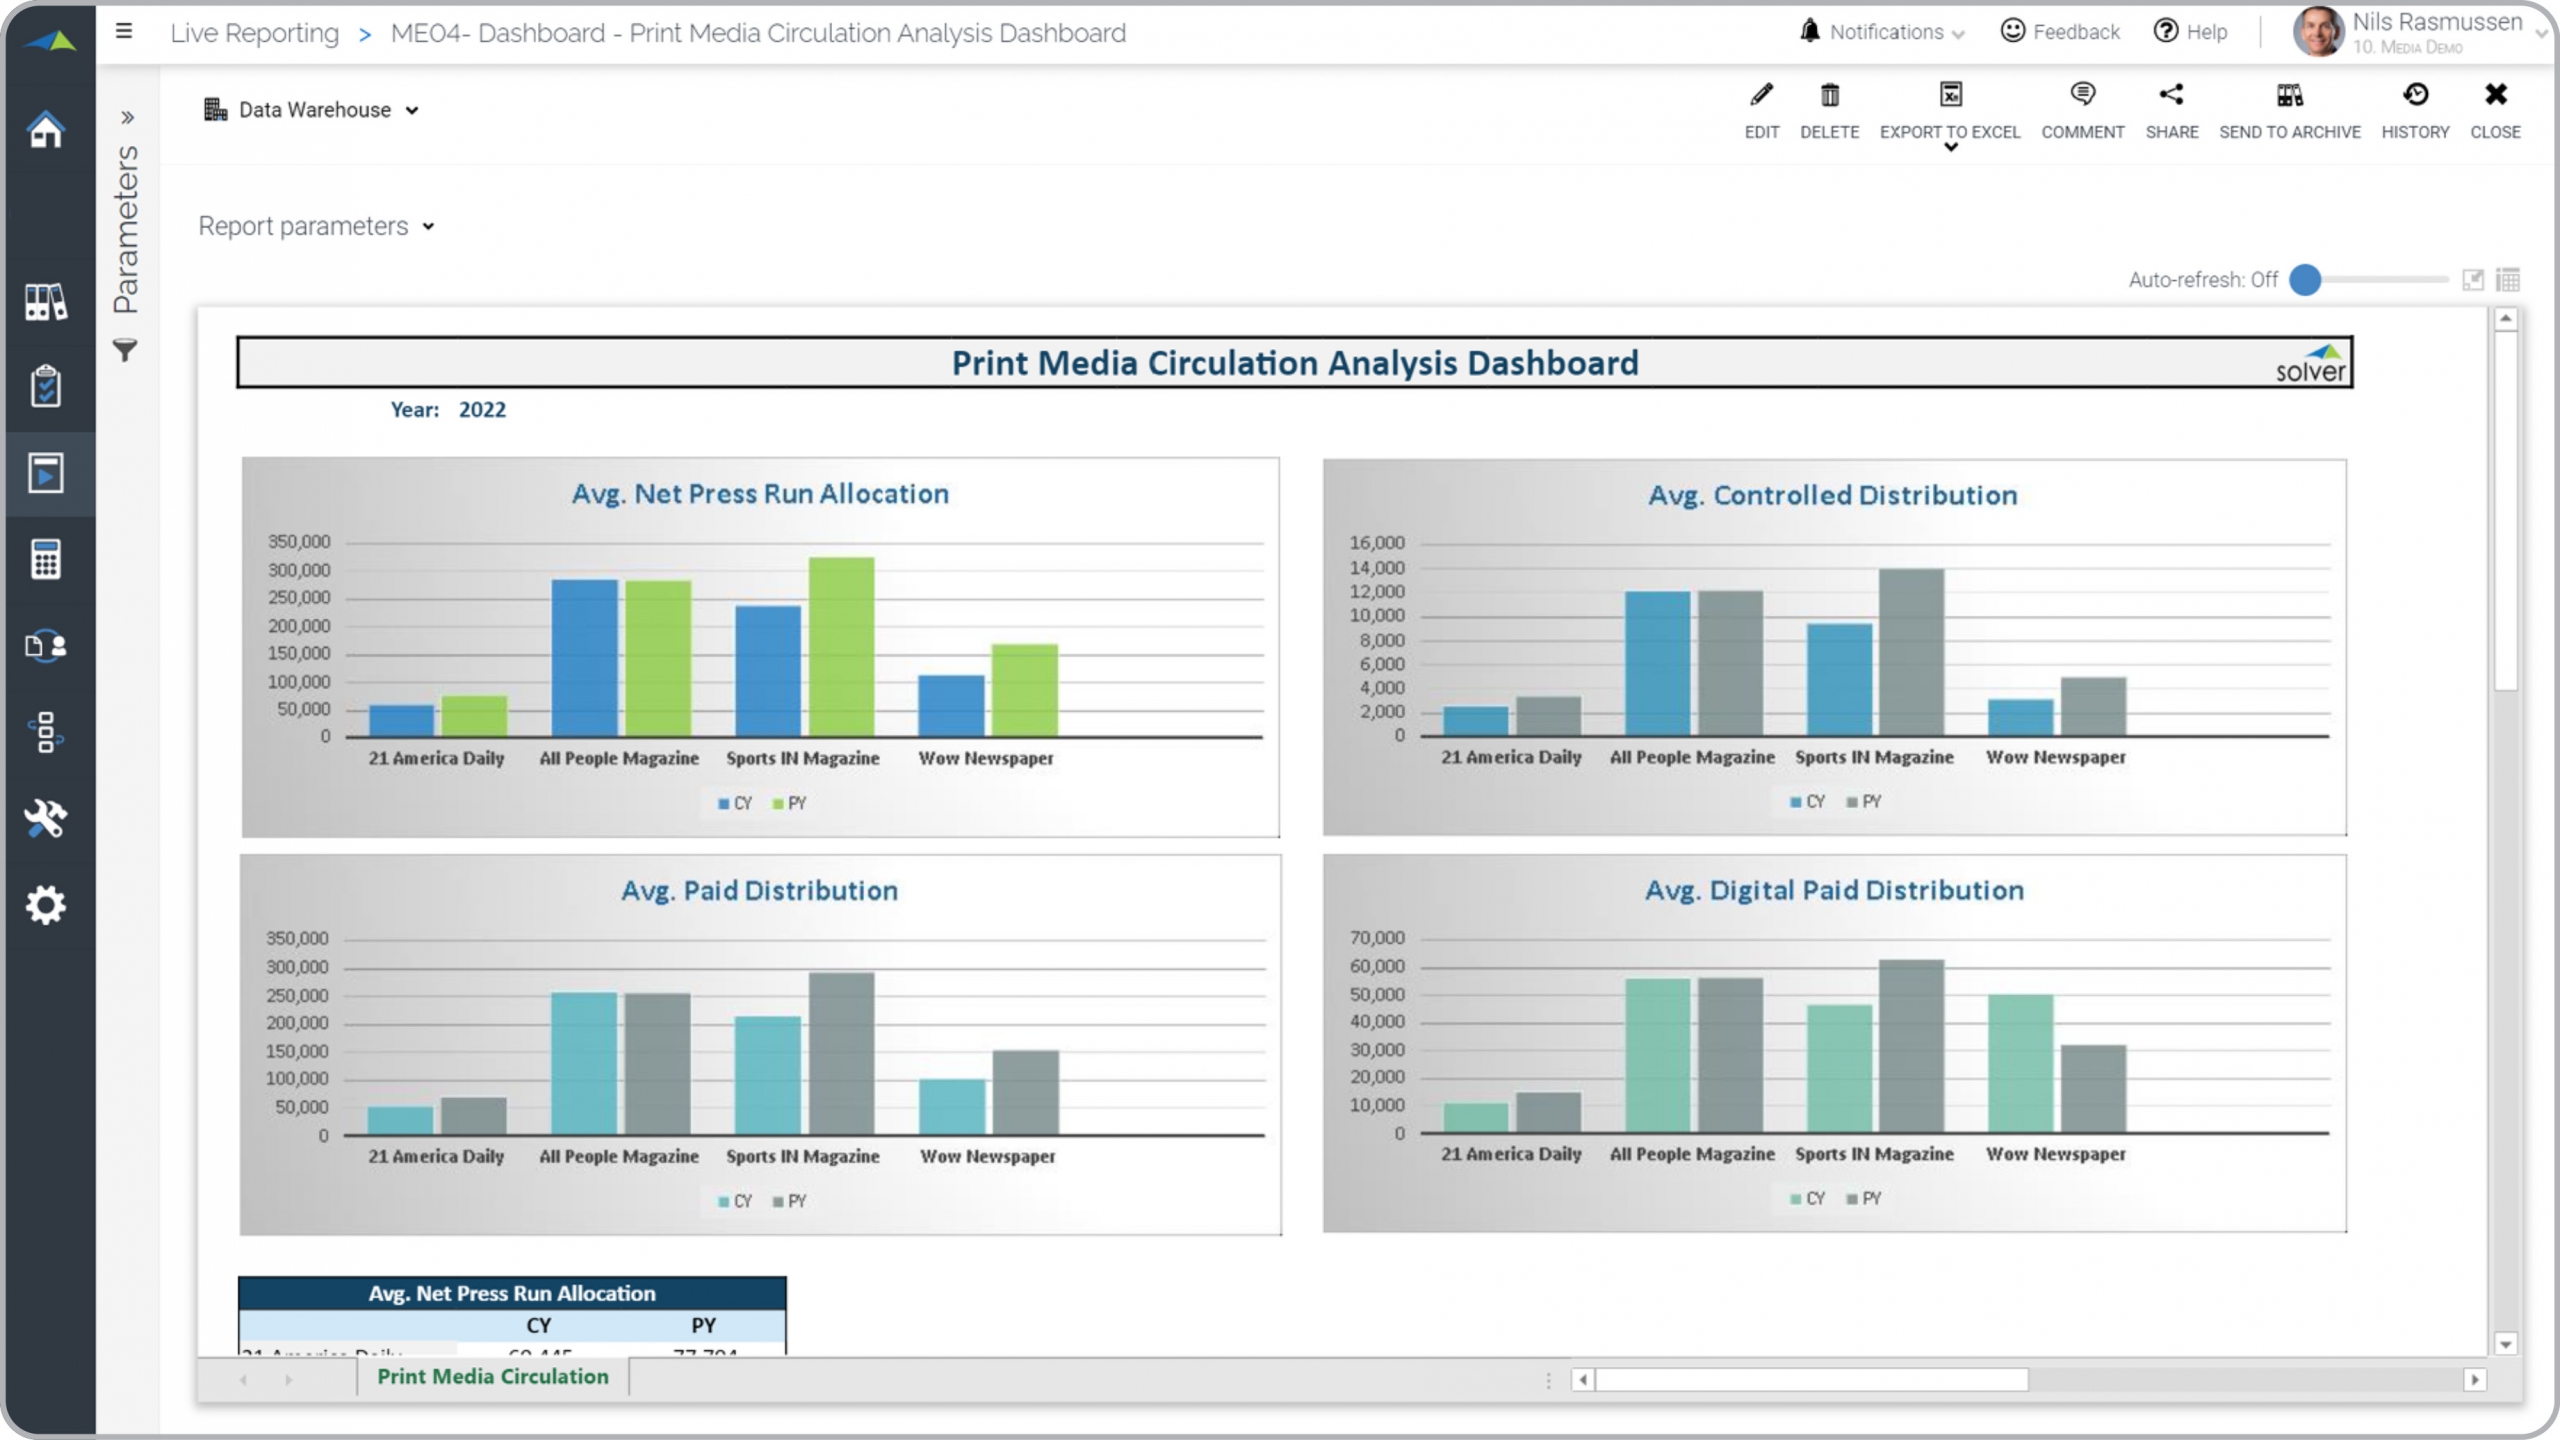
Media – Print Media Circulation Analysis
Average Net Press Run and Paid Distribution, as well as avg. controlled and digital distribution.
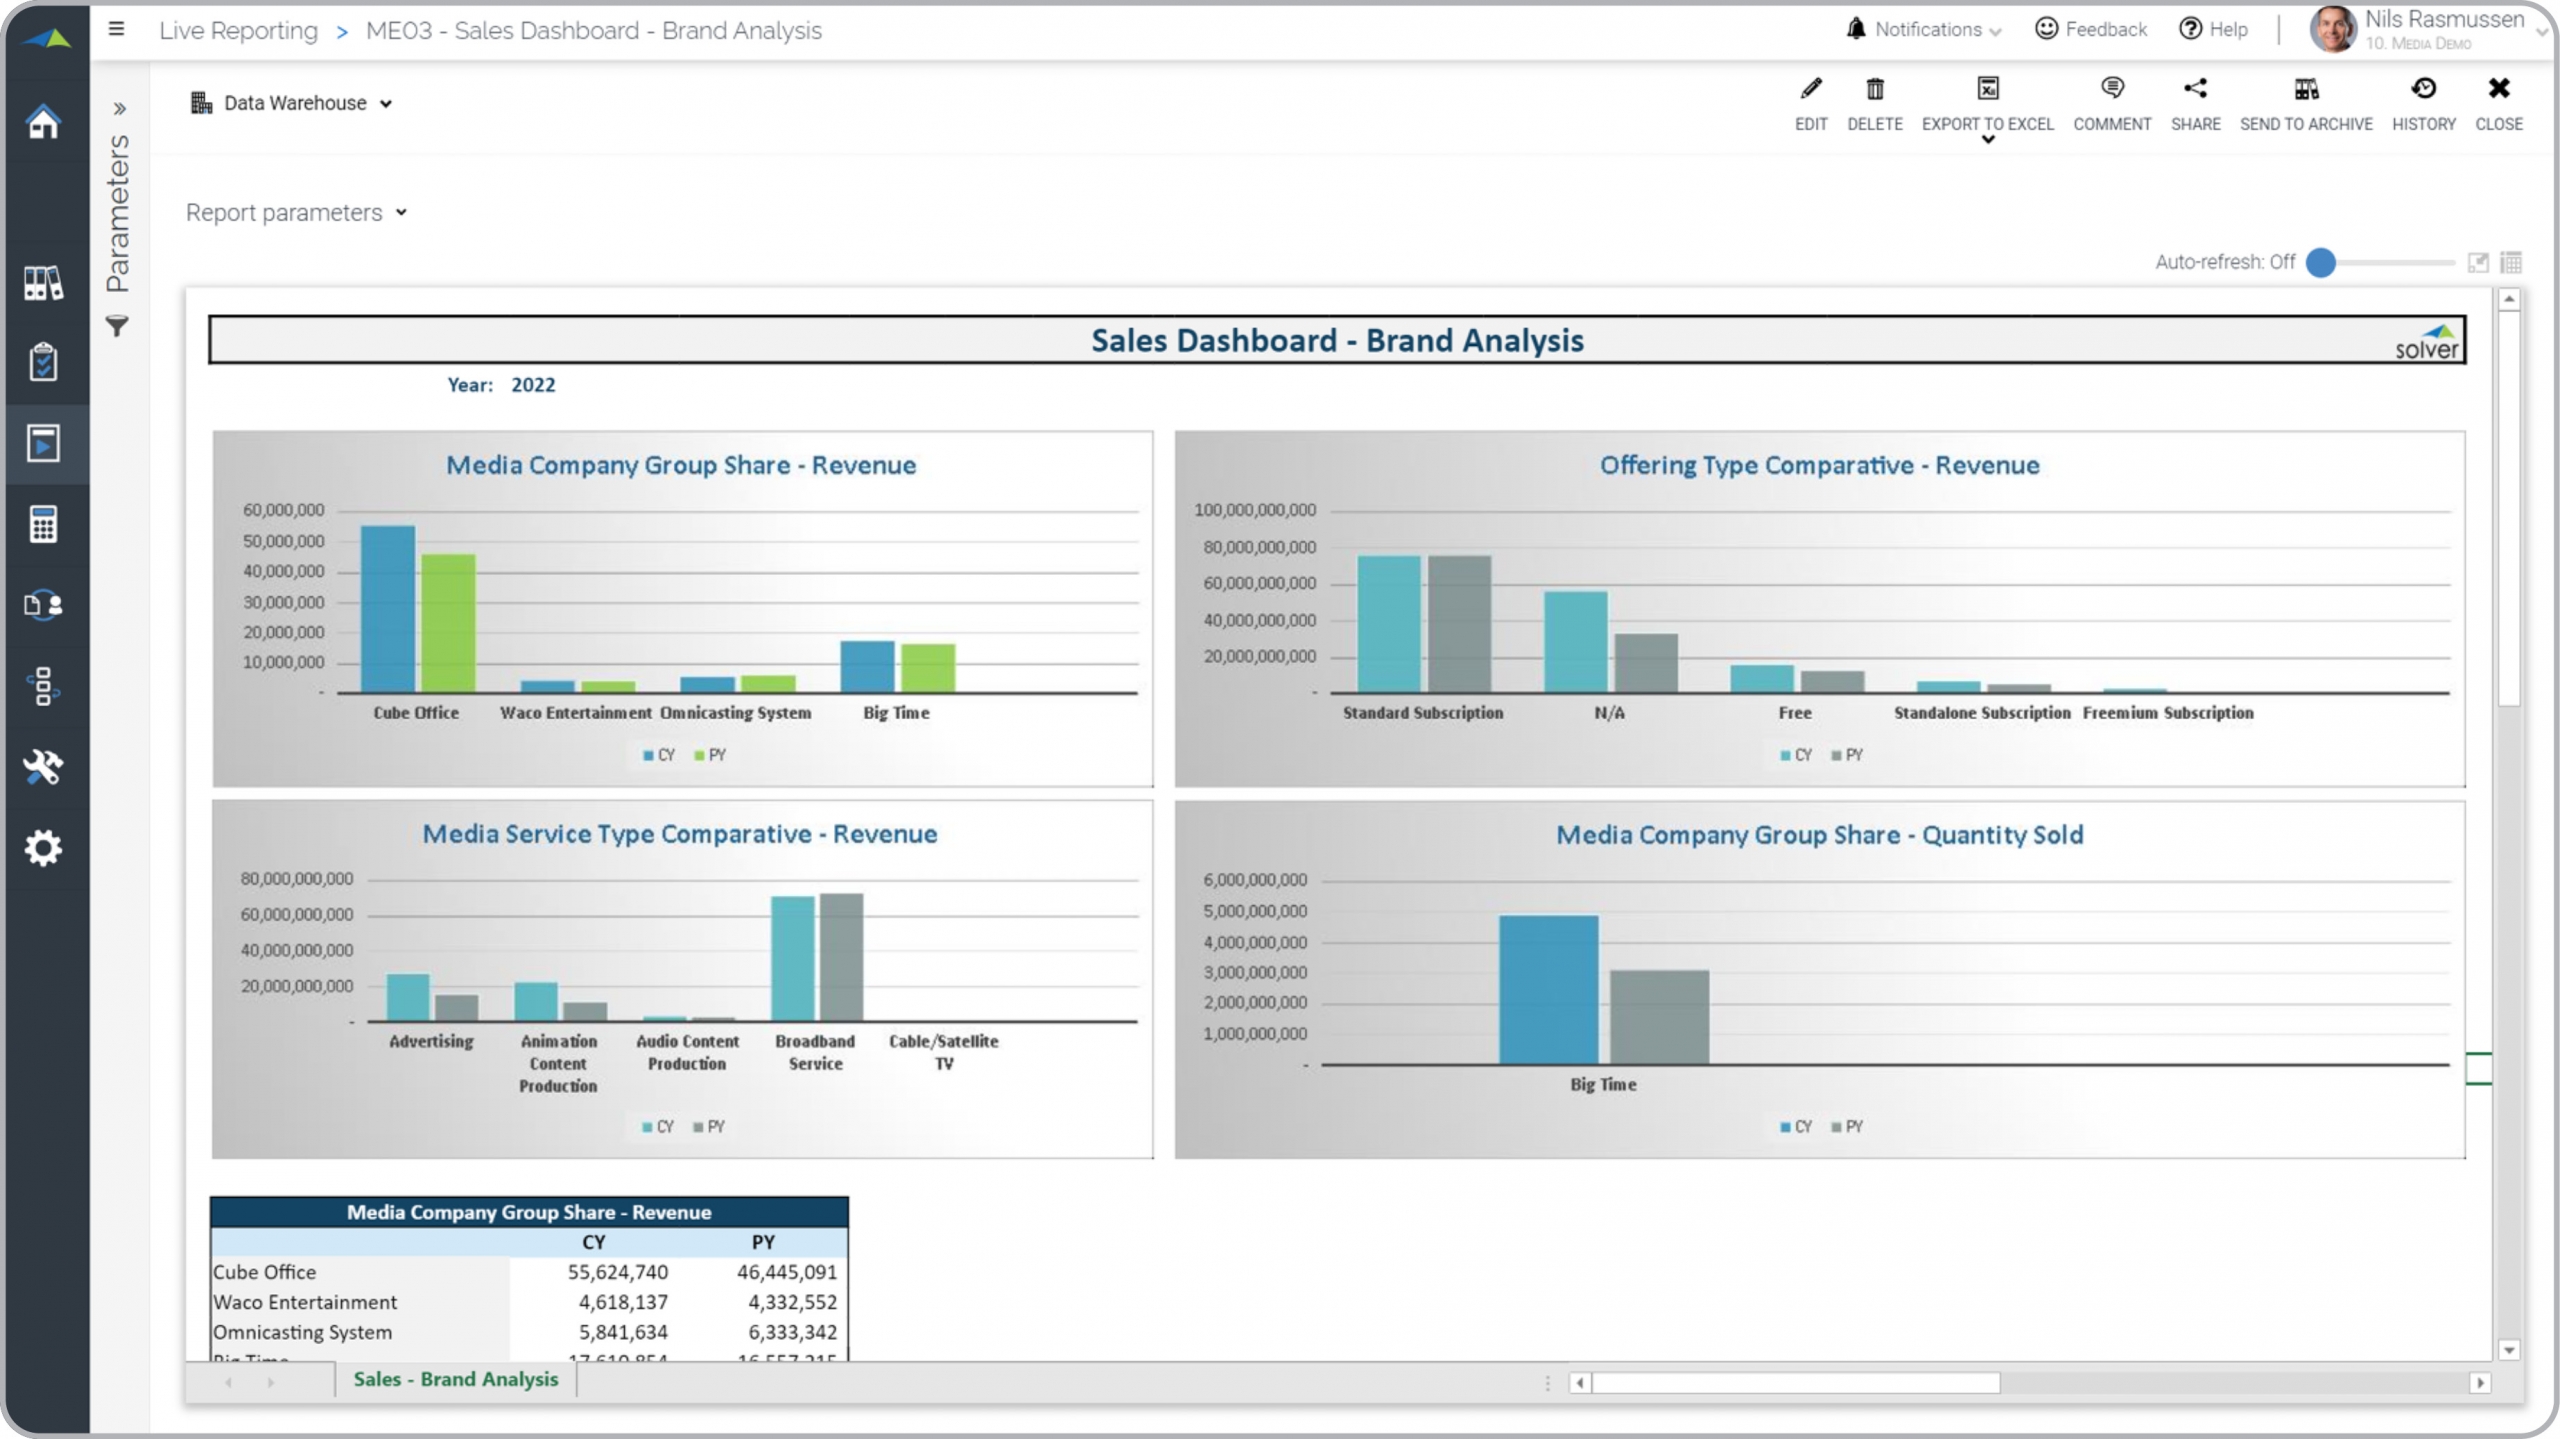
Media – Brand Sales Analysis
Sales by media company, offering type, media service type and quantity sold.
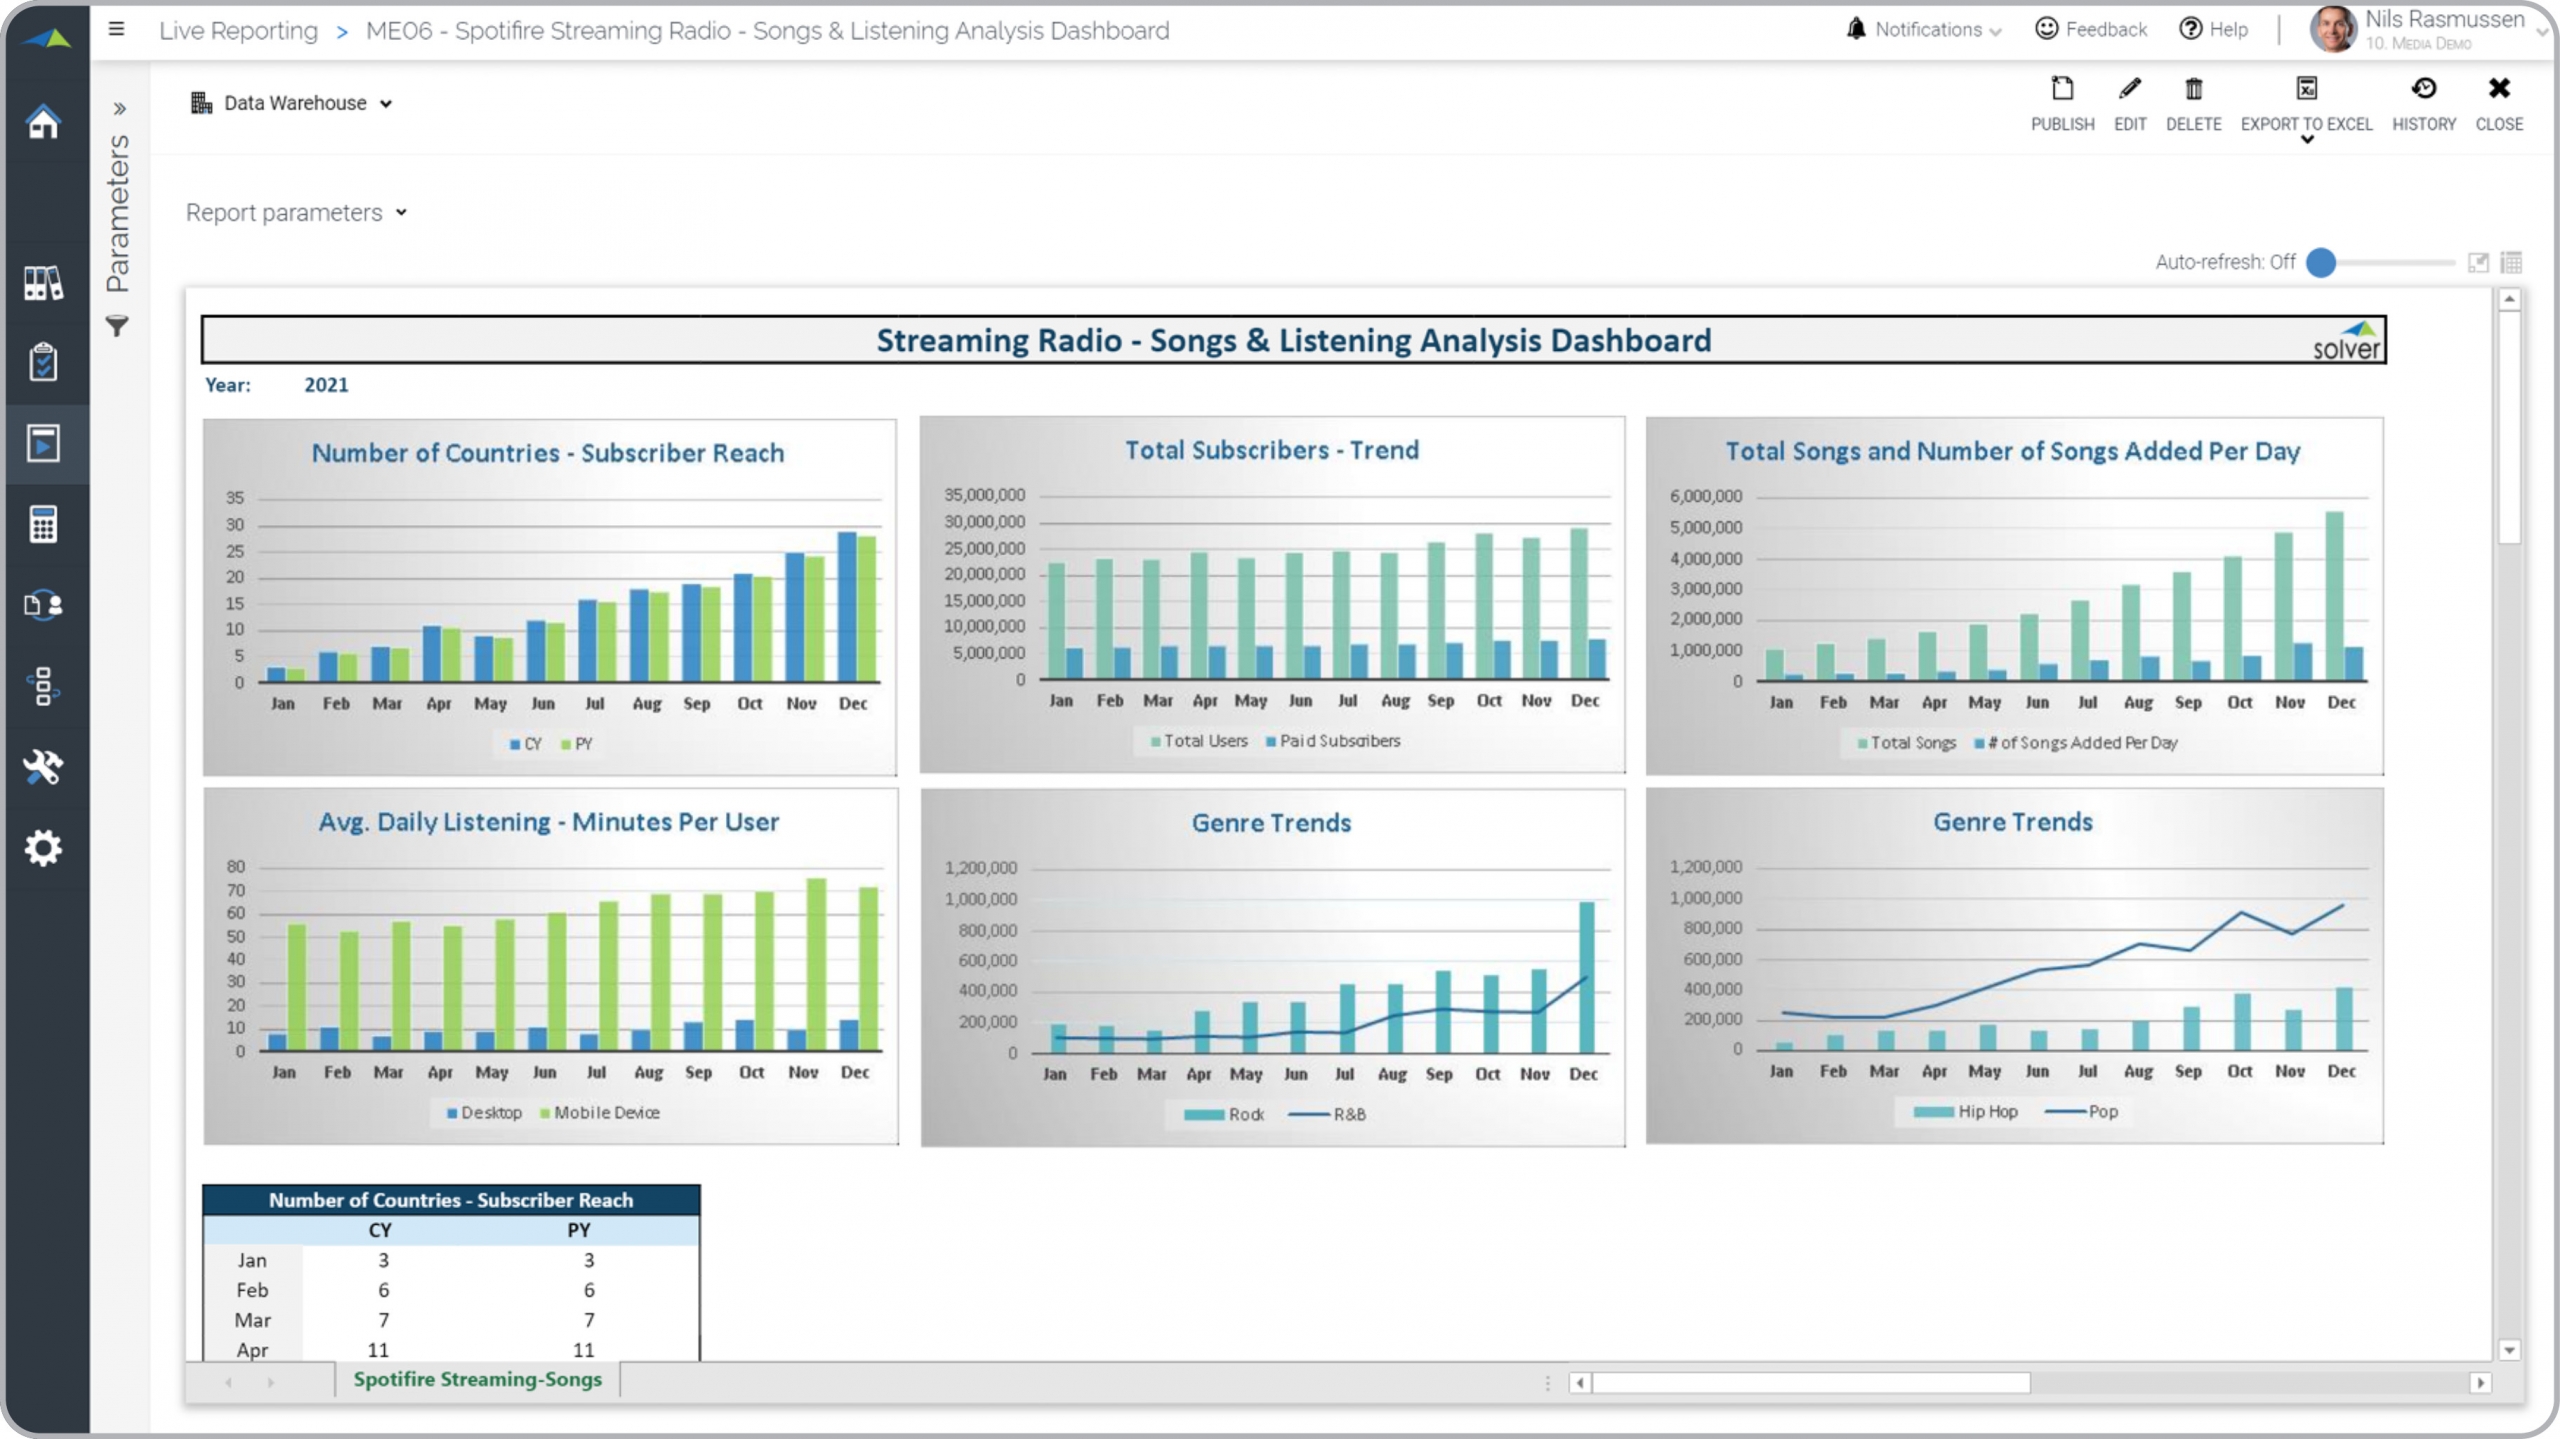
Media – Songs and Listening Analysis
Monthly trend analysis for song and listening KPIs.
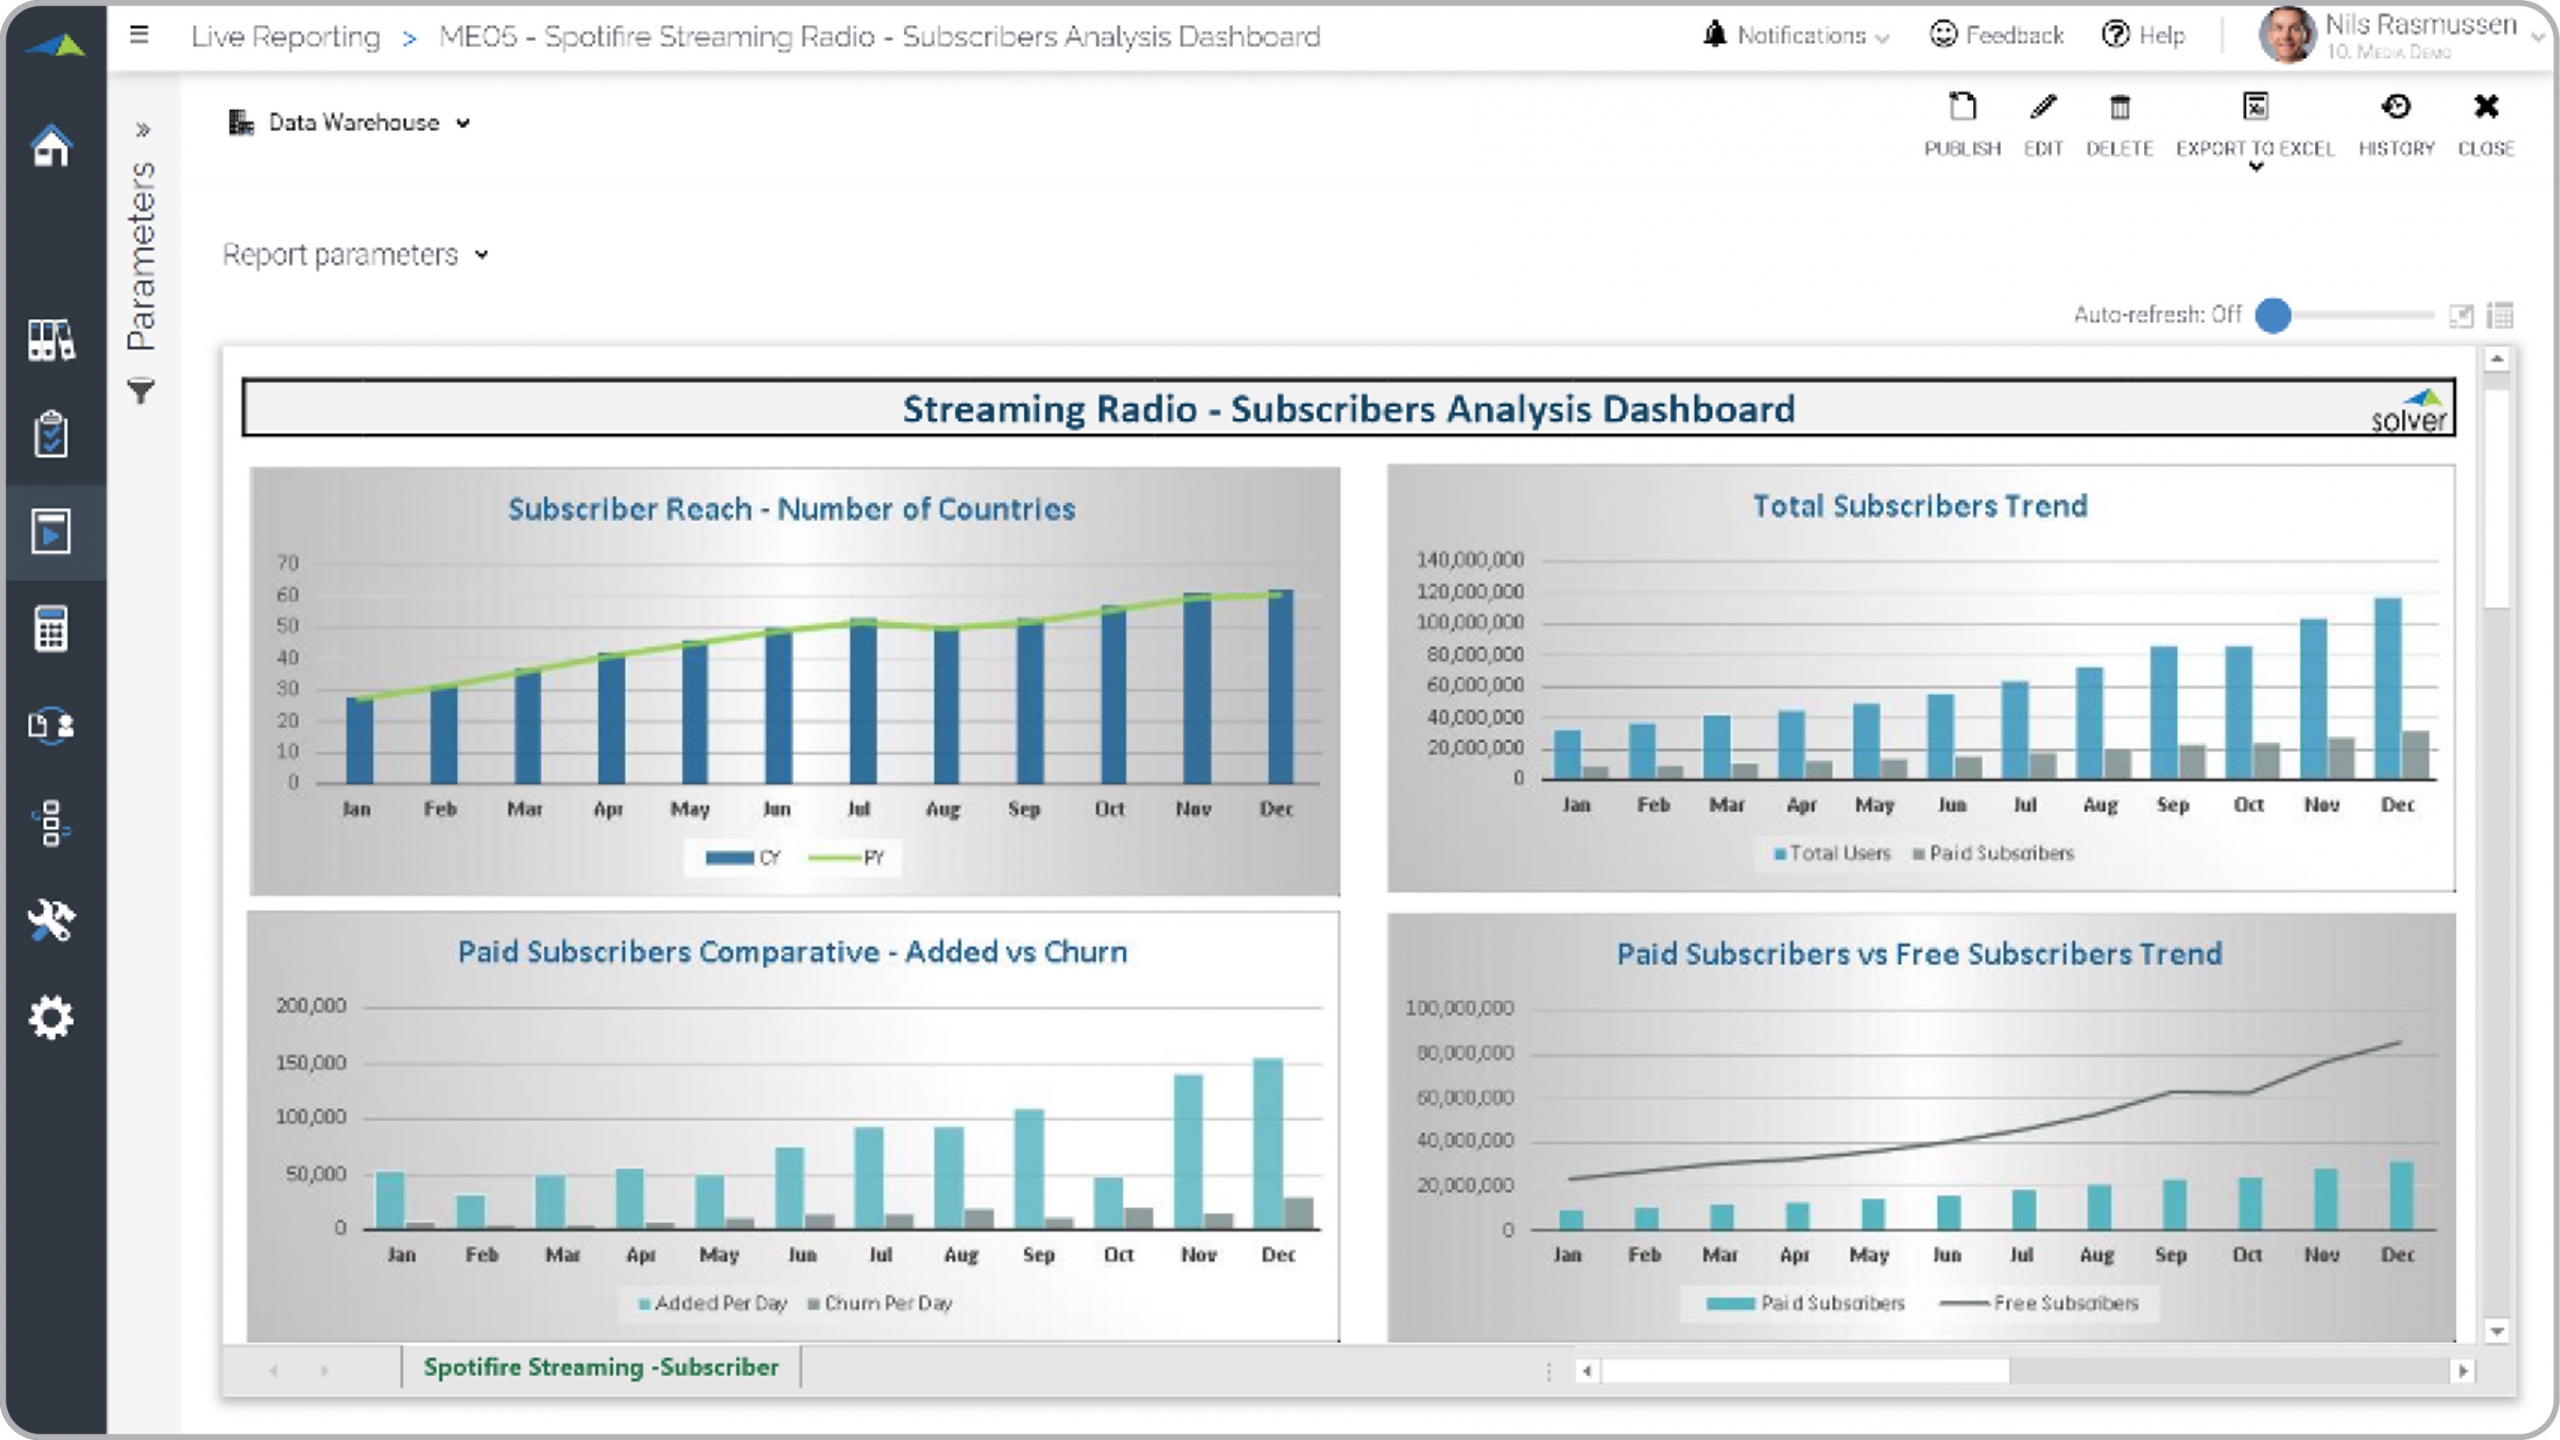
Media – Streaming Radio Analysis
Trend charts for Streaming KPIs like subscriber reach, paid vs free subscribers, added vs churn.
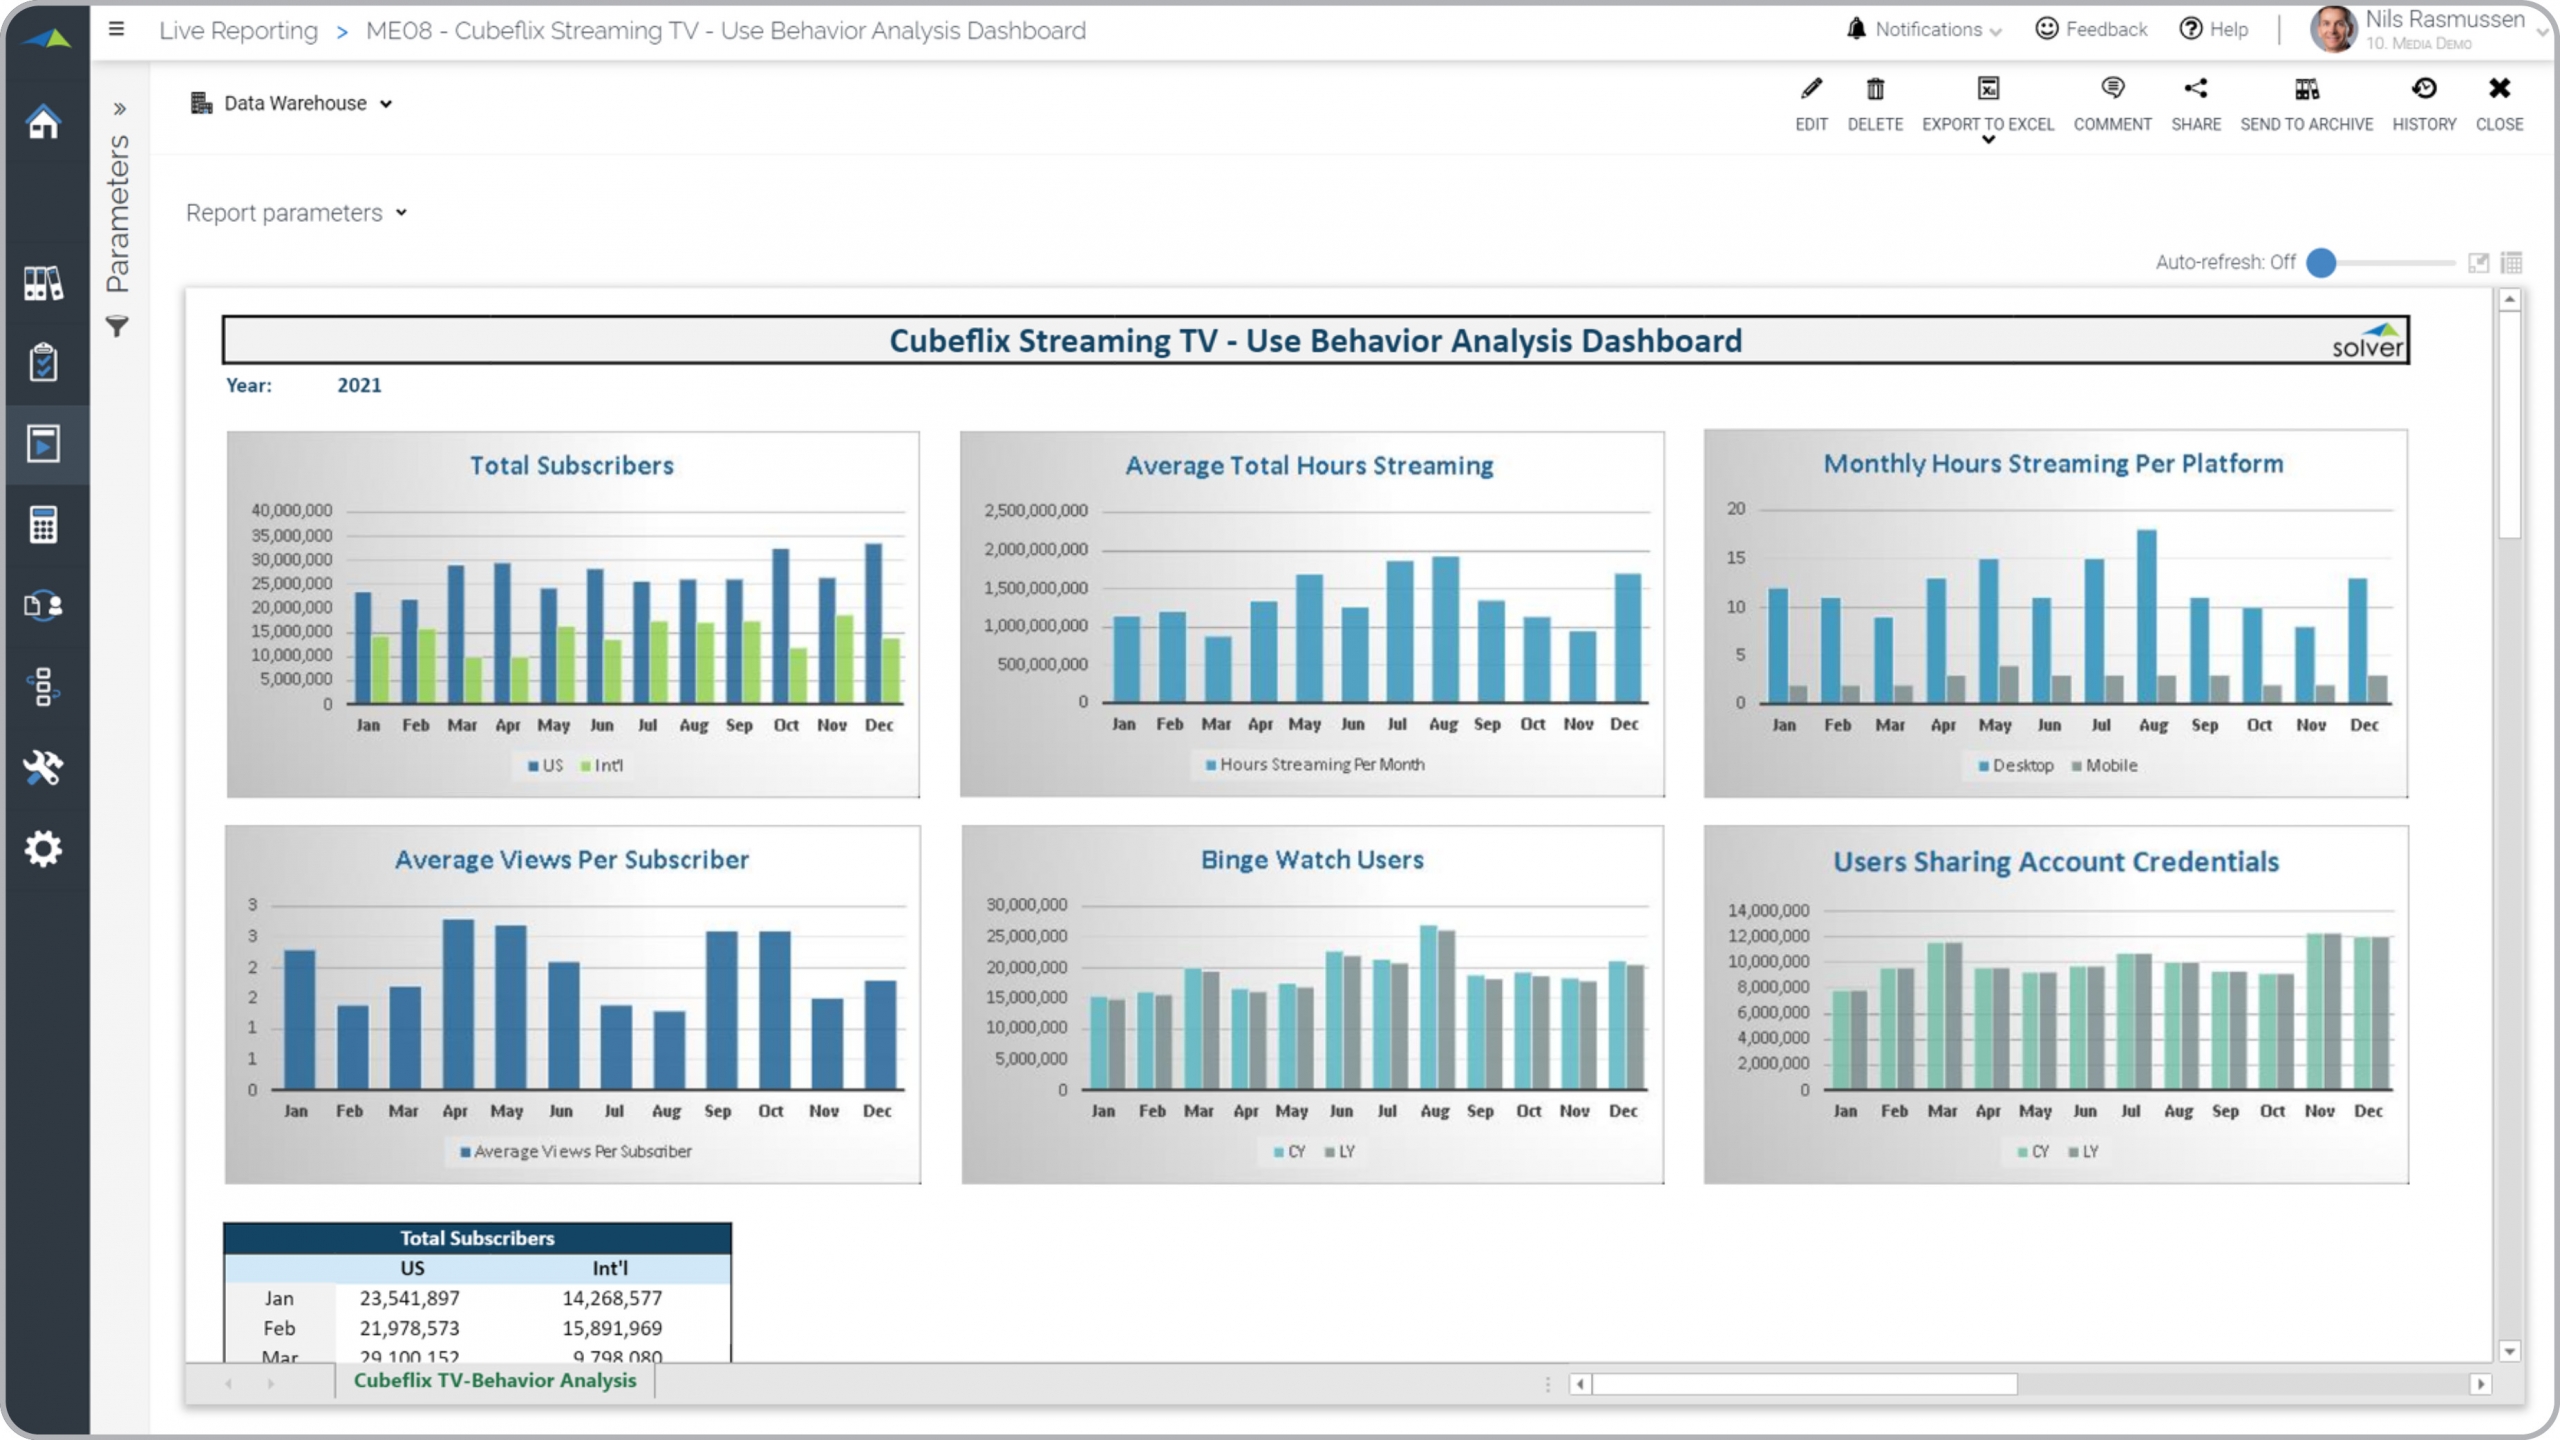
Media – Use Behavior Analysis
Monthly trend analysis for use behavior like binge watching, hours of streaming, etc.
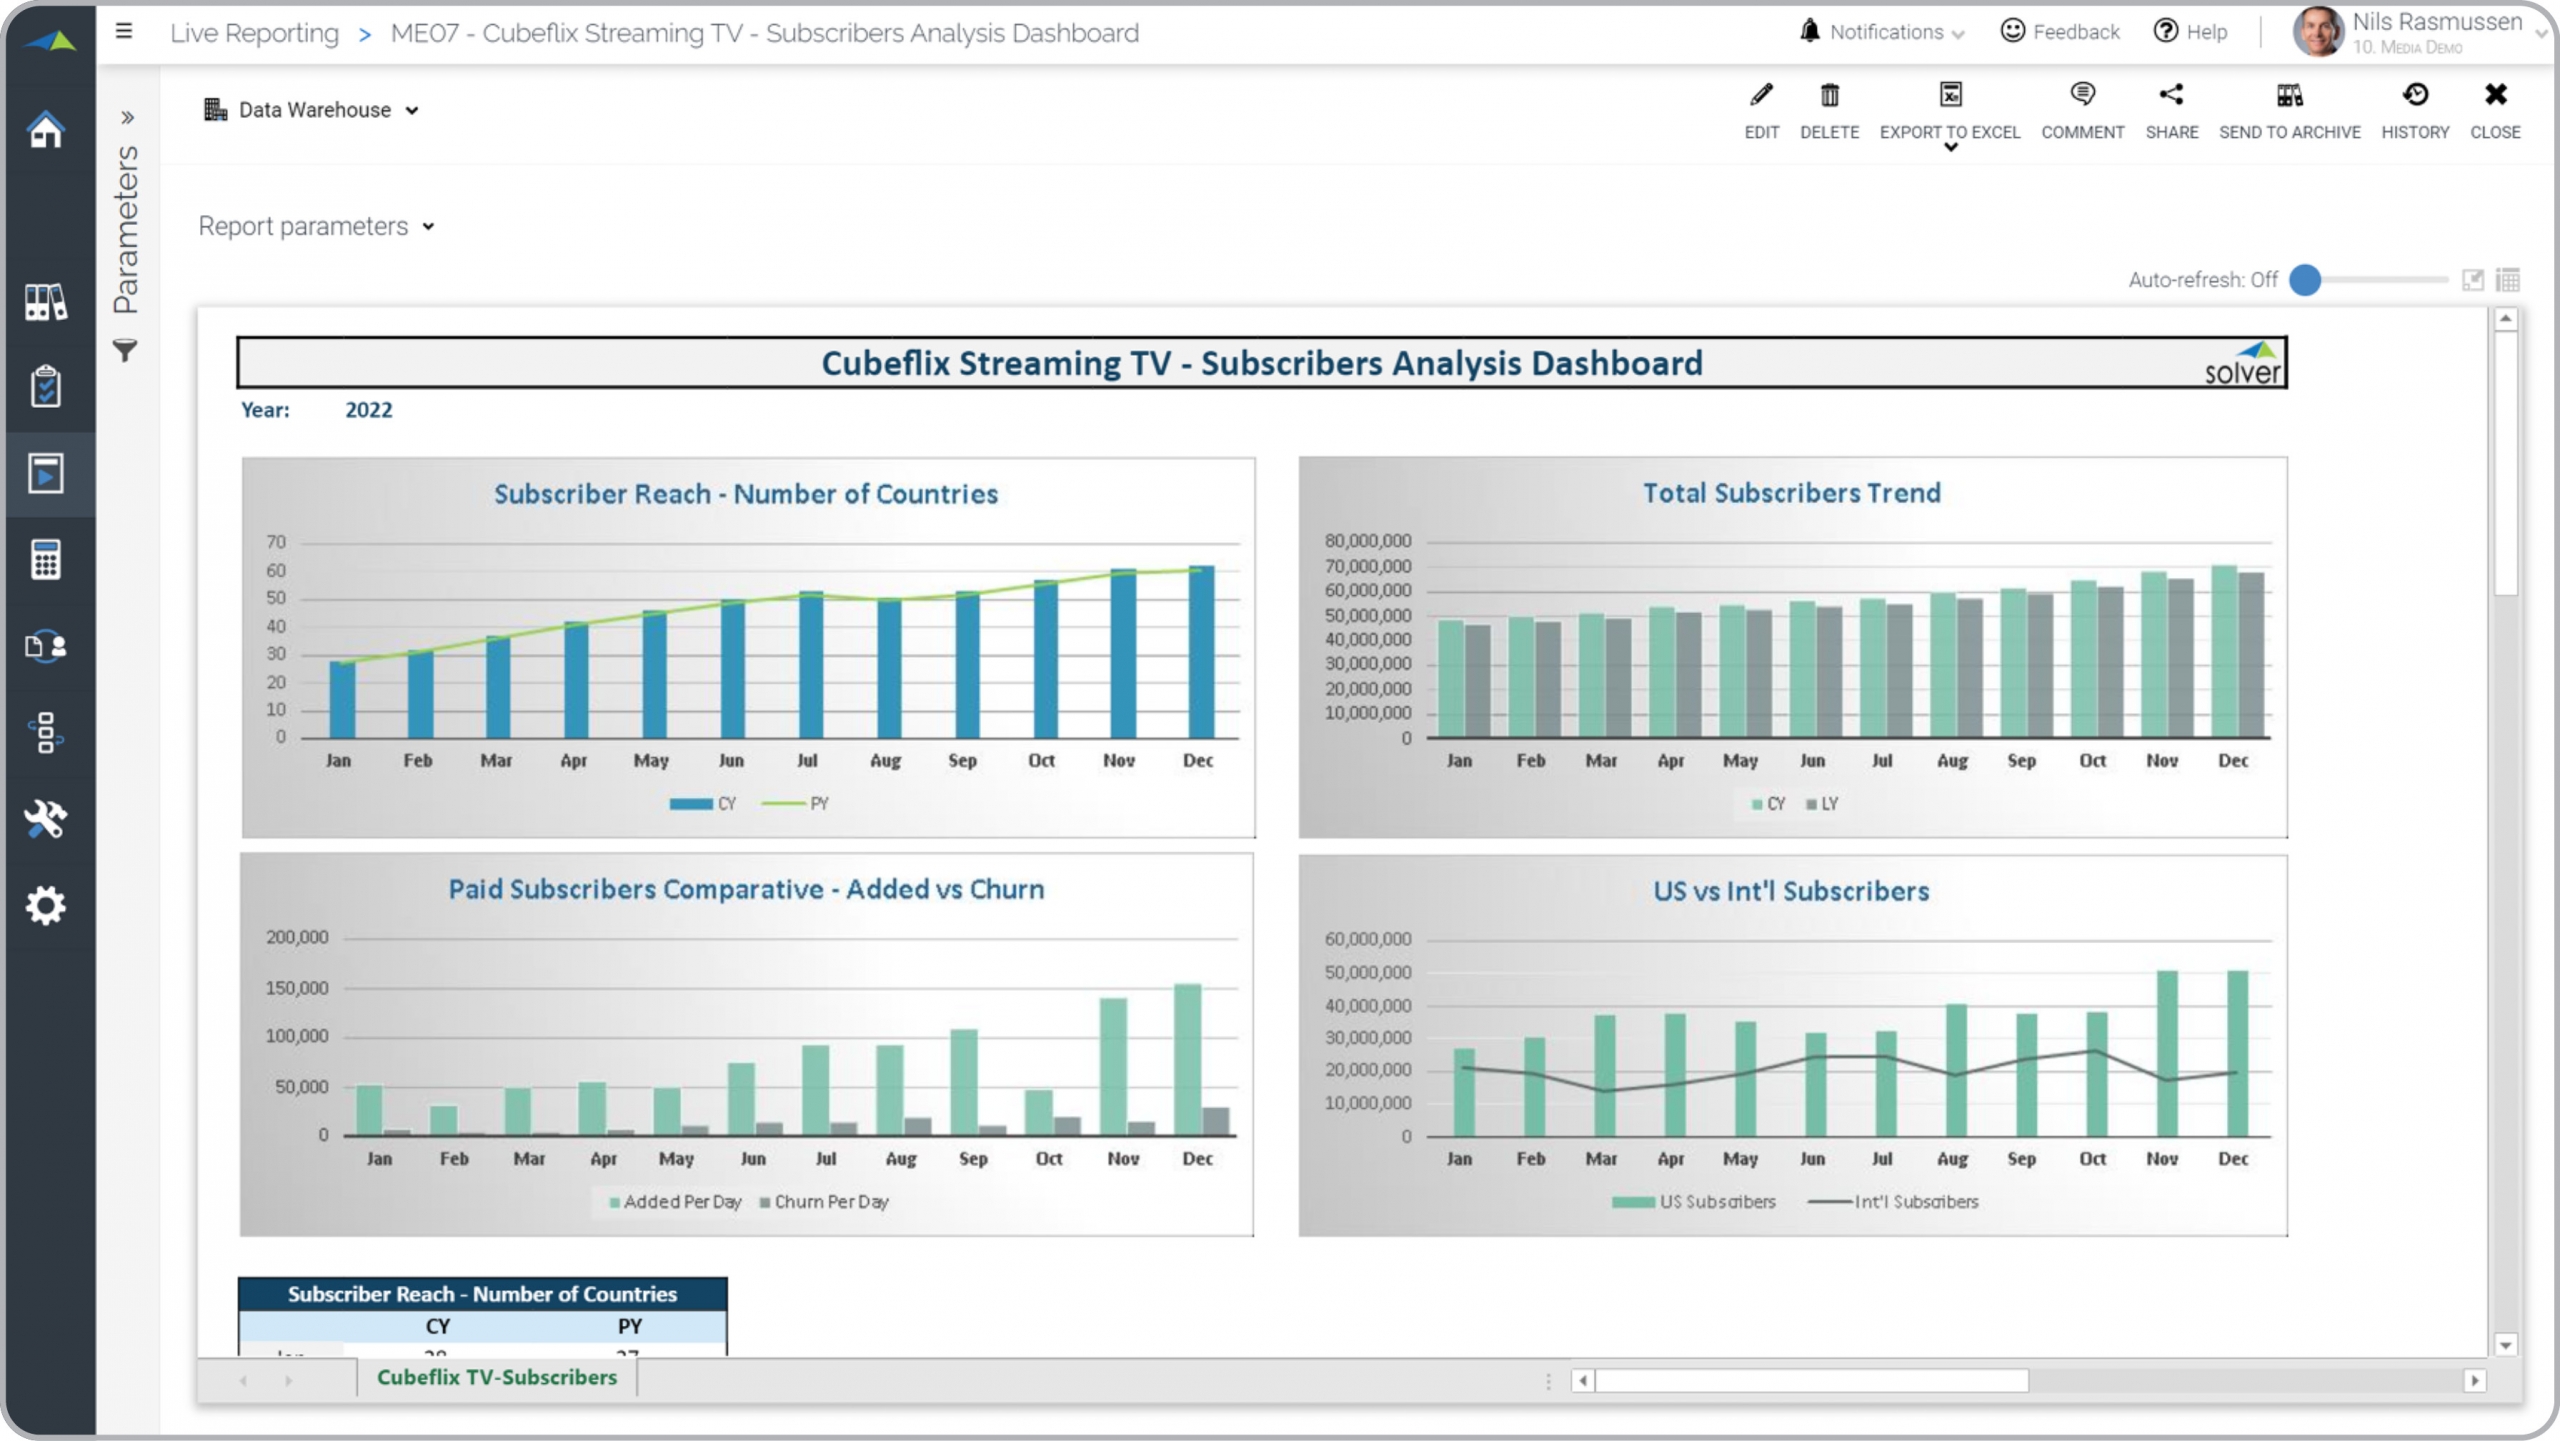
Media – Streaming TV Analysis
Subscriber trends for streaming TV KPIs like local vs int'l, reach, and added vs churn.
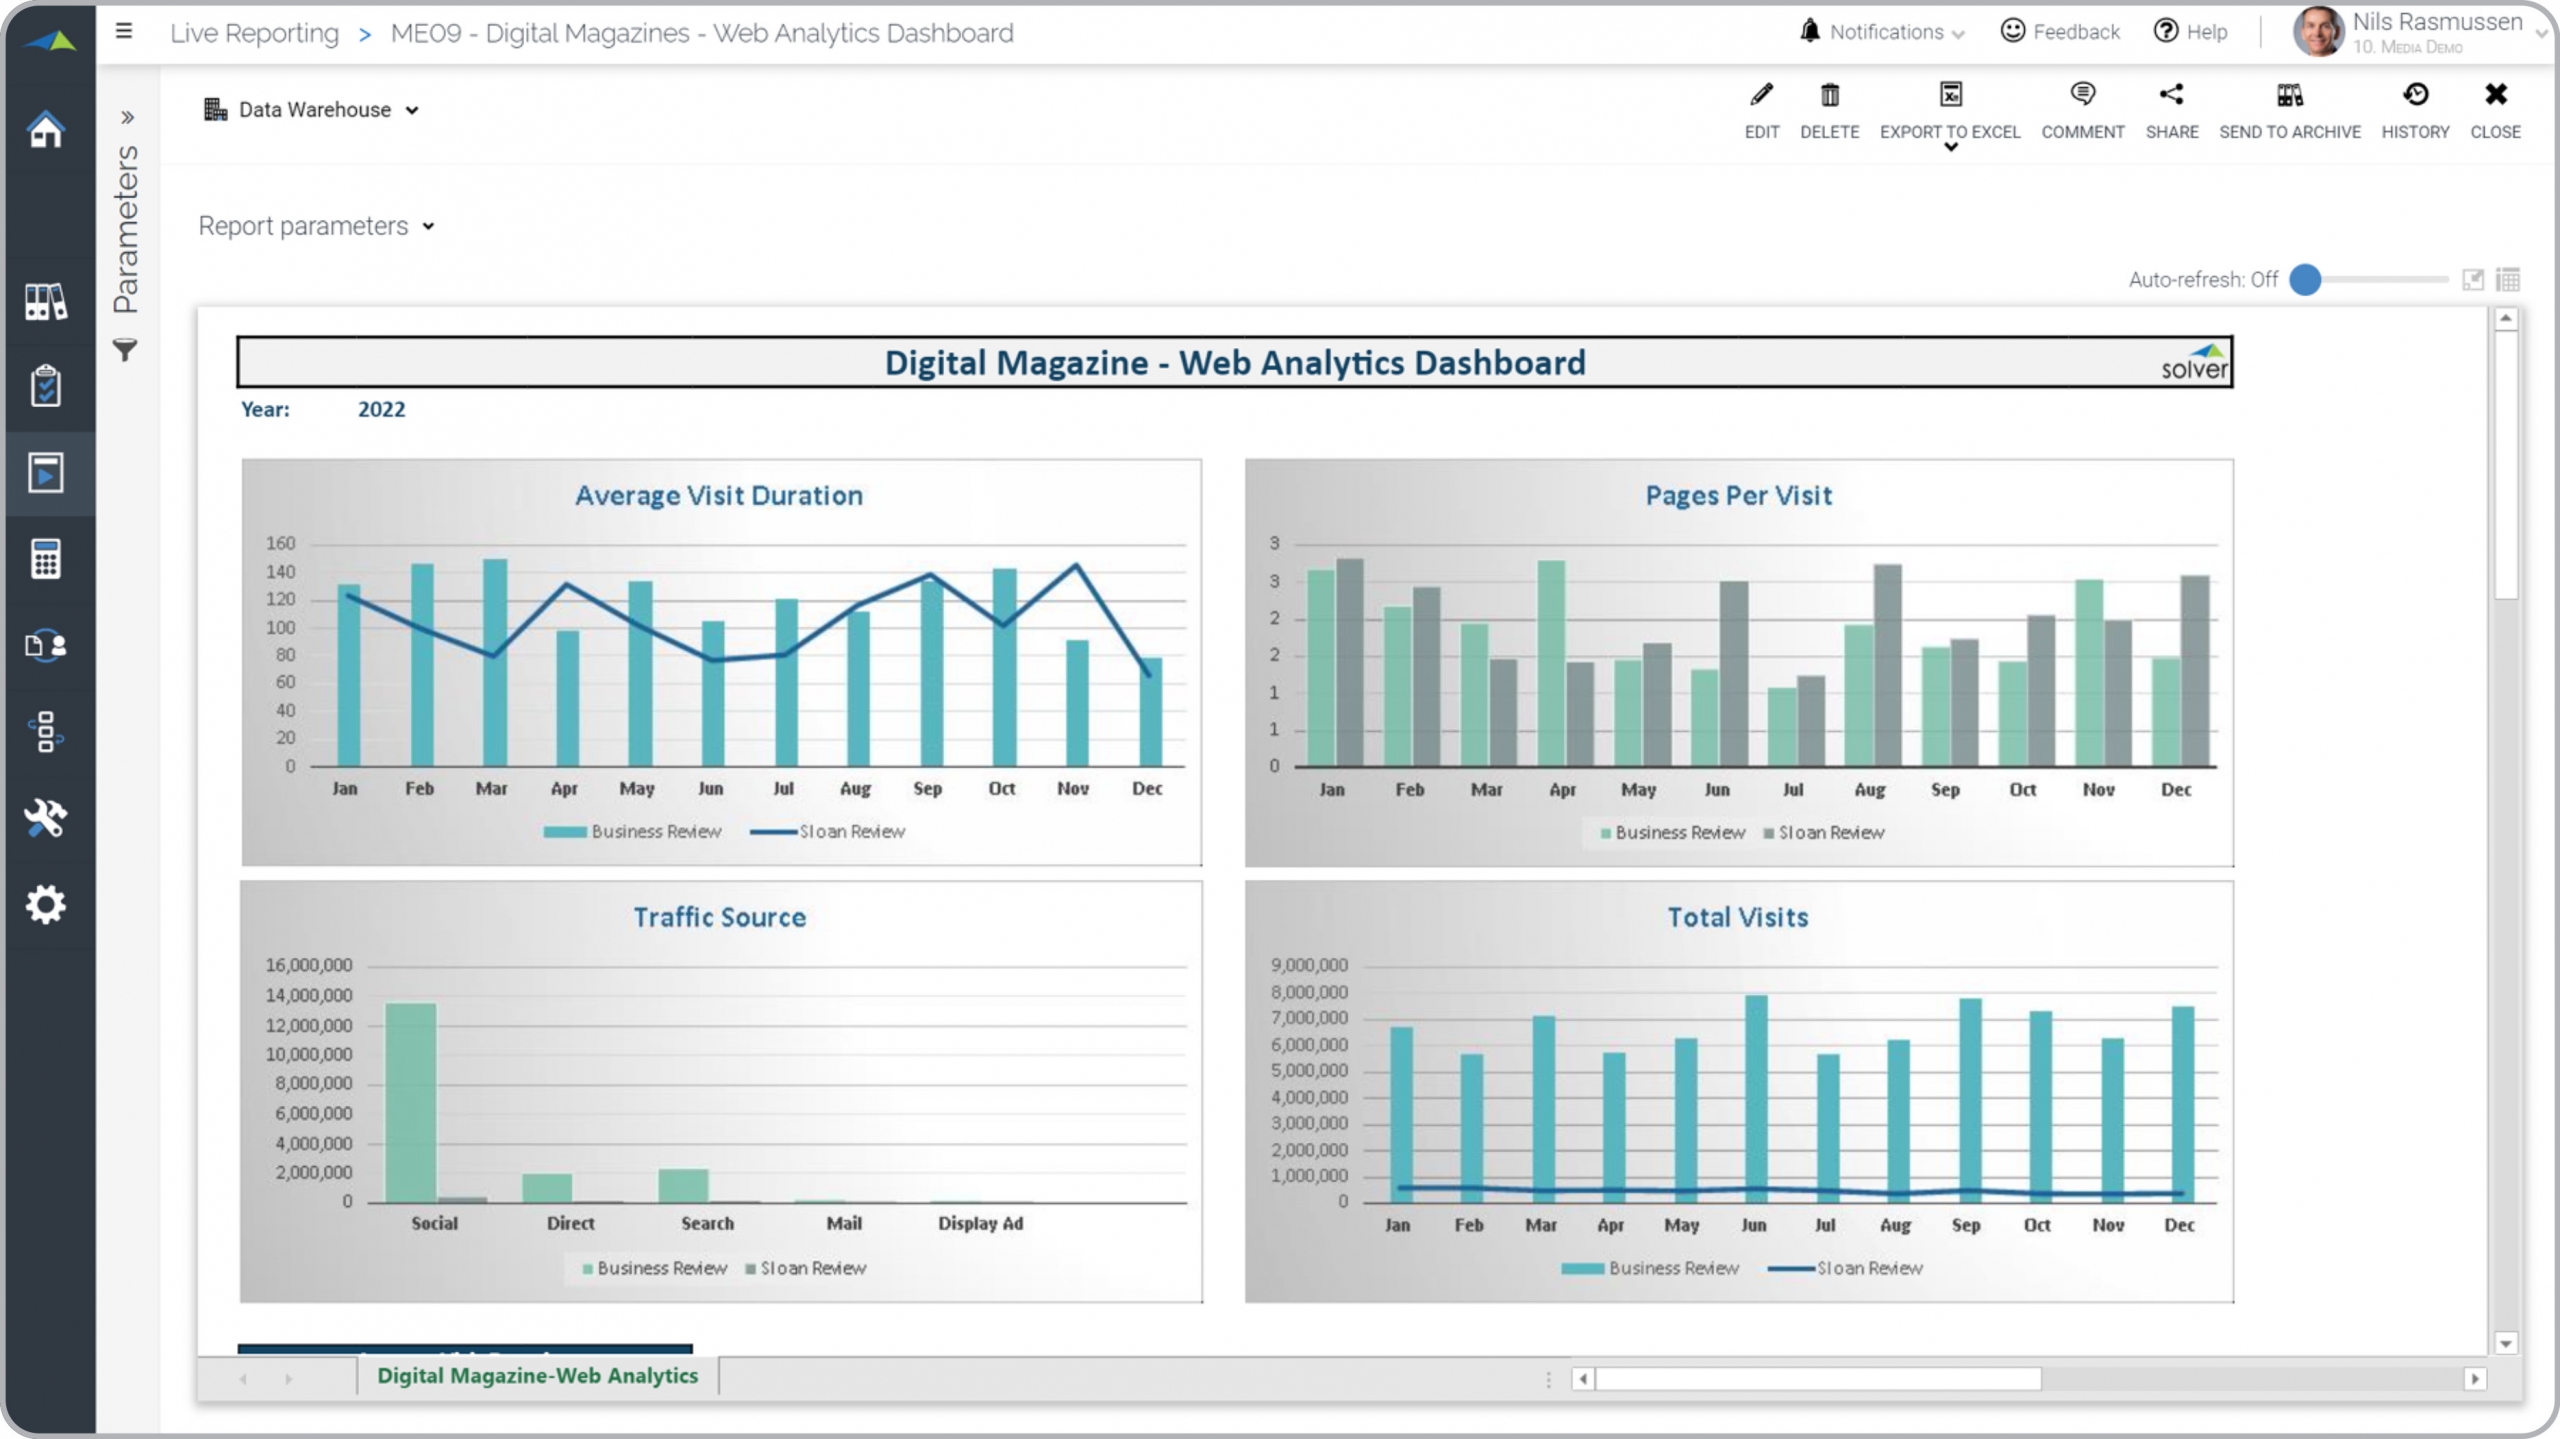
Media – Digital Magazine Analysis
Dashboard with web metrics like visits, pages per visit, traffic source and duration.
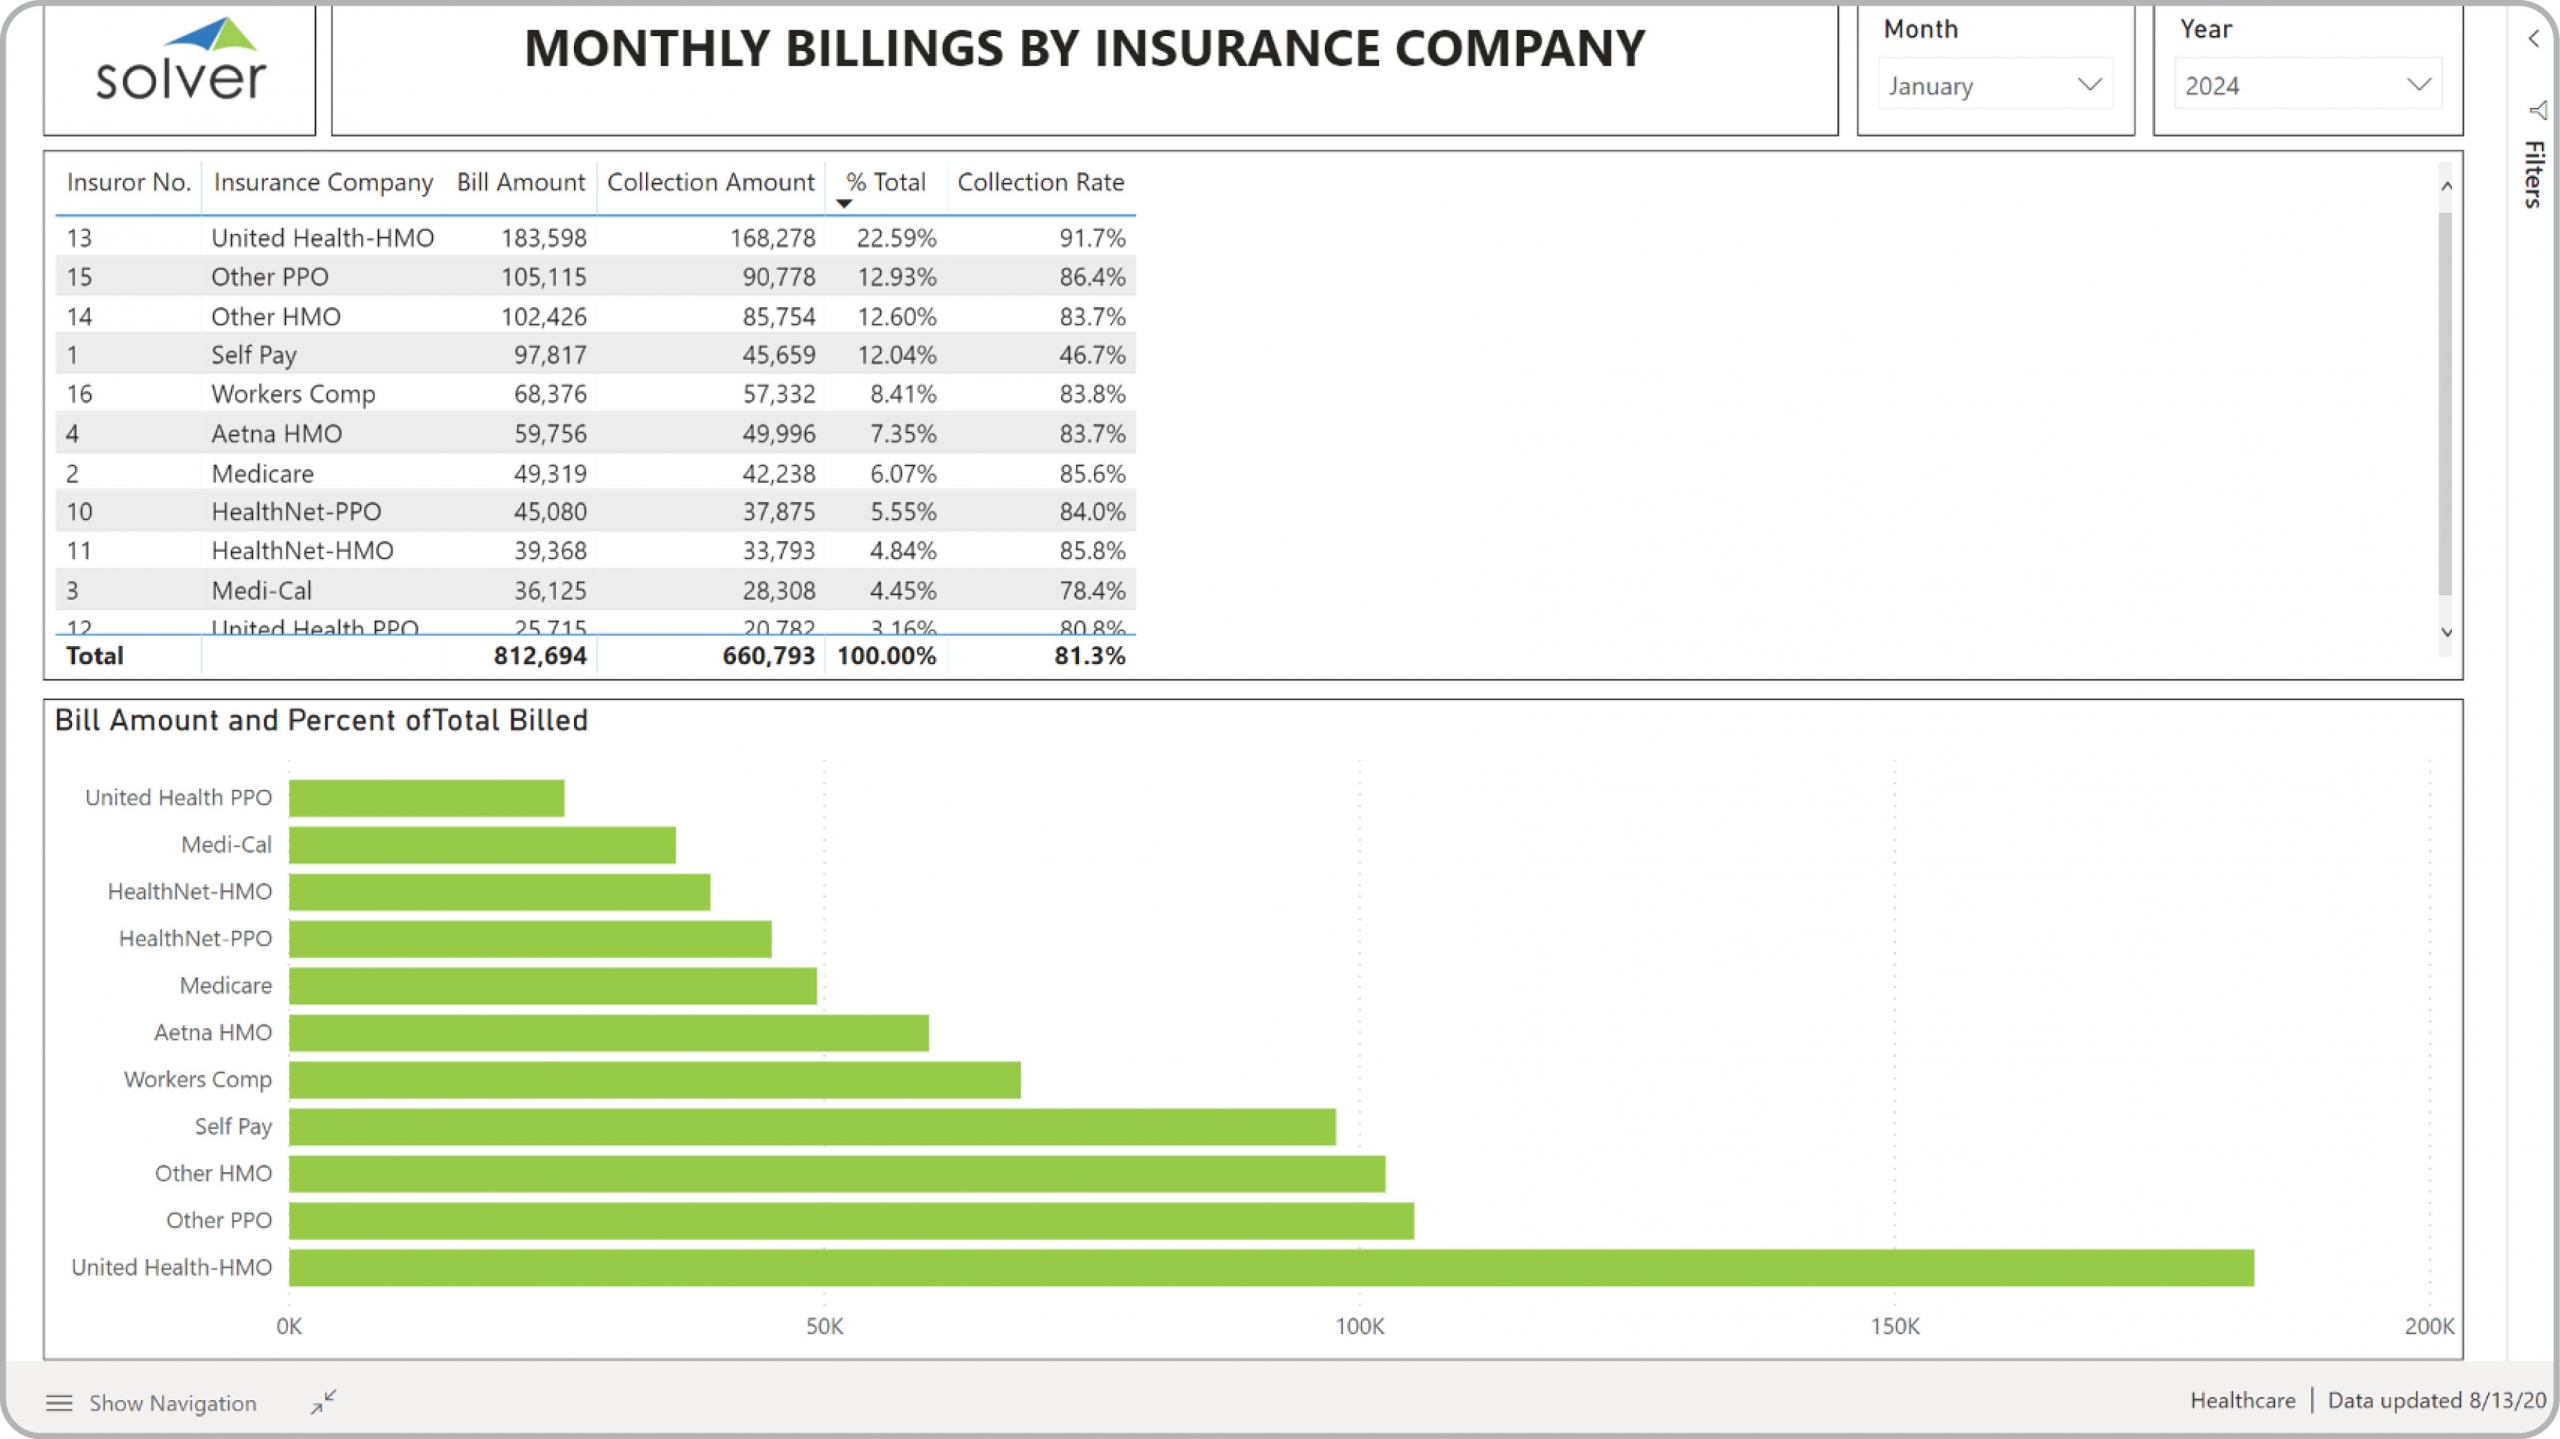
Health – Monthly Billings by Payor
Analysis of monthly billings by payor (insurance co.) with KPIs for charges, claims, reimbursements.
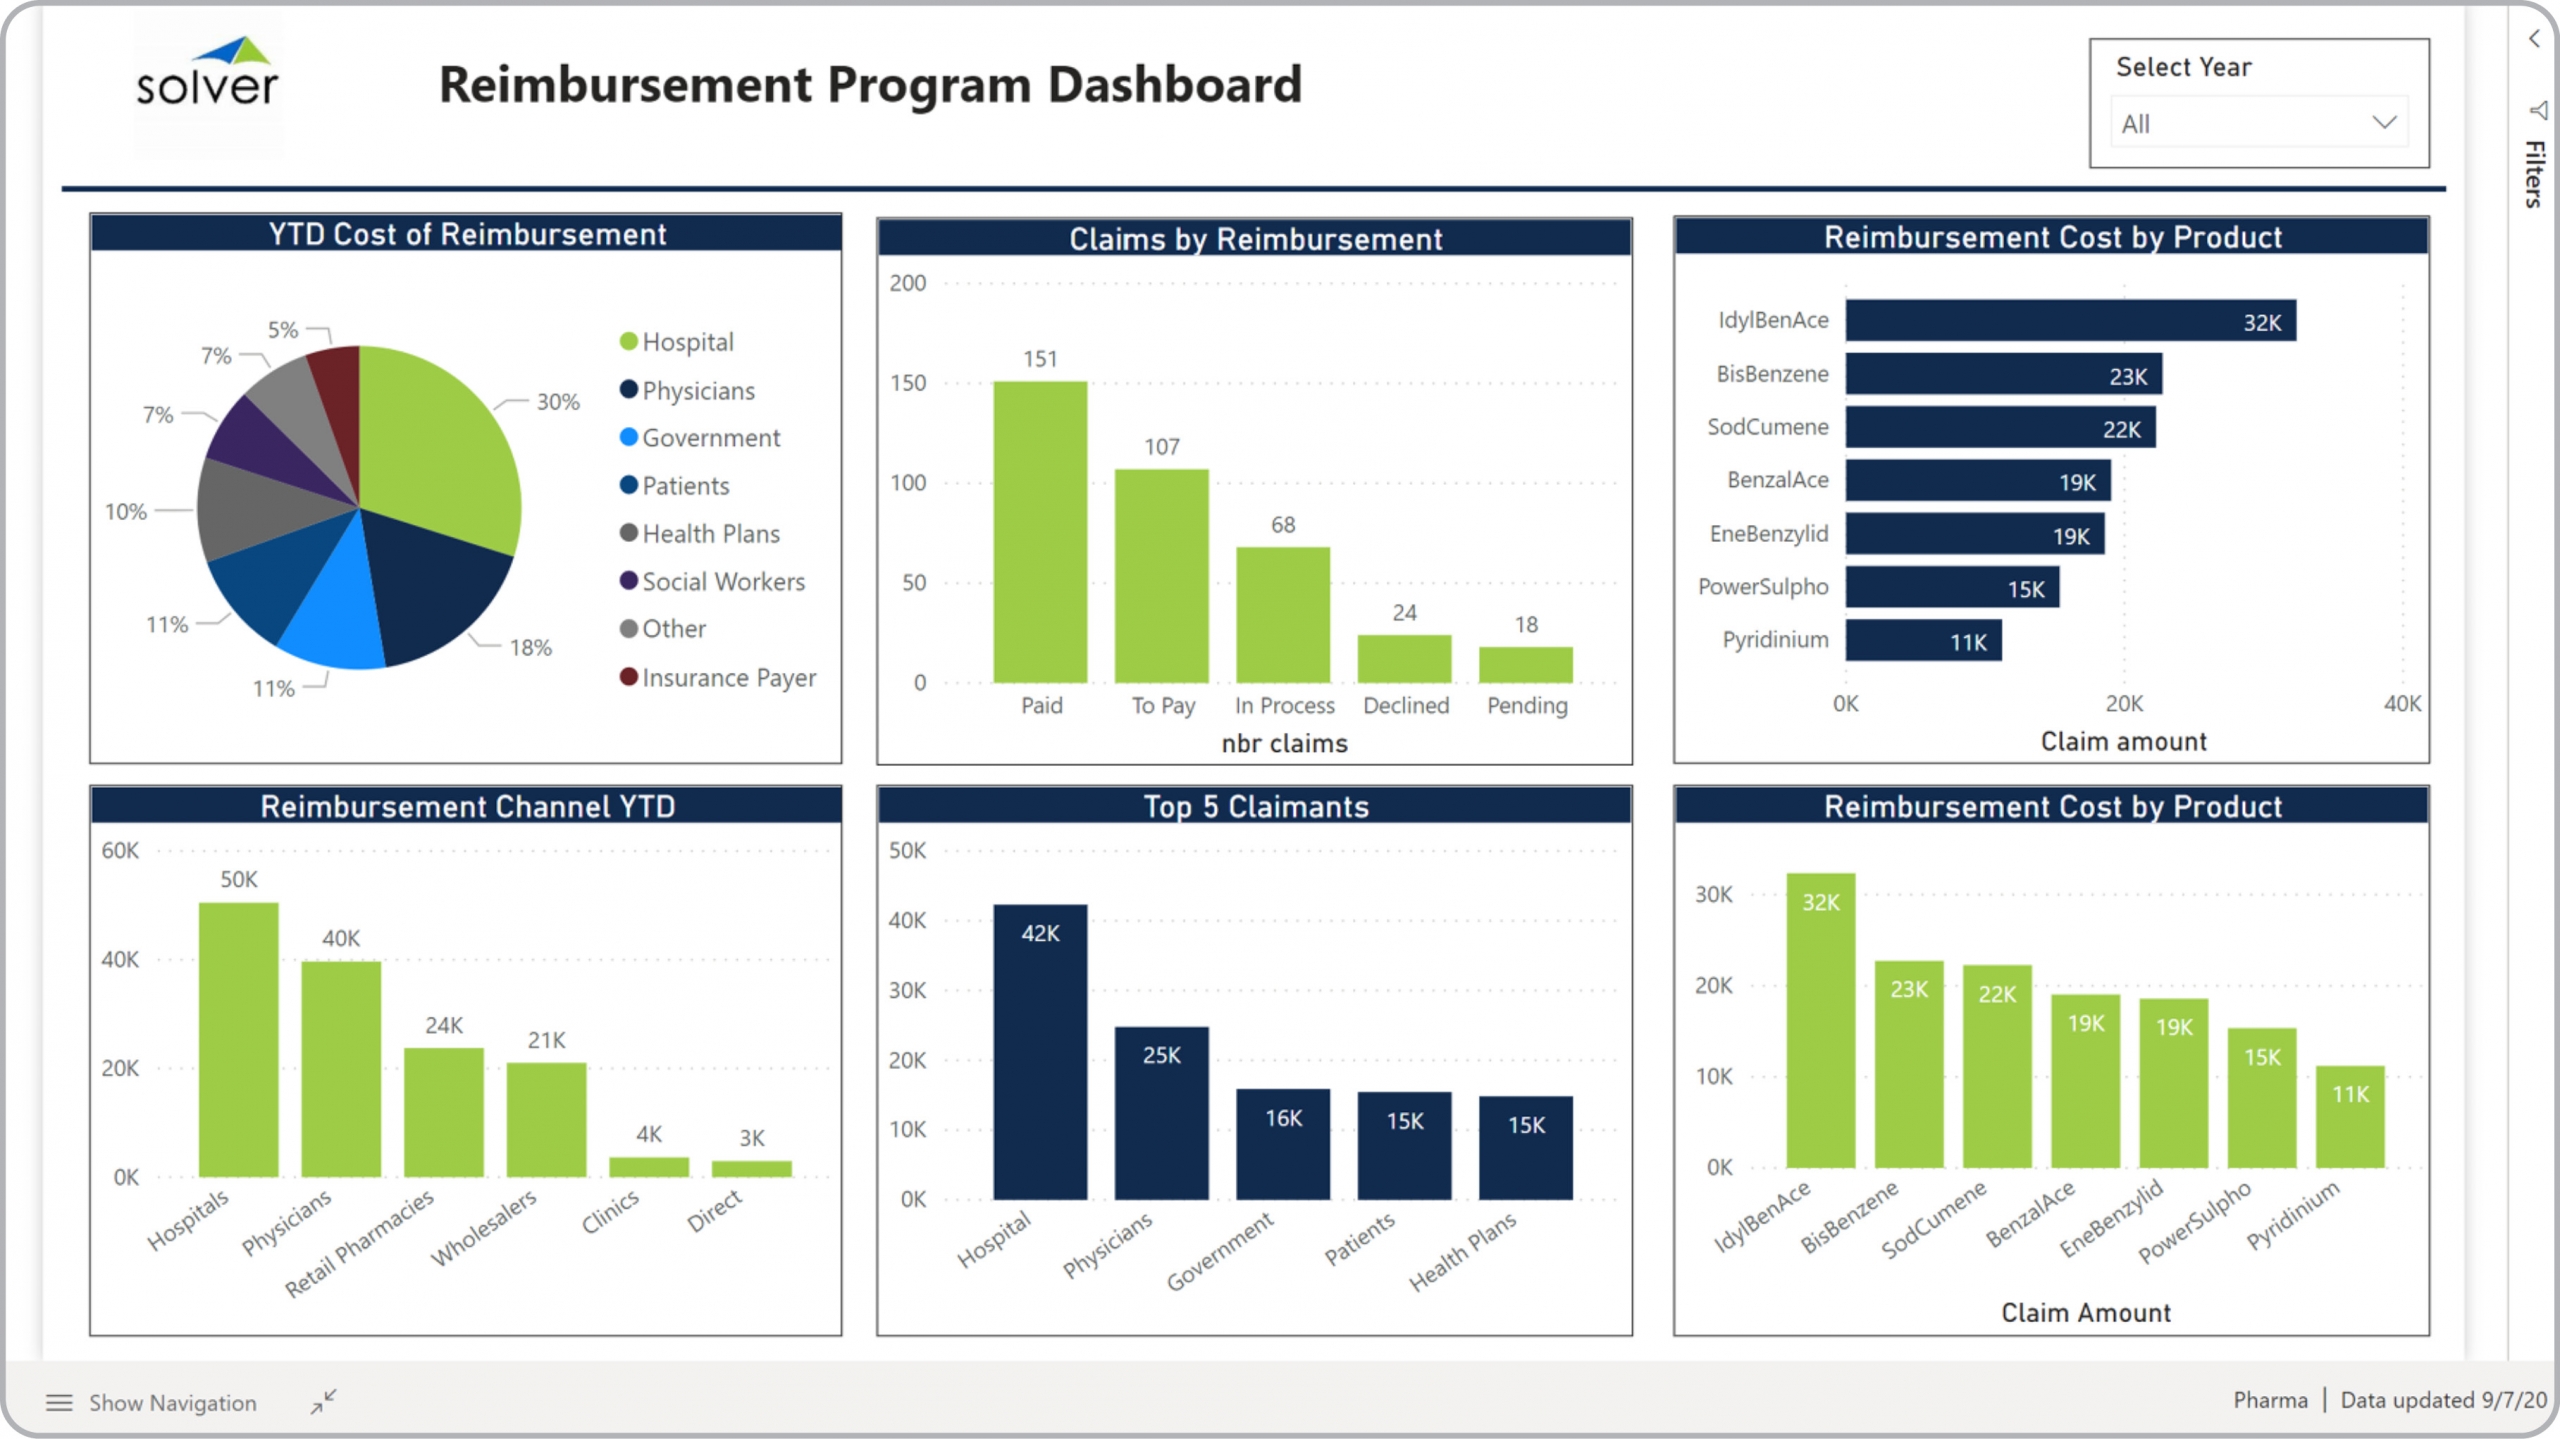
Pharma – Reimbursement Dashboard
Power BI dashboard showing reimbursement KPIs related to cost, claims, product and channel.
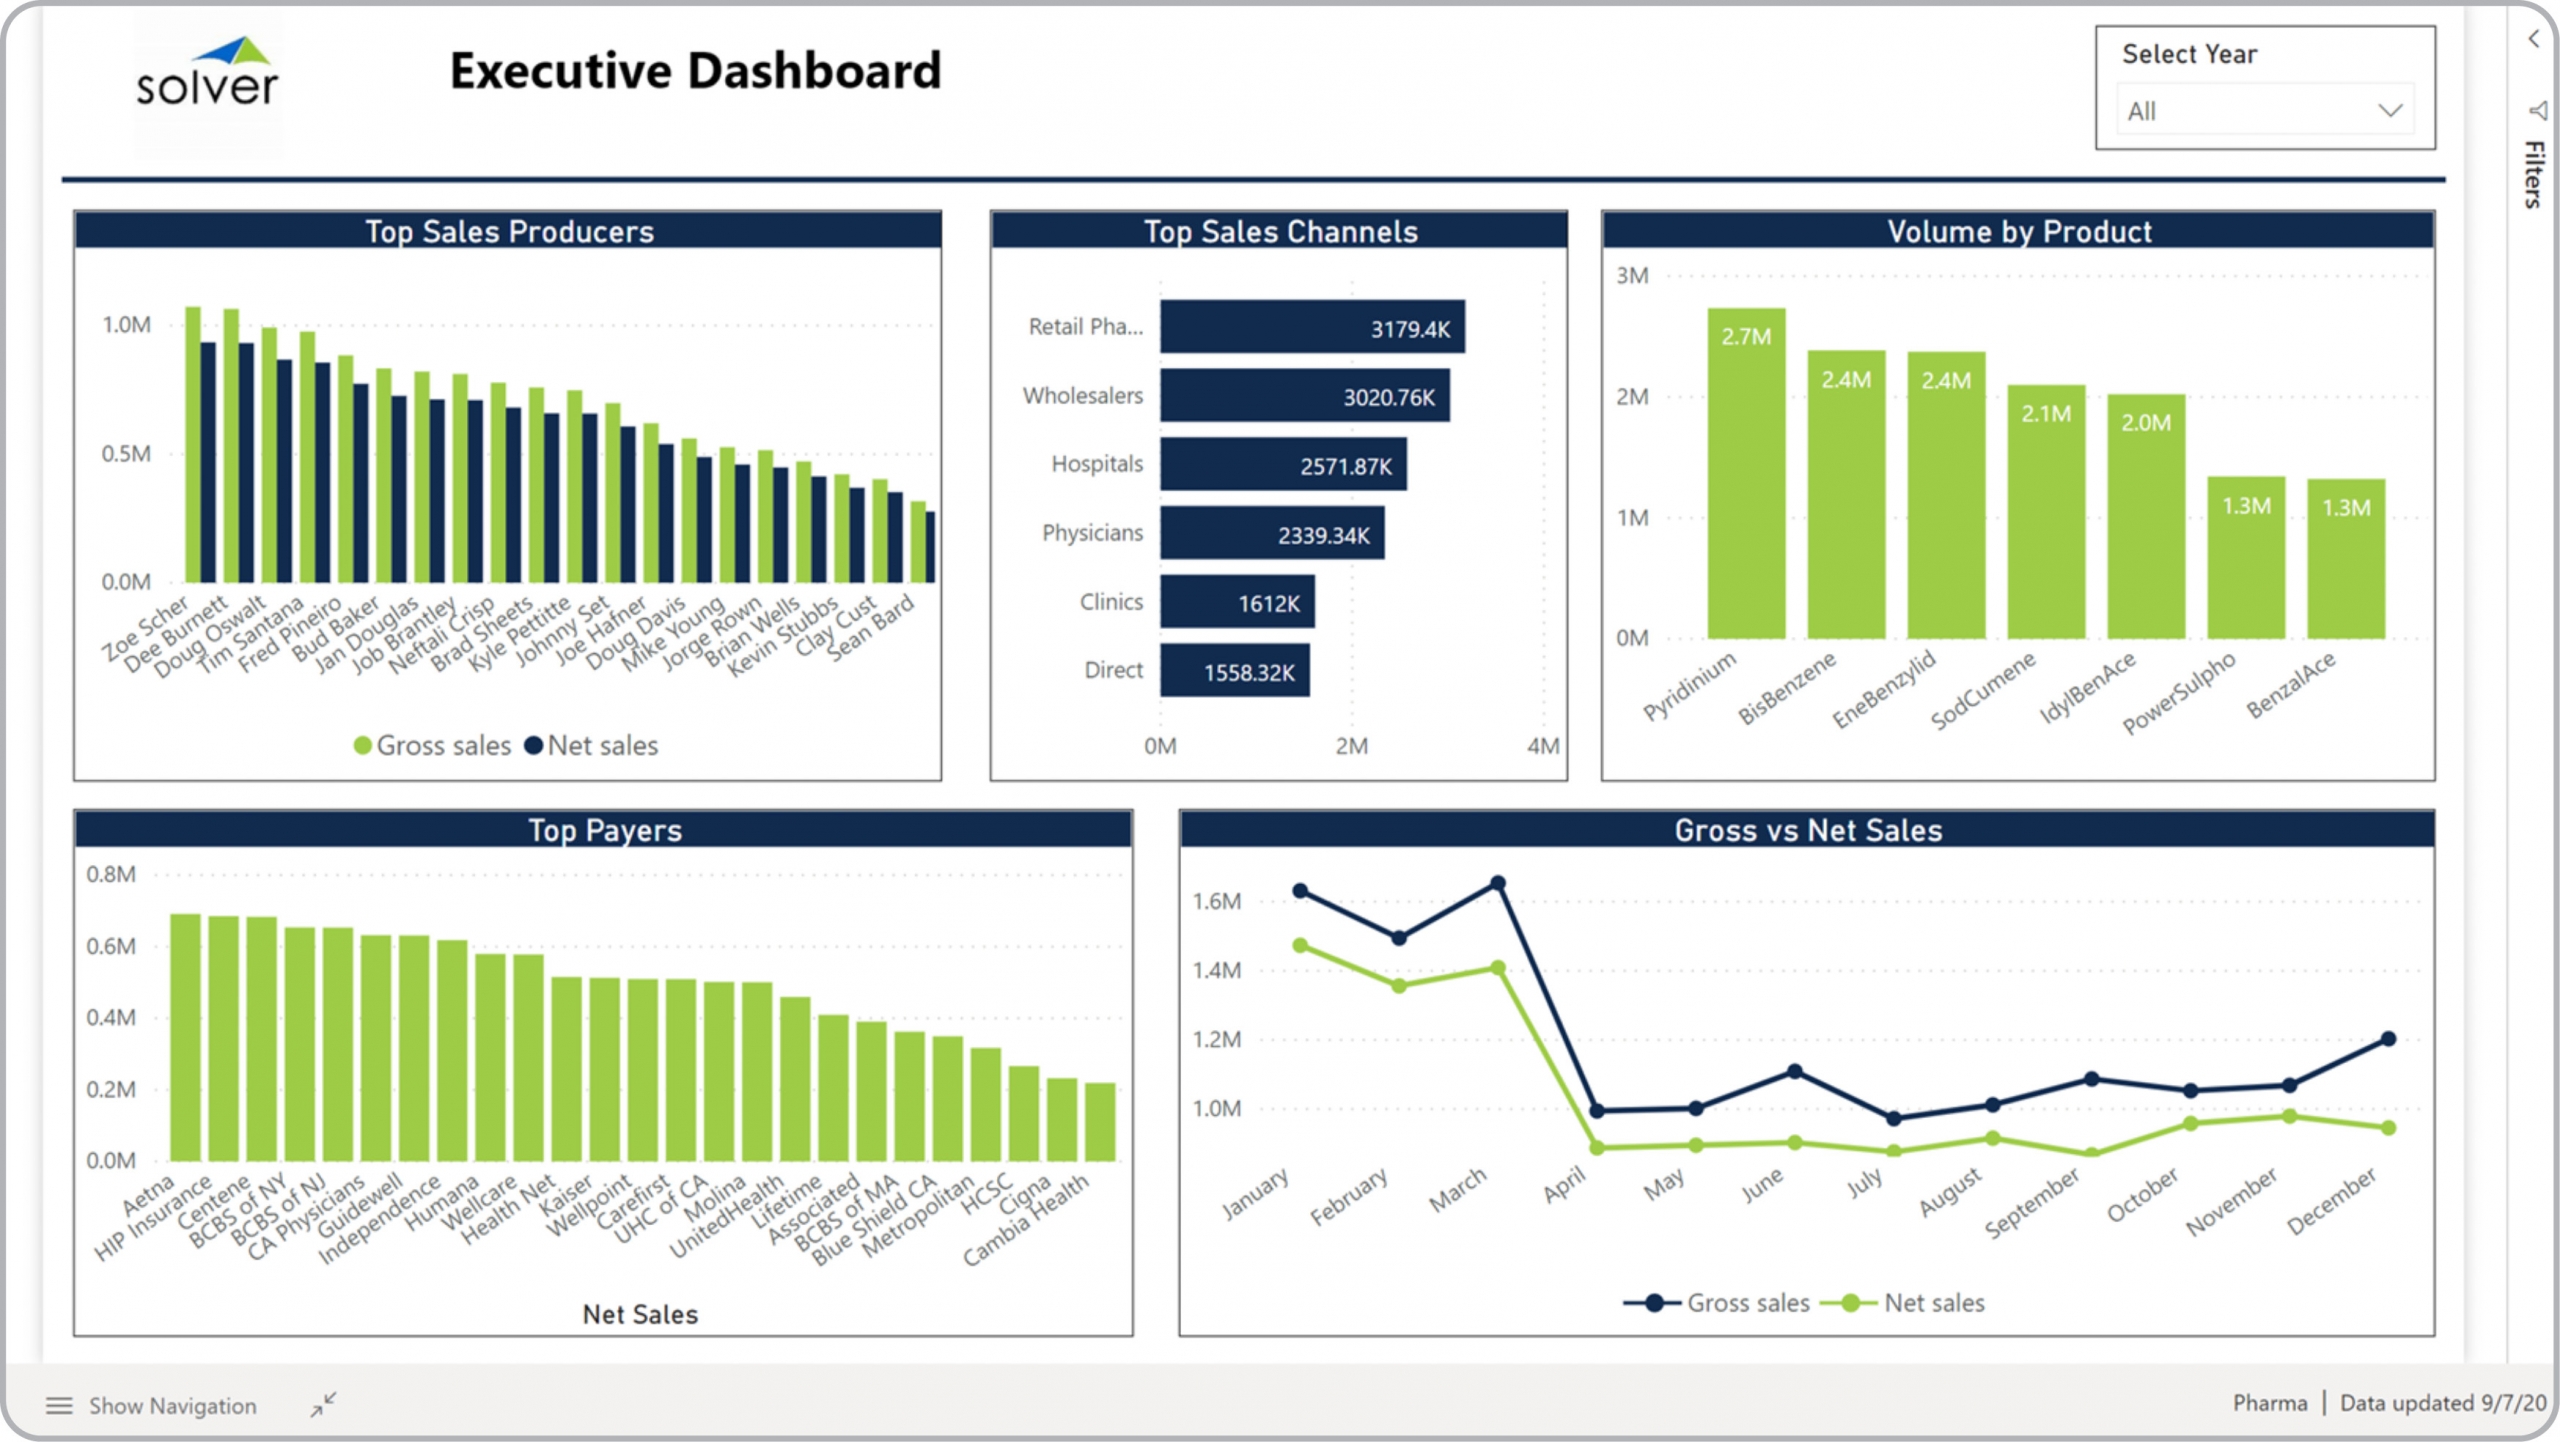
Pharma – Executive Dashboard
Power BI dashboard showing financial metrics by producer, payer, sales channel and product, incl. gross sales trend.
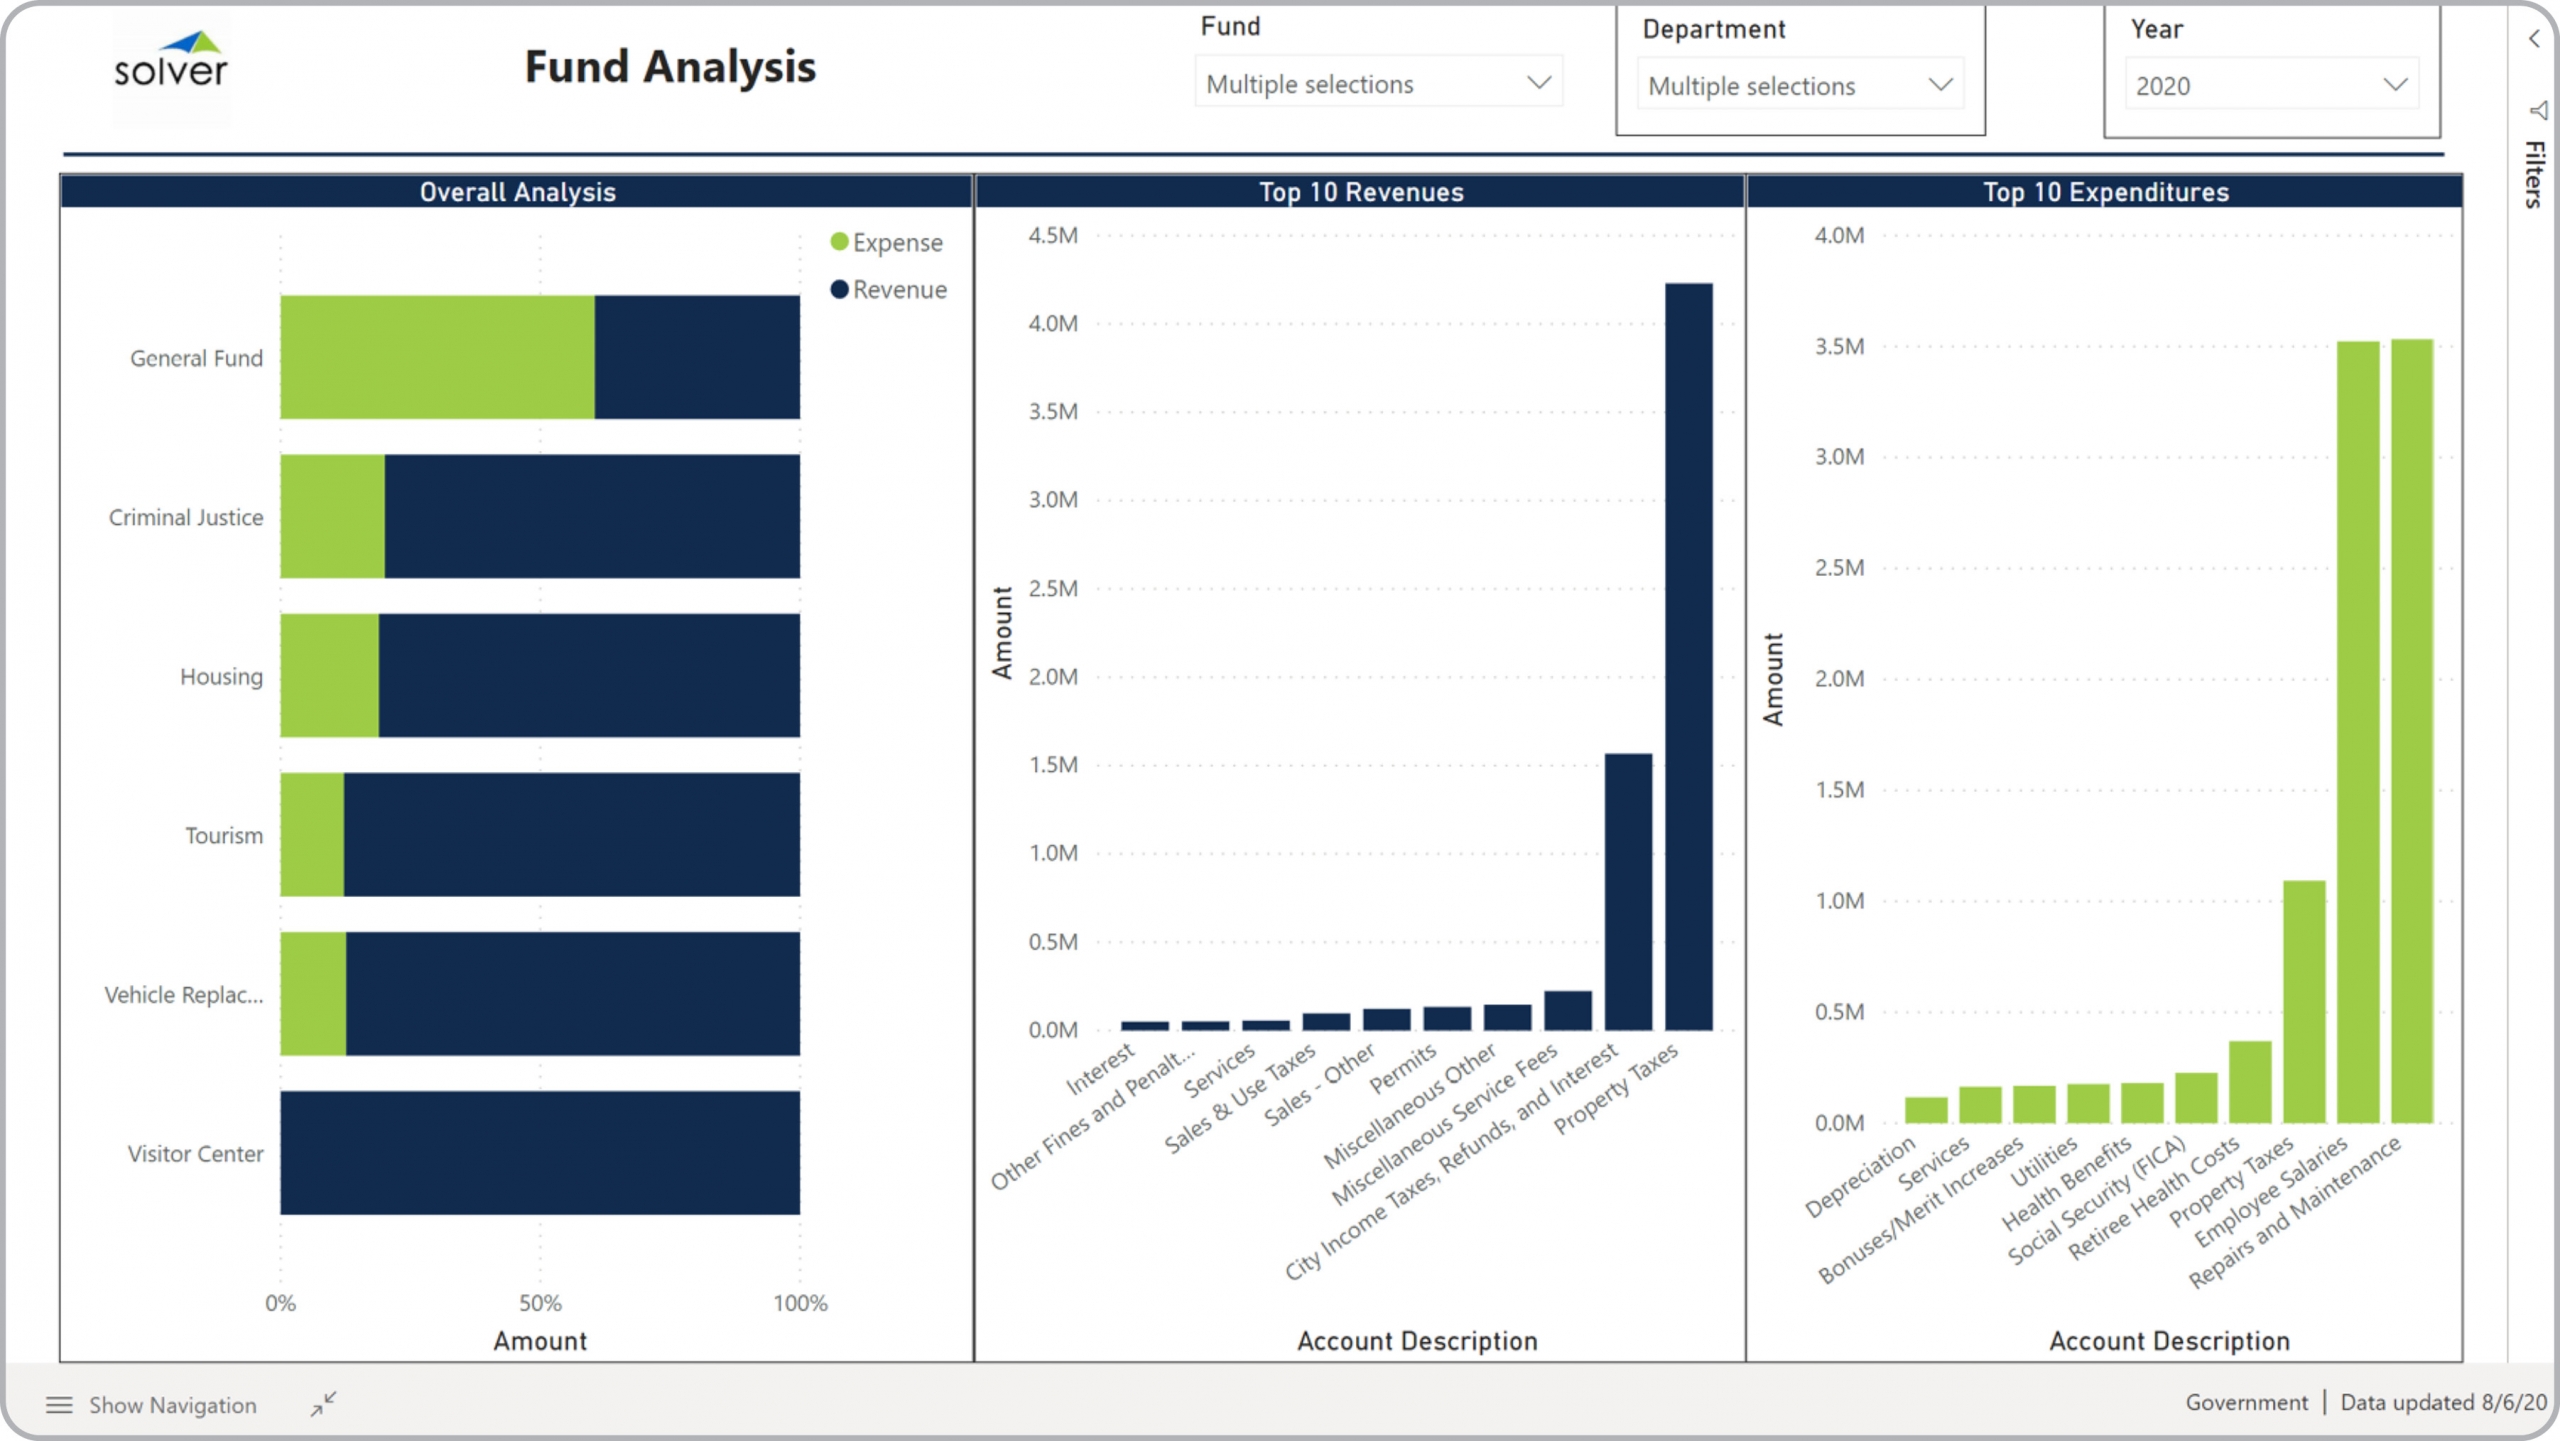
Government – Fund Budget Analysis
Power BI dashboard showing top revenues and expenses by fund, as well as overall revenue/expense ratio by fund.
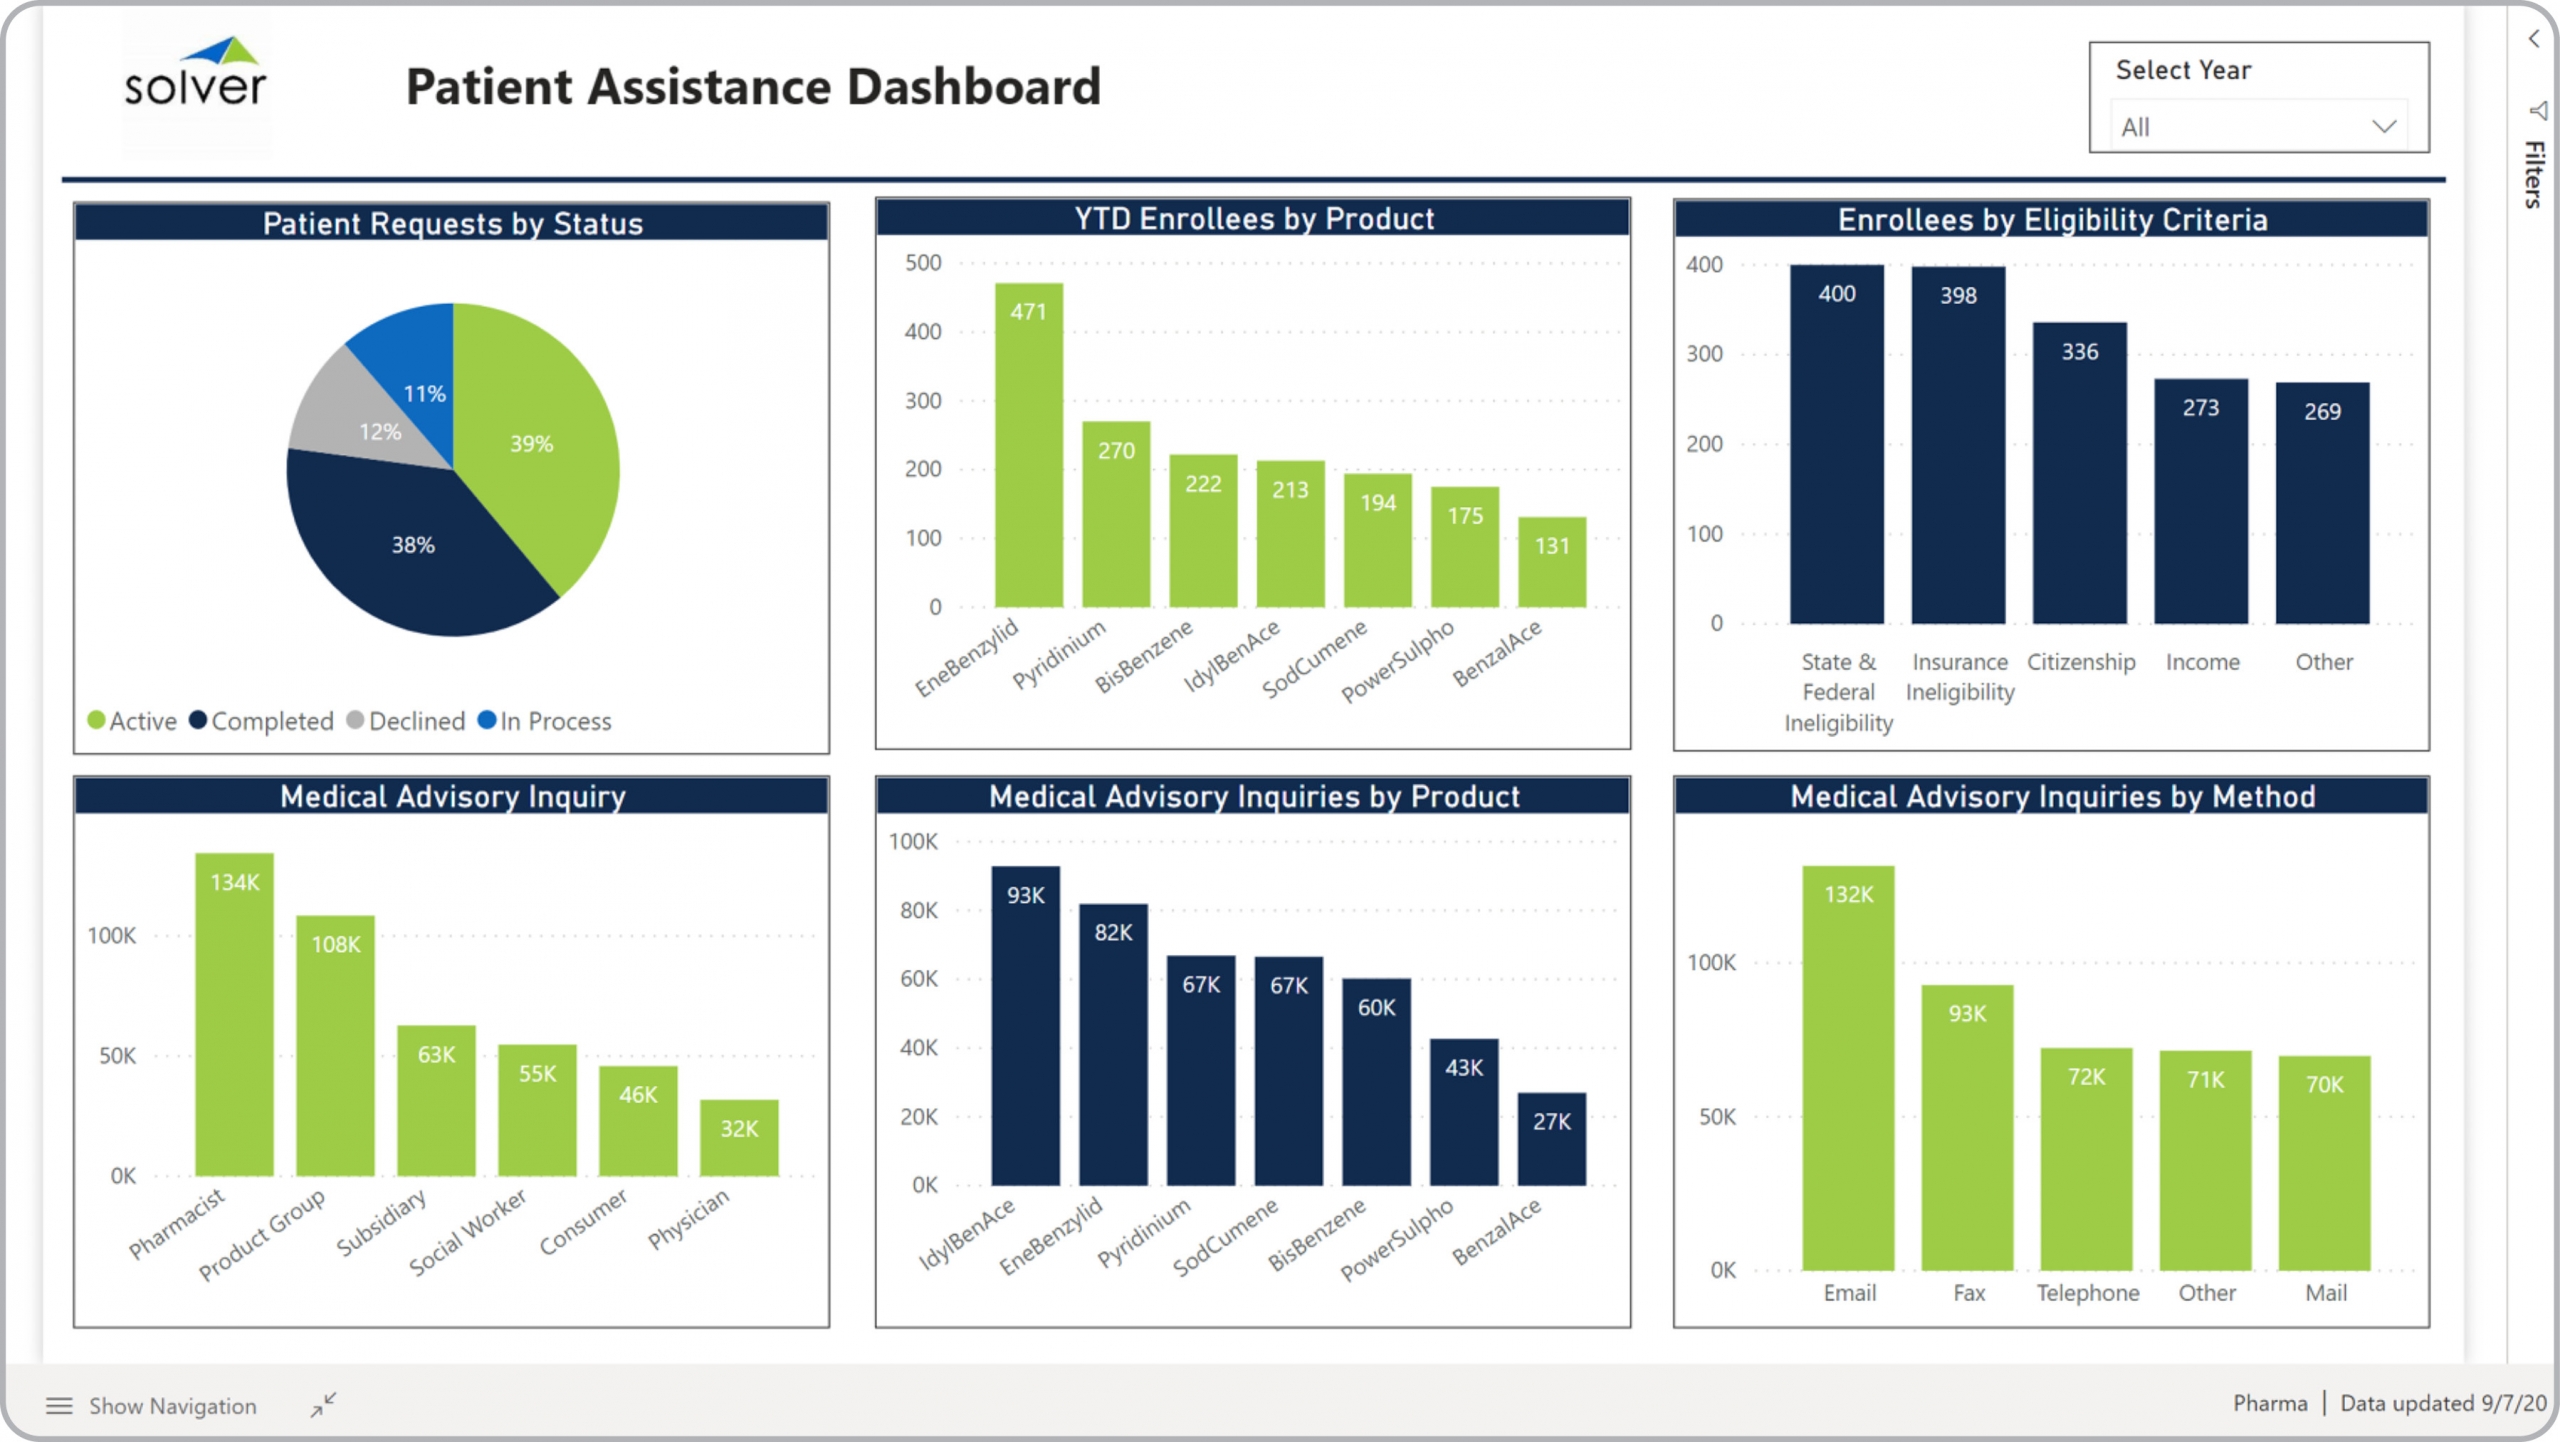
Pharma – Patient Dashboard
Power BI dashboard showing patient related metrics incl. patient request status, inquiries and enrollees.
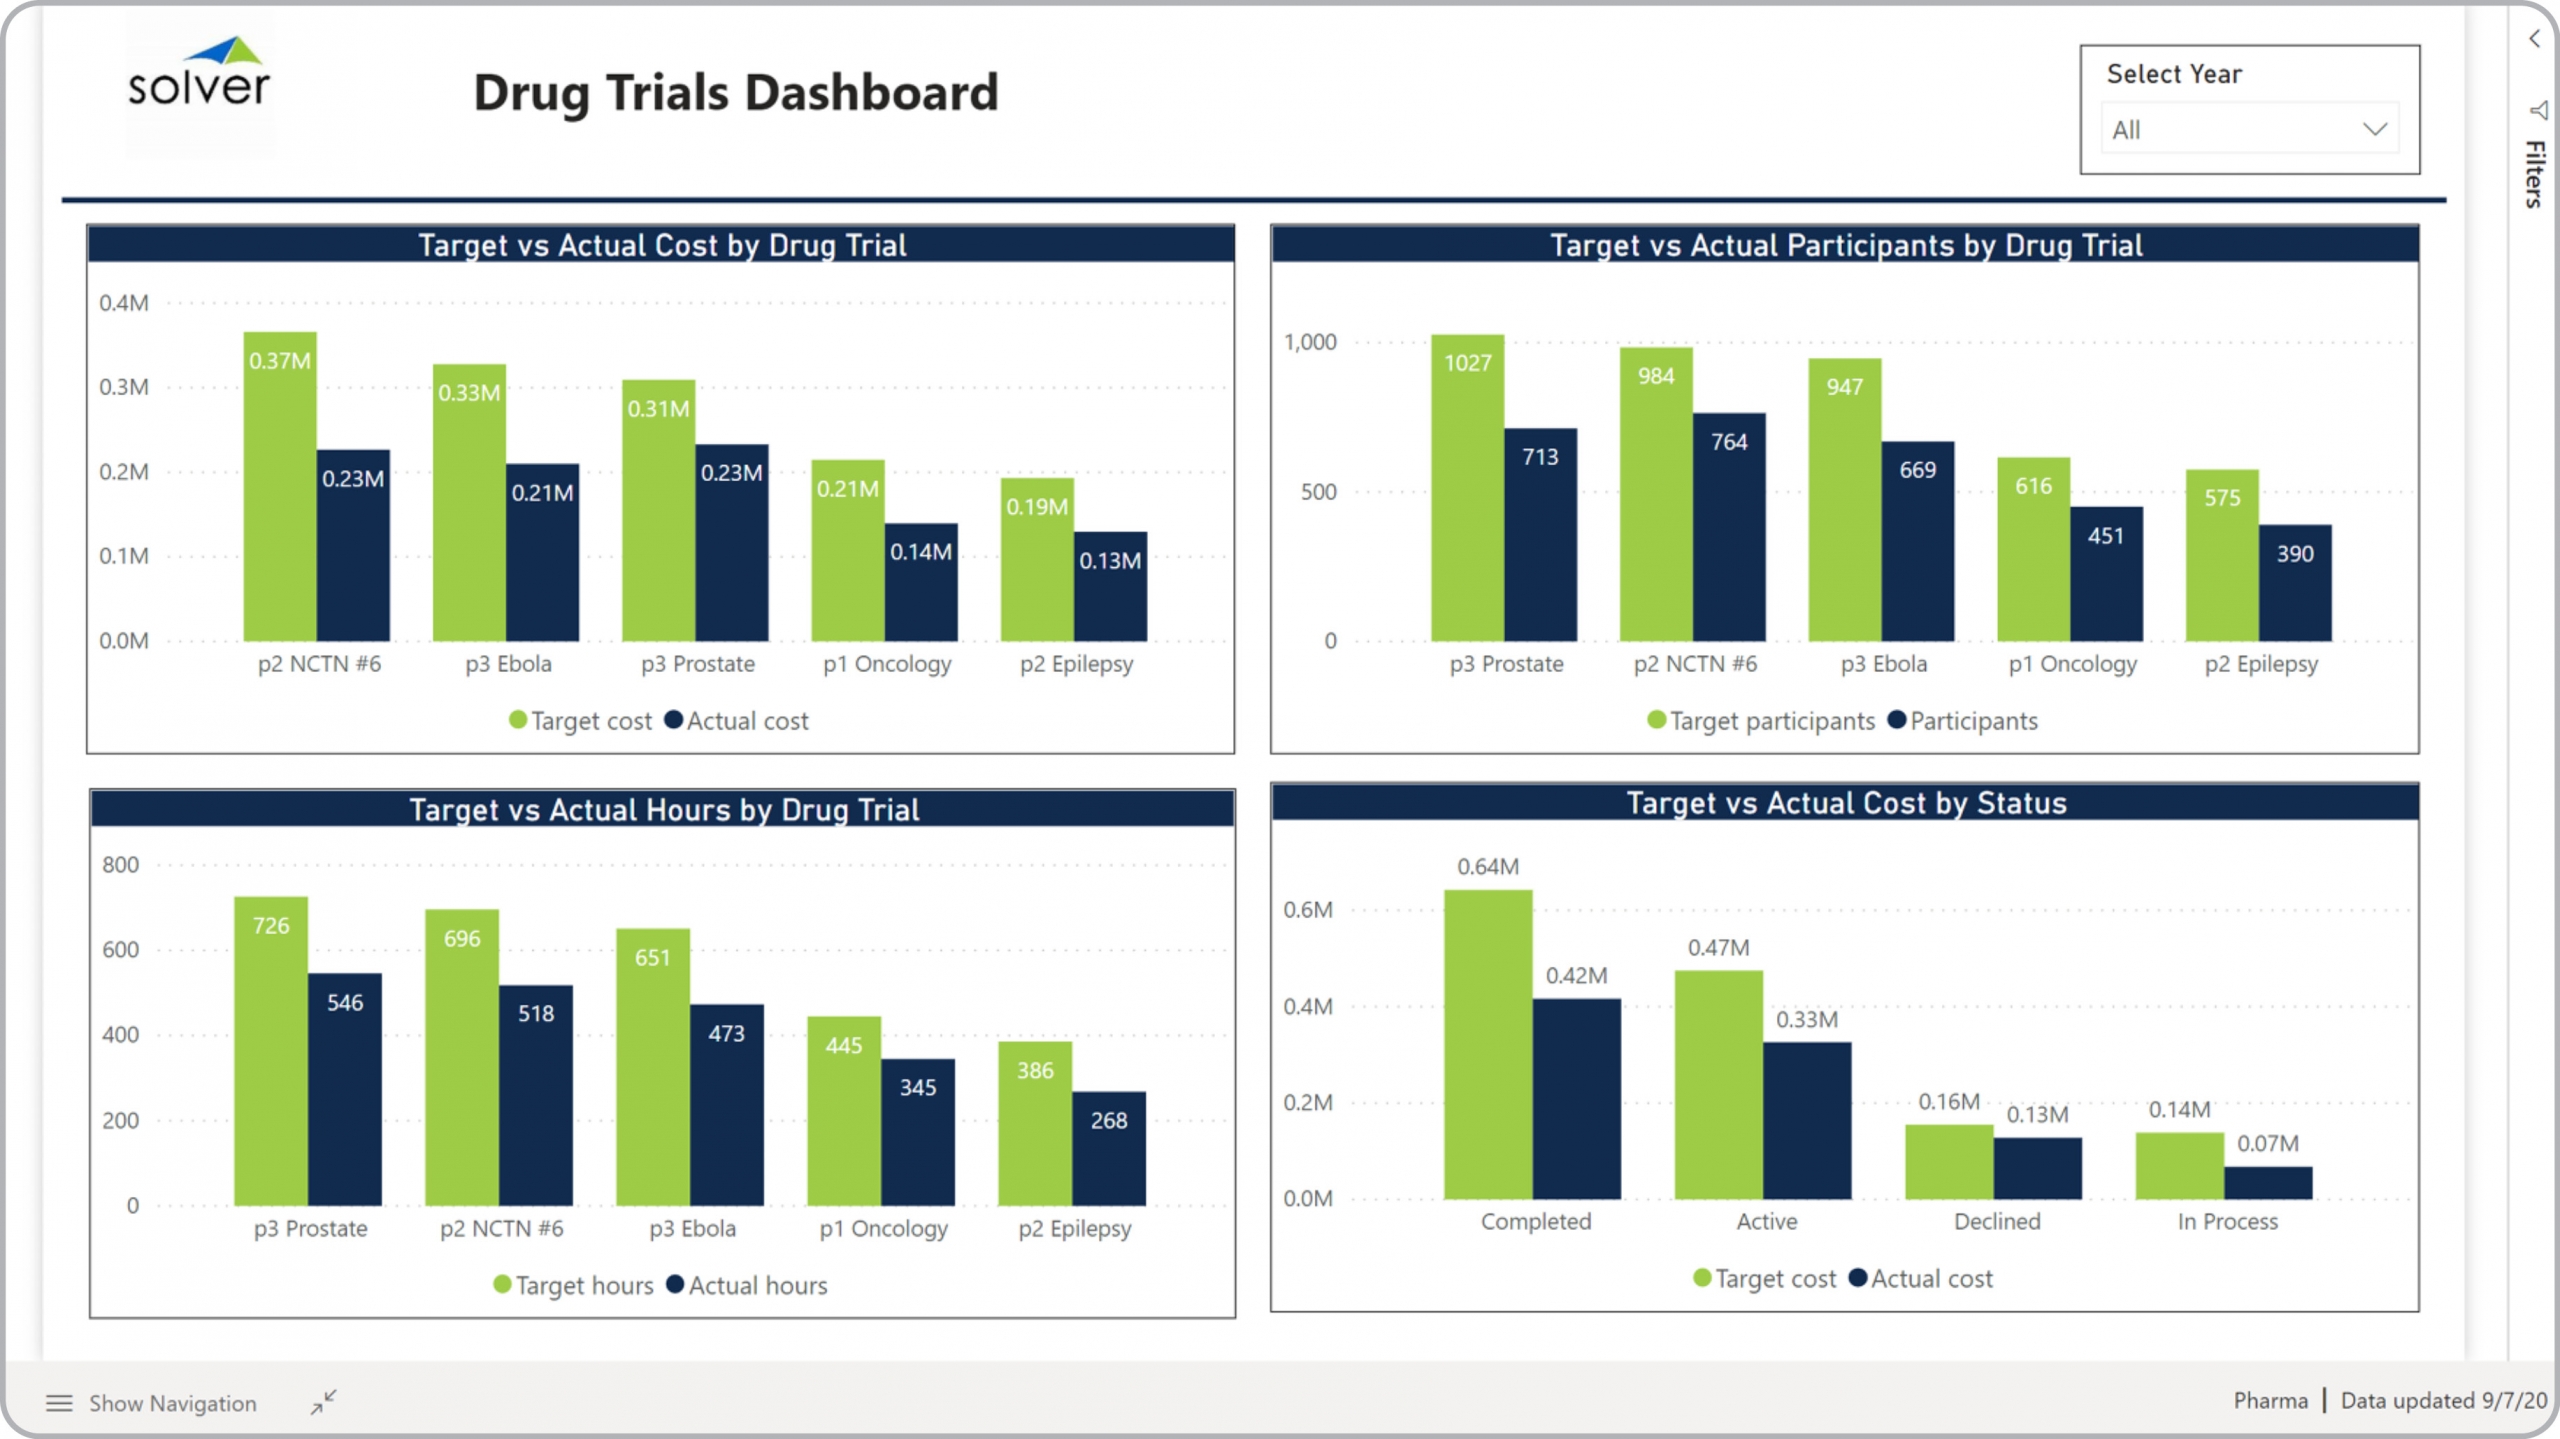
Pharma – Drug Trials Dashboard
Power BI dashboard showing analysis of cost, participants and hours related to trials.

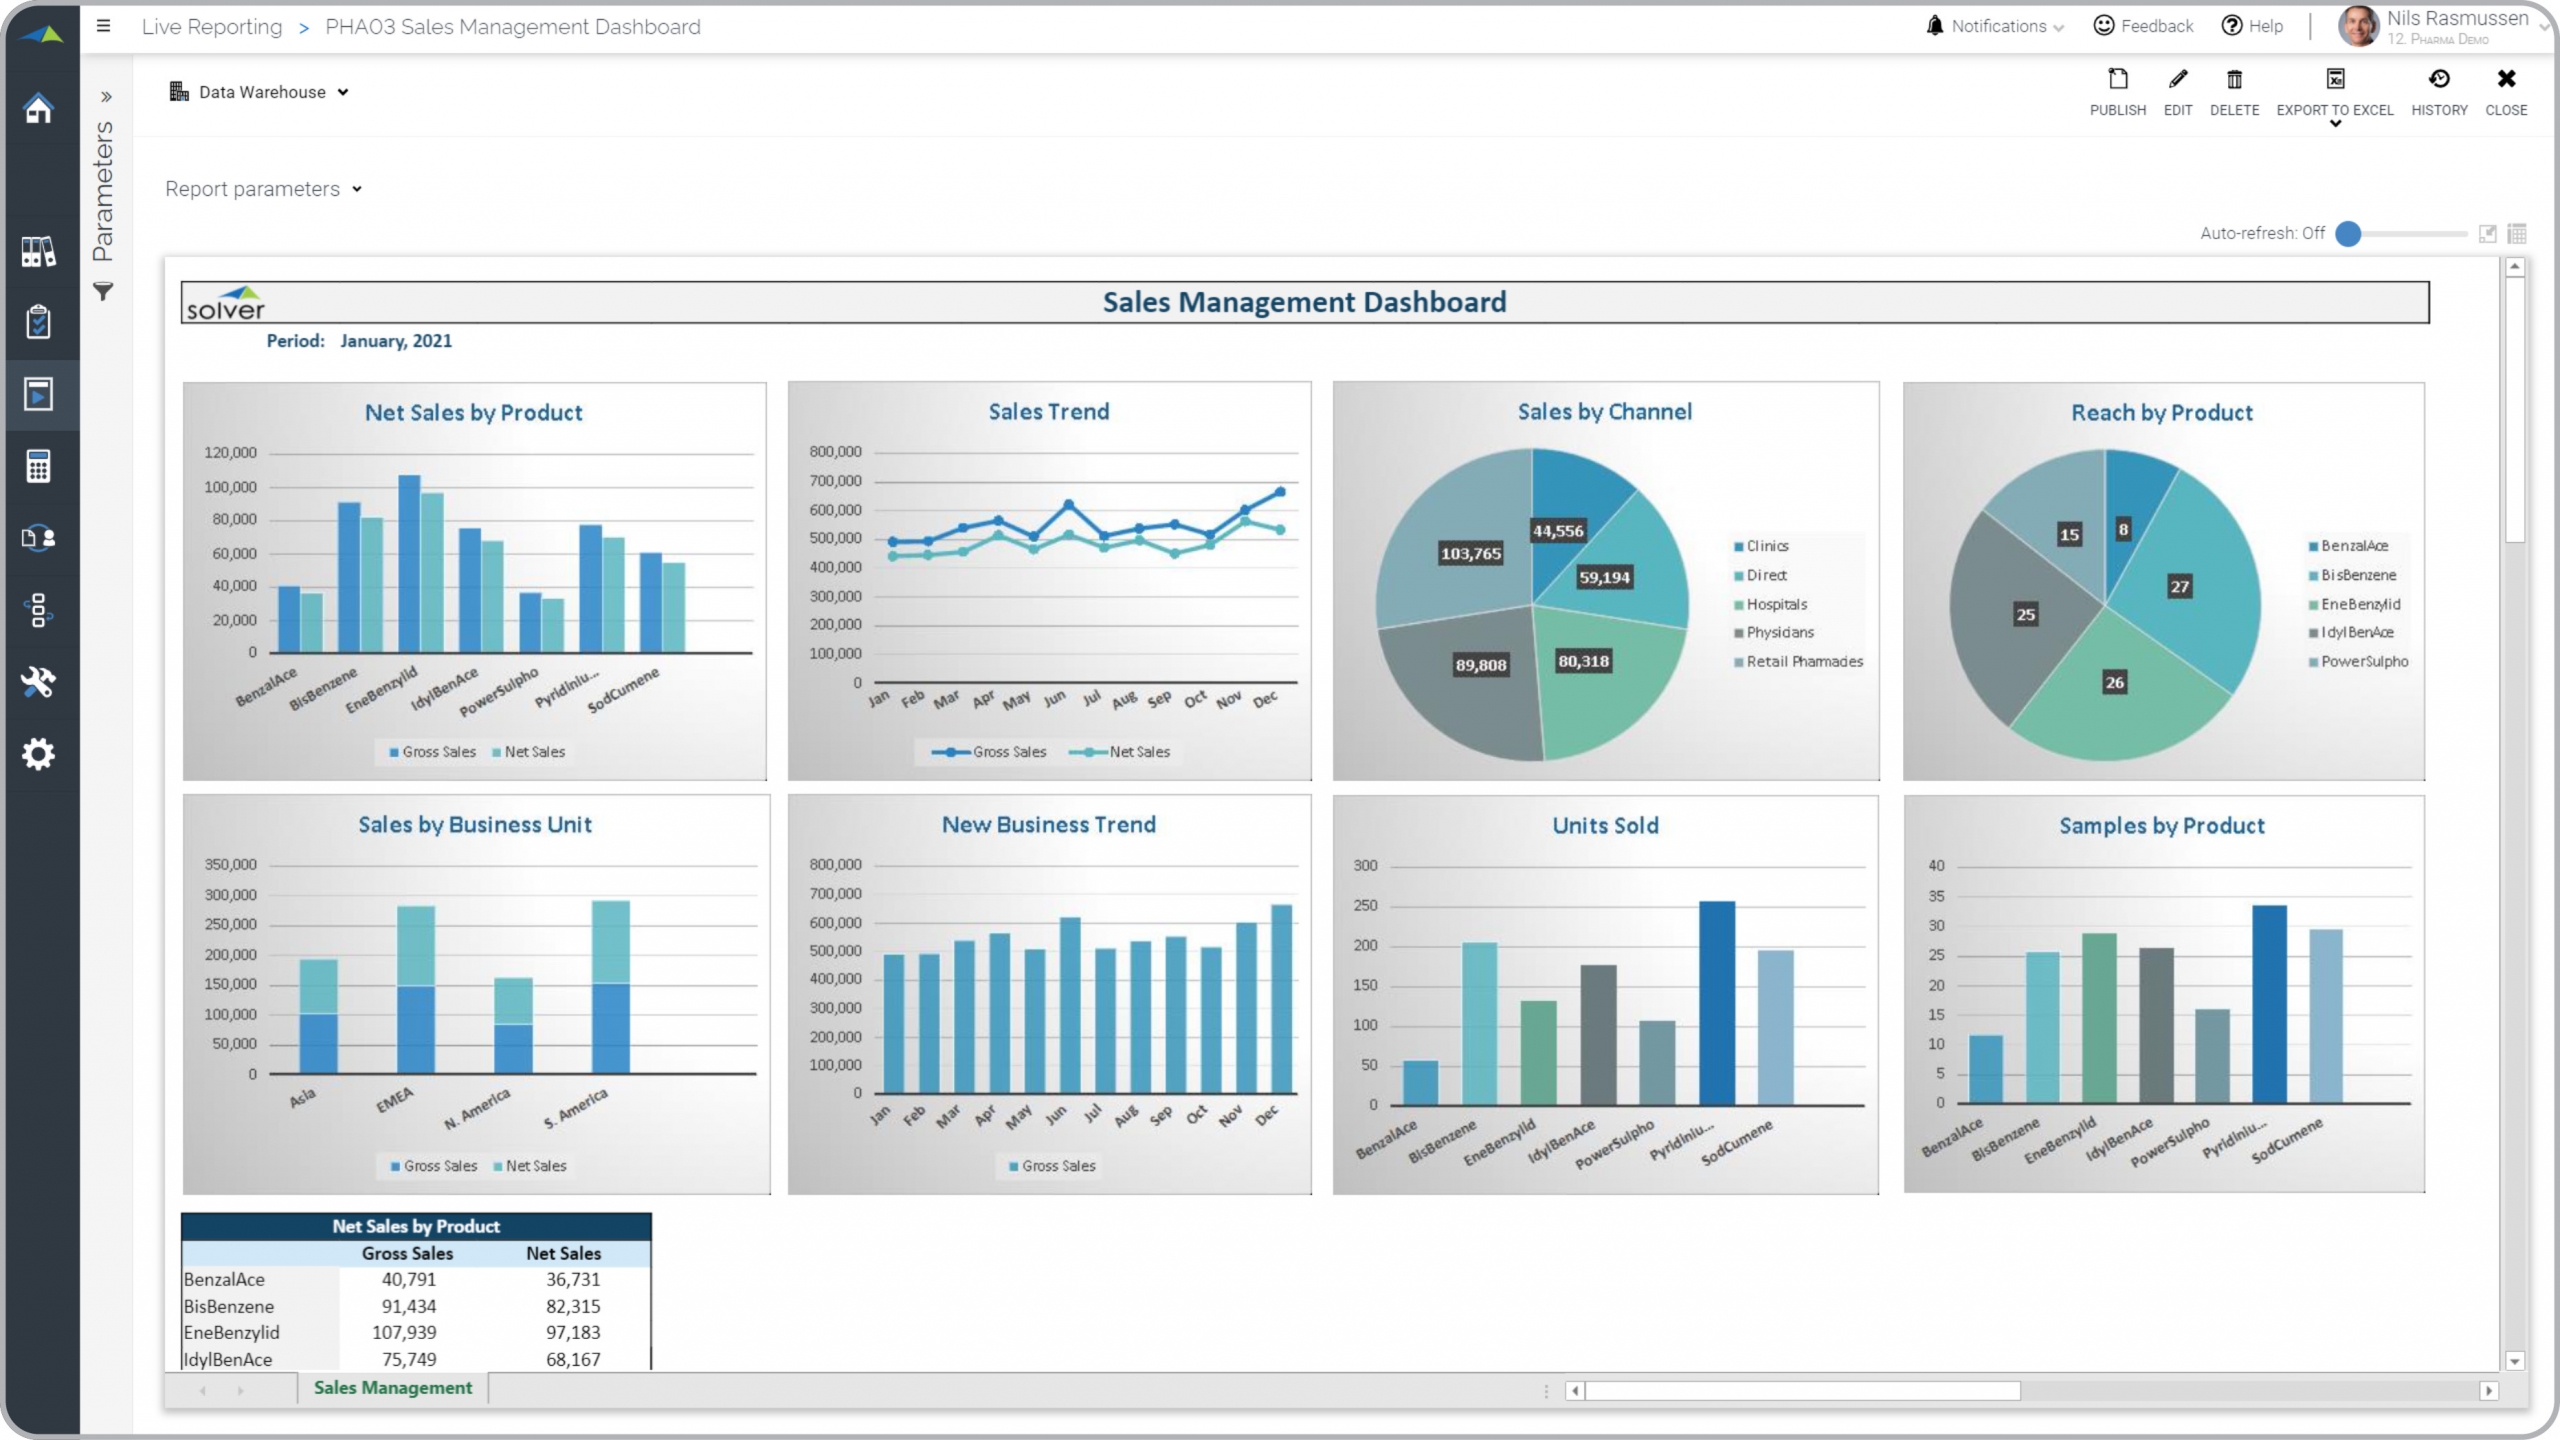
Pharma – Sales Management Dashboard
Power BI dashboard showing sales metrics as well as units sold and samples provided and reach.
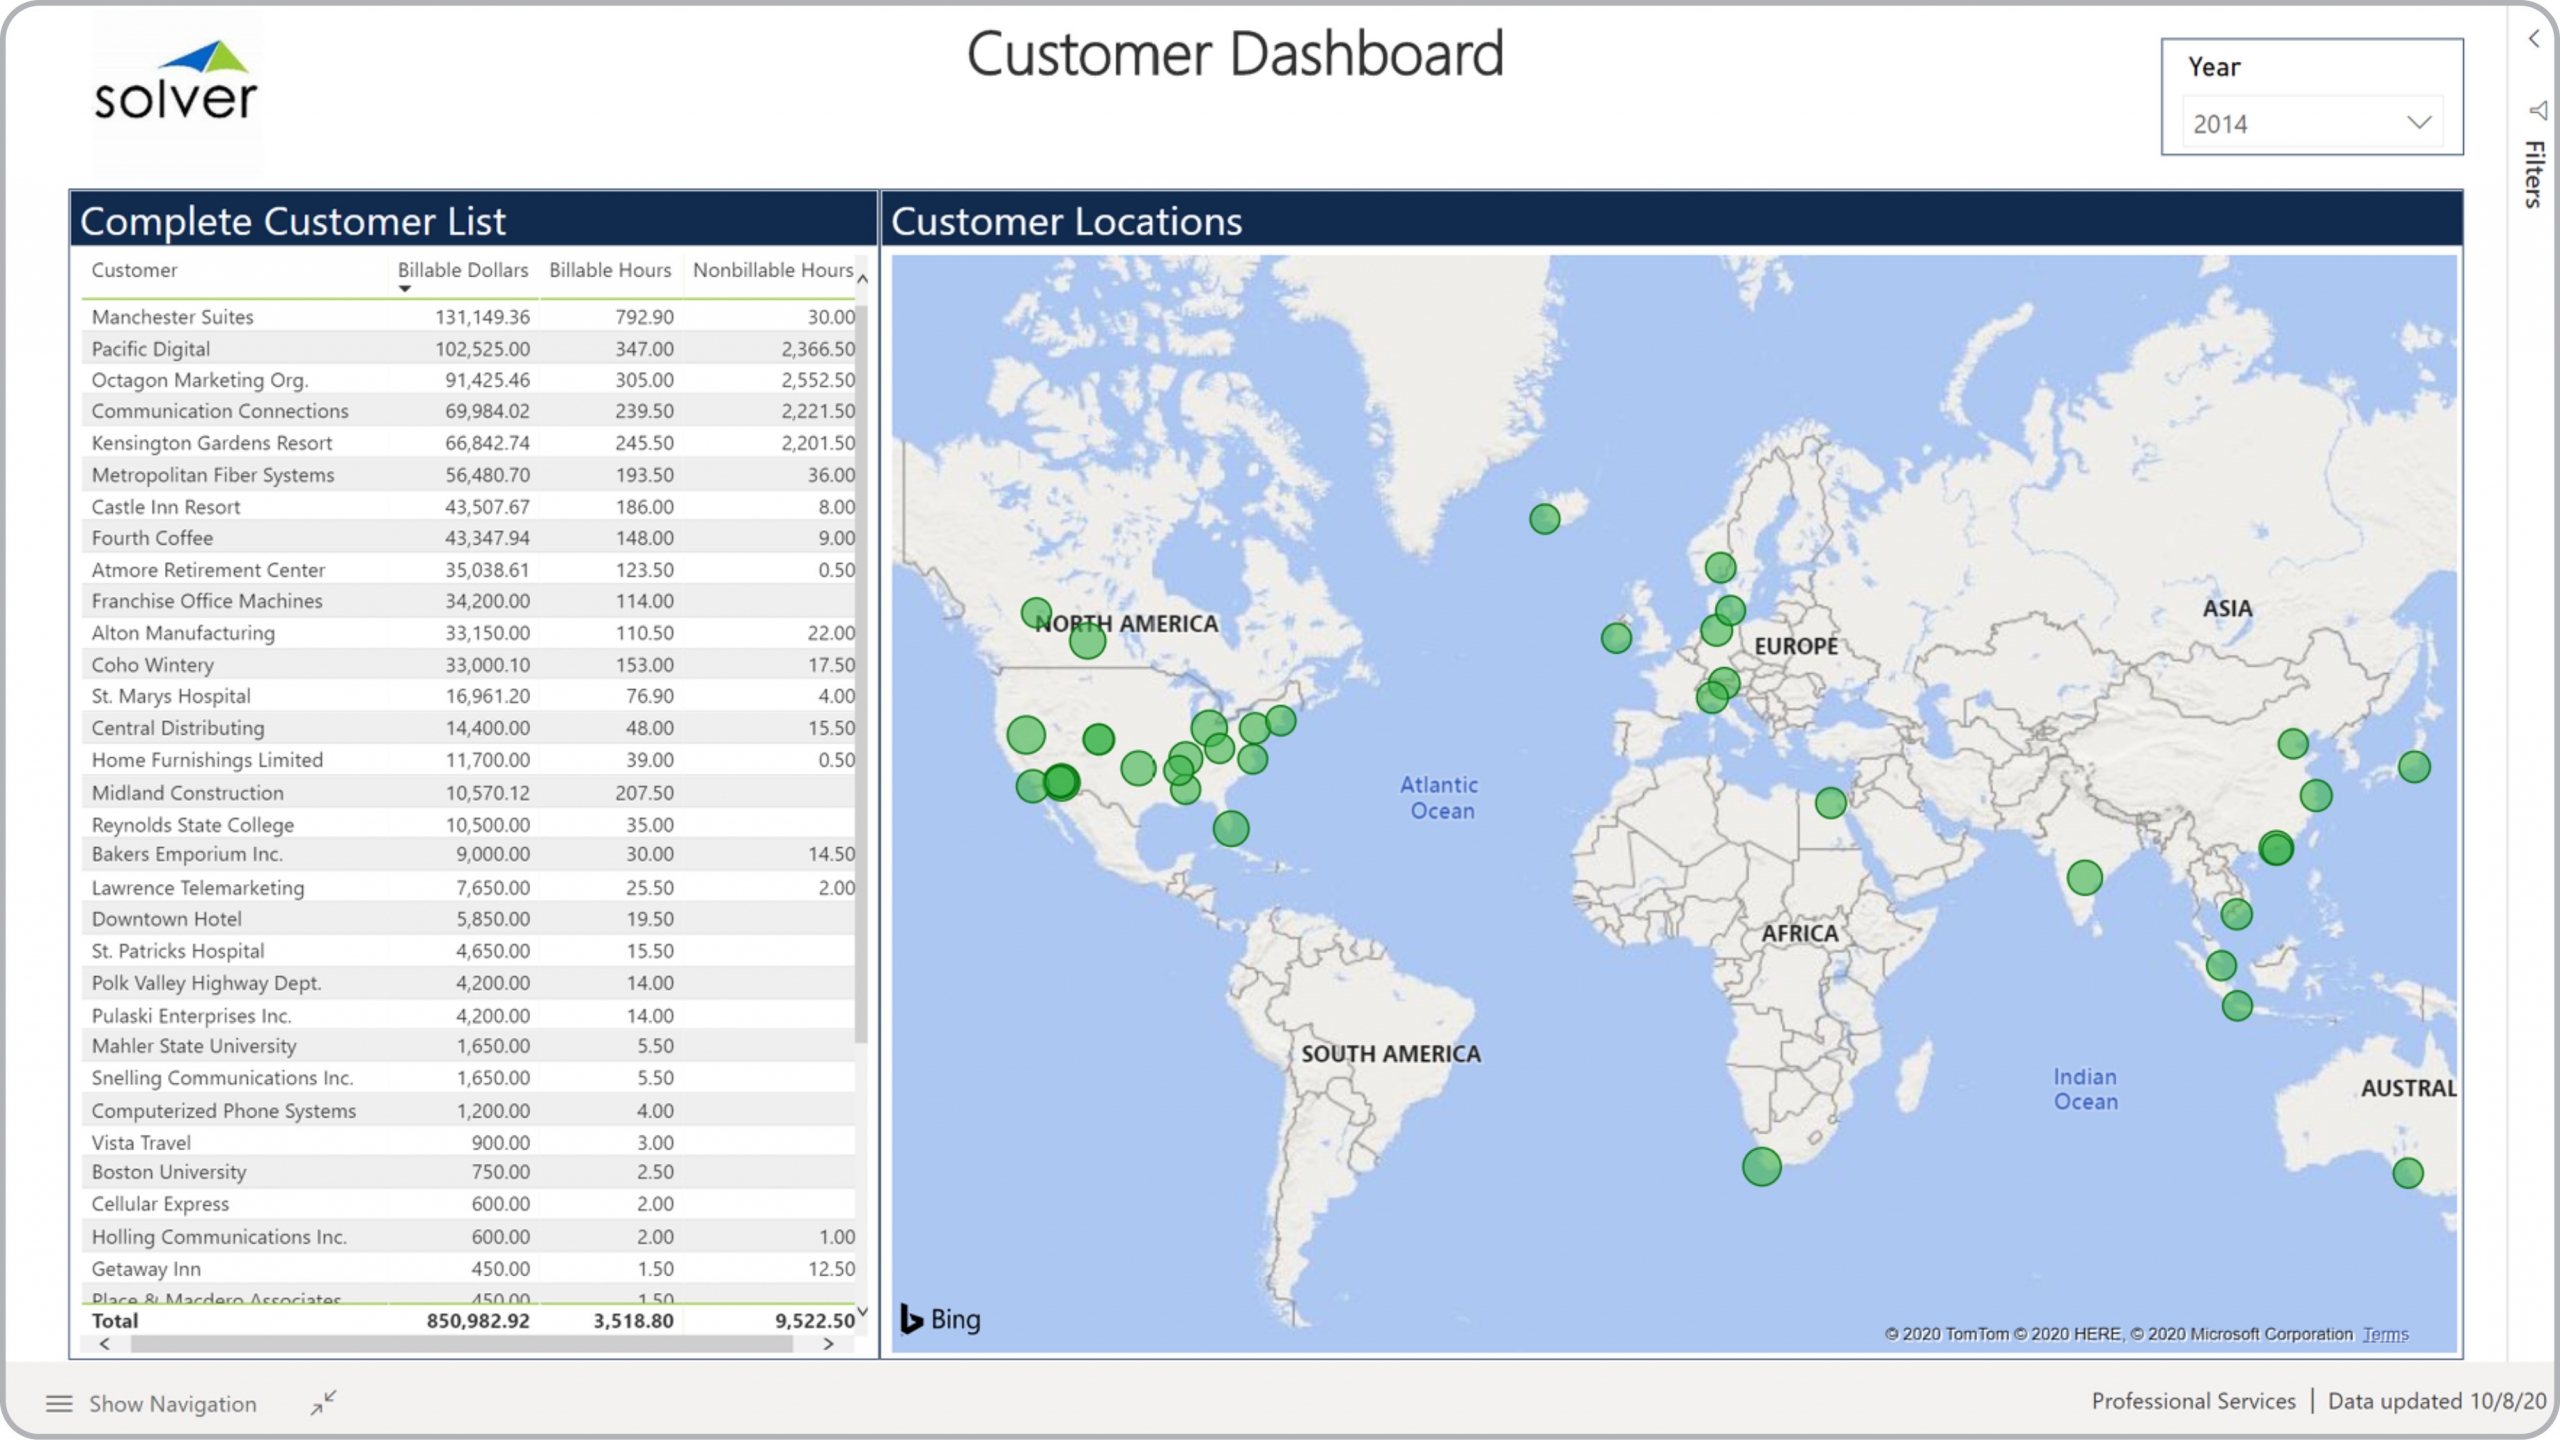
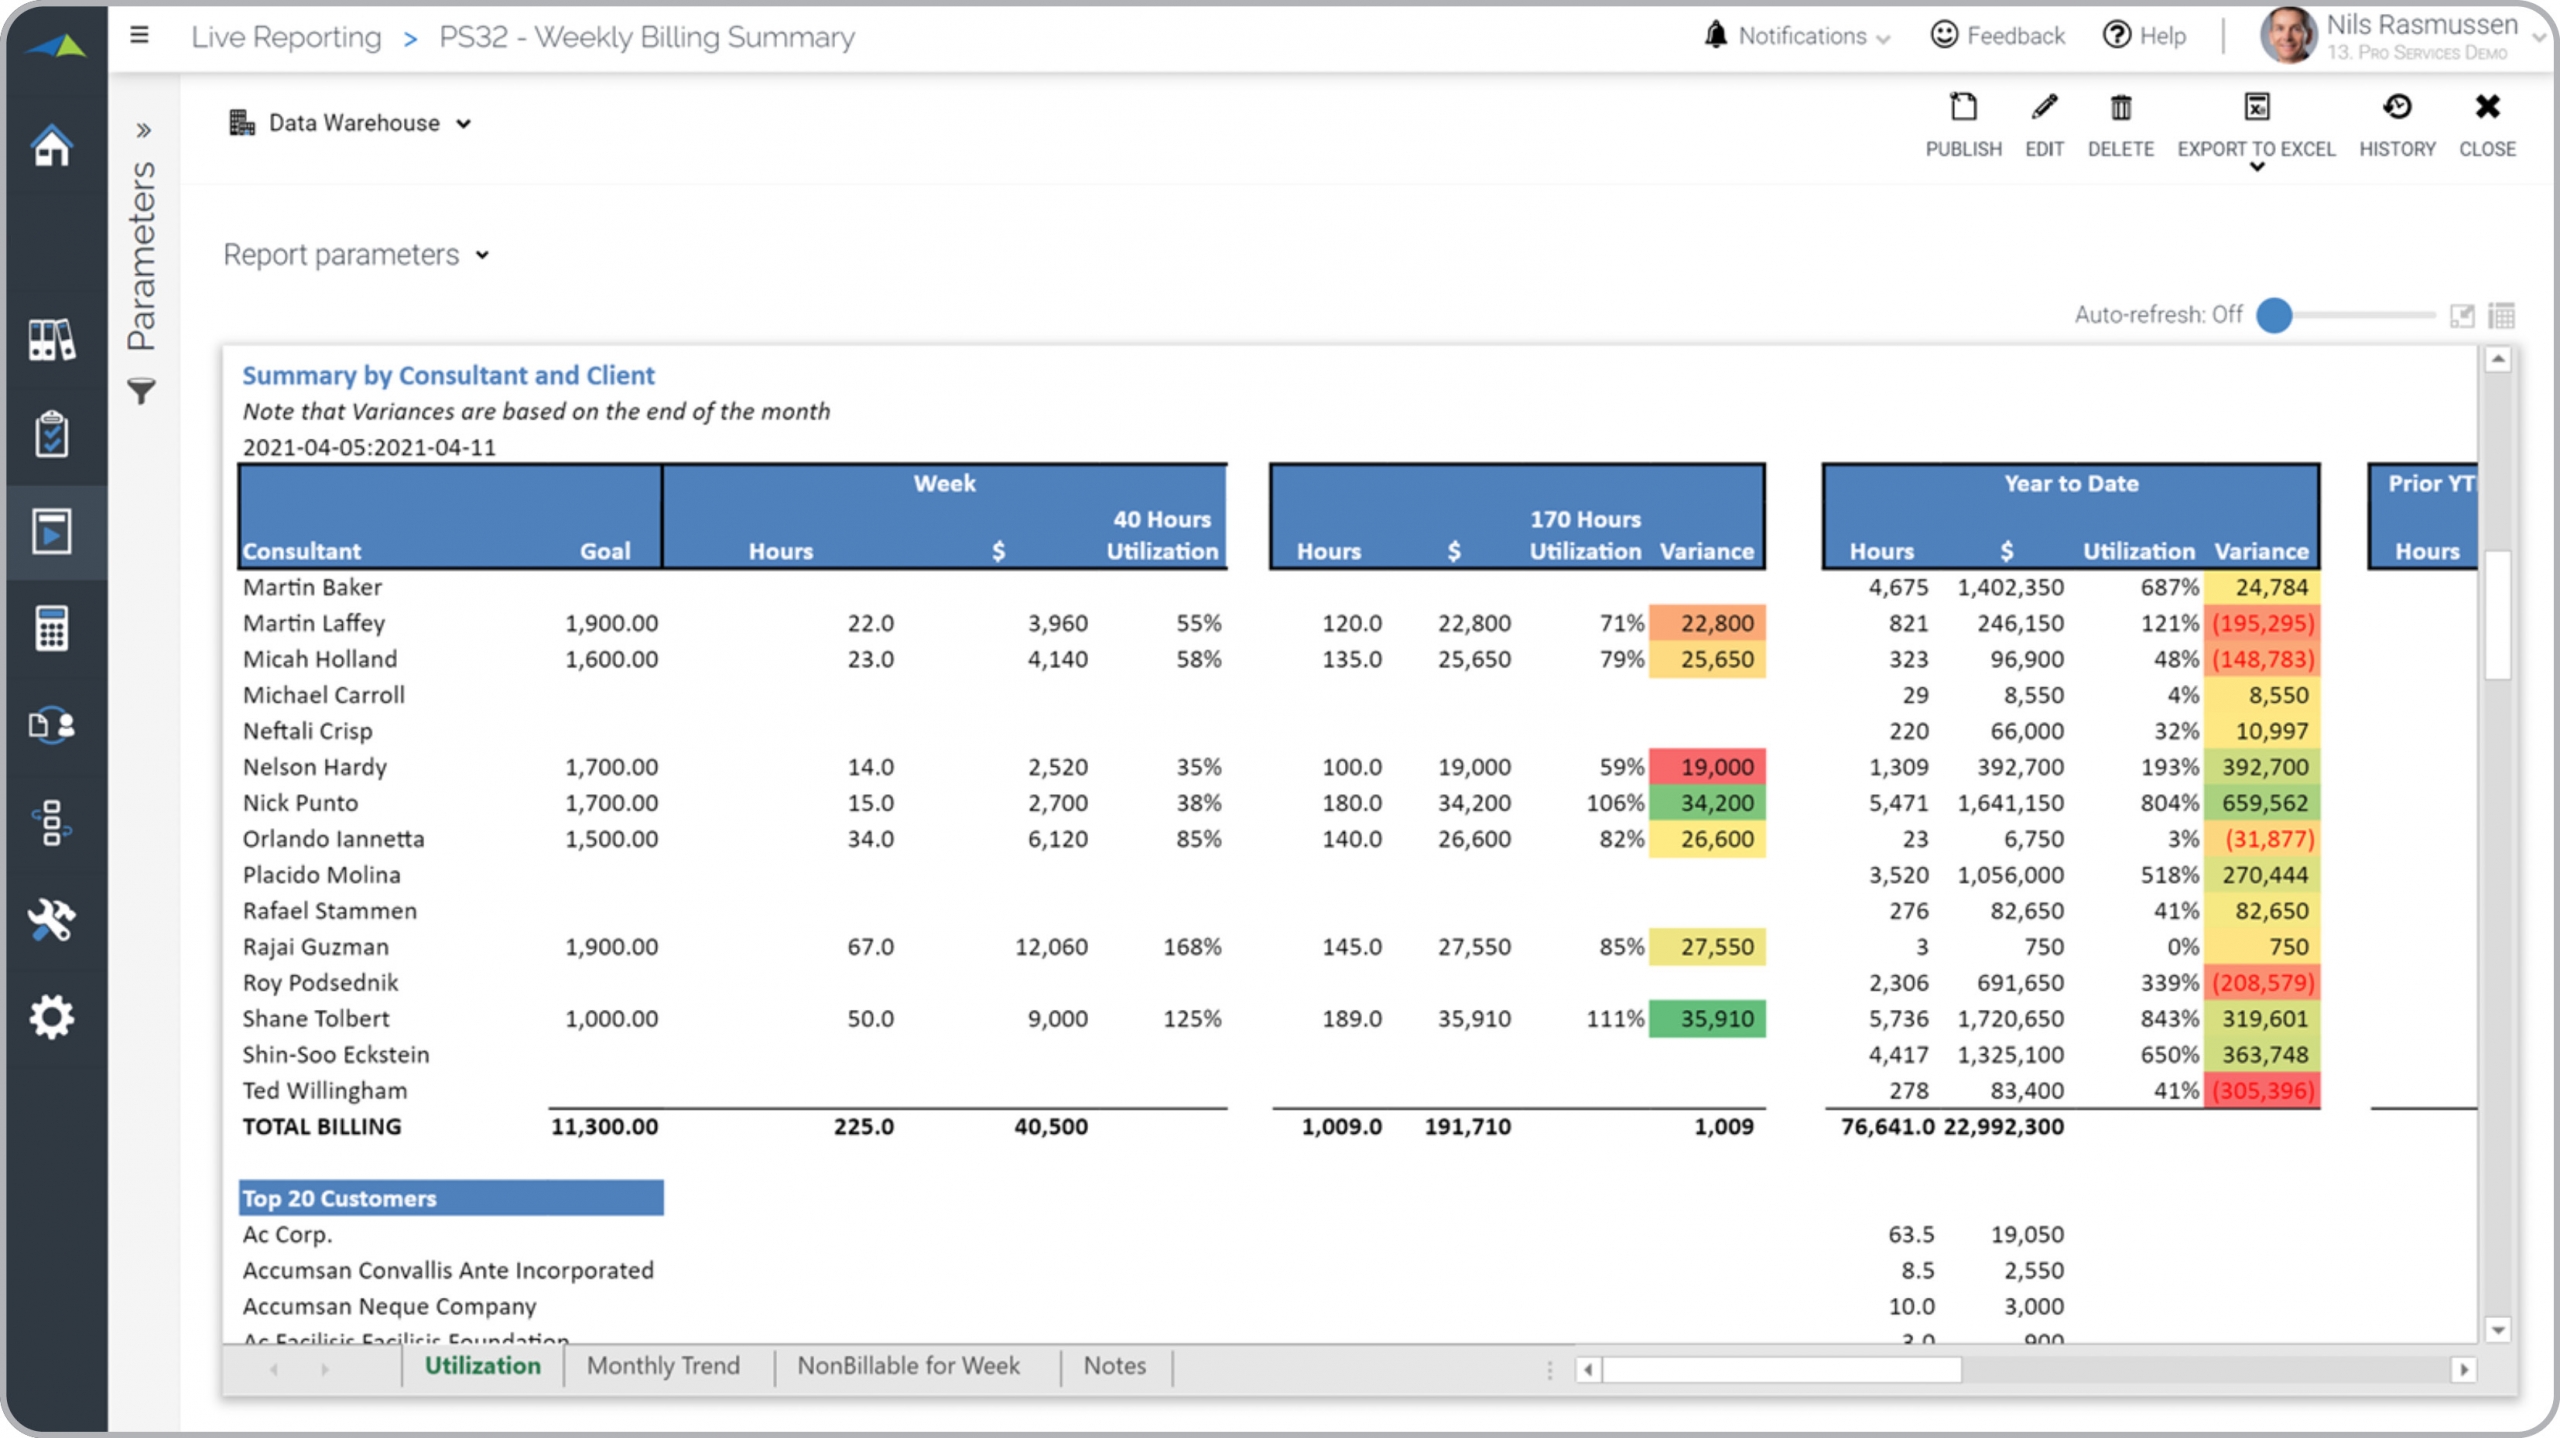
Professional Services – Customer Analysis
Shows billable and non-billable amounts, hours and geographic location per customer.
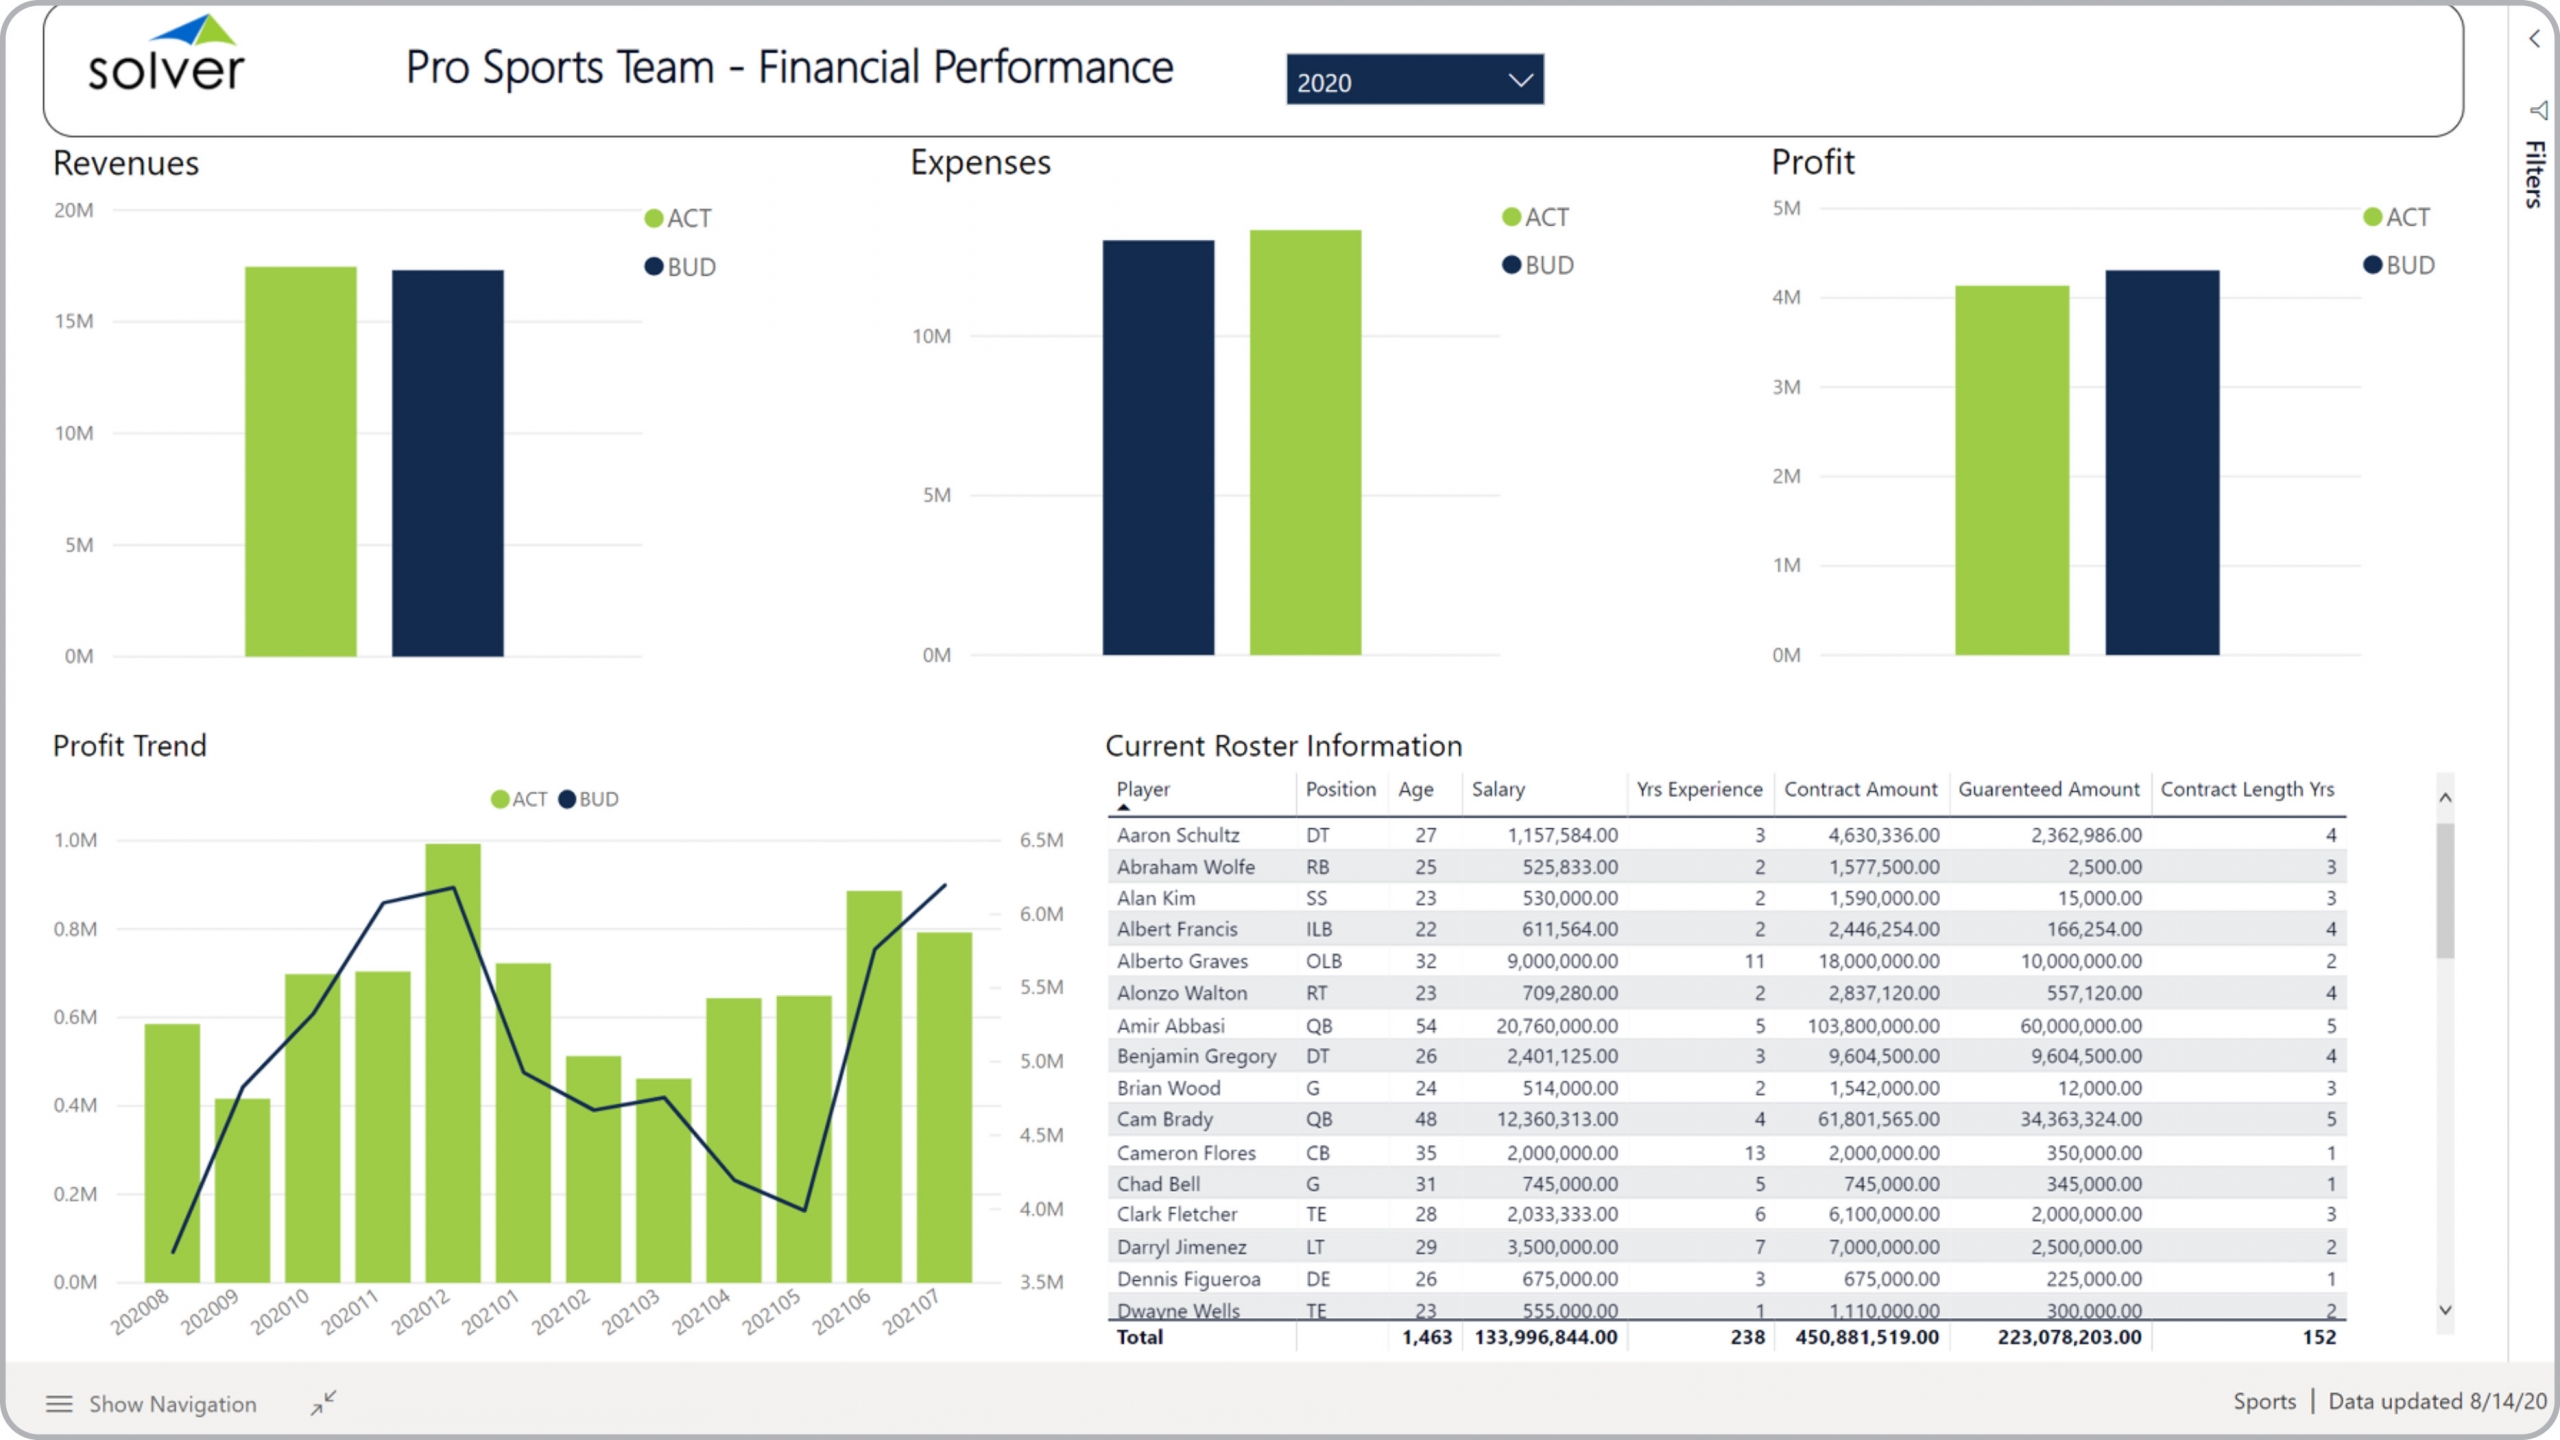
Sports – Financial Dashboard
Power BI dashboard showing actual vs budget and trend for key financial KPIs. Also shows roster metrics.
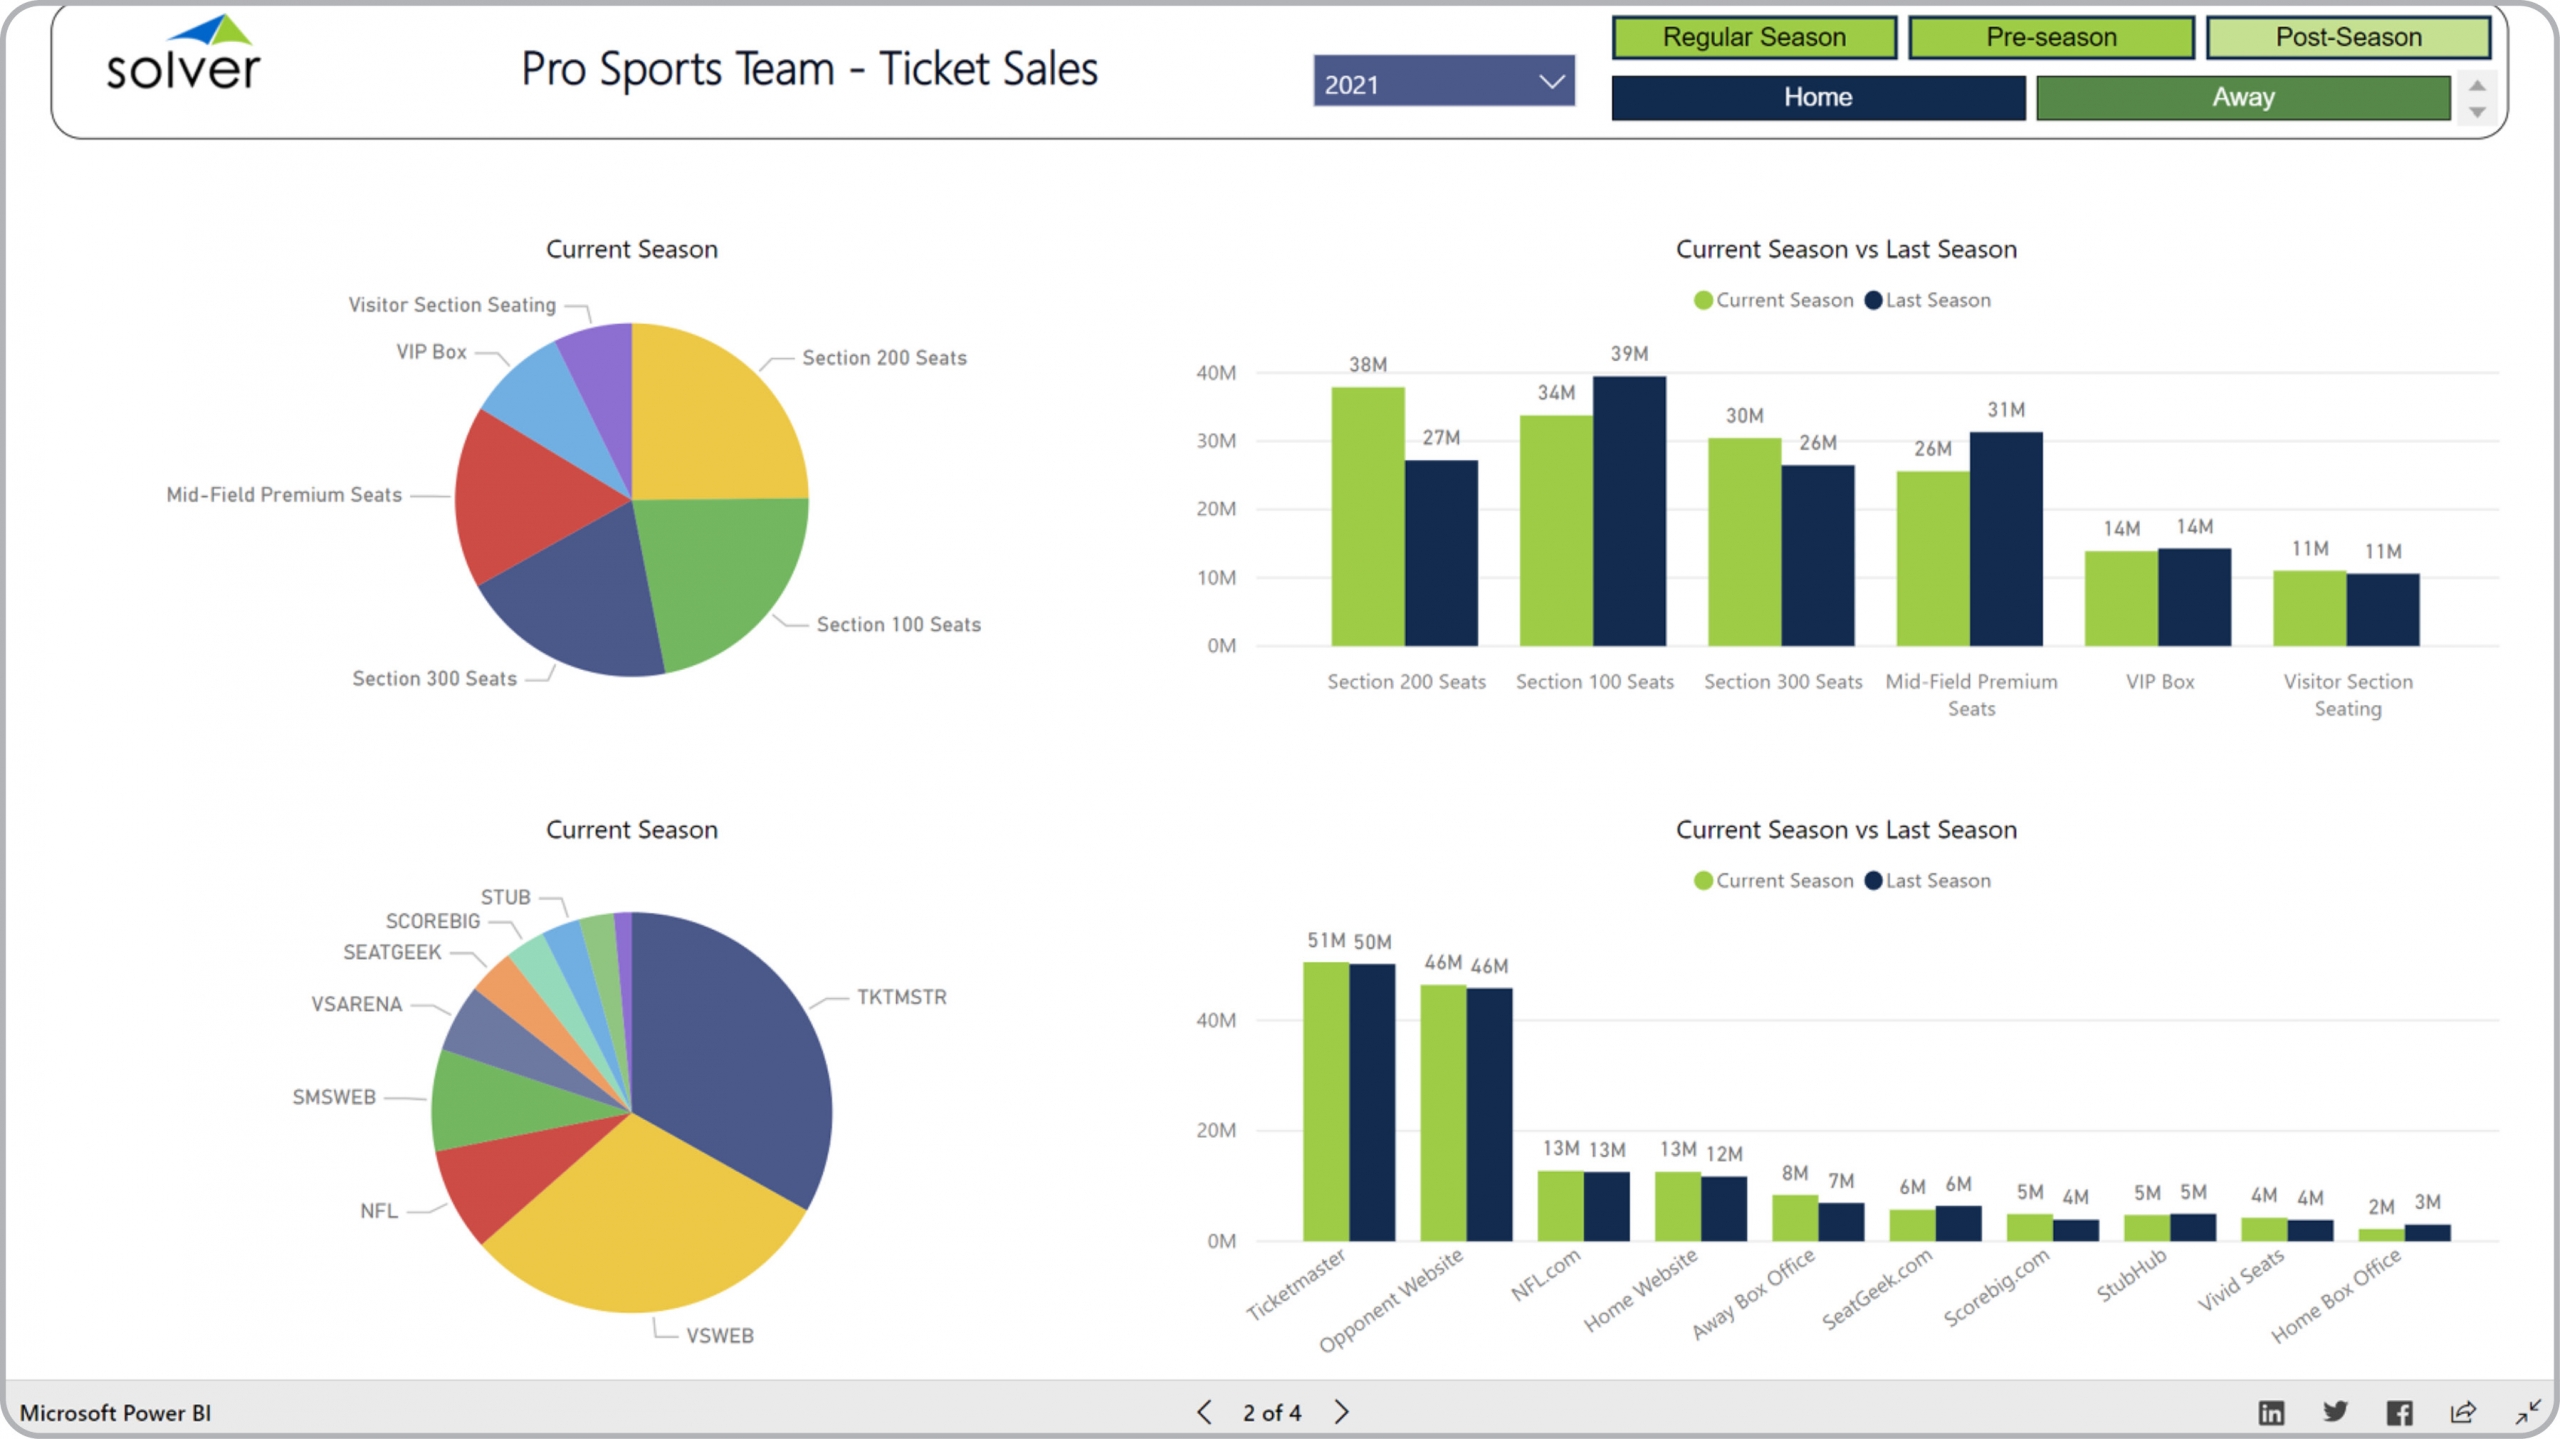
Sports – Ticket Sales Analysis
Power BI dashboard showing ticket sales by Seat Type and by Vendor for current versus prior season.
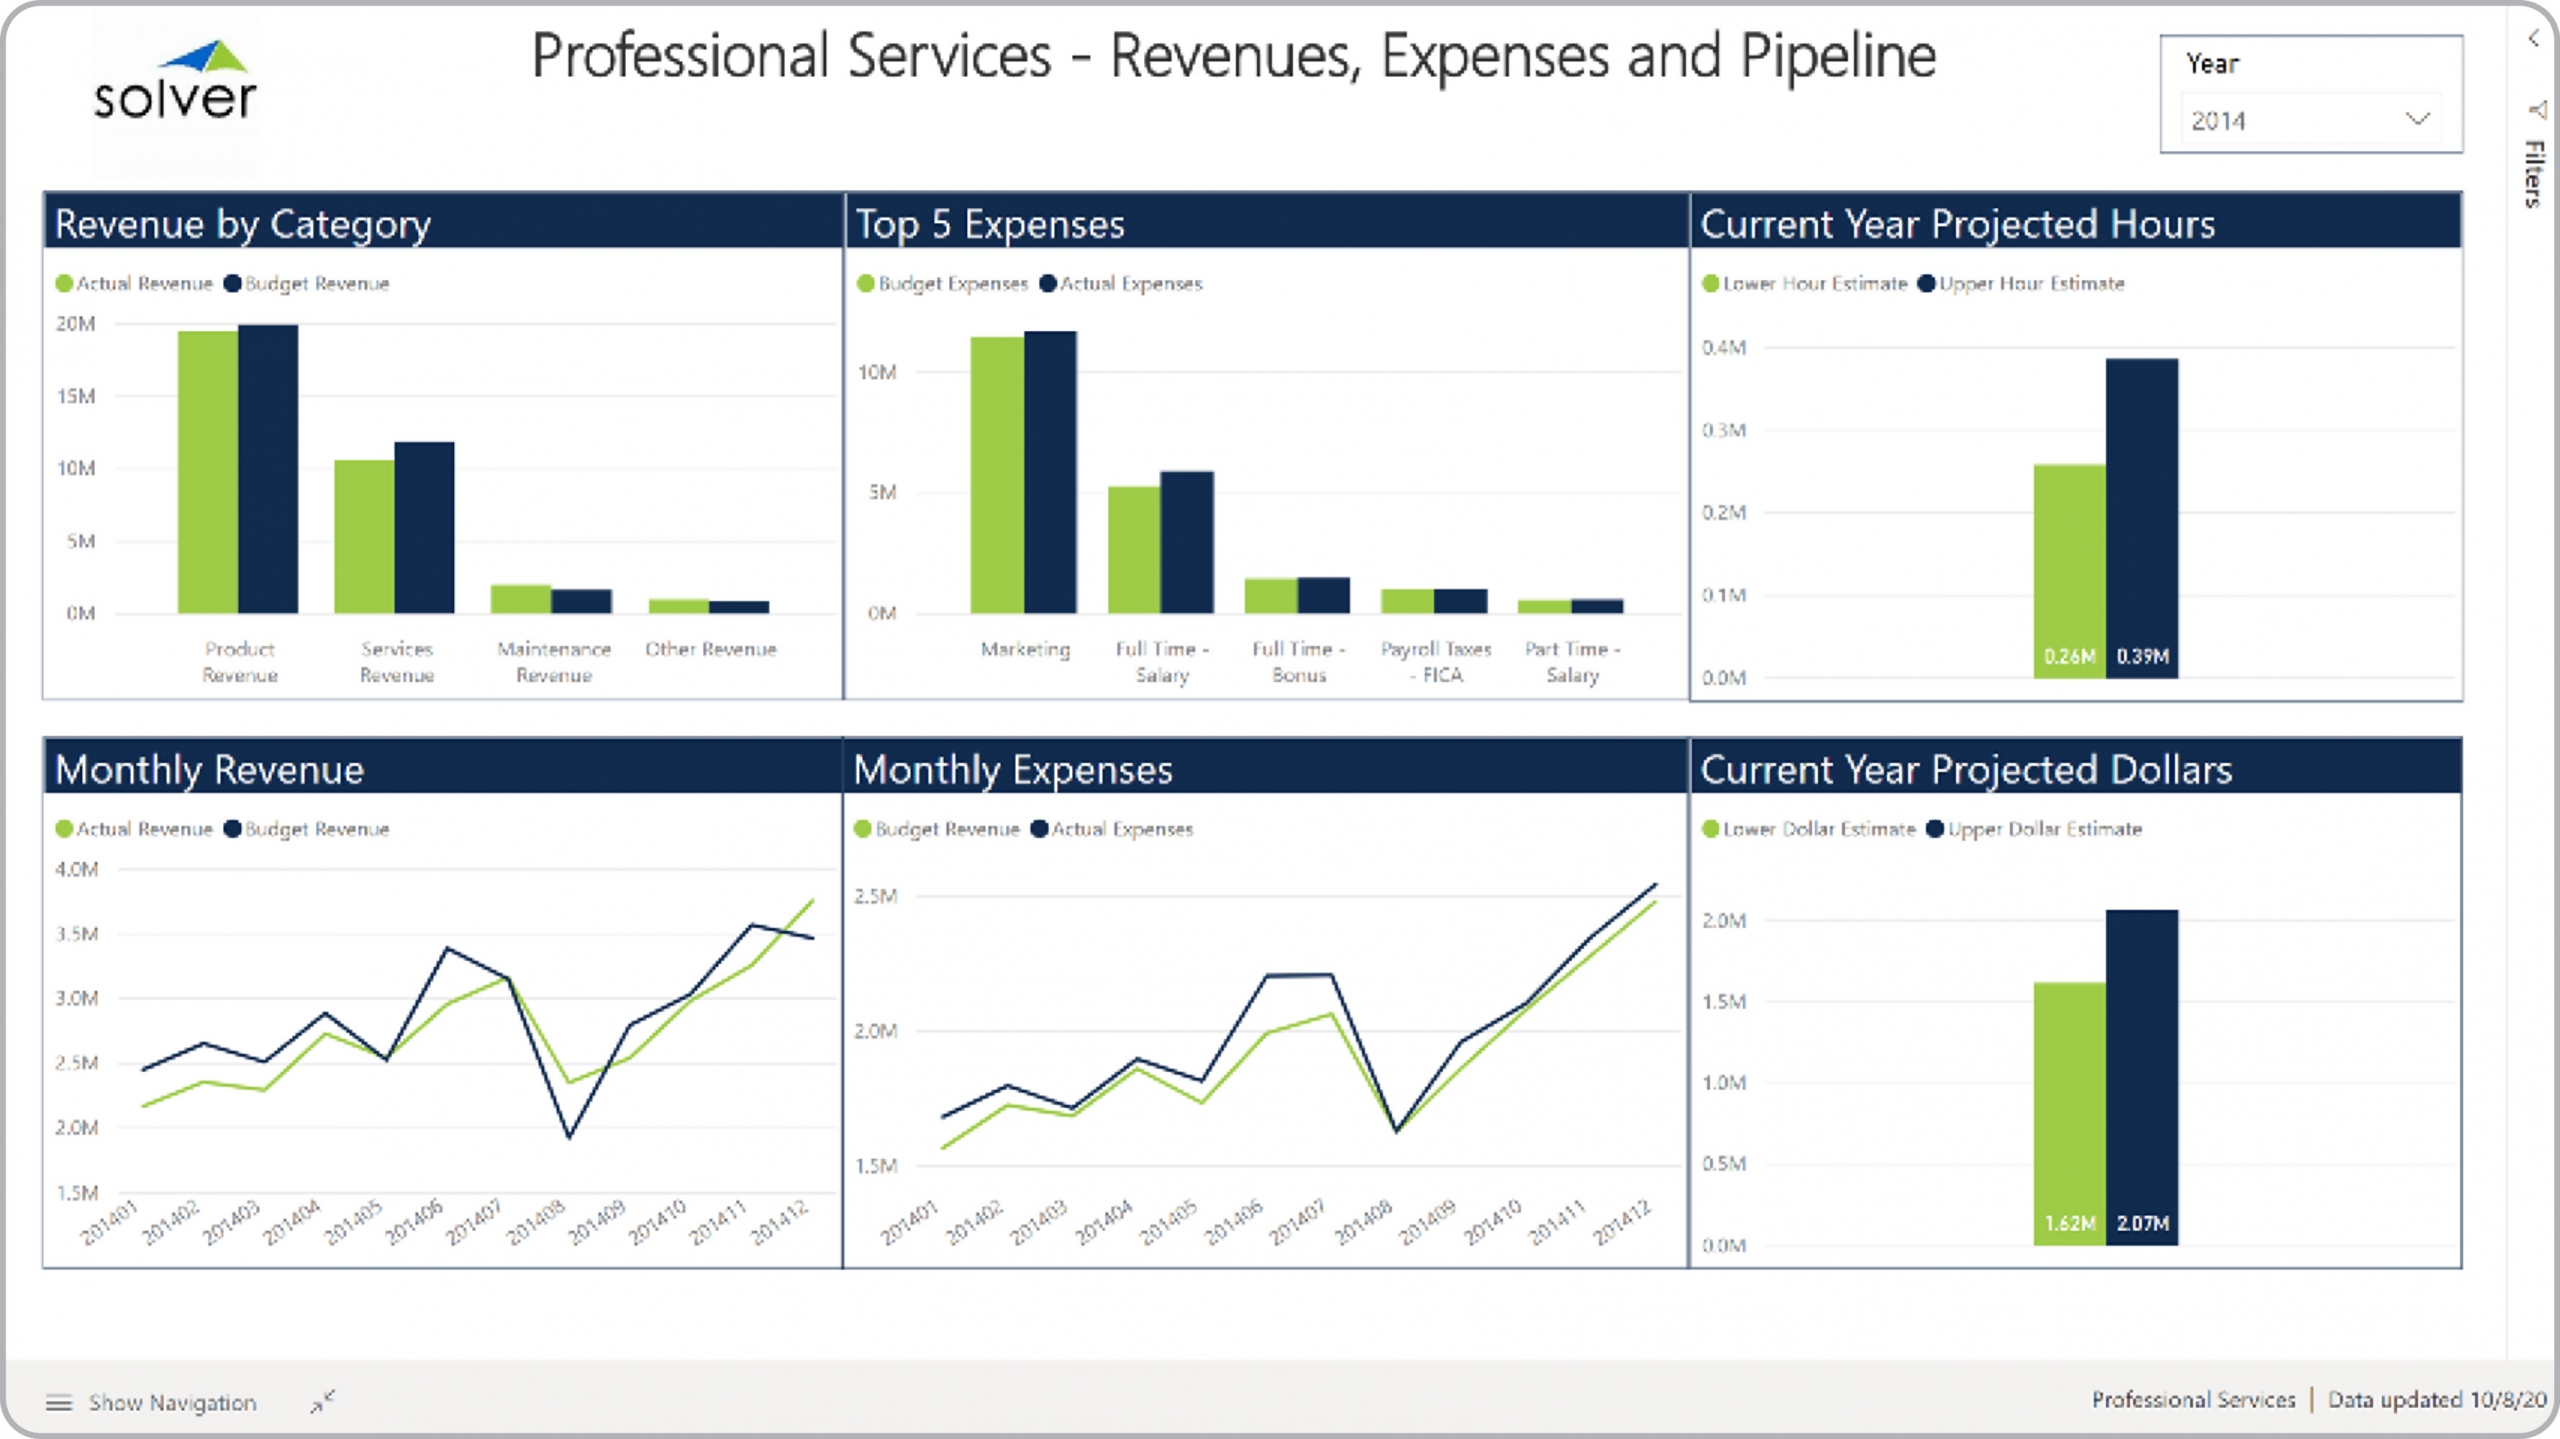
Professional Services – Revenue & Expense Analysis
Power BI dashboard showing key financial metrics with actual to budget comparison and trend, hours and amount est.
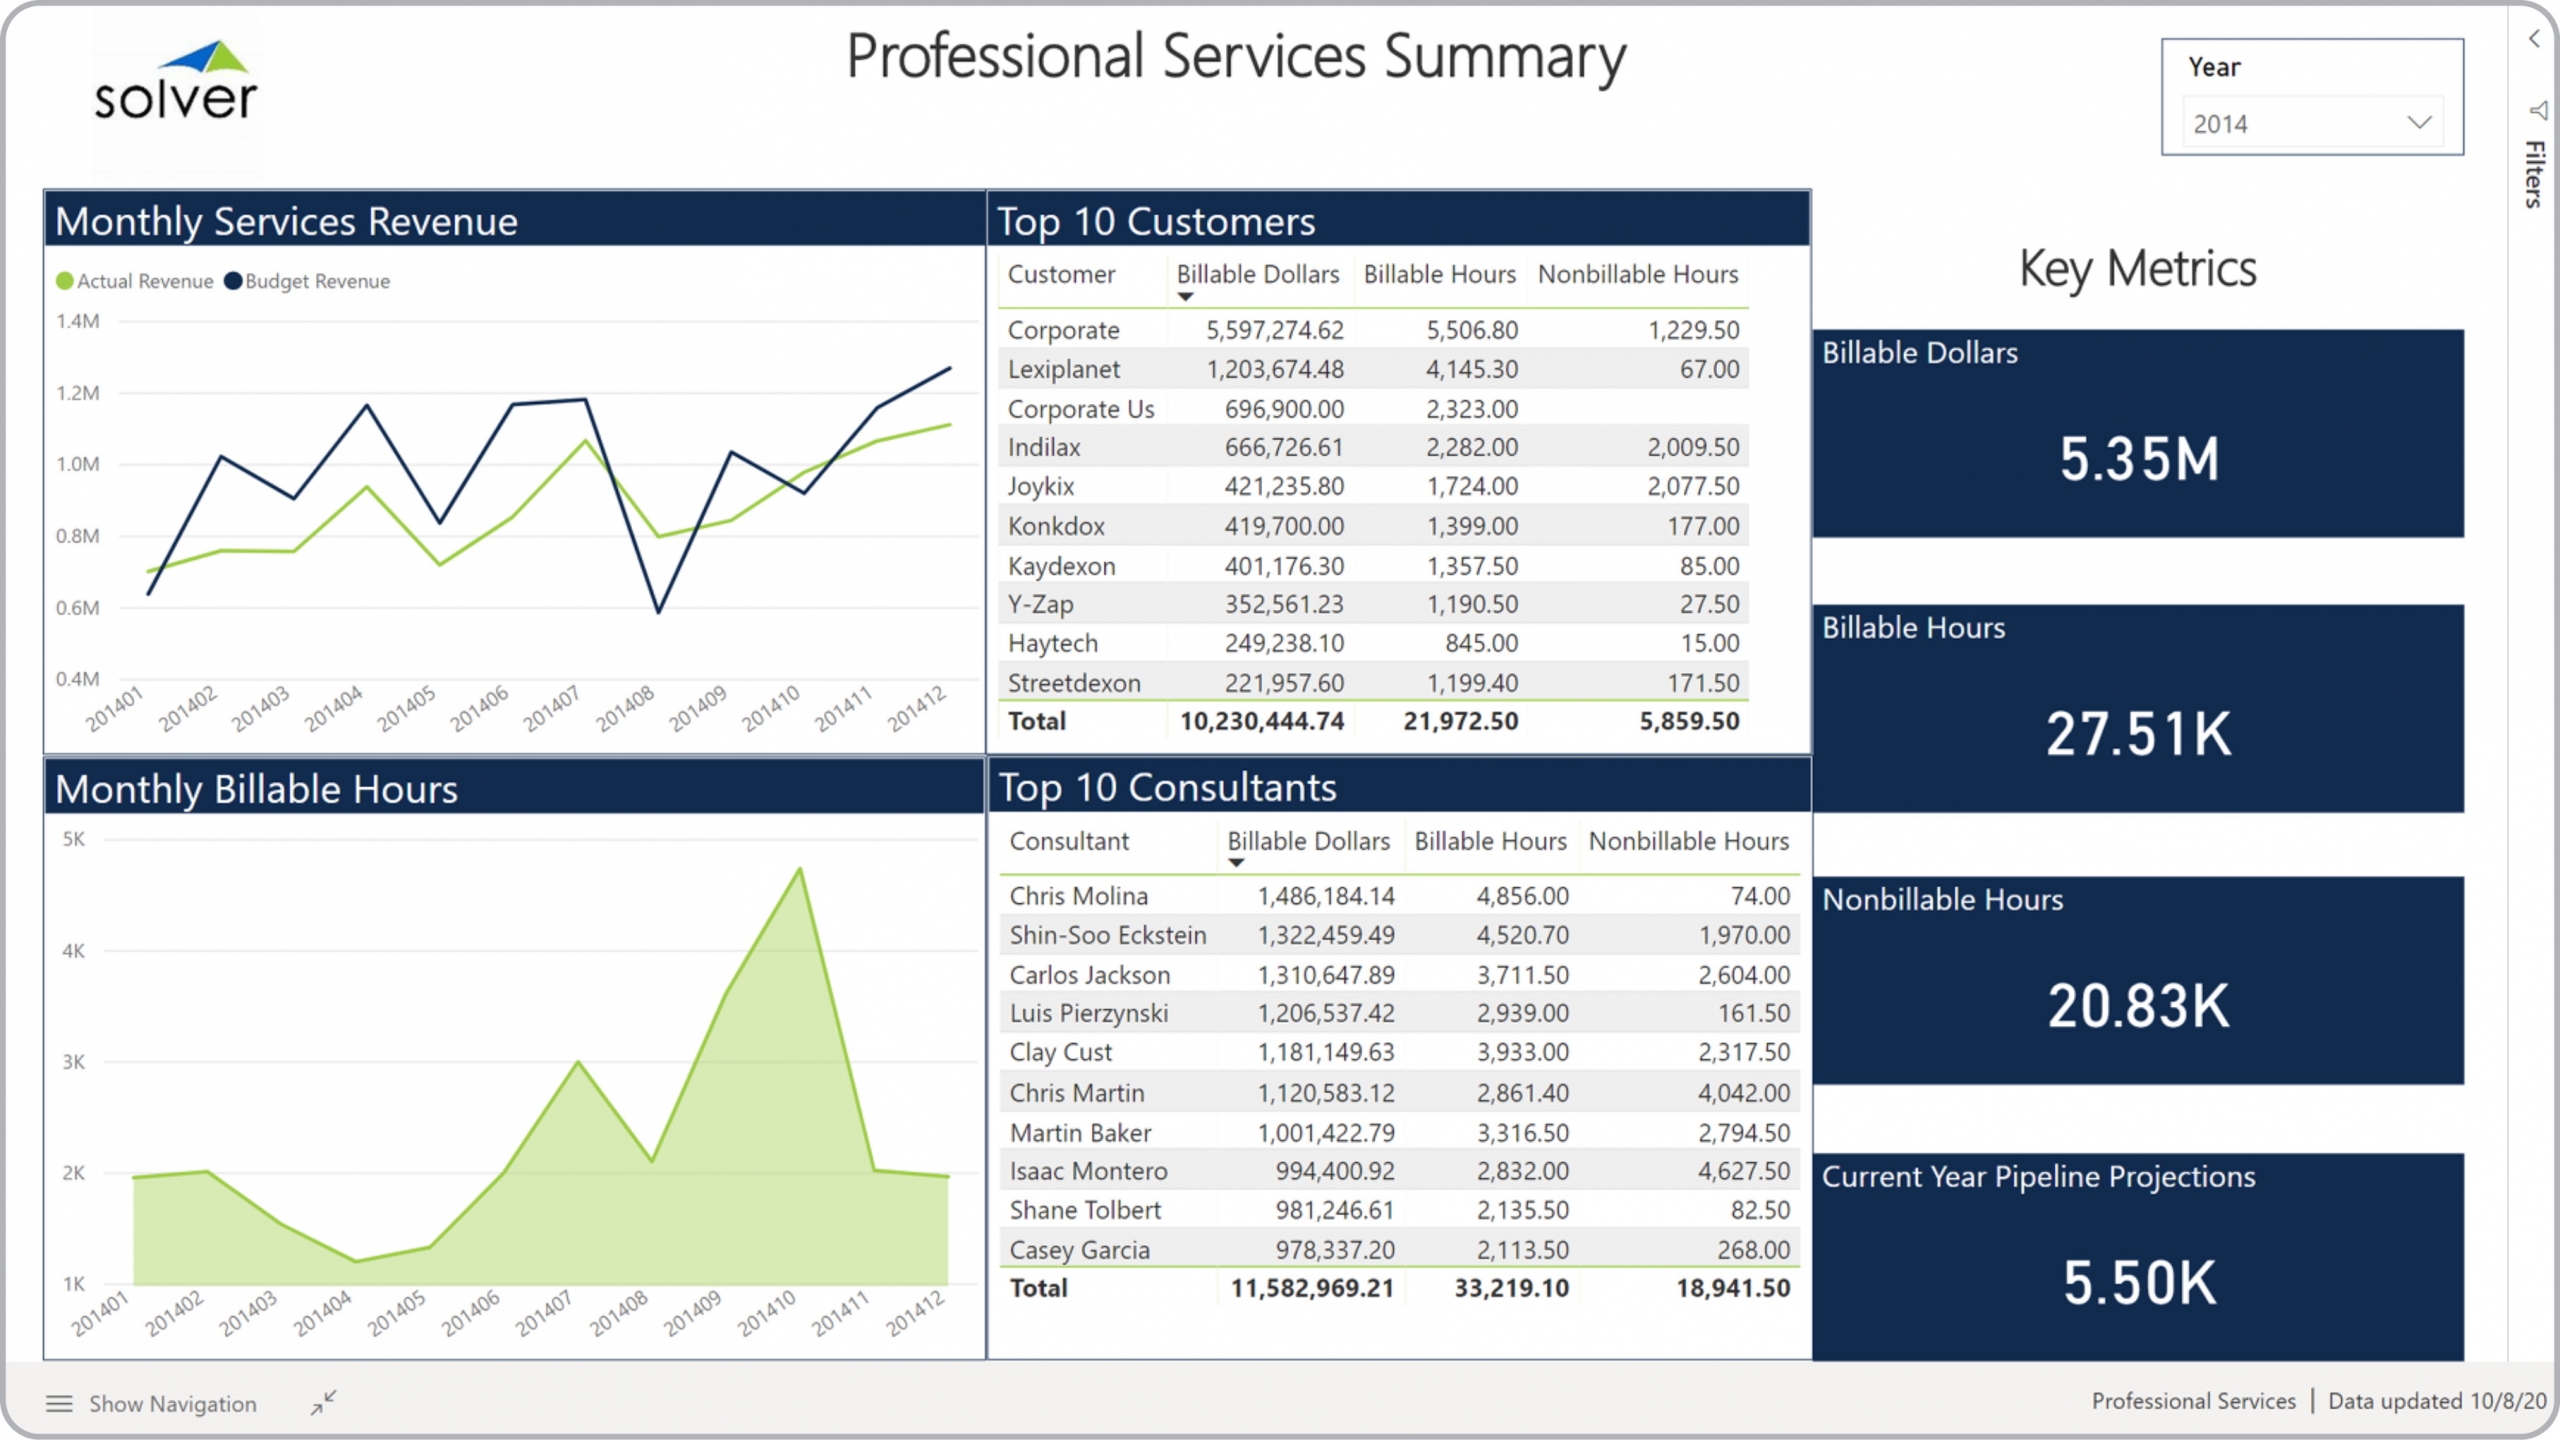
Professional Services – Key Metrics
Power BI dashboard showing actual vs budget trend, billable hours trend, top customers, top consultants, etc.
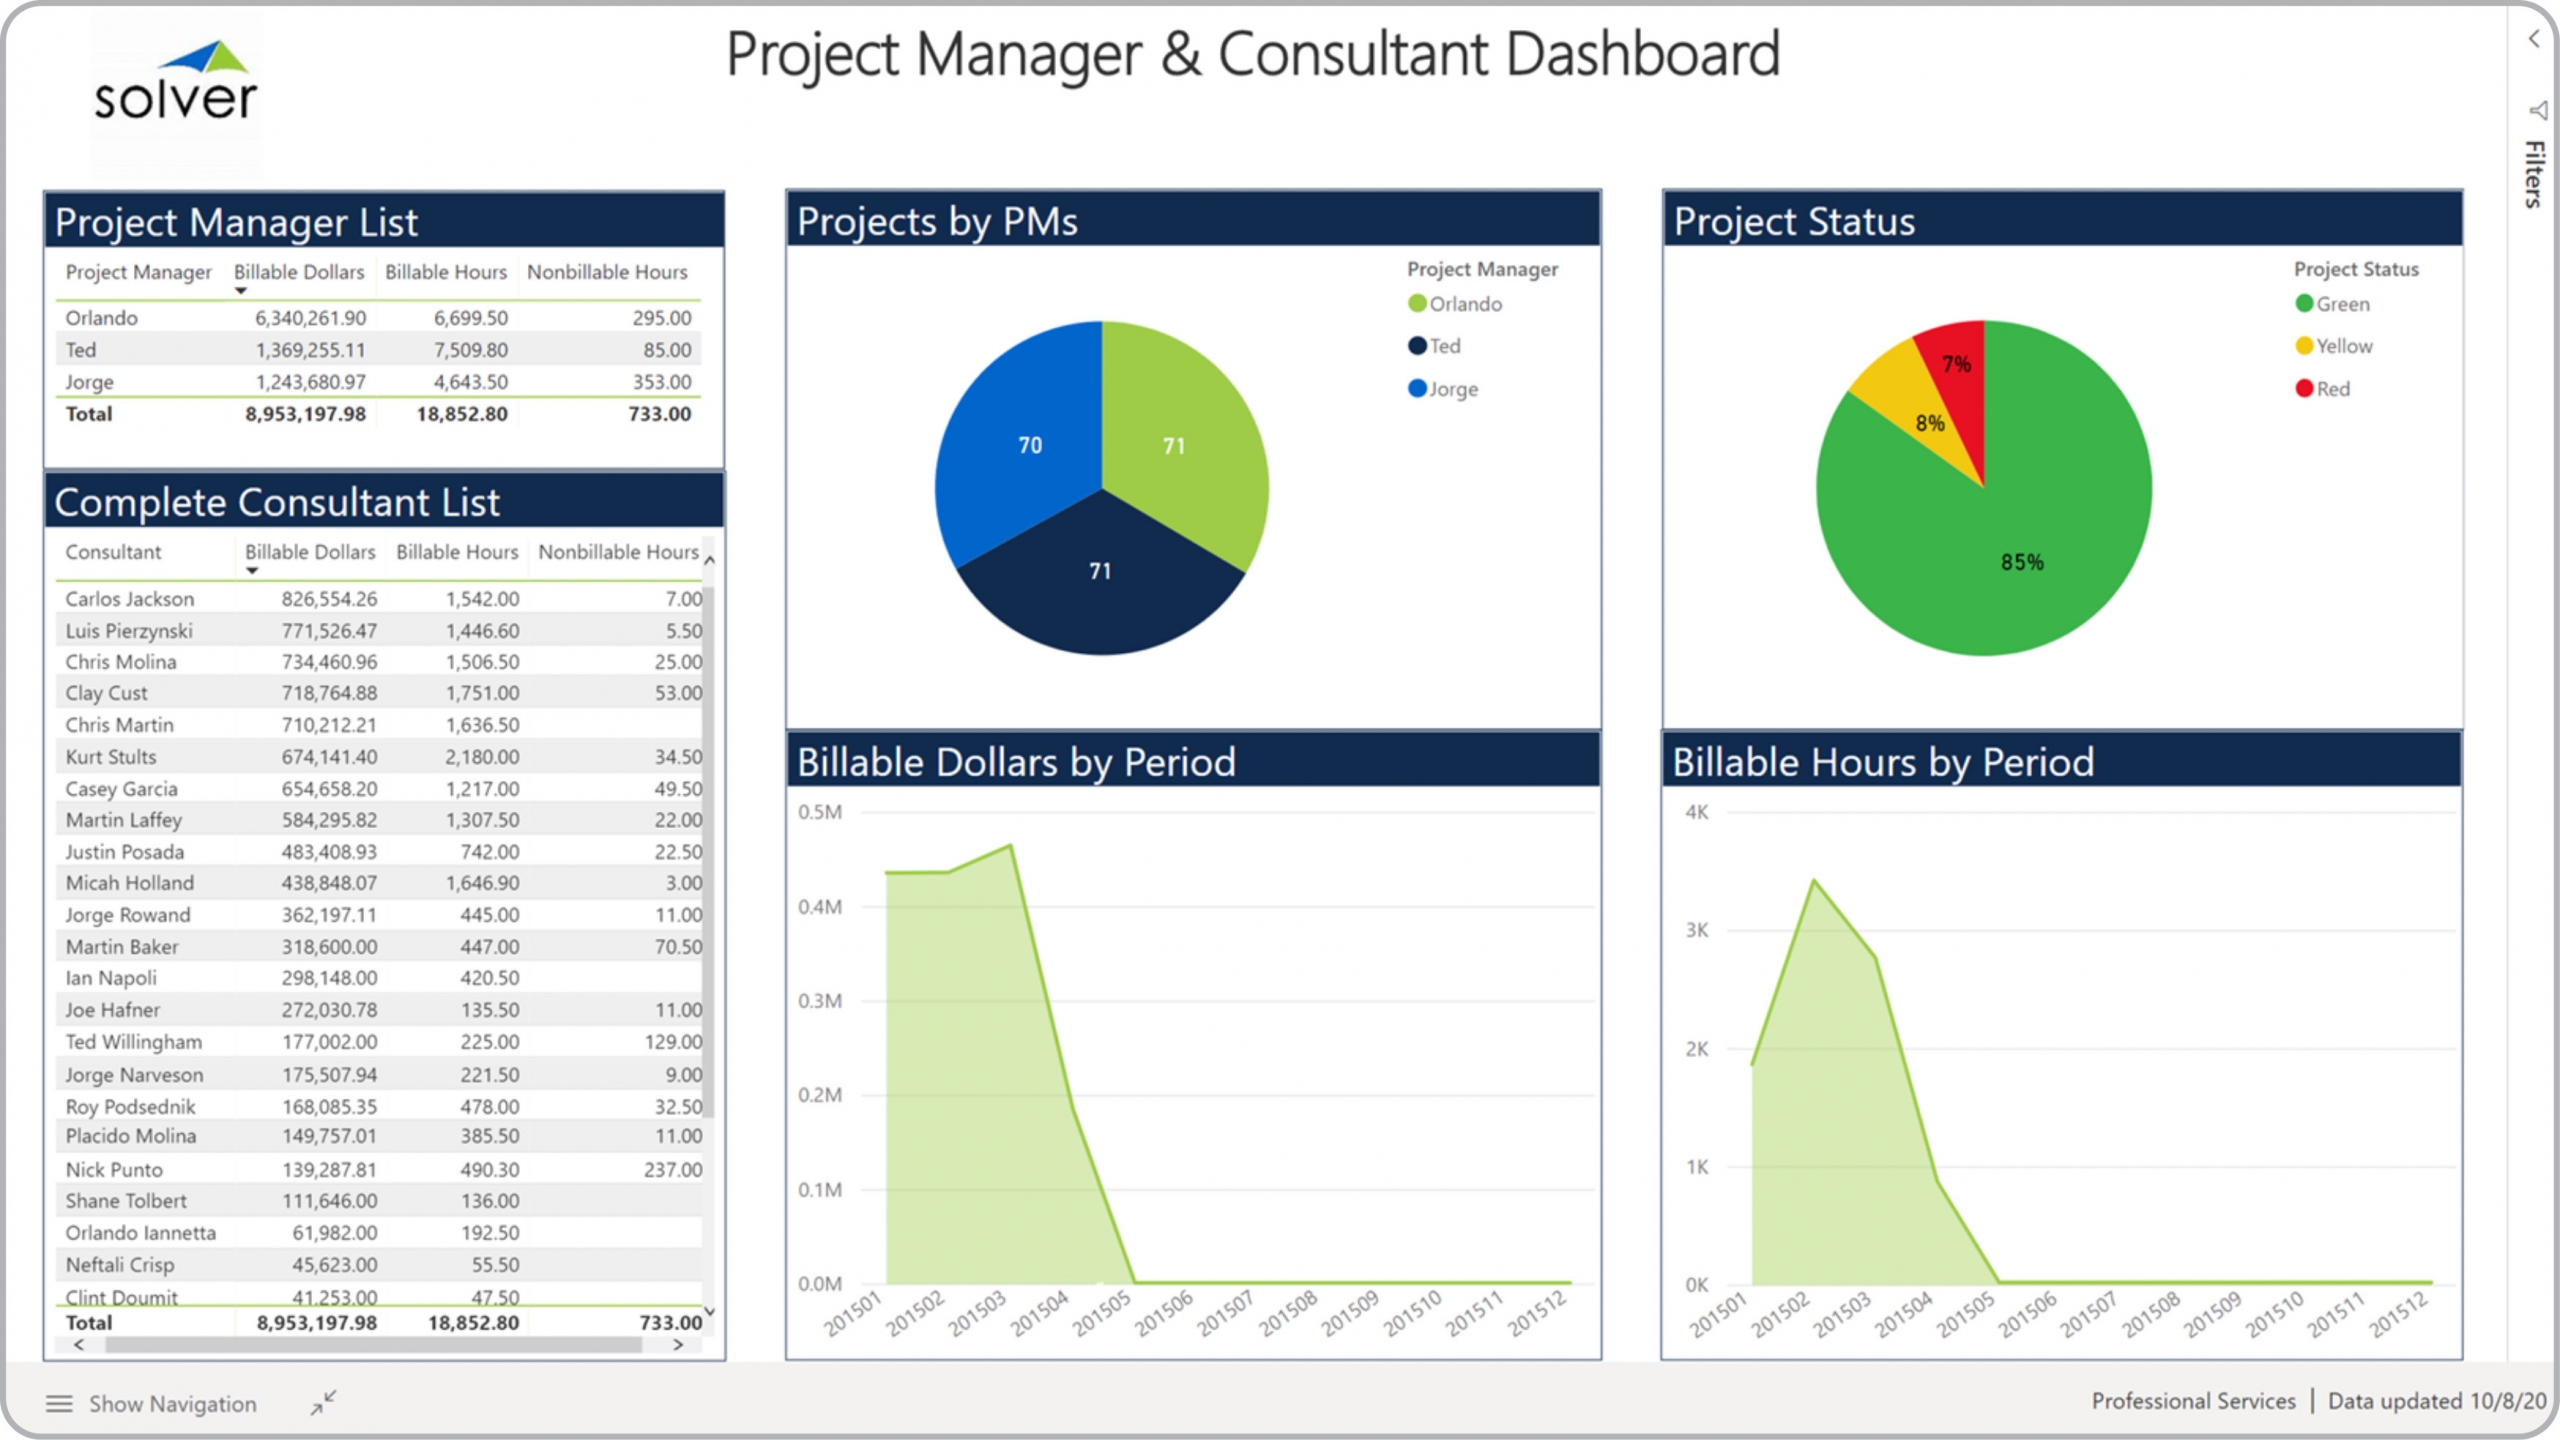
Professional Services – Project Manager and Consultants
Power BI dashboard showing analysis of hours and billable amounts for project managers and consultants, and project status.
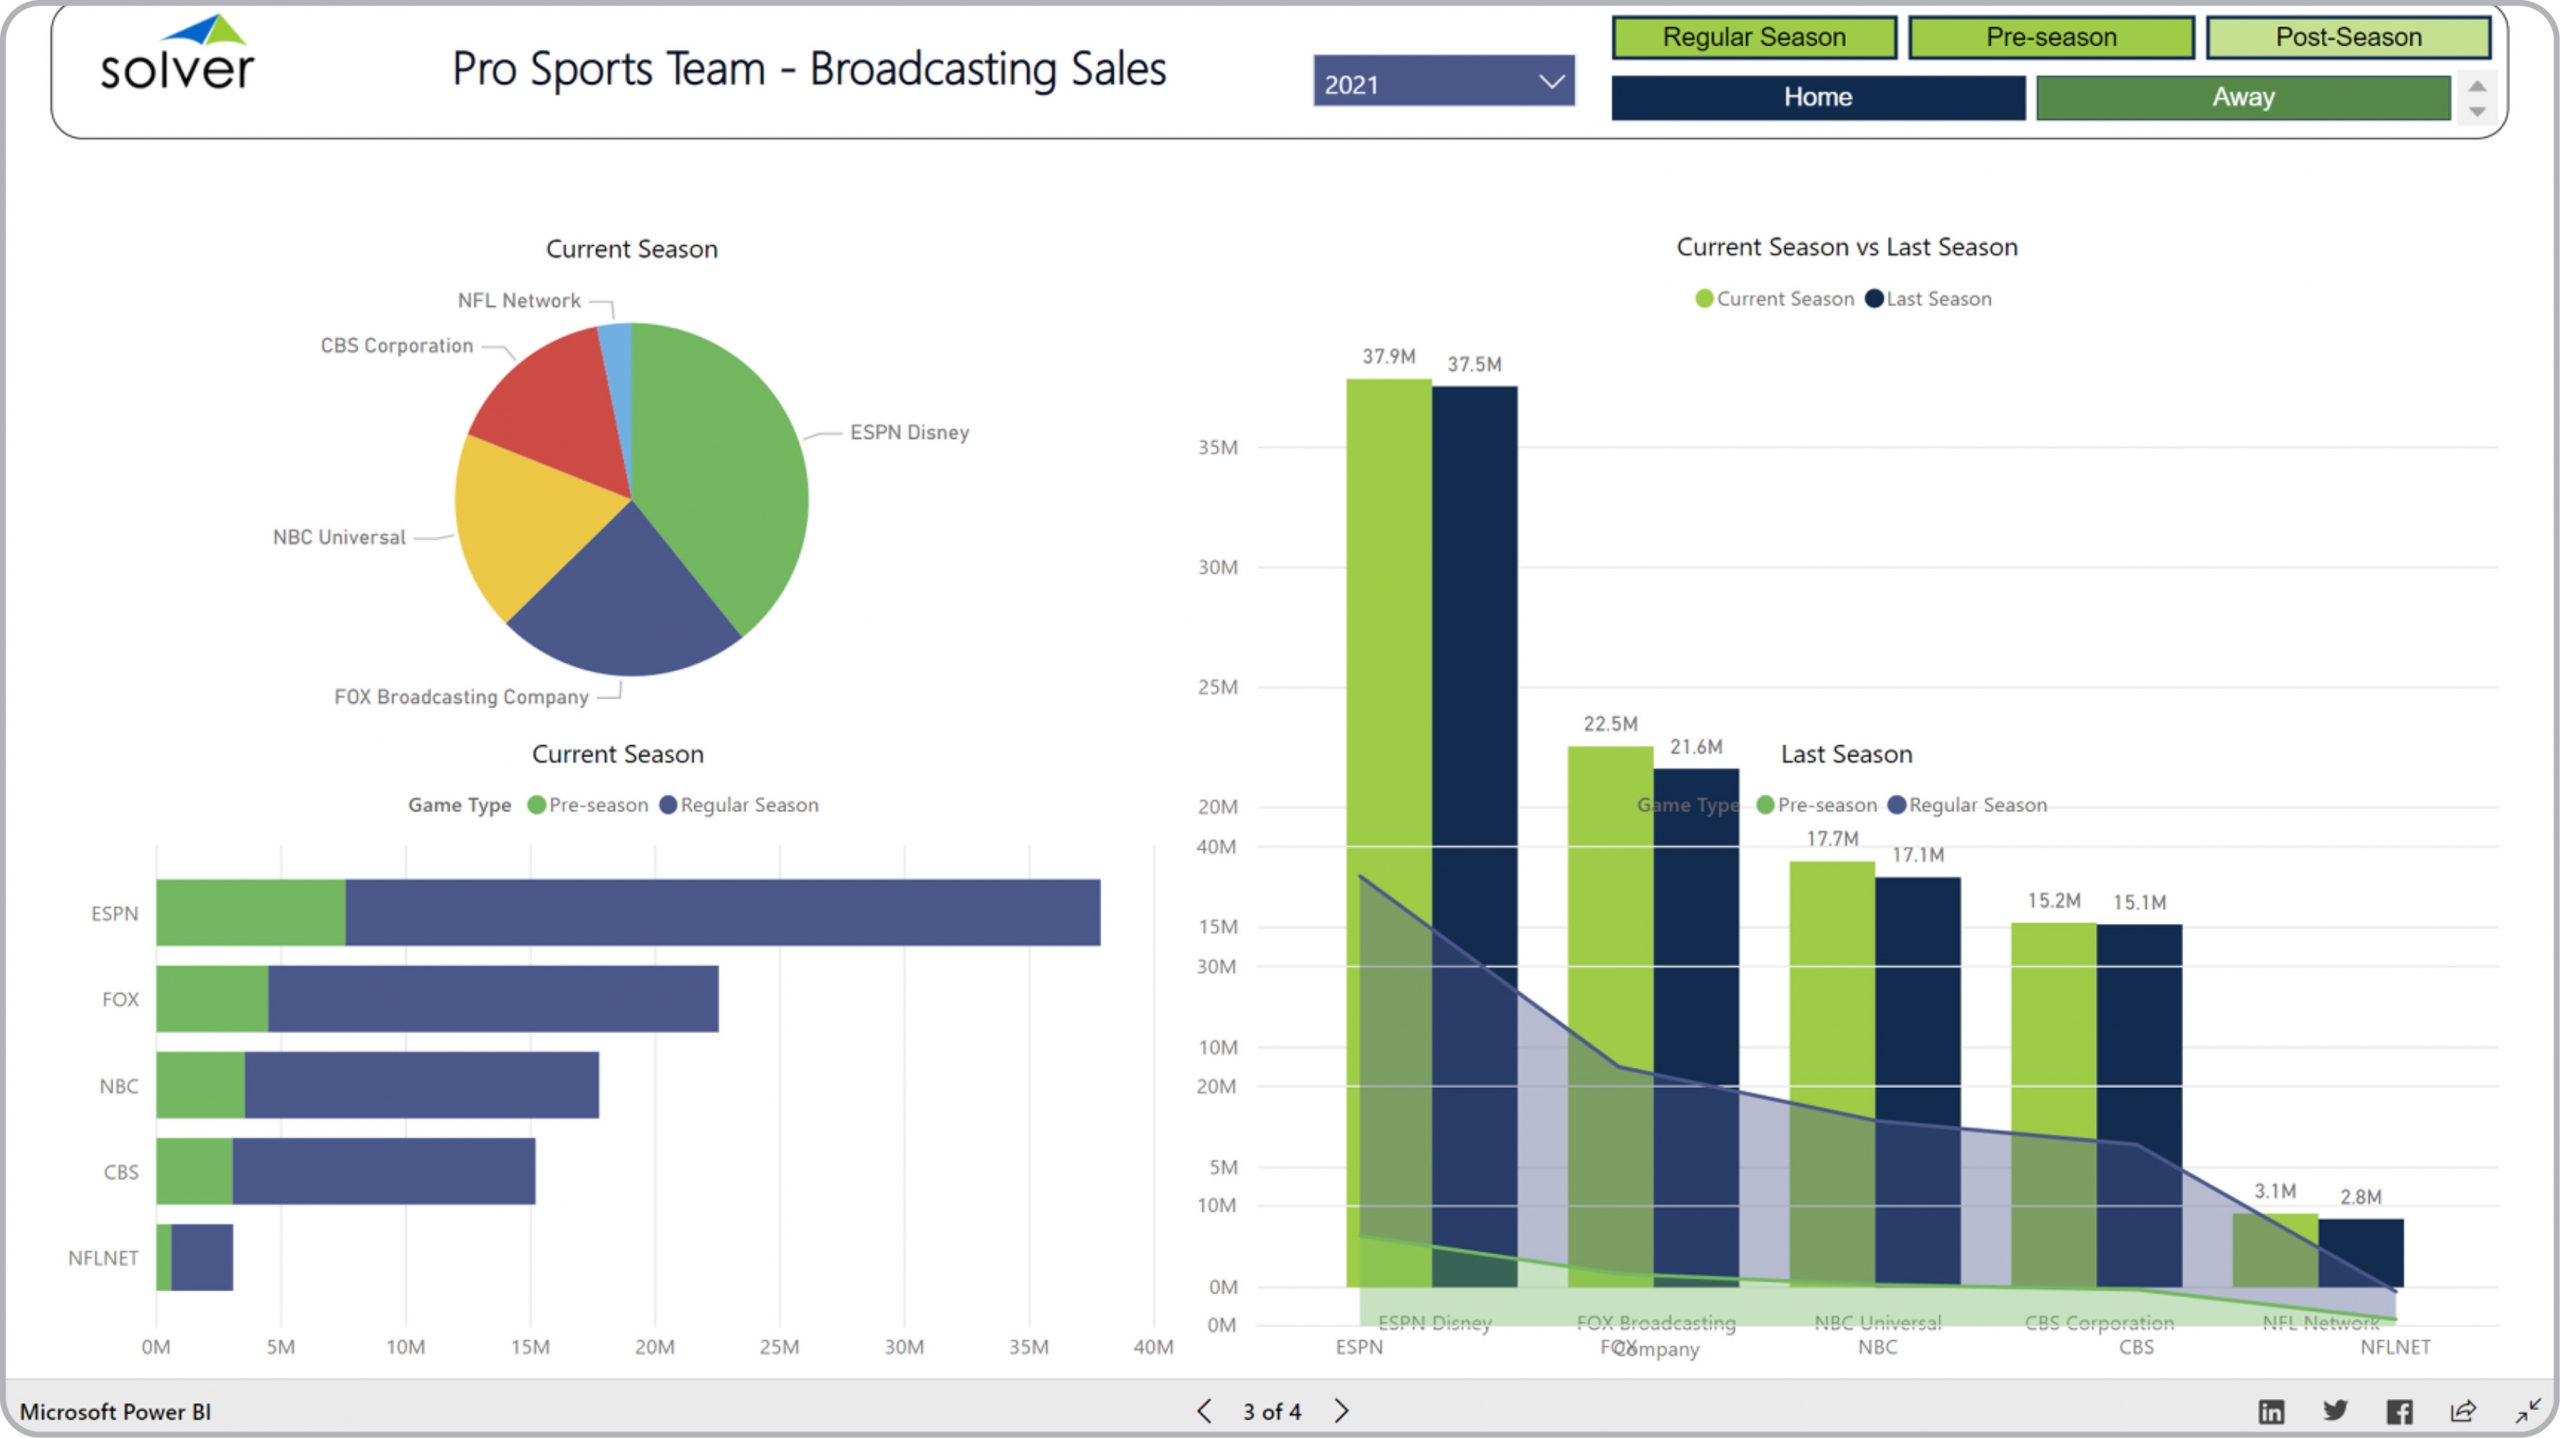
Sports – Broadcasting Sales
Power BI dashboard showing broadcasting sales by network, compared to pre- and post season and prior season.
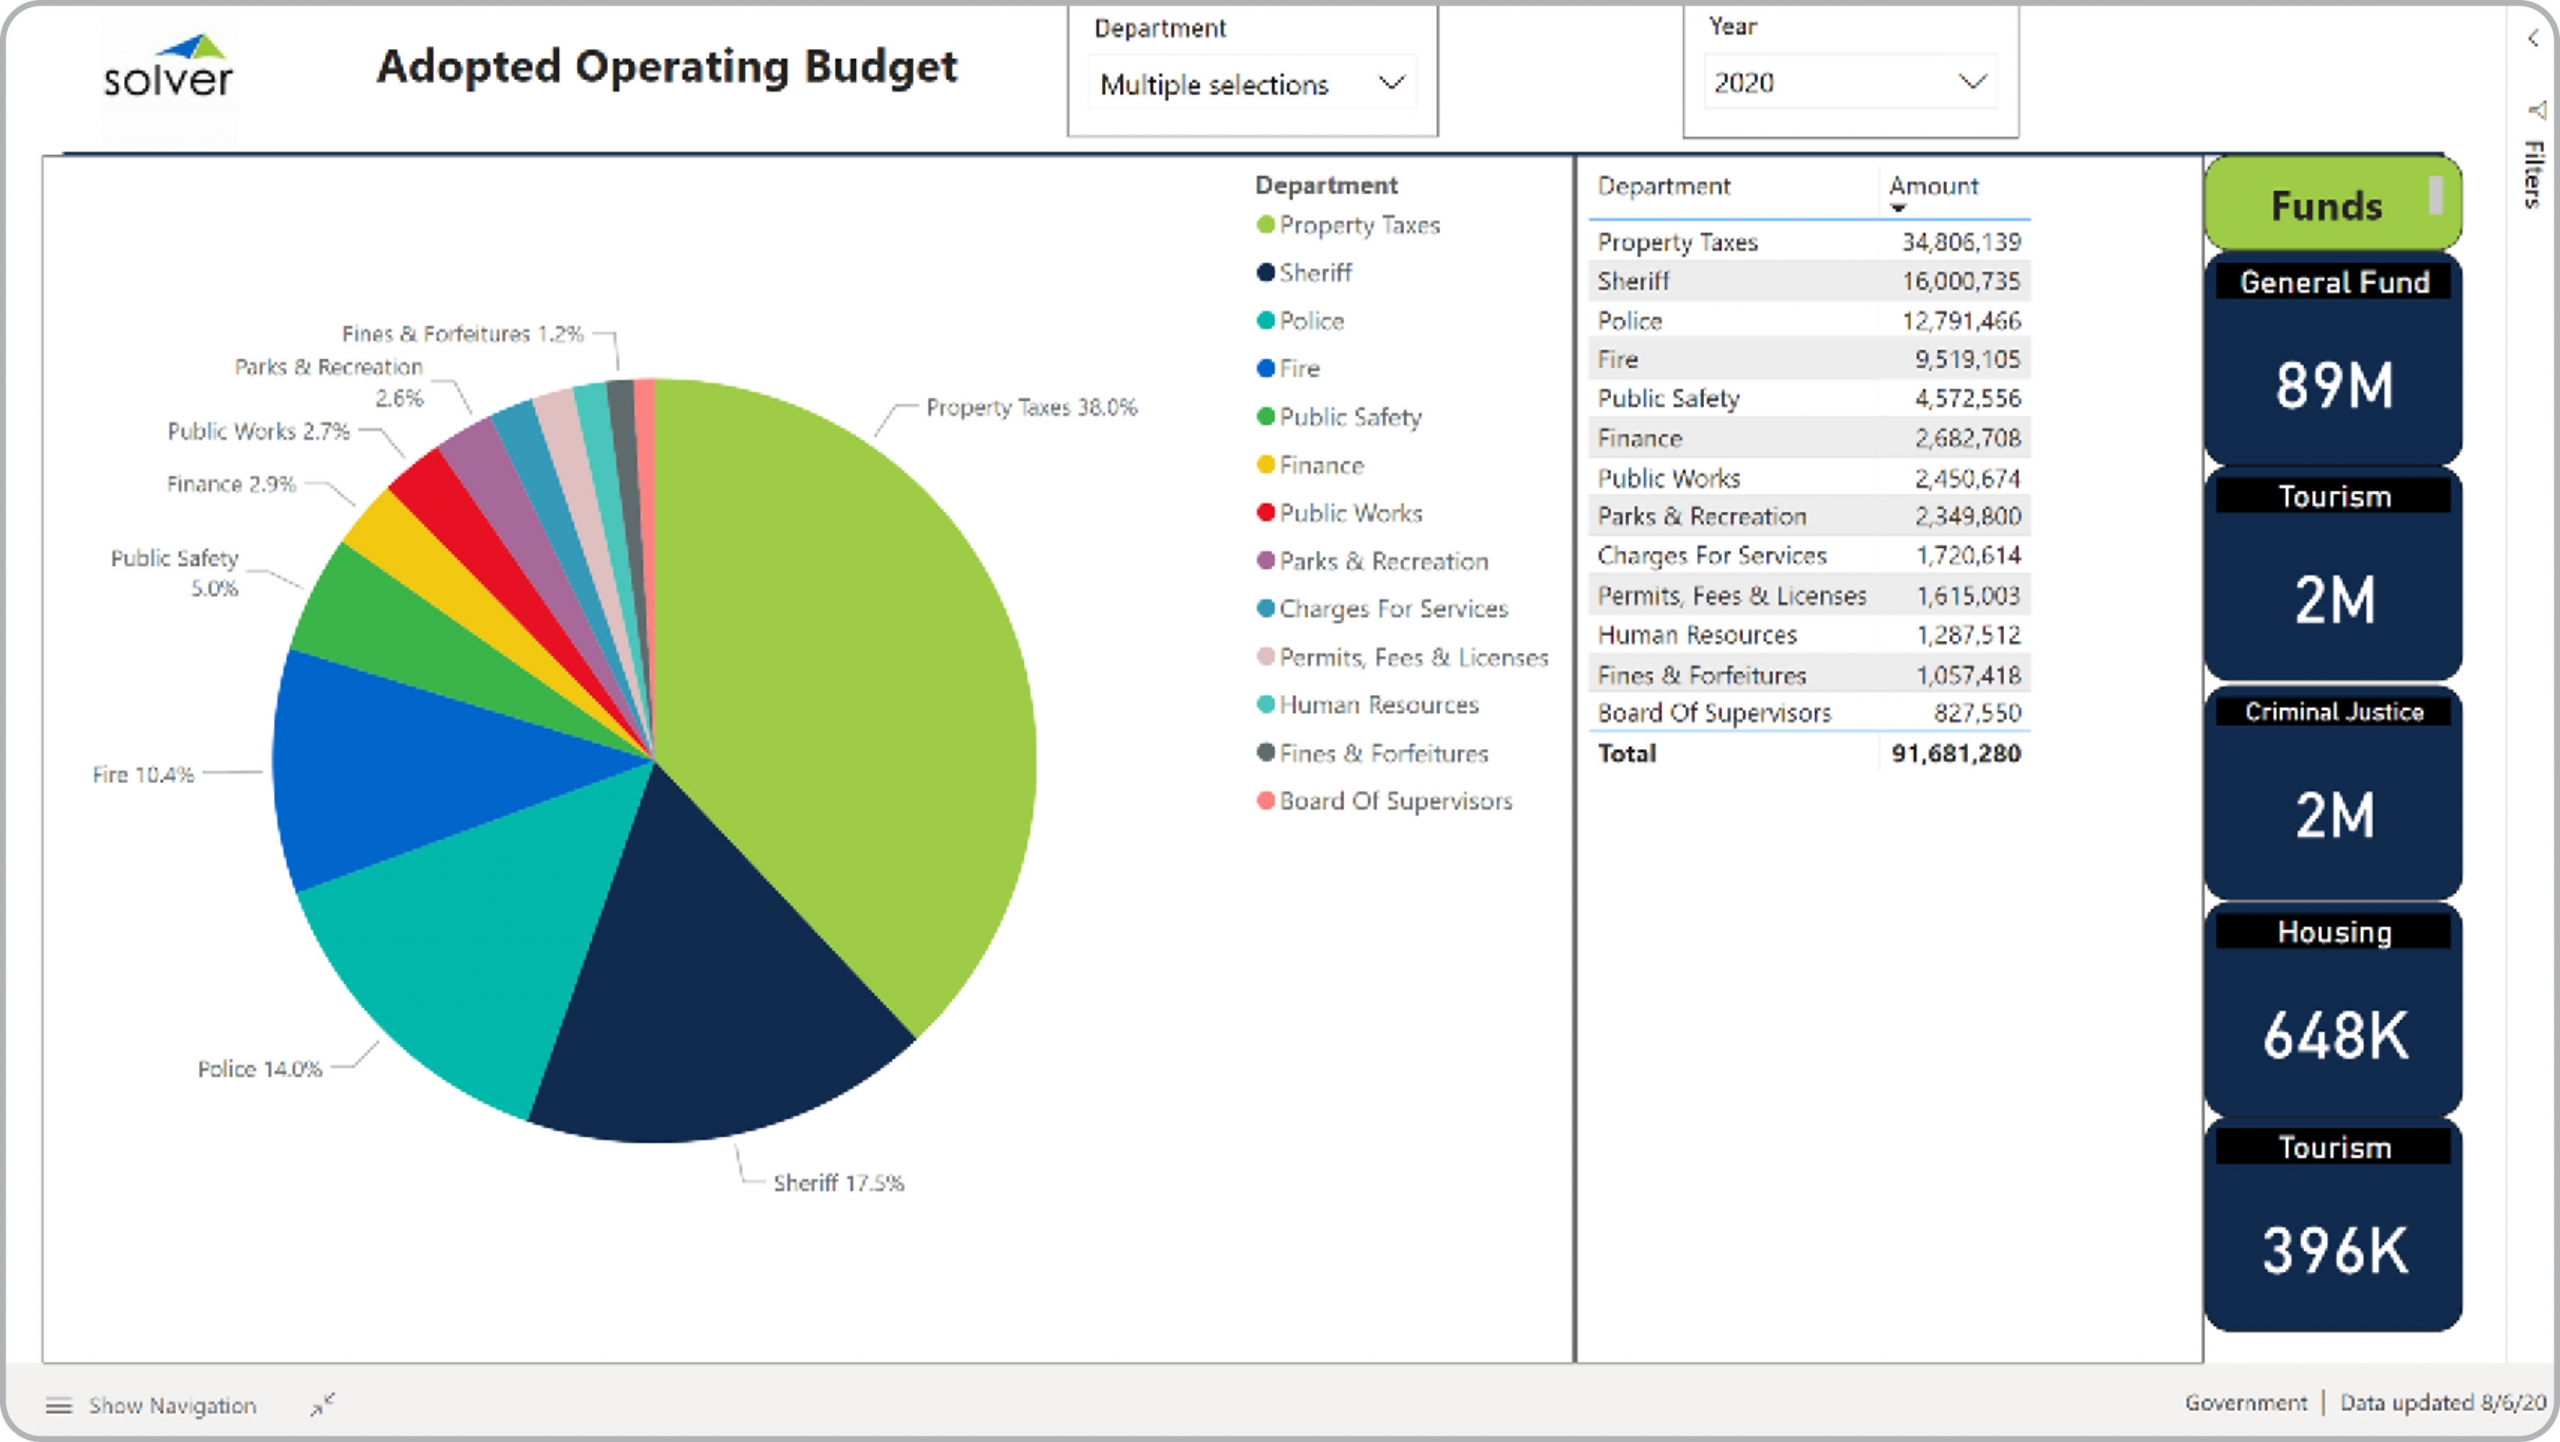
Government – Operating Budget Dashboard
Power BI dashboard showing analysis of the adopted budget by fund and department.
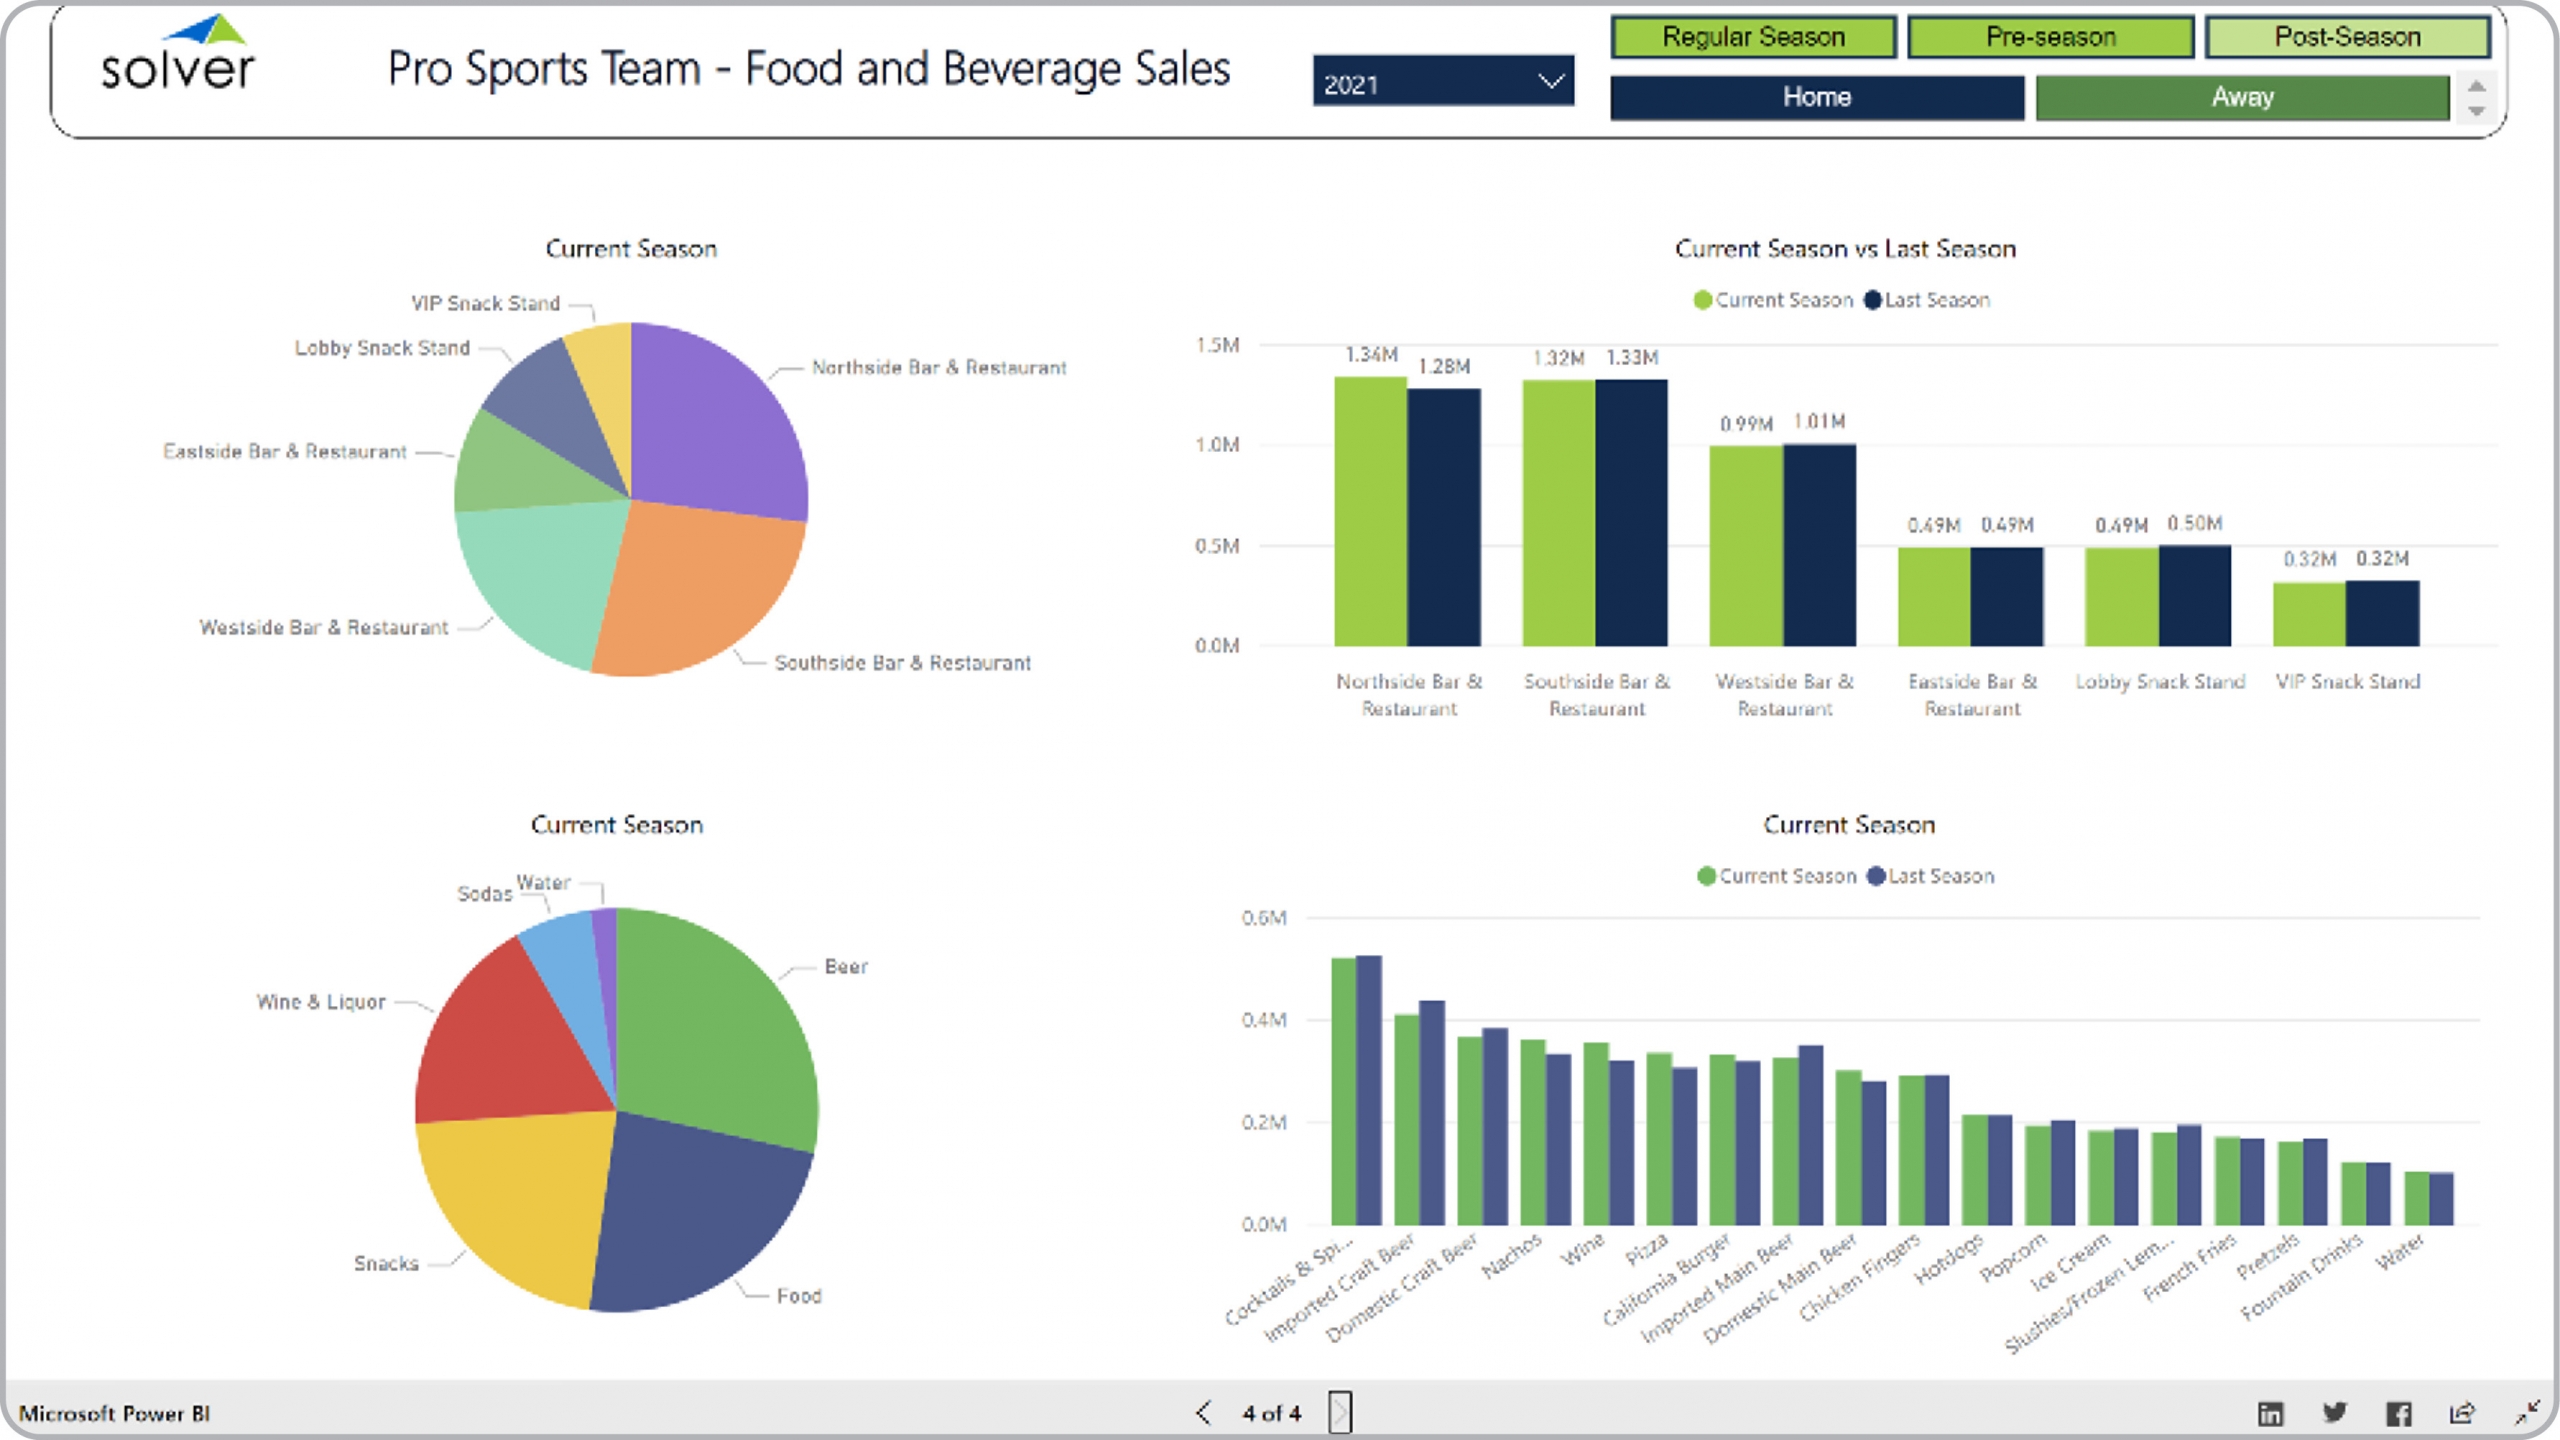
Sports – Food and Beverage Sales
Power BI dashboard showing F&B sales for current vs last season, by F&B category and by location.
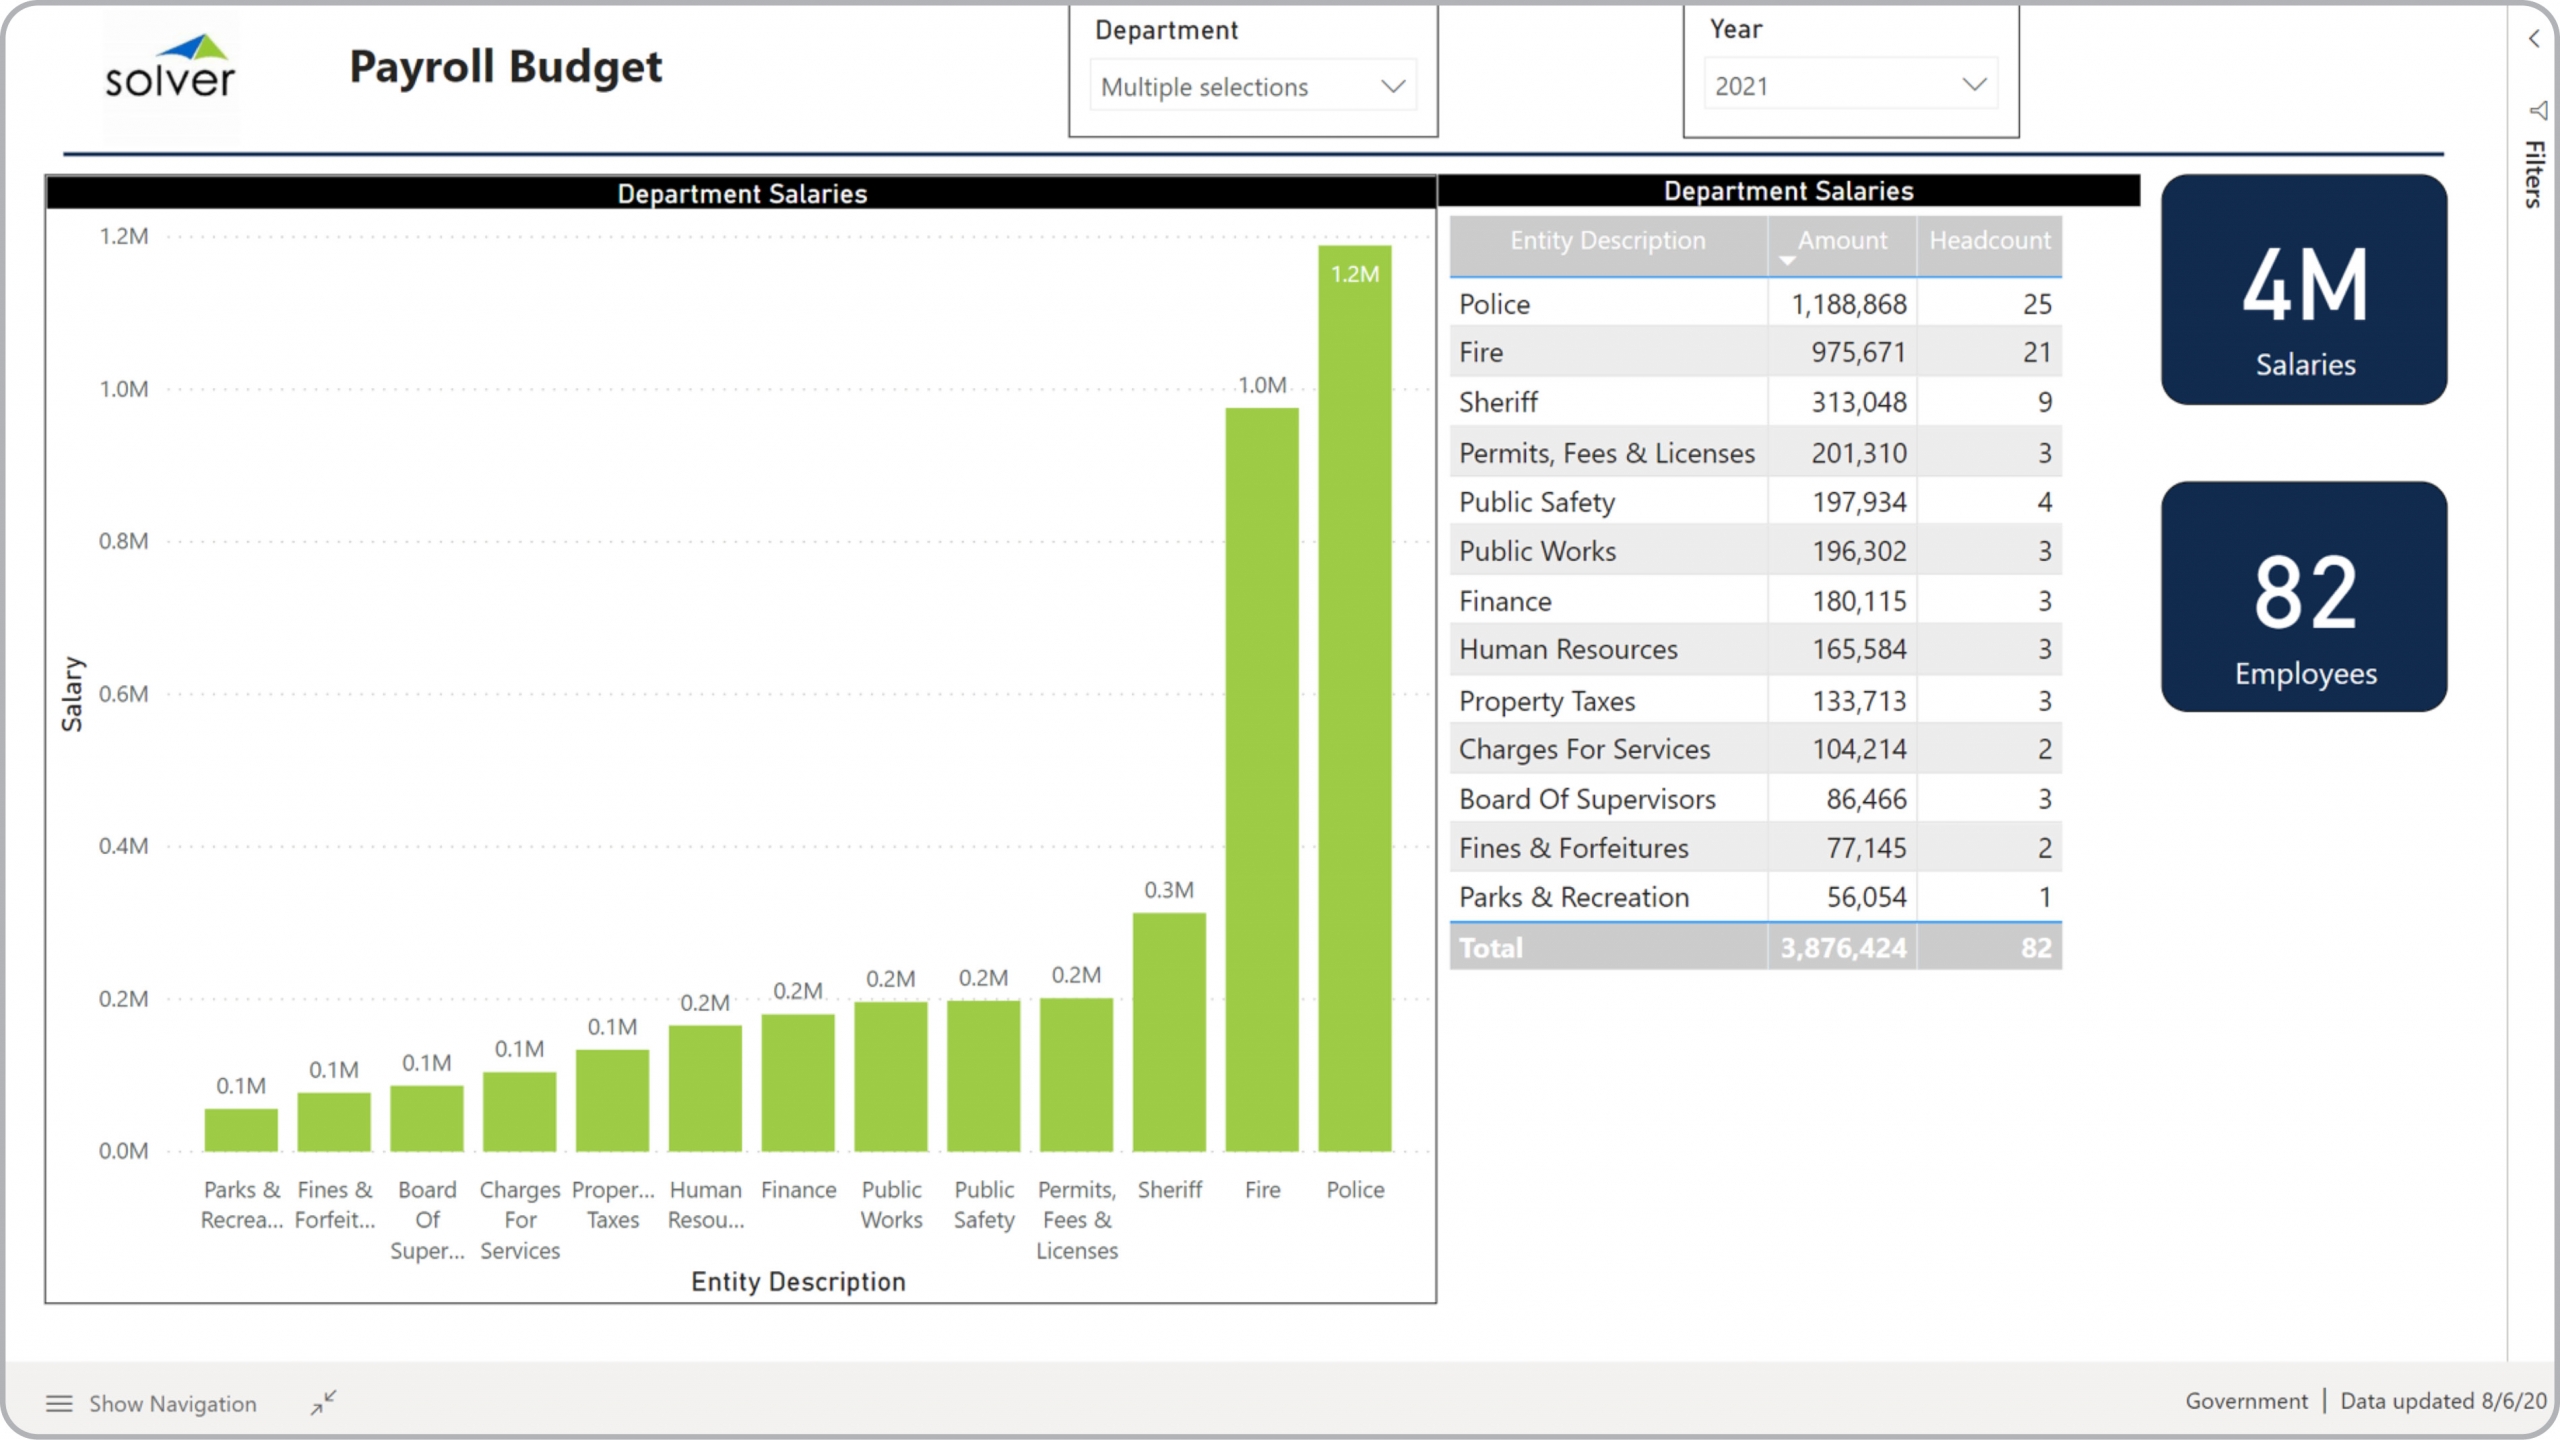
Government – Payroll Budget Analysis
Power BI dashboard showing budget per department and number of employees.
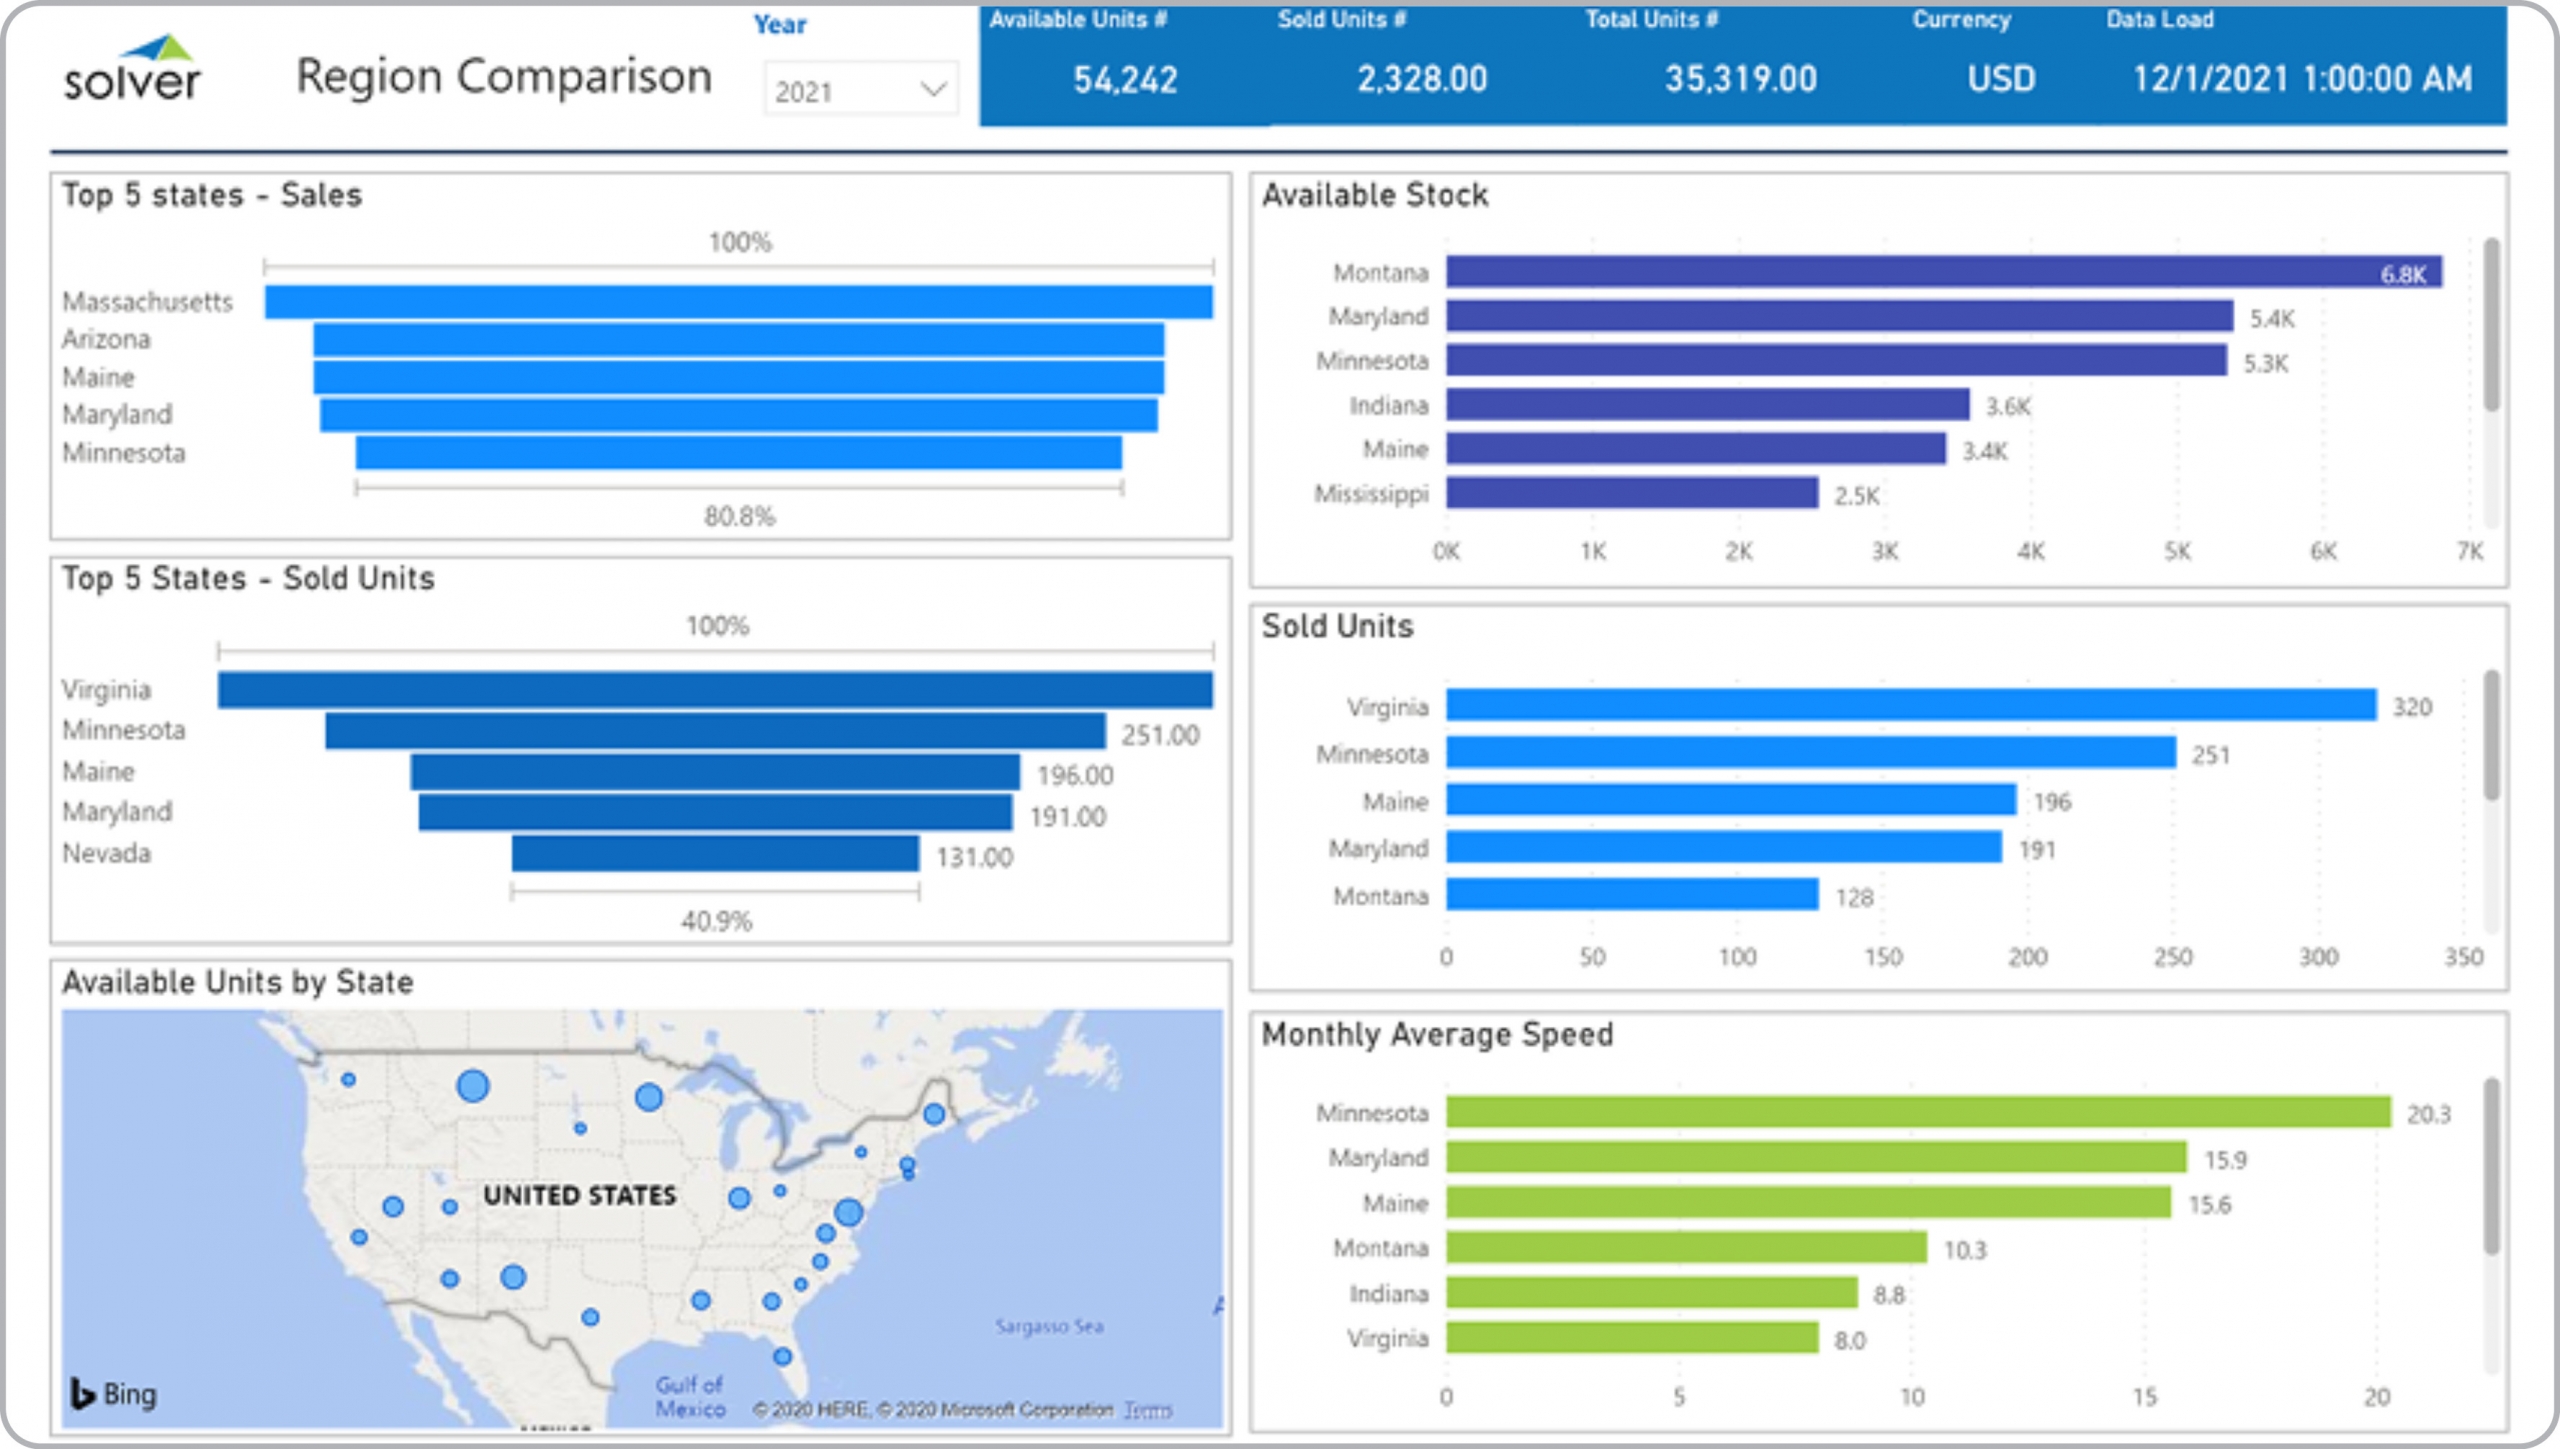
Real Estate – Regional Comparison
Power BI dashboard for comparison of sales by region in units sold and by speed of sales
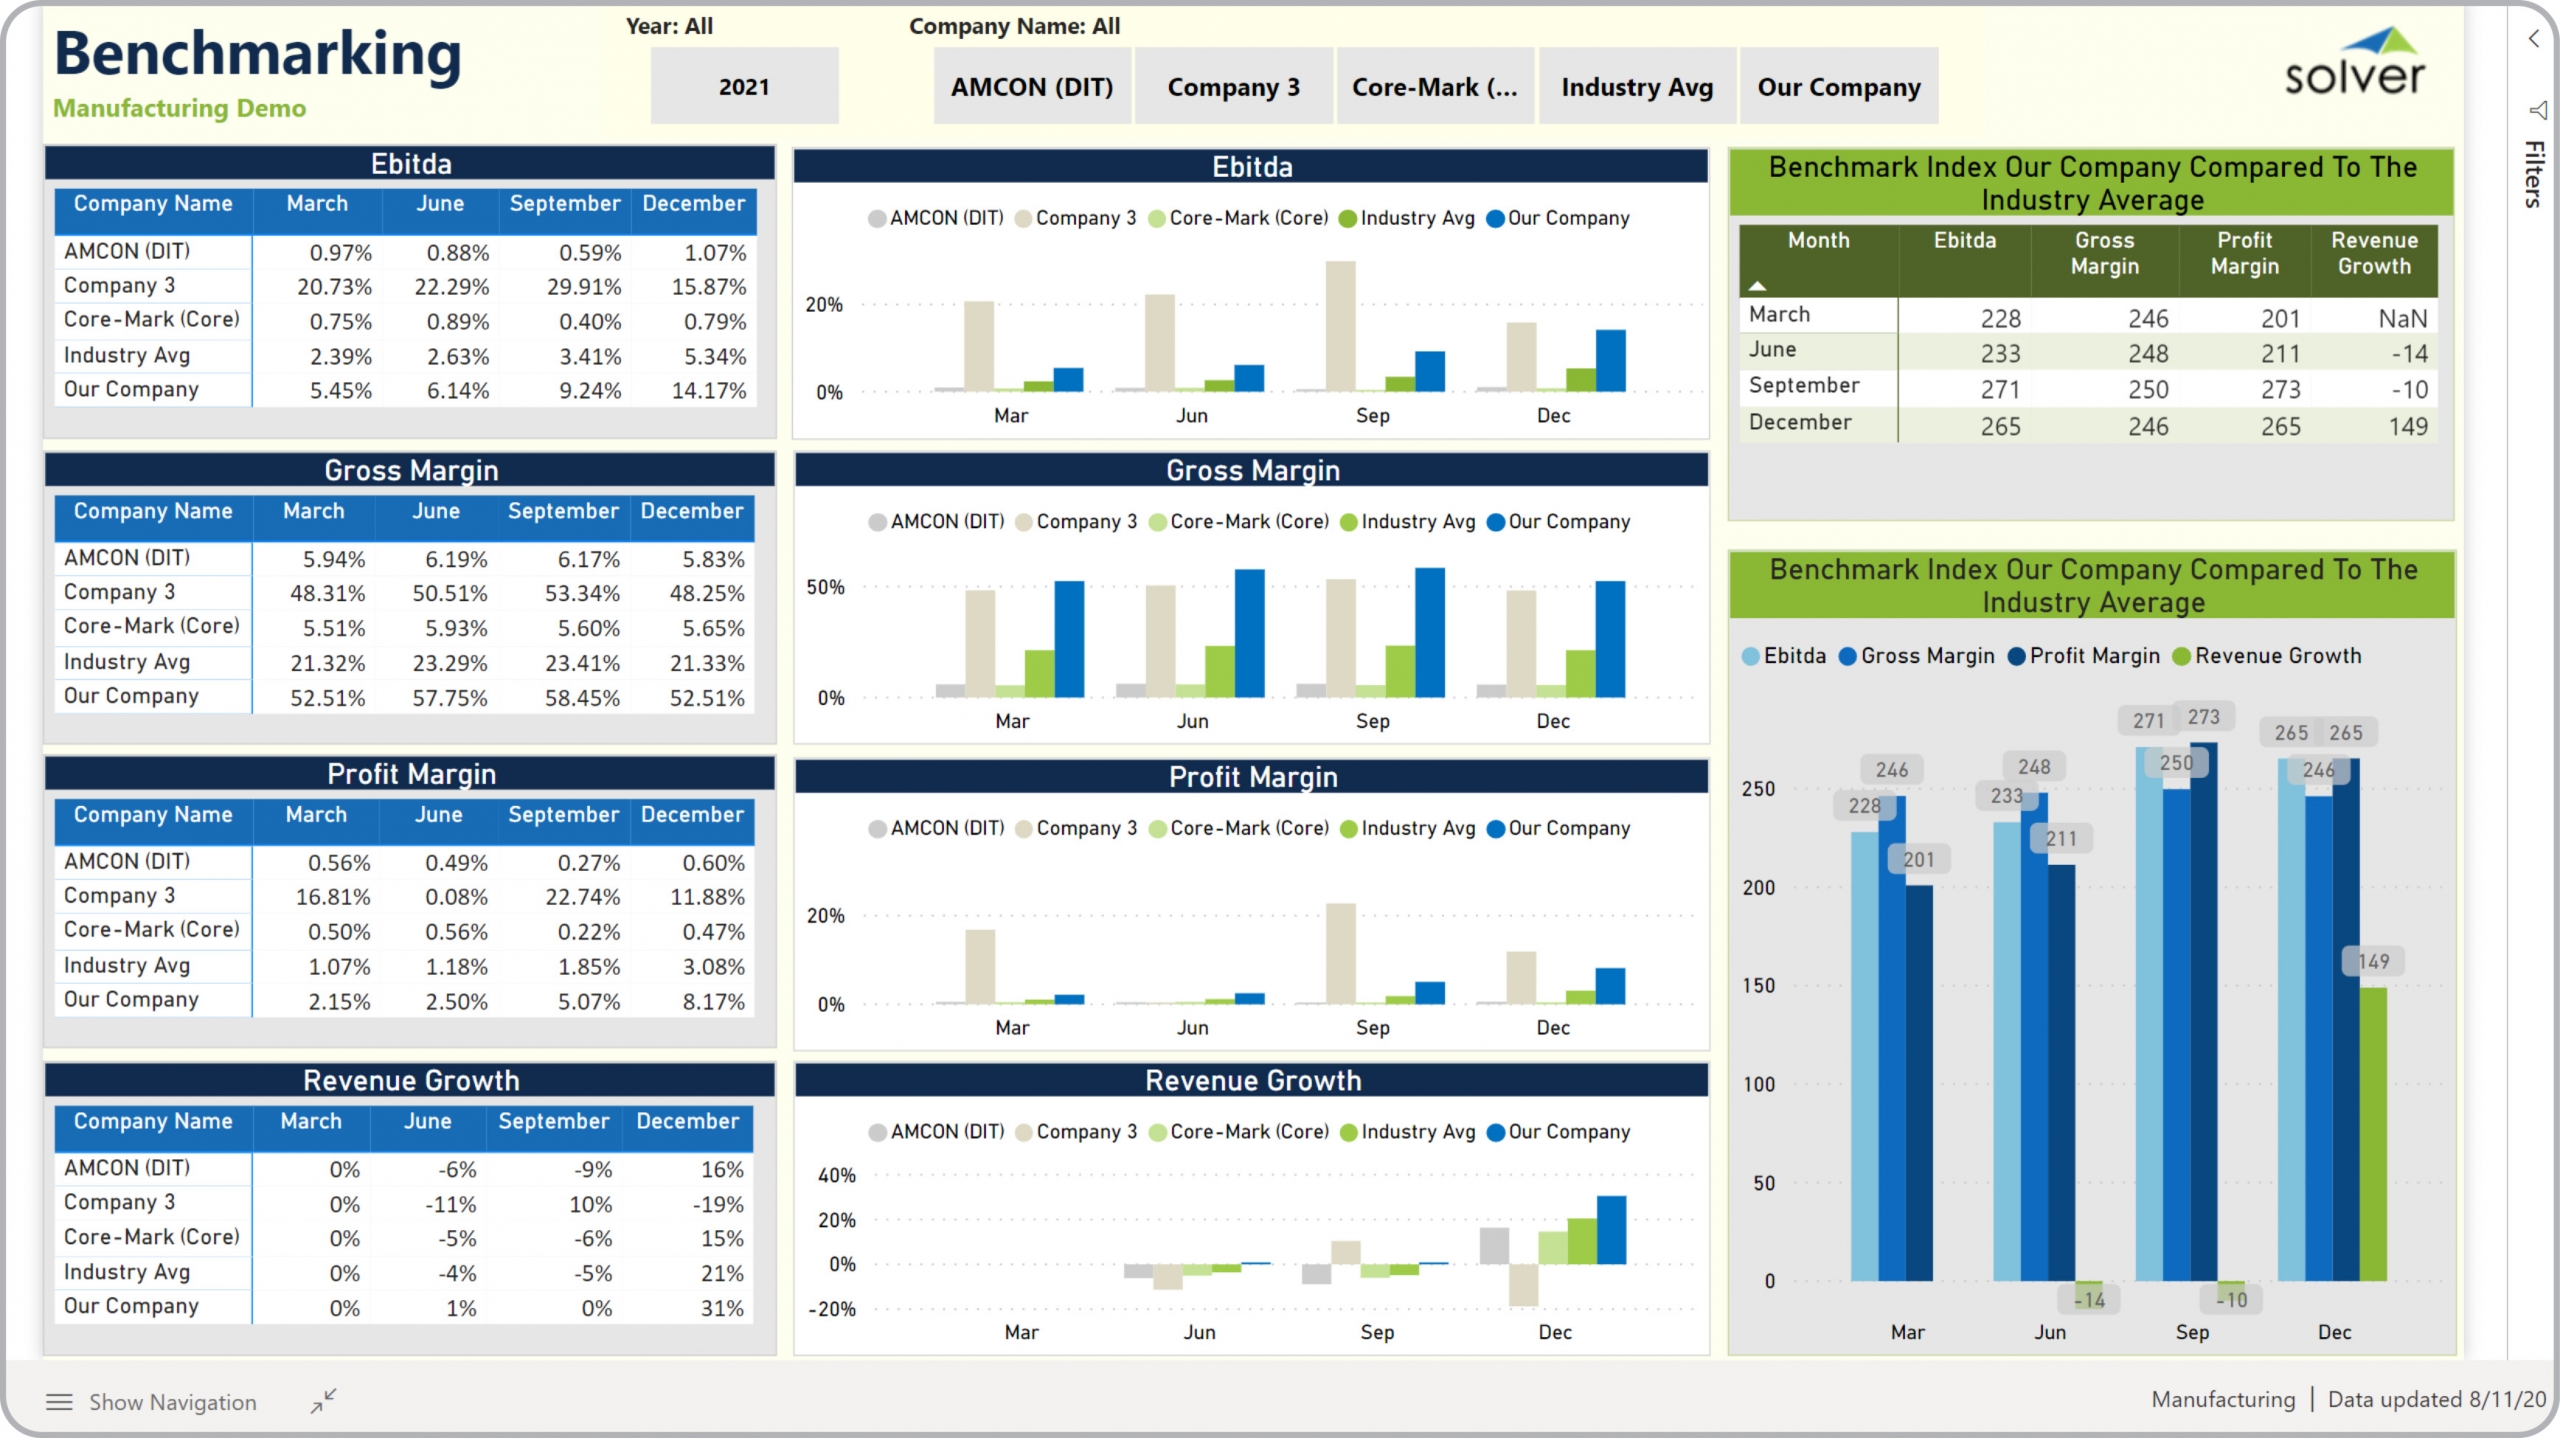
Mfg – Benchmarking
Power BI dashboard that compares own manufacturing company KPIs to others and to an industry average.
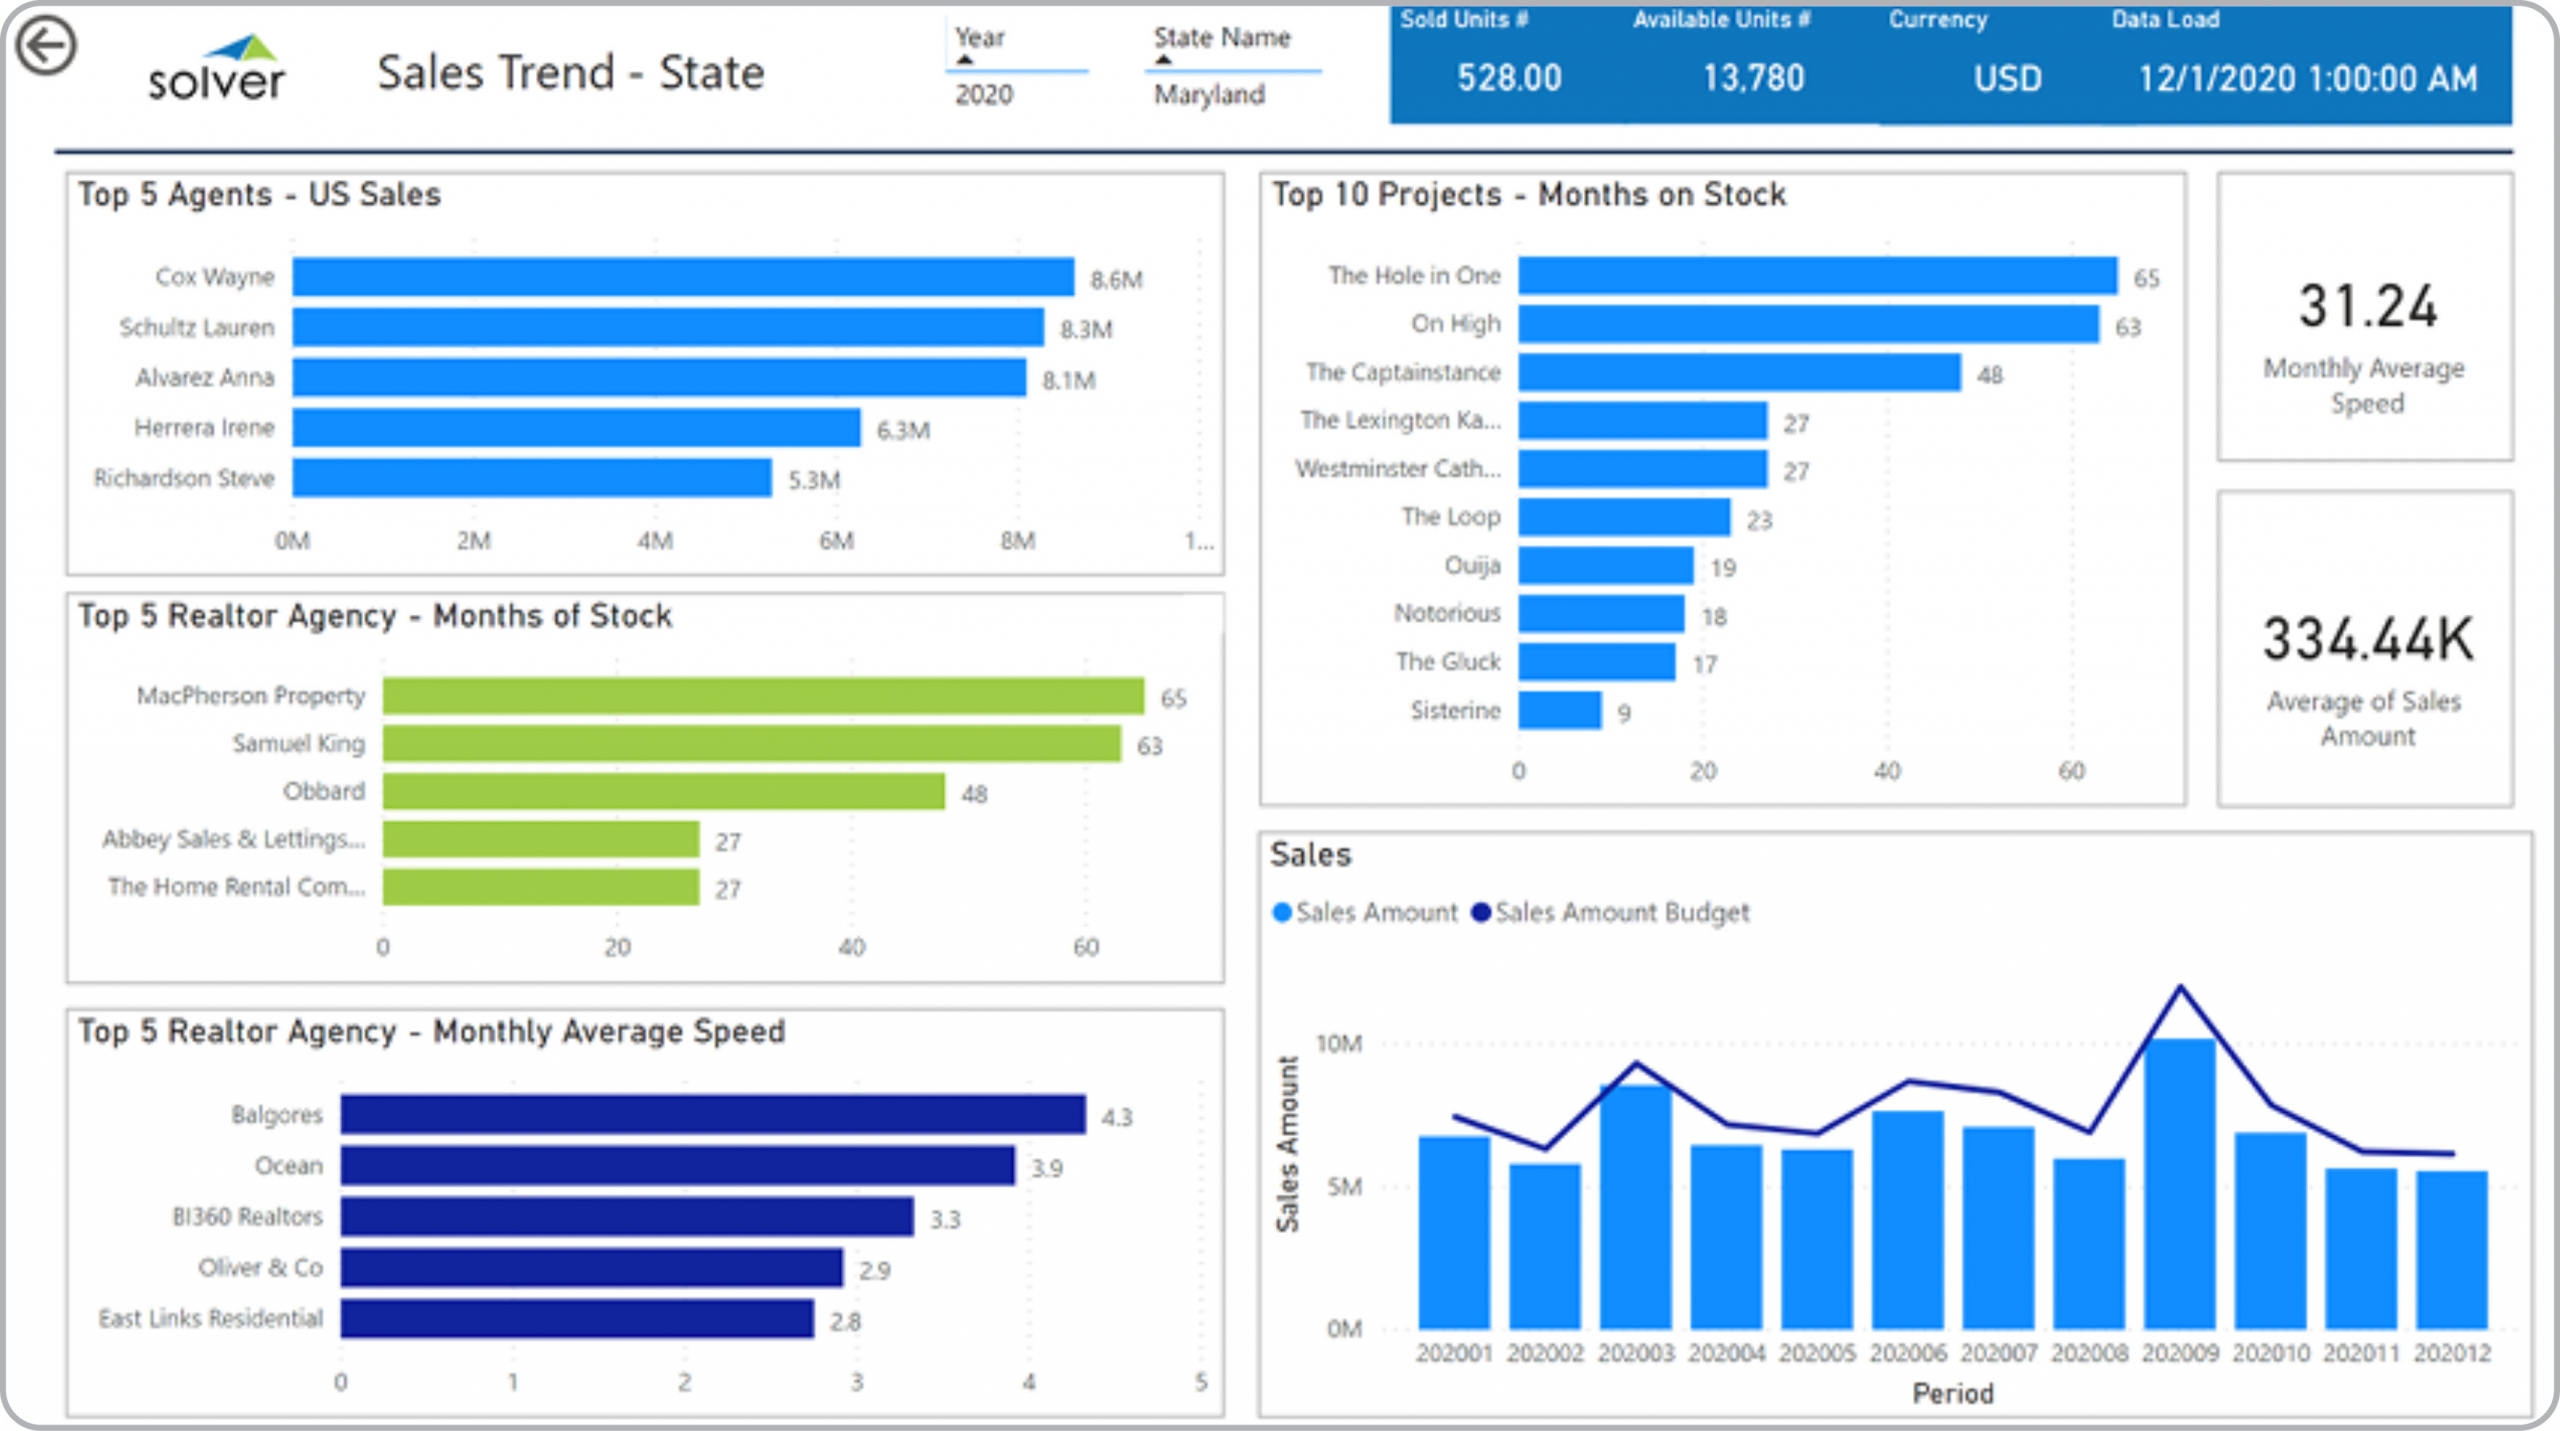
Real Estate – Sales by State
Power BI dashboard showing top agents and agencies as well as top projects. Actual vs budgeted sales.
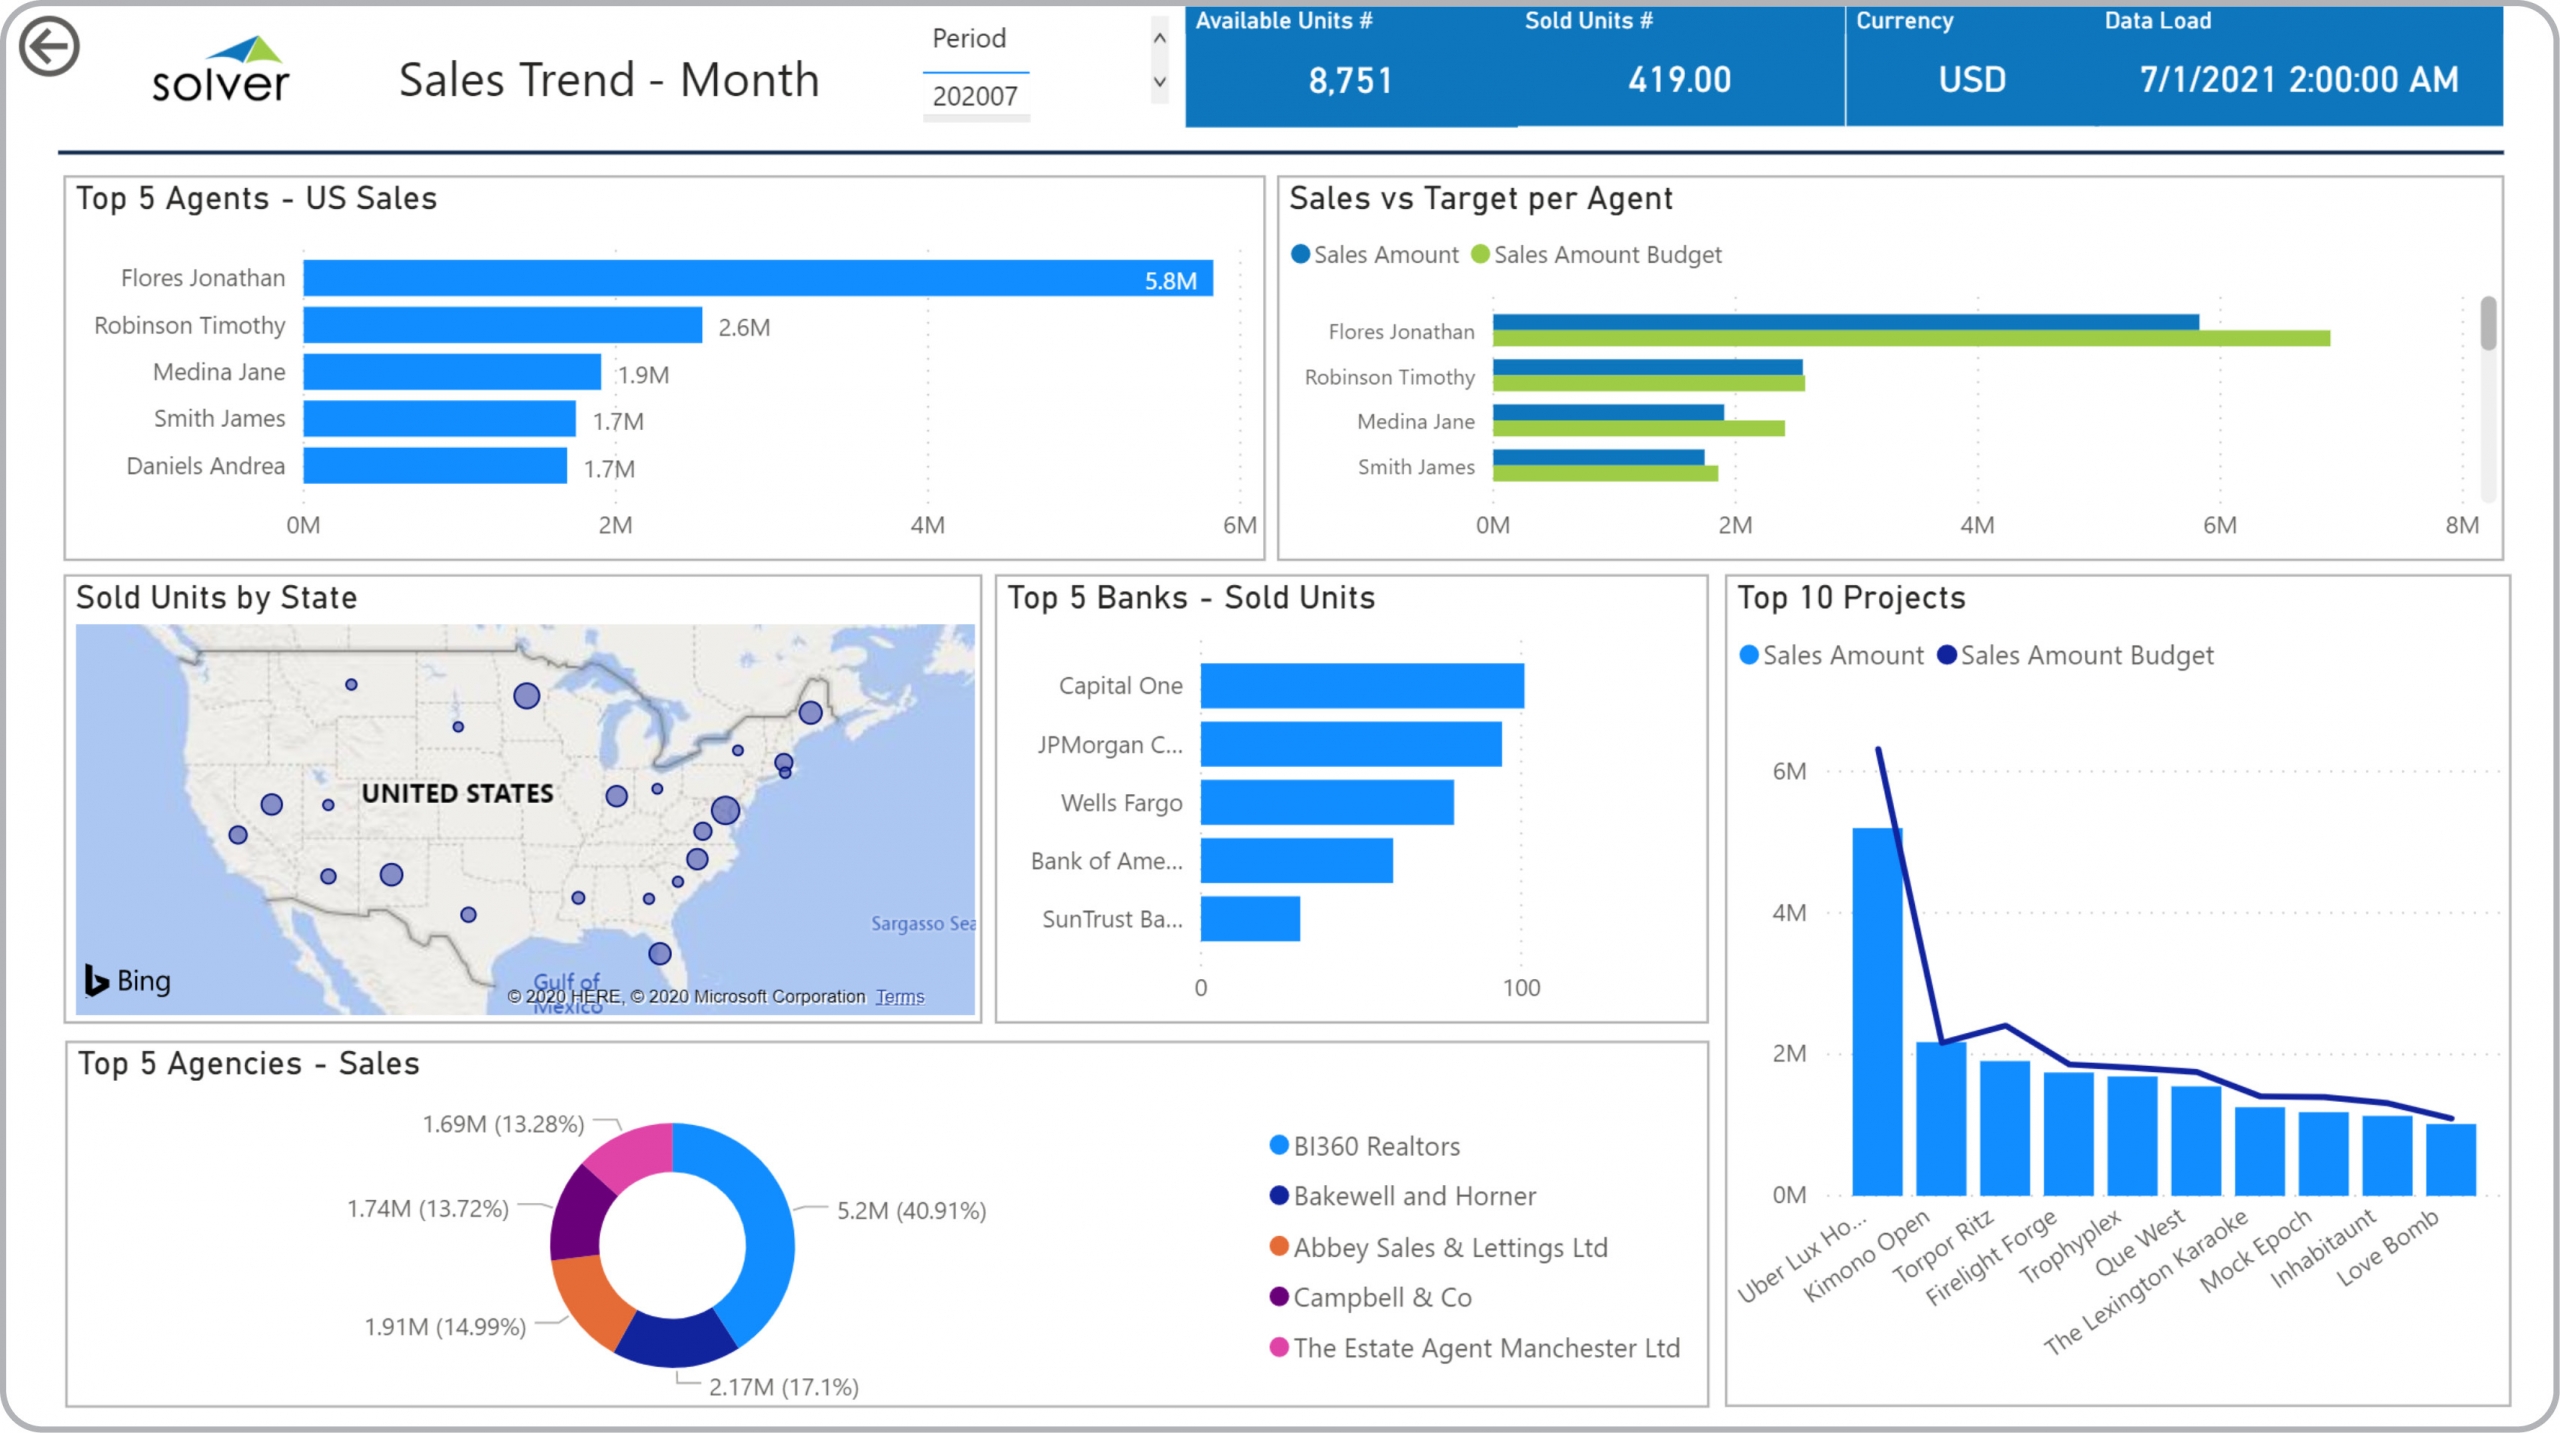
Real Estate – Monthly Sales
Power BI dashboard for monthly sales by agent, state, bank, project and agency.
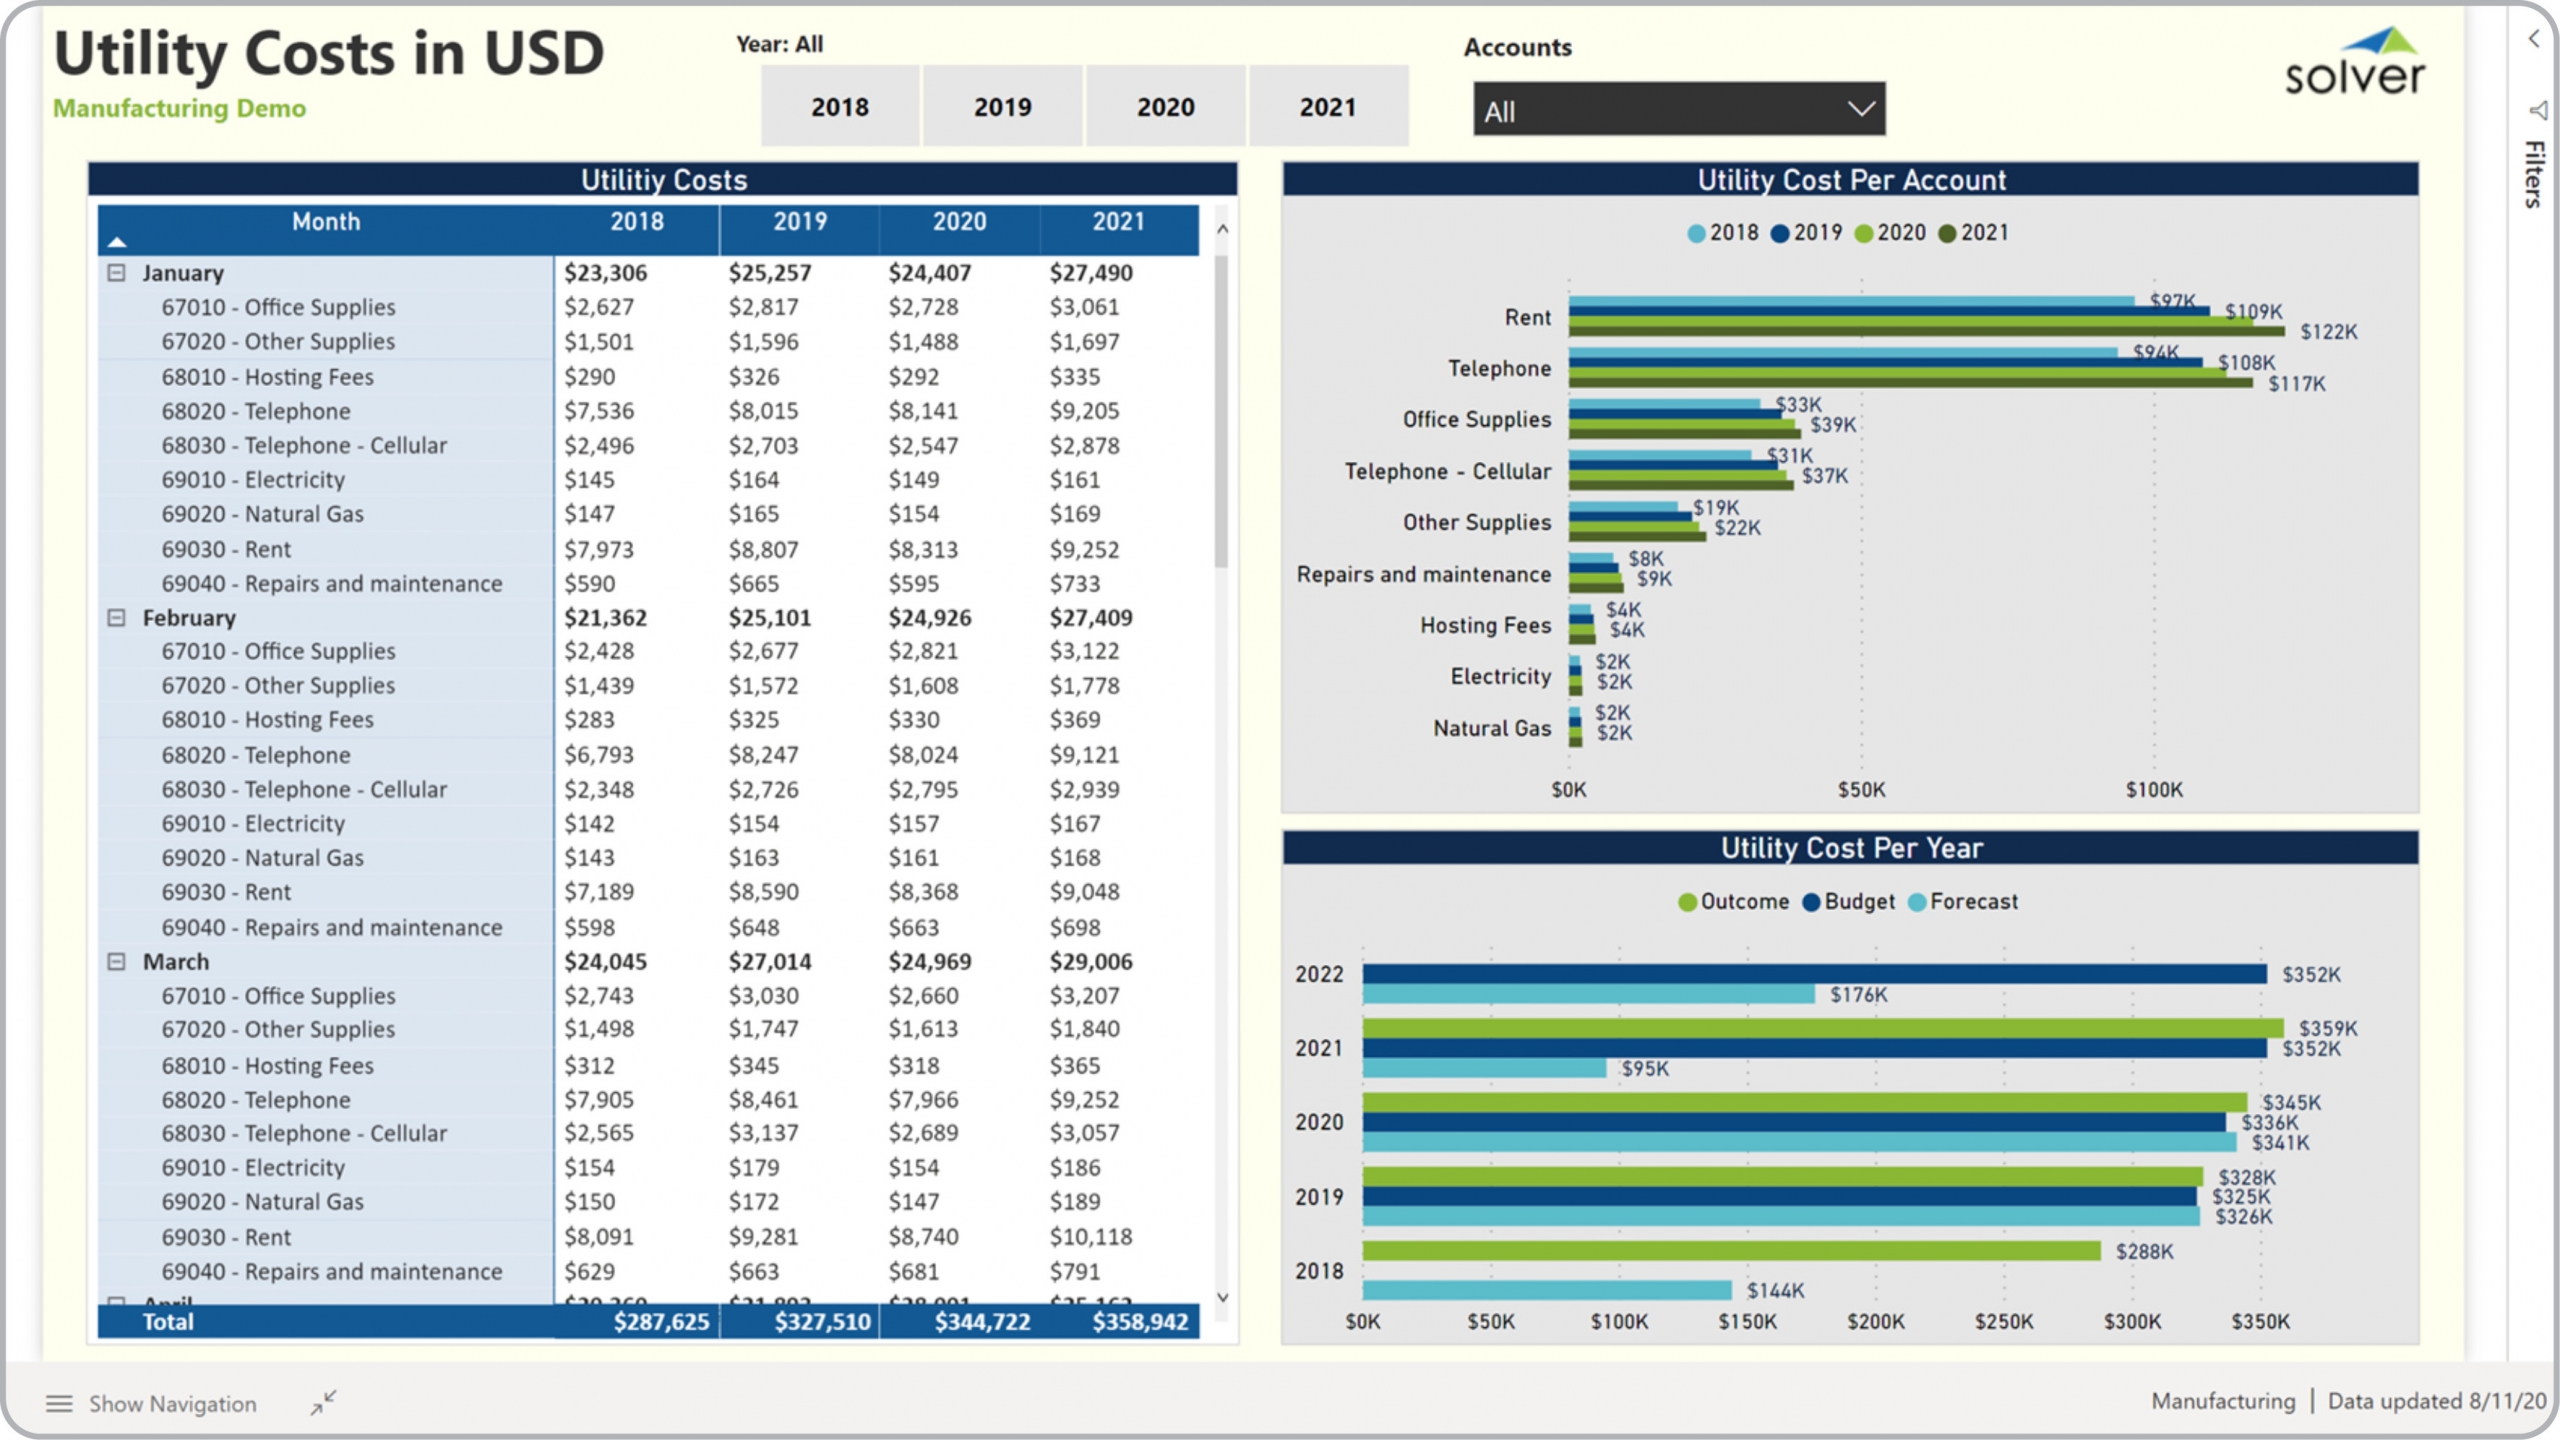
Mfg – Utility Cost Analysis
Power BI dashboard showing utility cost with annual and monthly comparisons and by GL account.
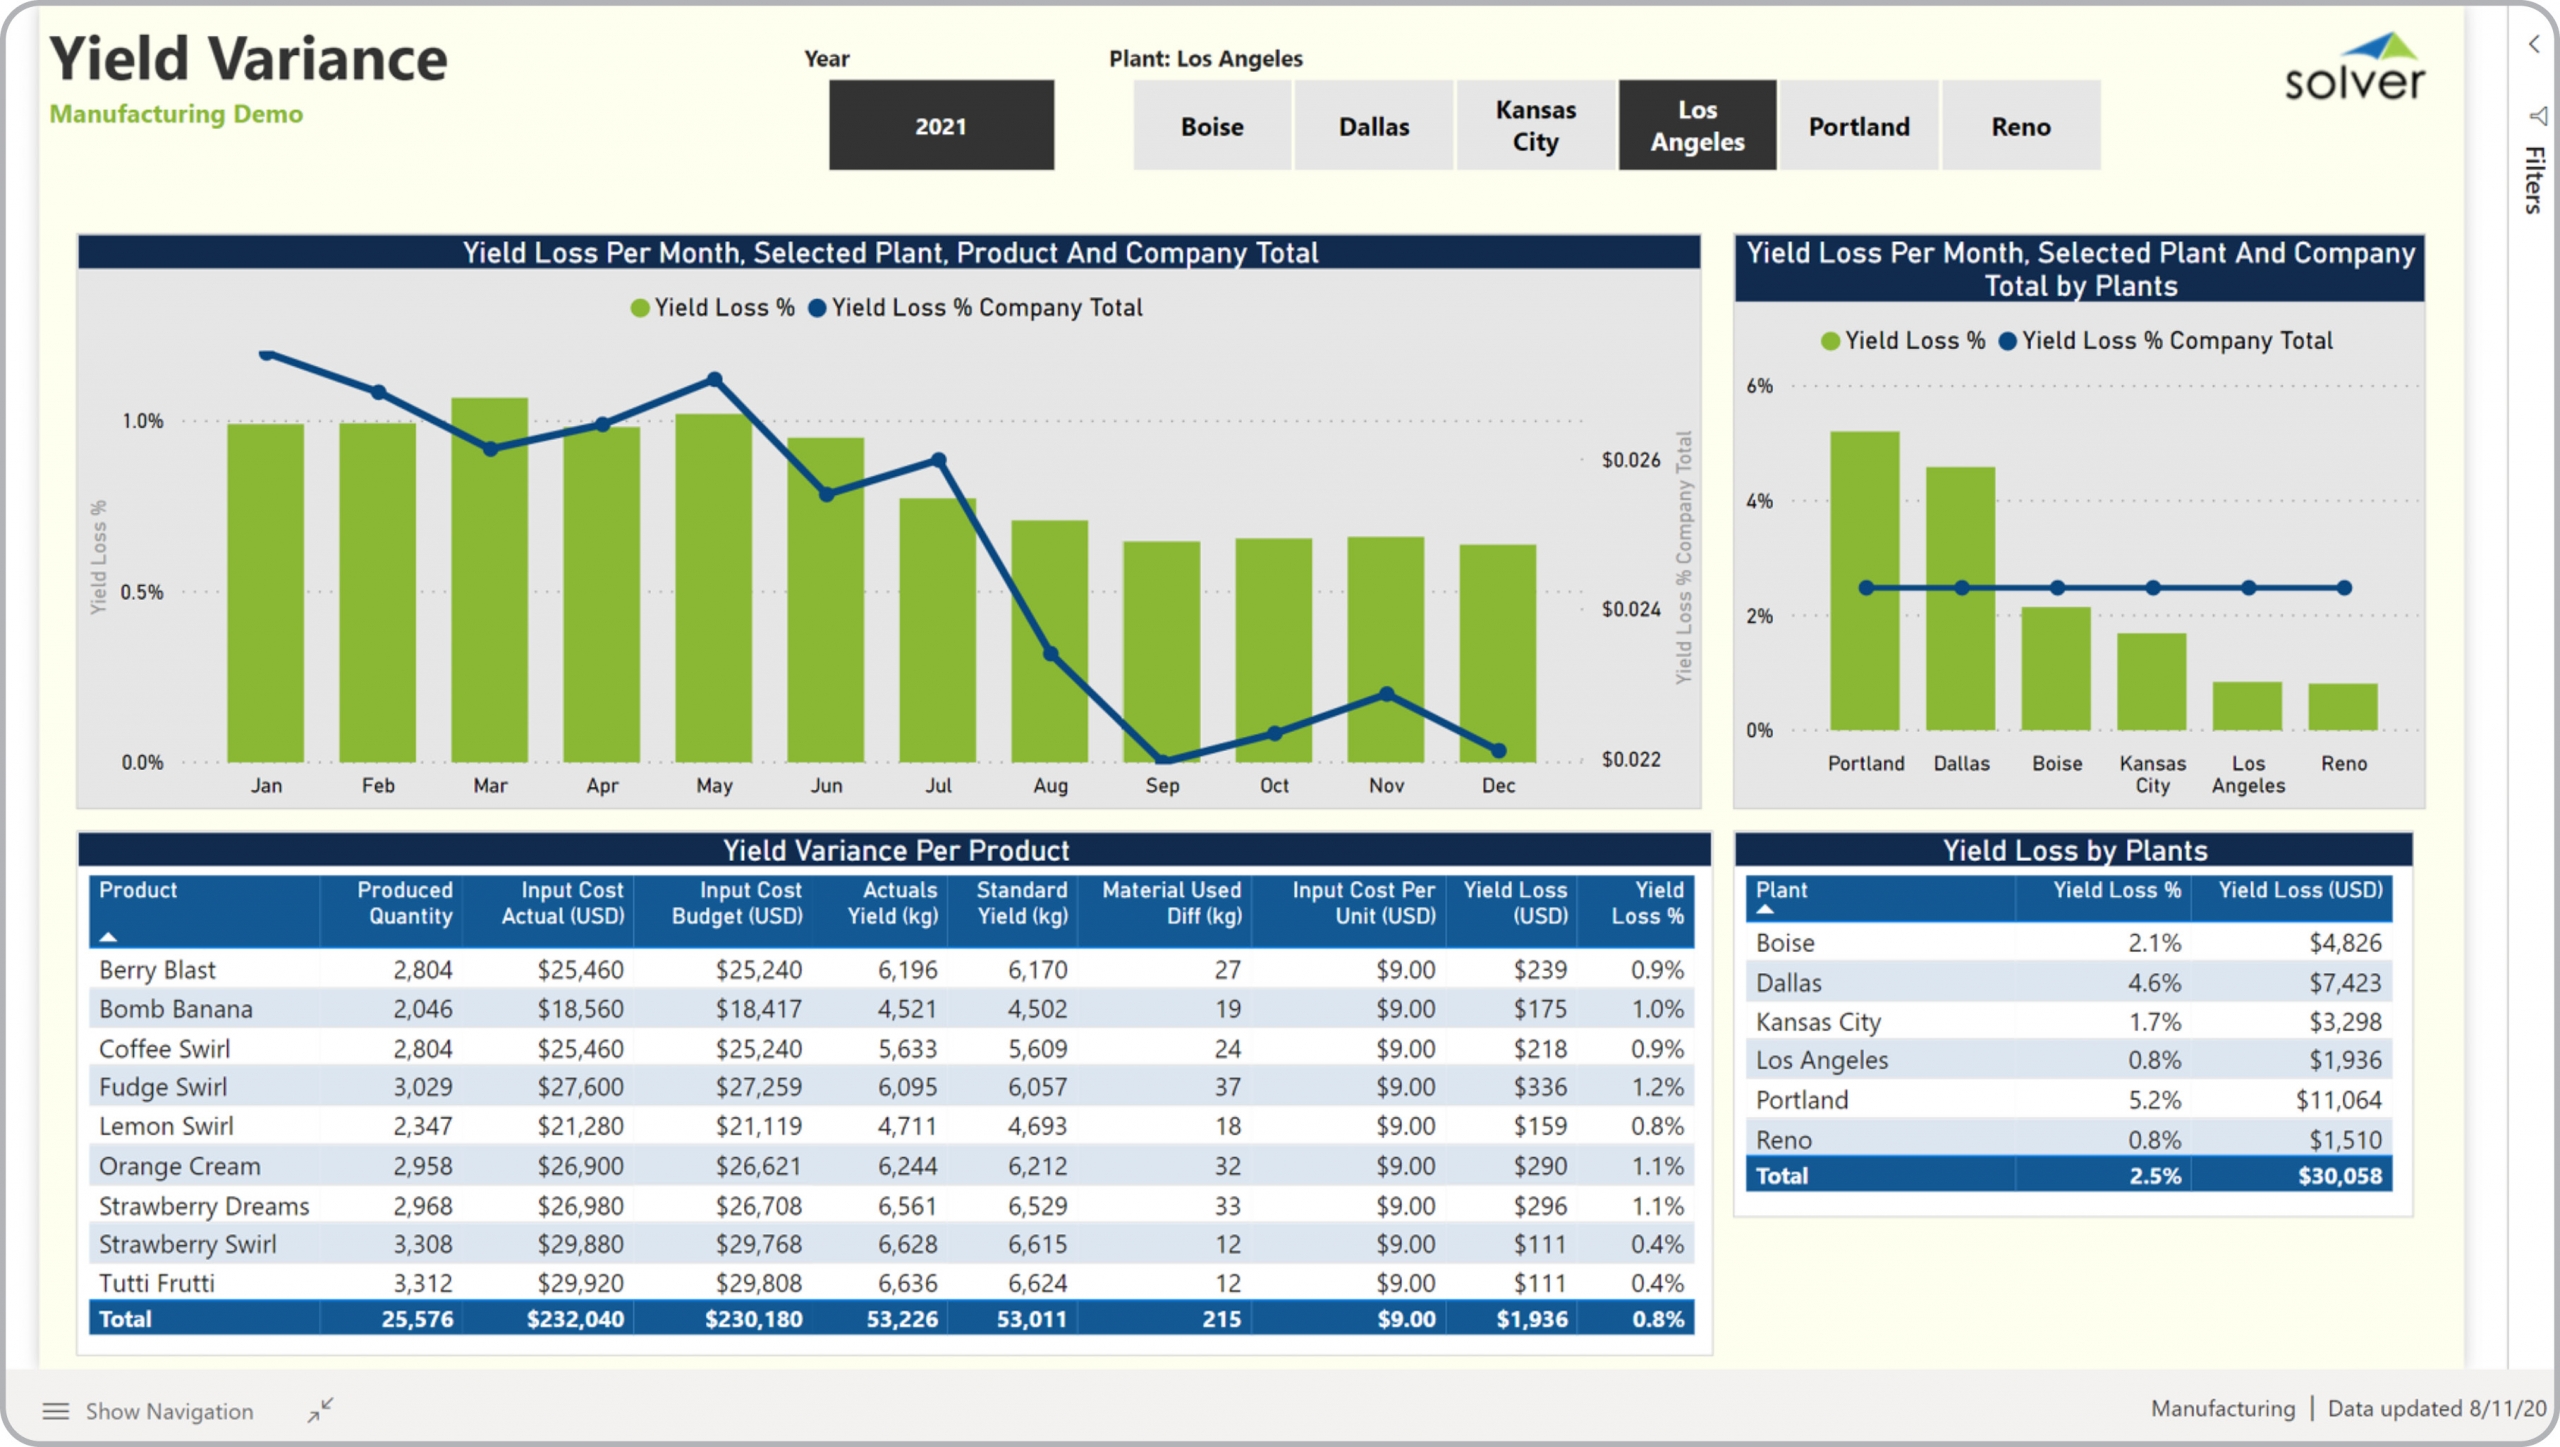
Mfg – Yield Analysis
Power BI dashboard for yield variance and yield loss per month, product and manufacturing plant.
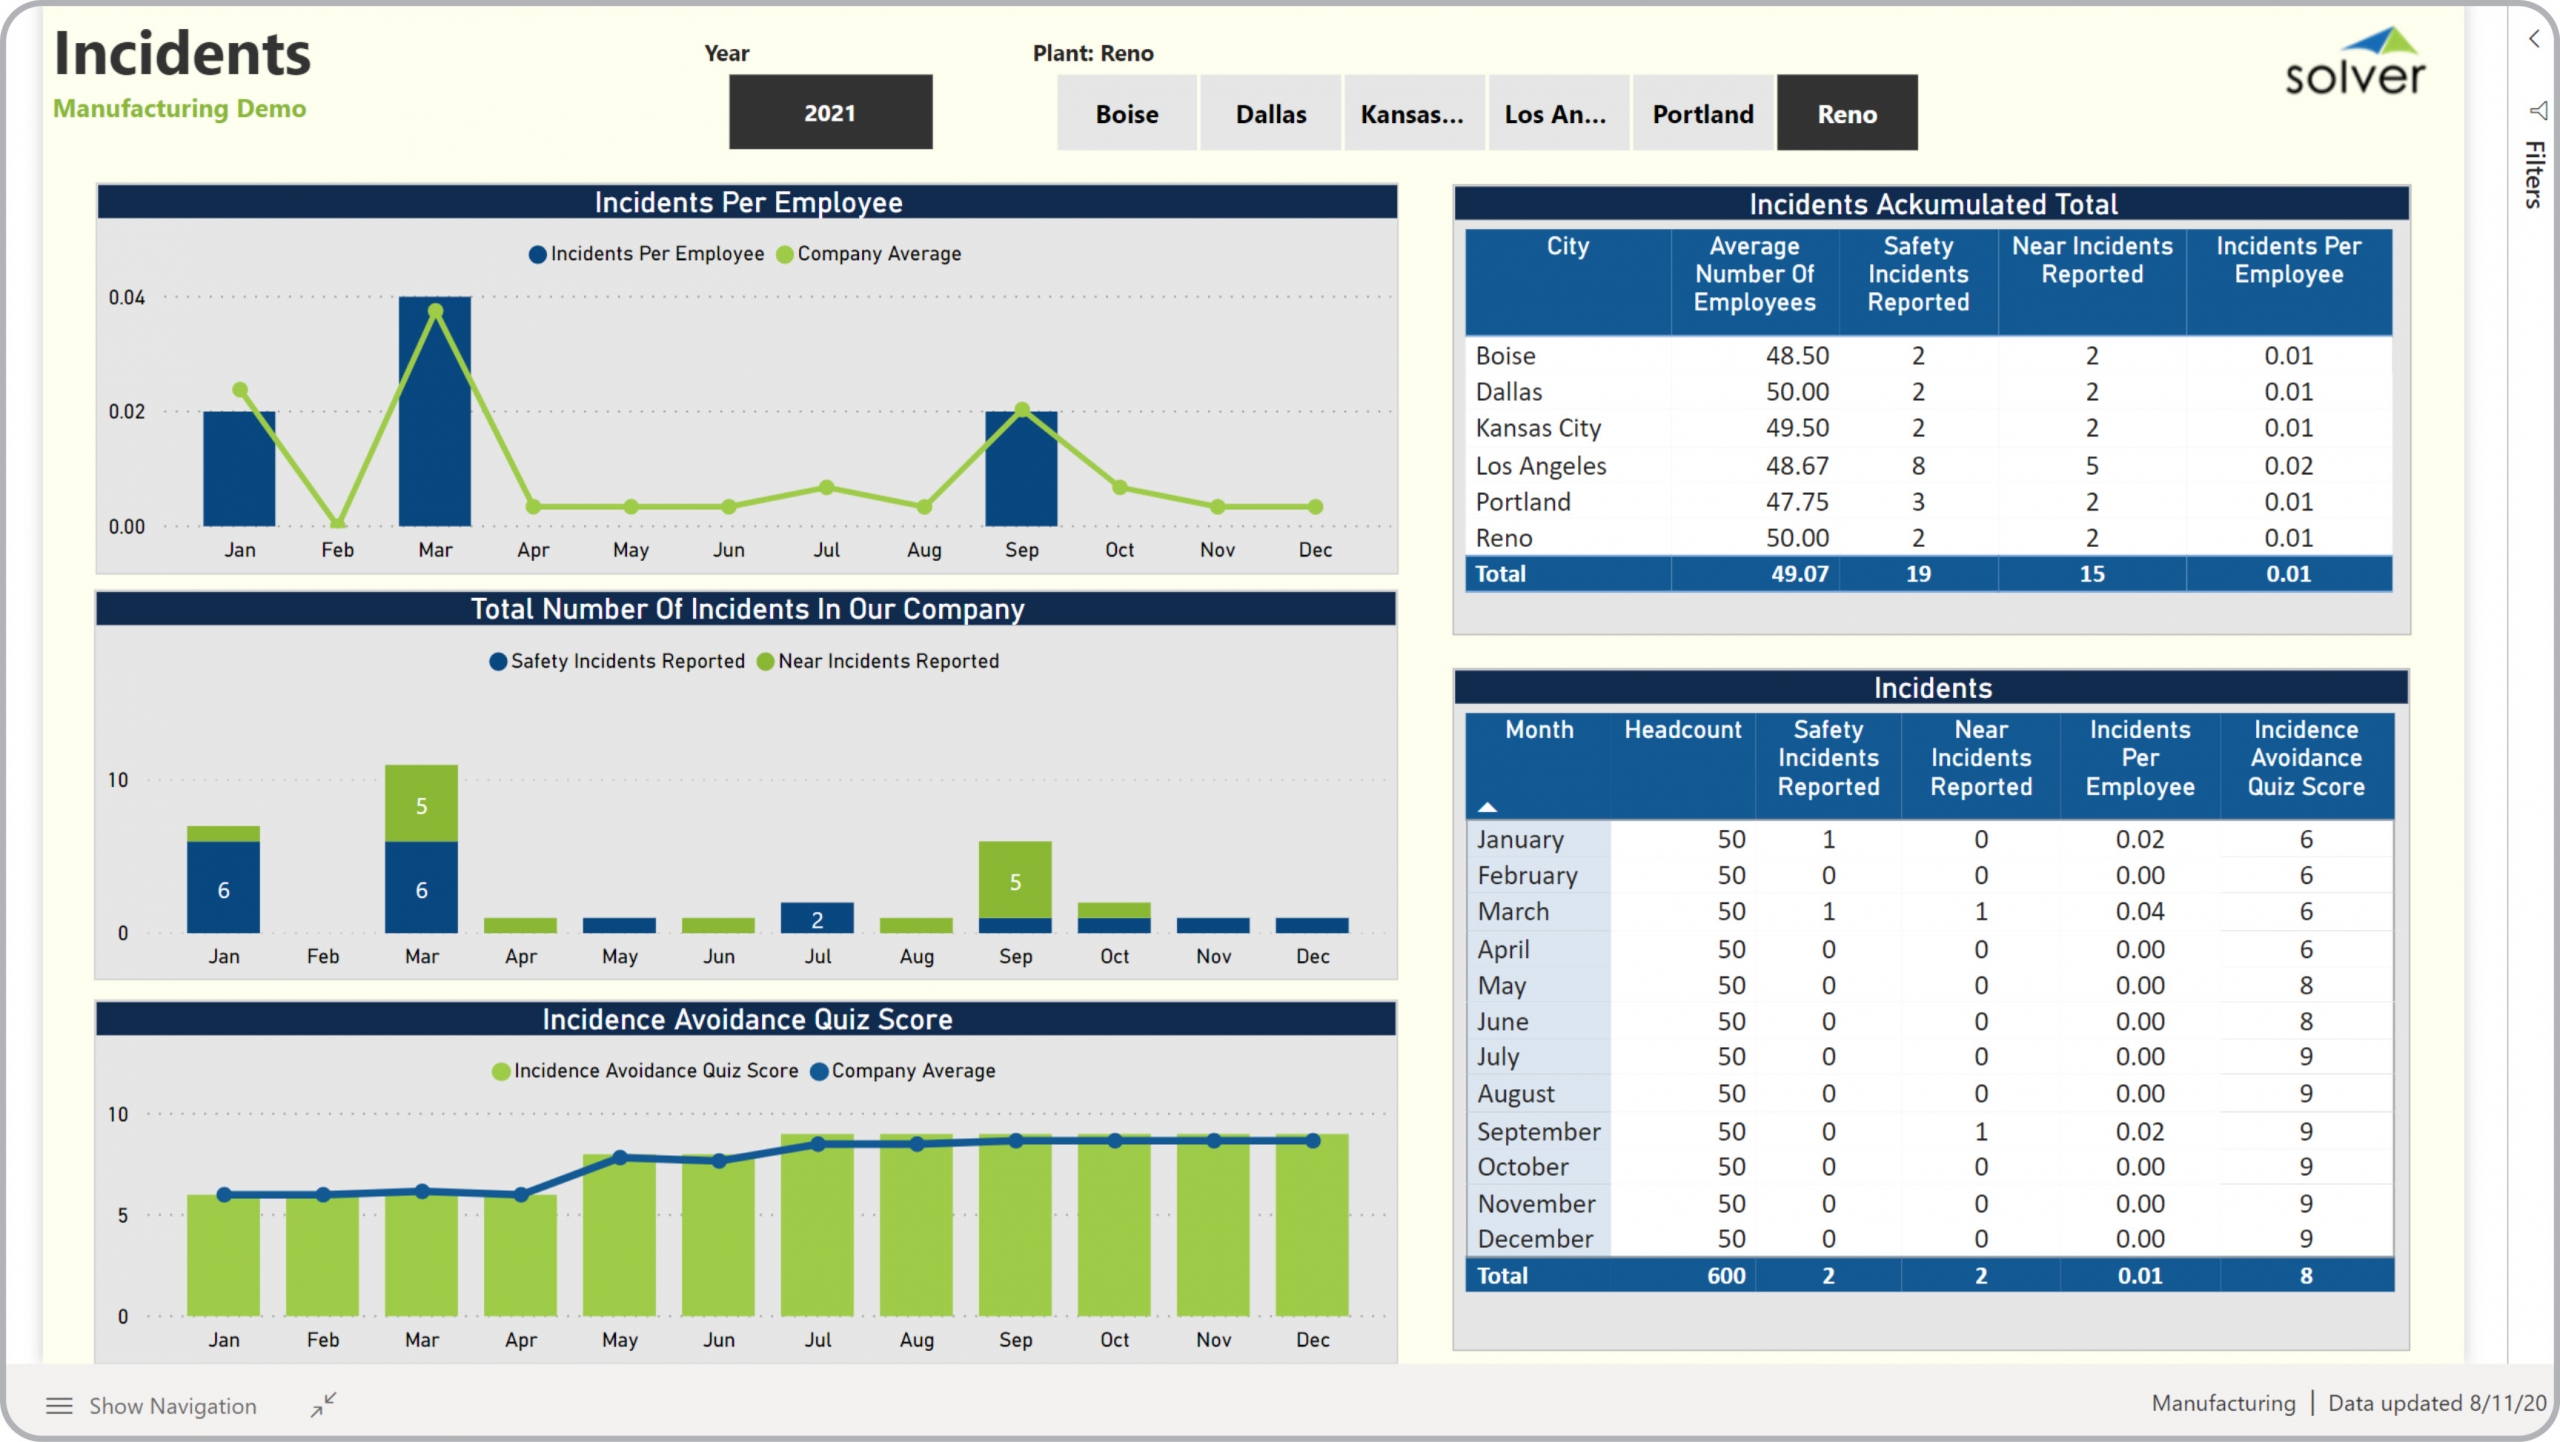
Mfg – Incident Analysis
Power BI dashboard showing incidents and near incidents per employee and per manufacturing plant.
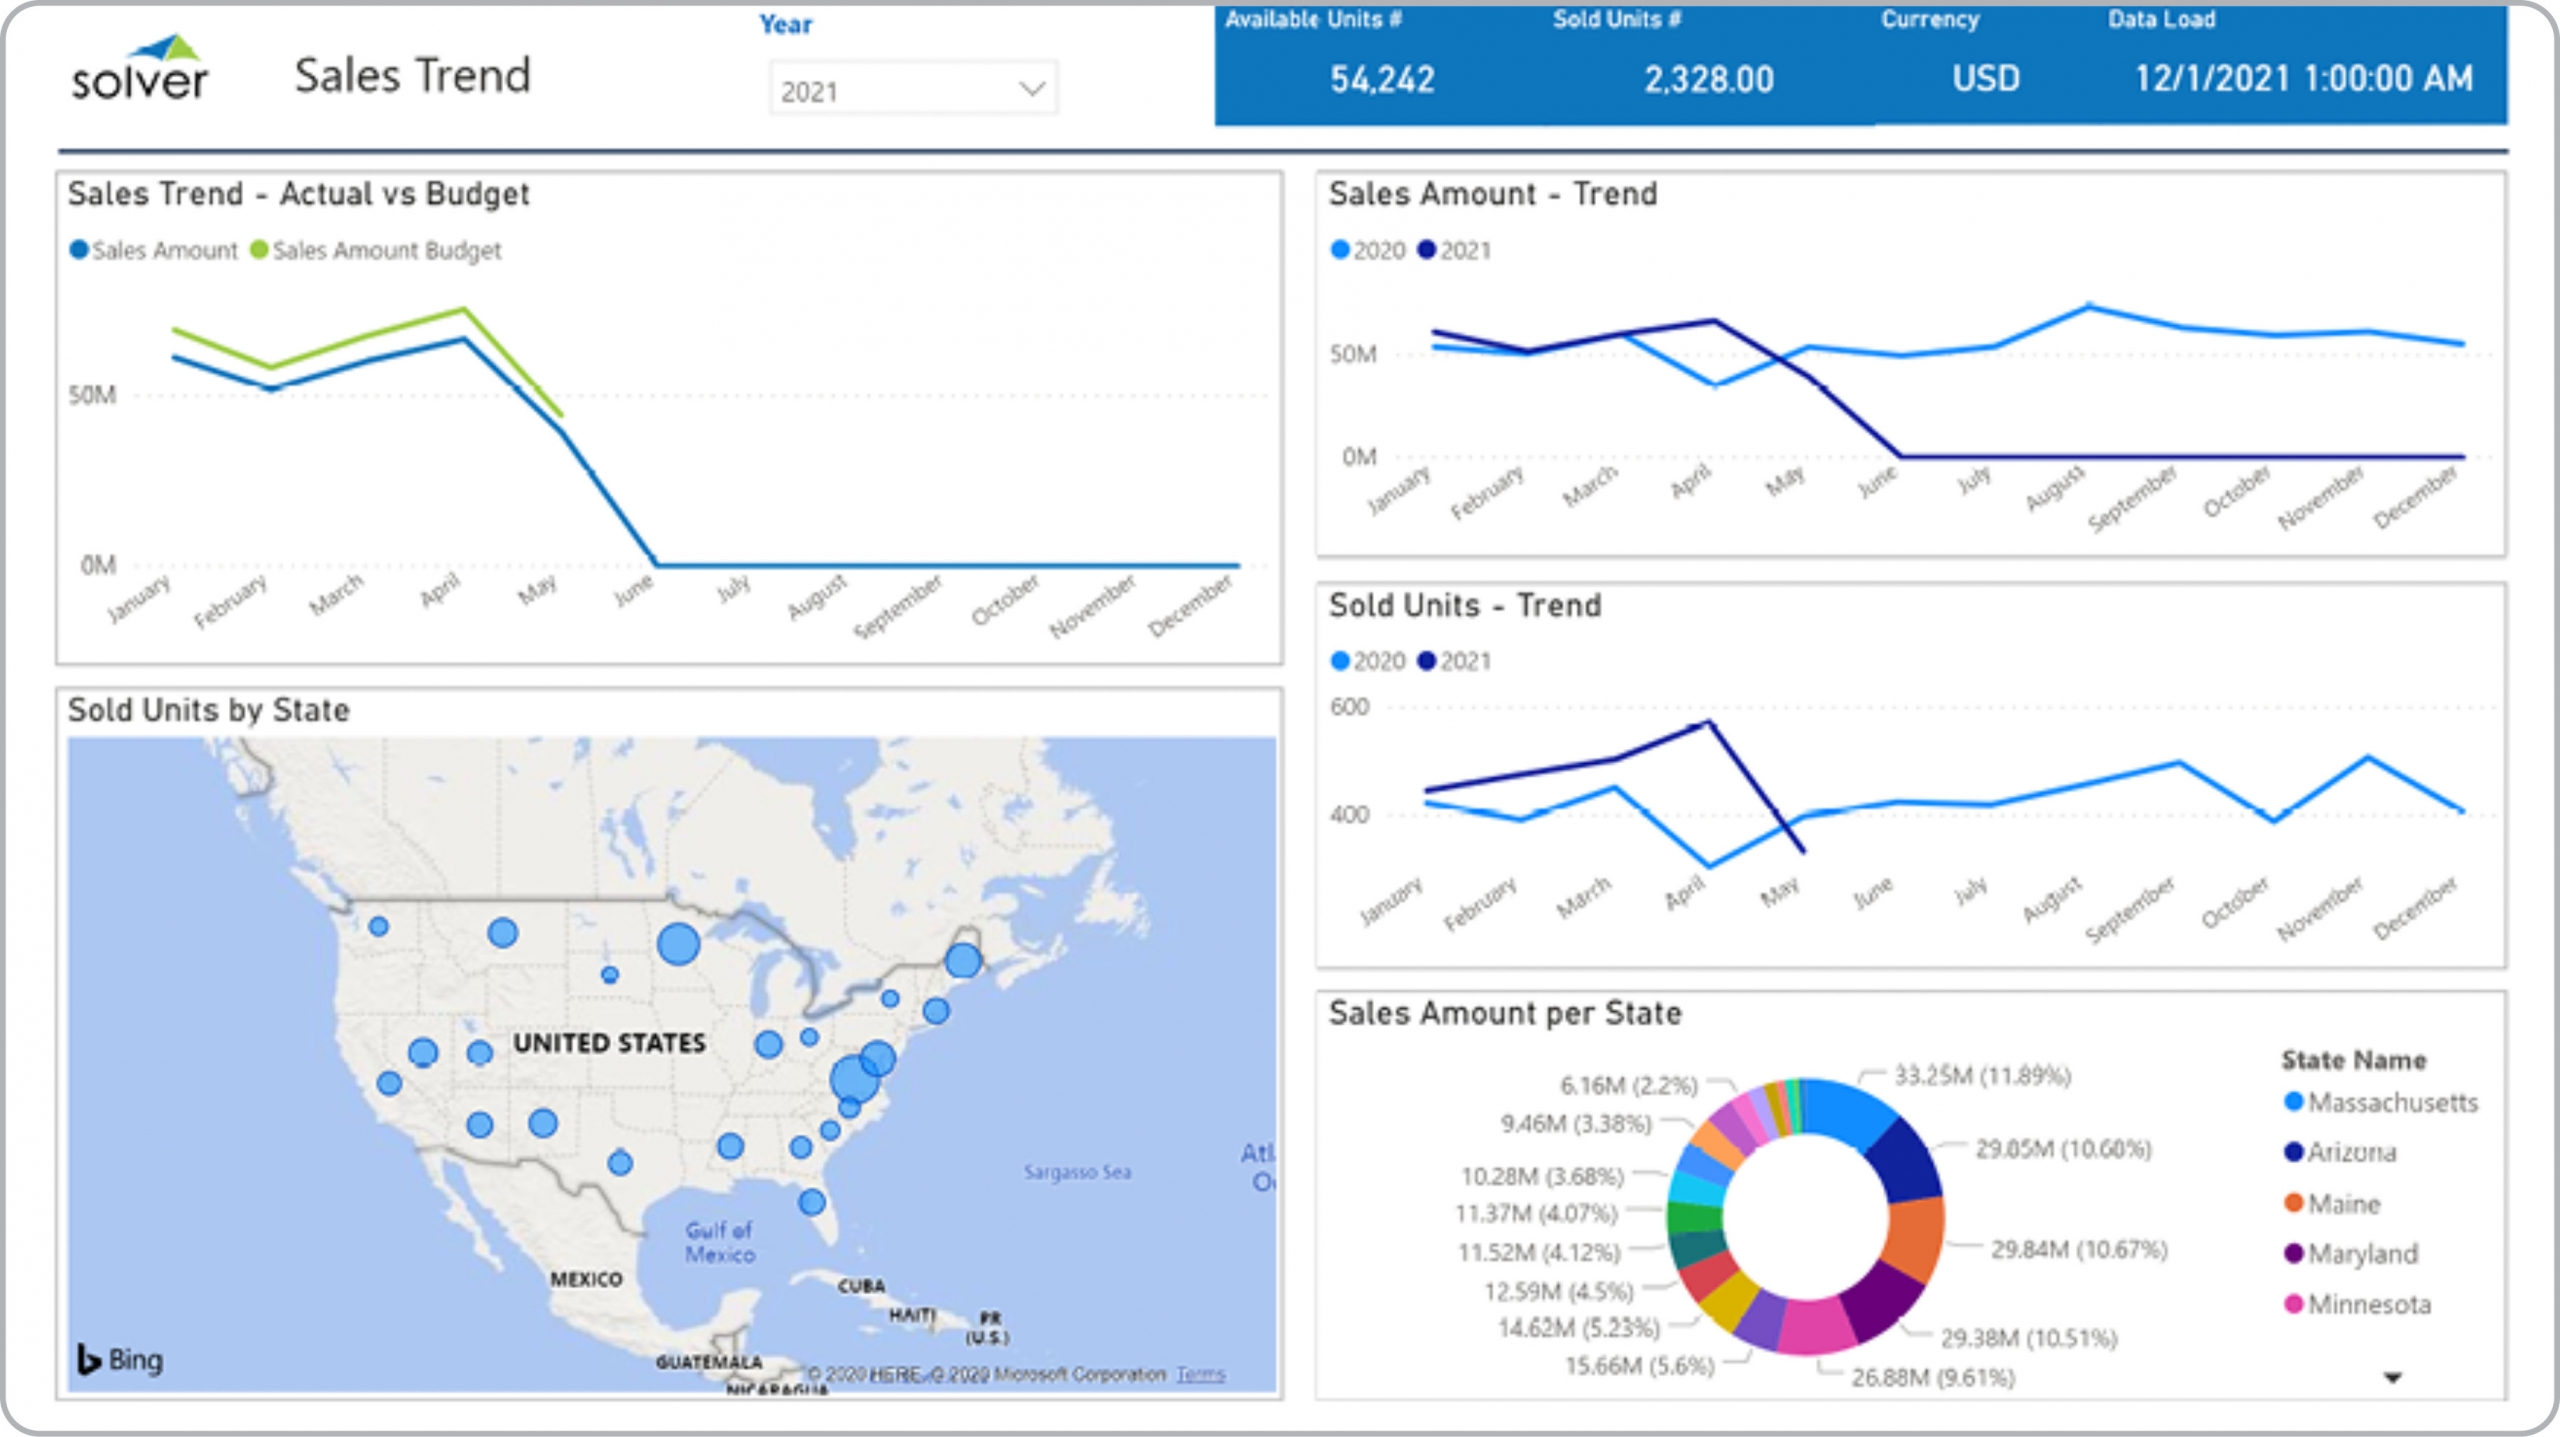
Real Estate – Sales Trend
Power BI dashboard for analysis of real estate sales trends as well as sales by geography and compared to budget.
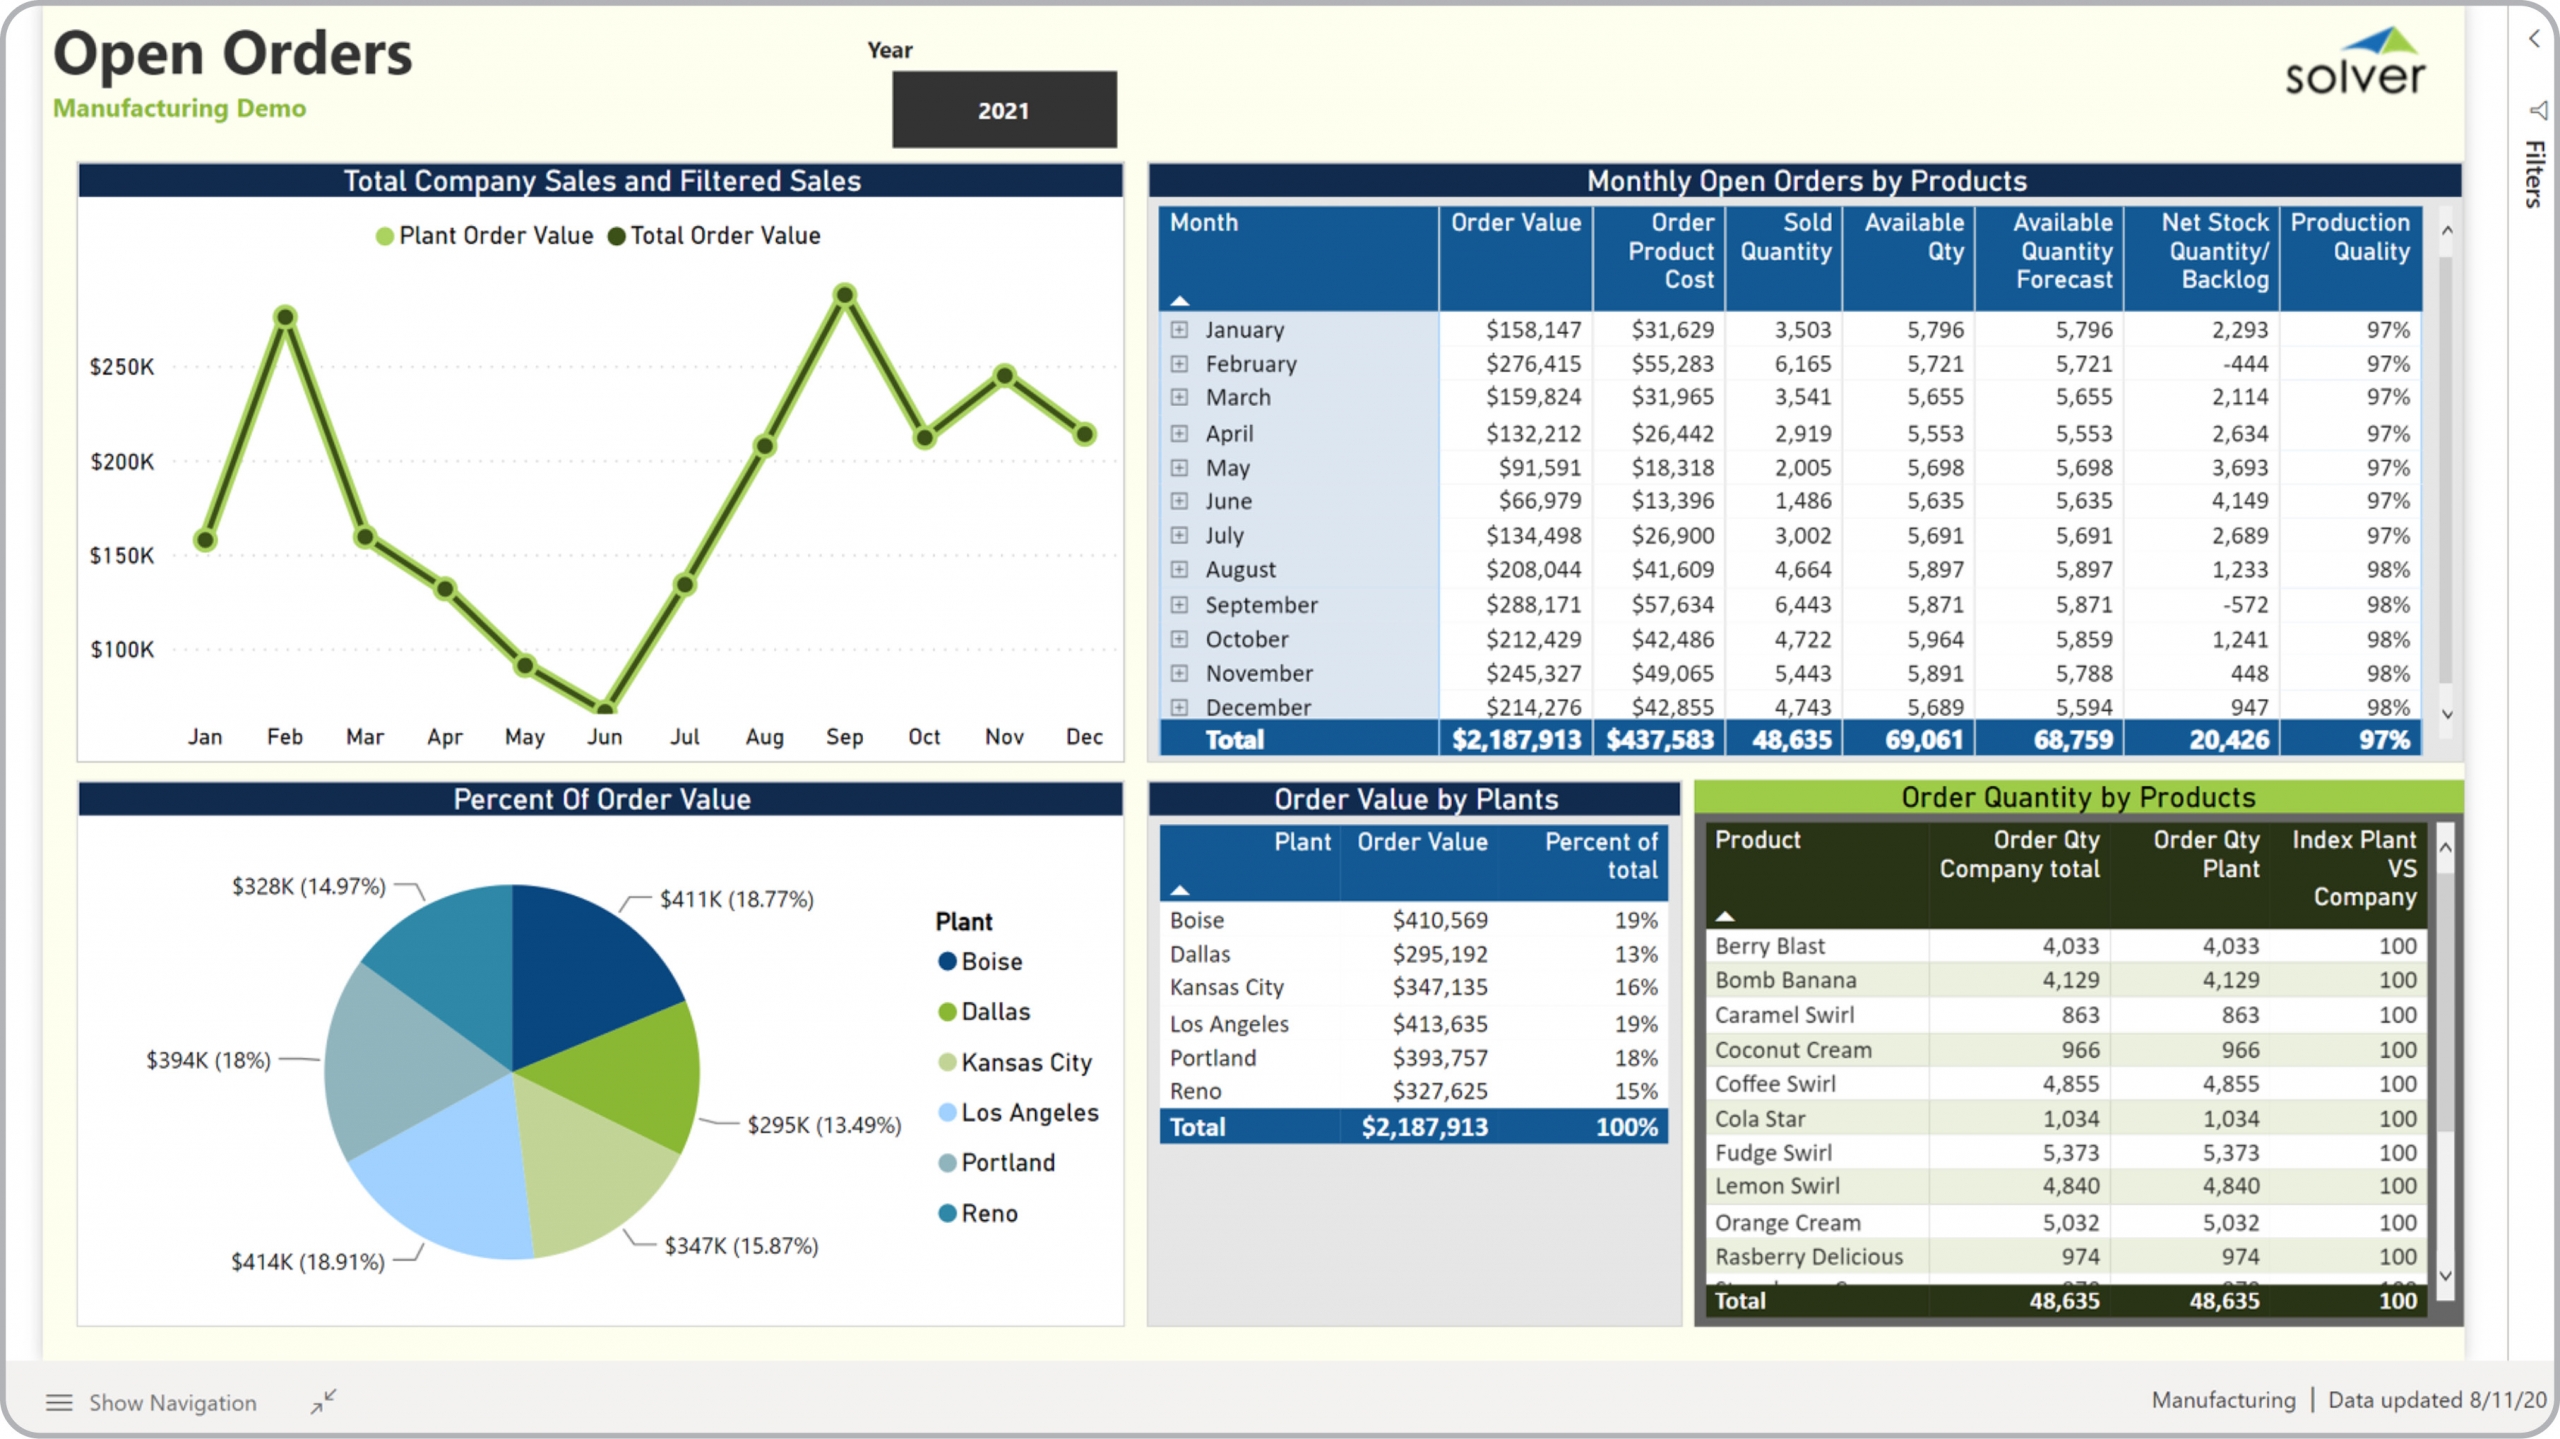
Mfg – Open Order Analysis
Power BI dashboard for open orders per manufacturing plant, by month and with order value, quantity, etc.
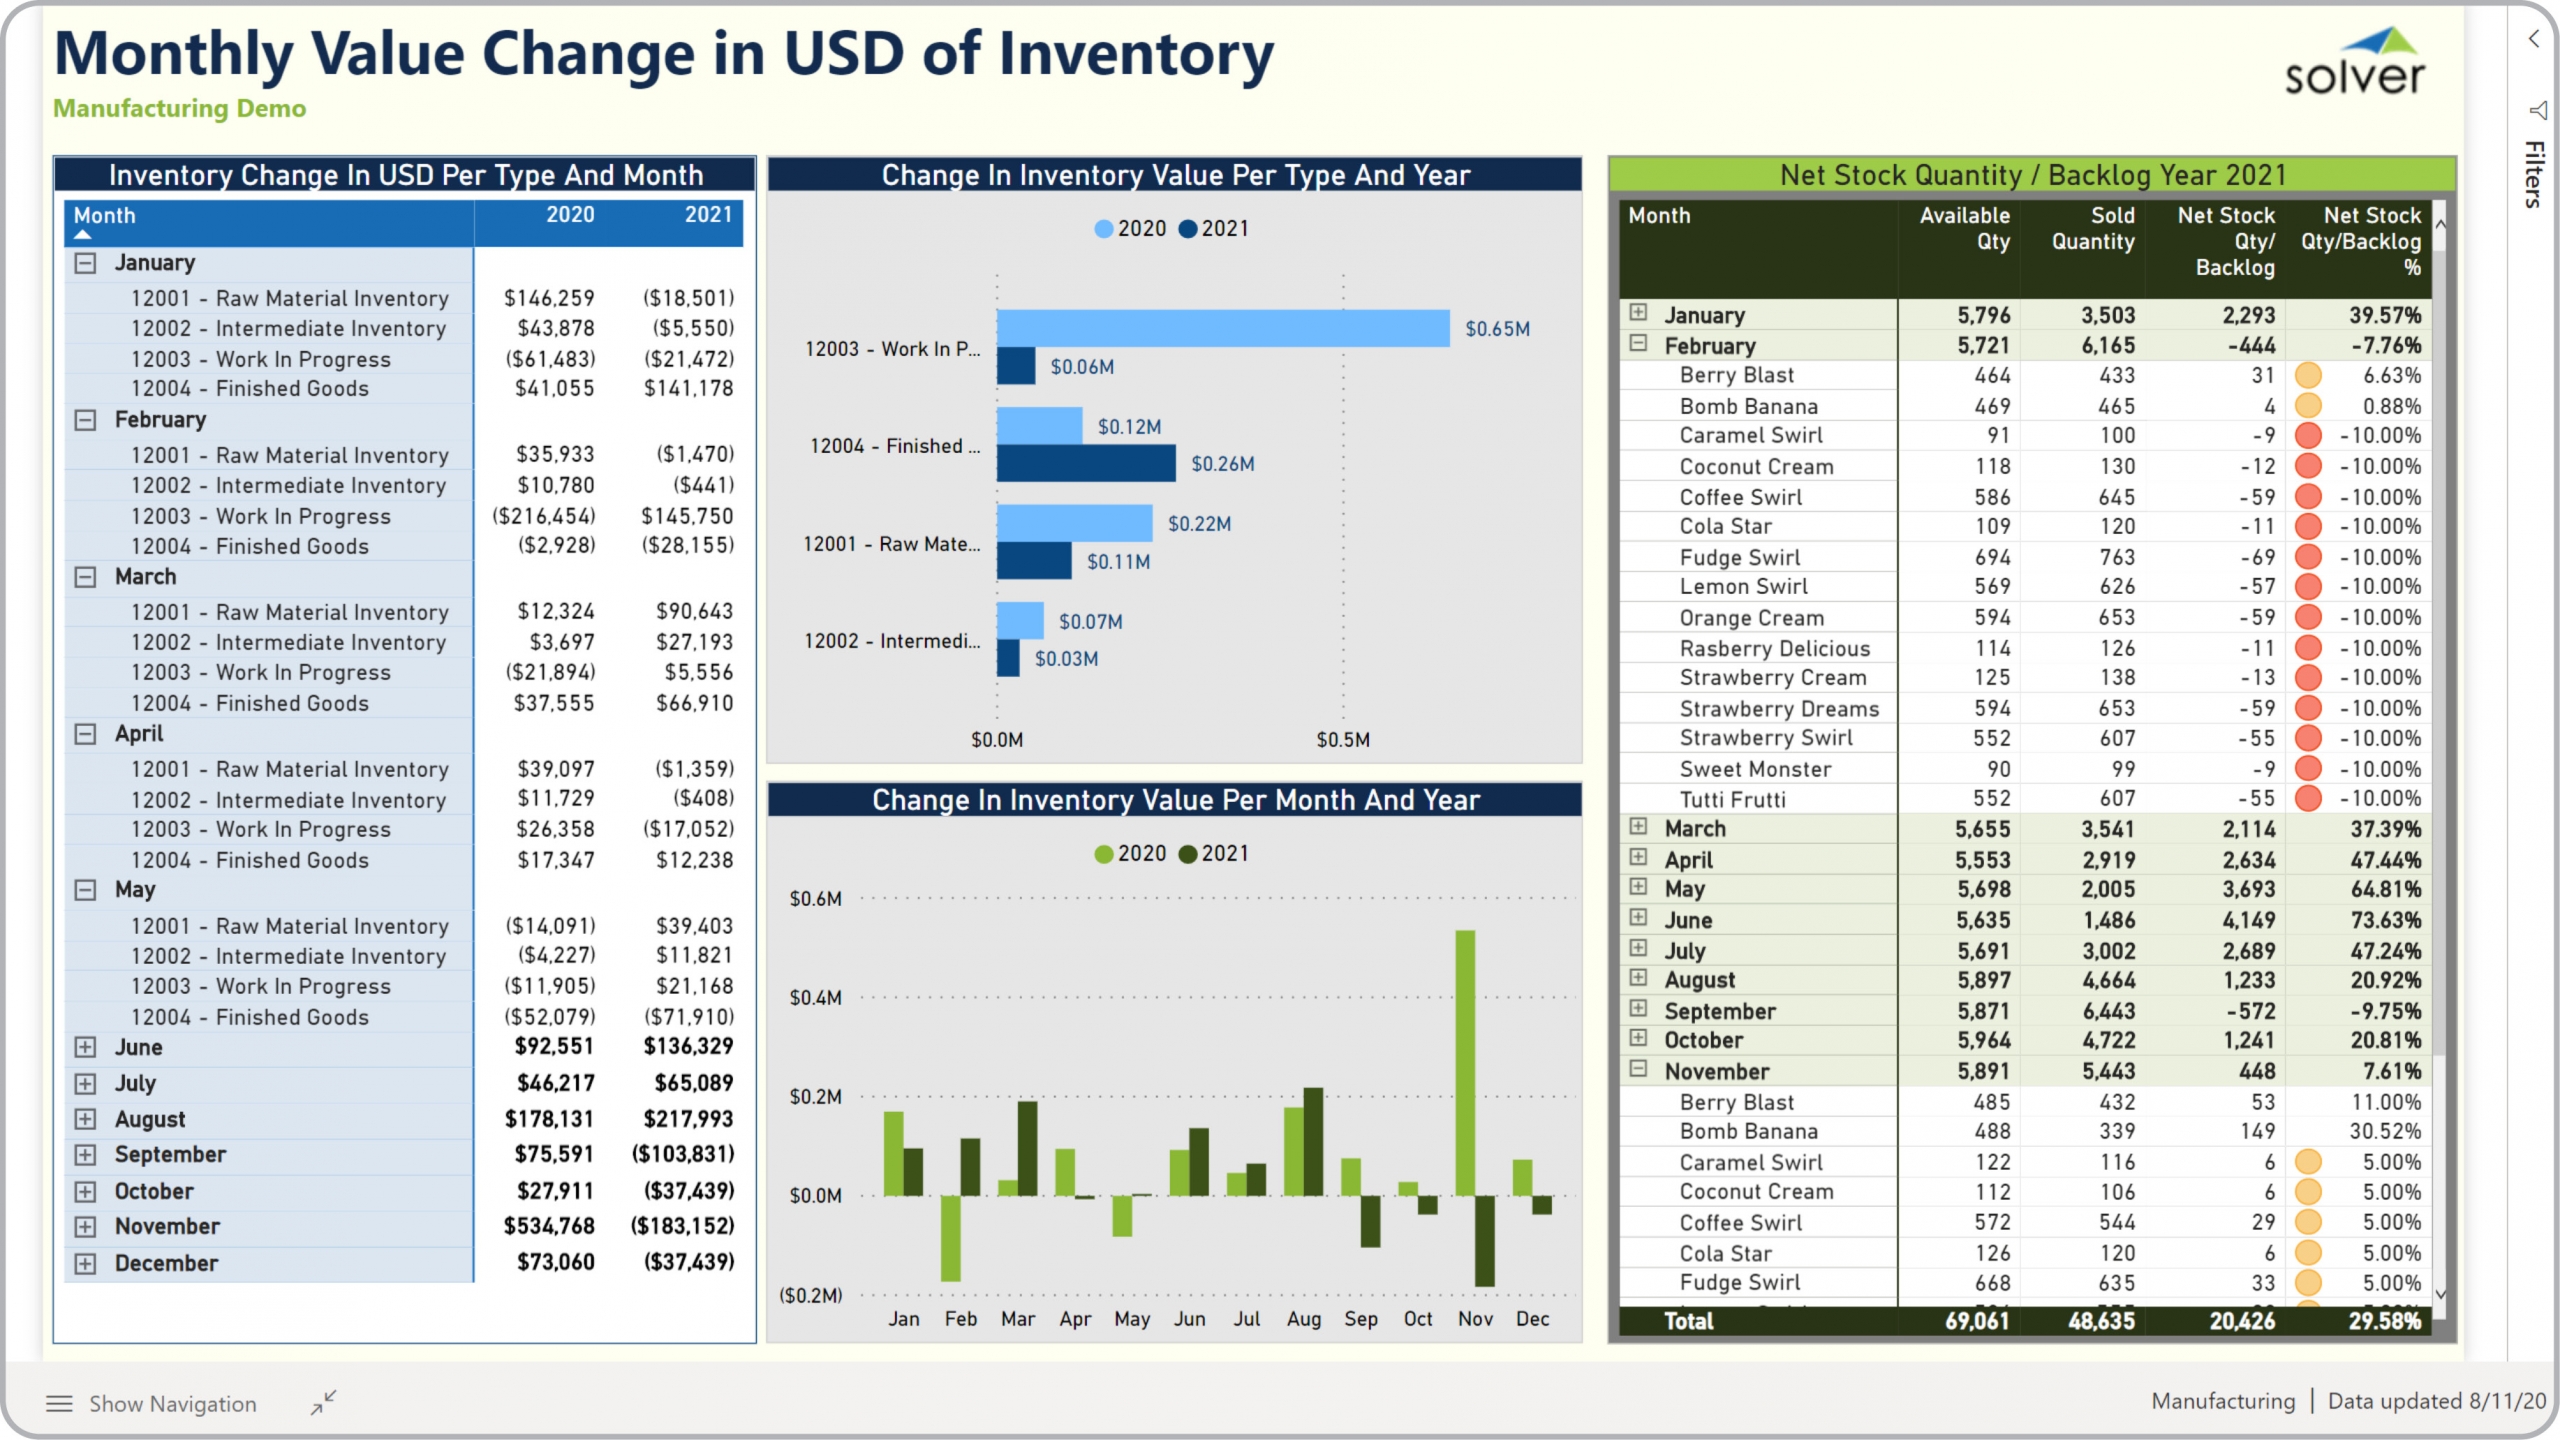
Mfg – Inventory Analysis
Power BI dashboard for inventory change and Net Stock analysis for a manufacturing plant.
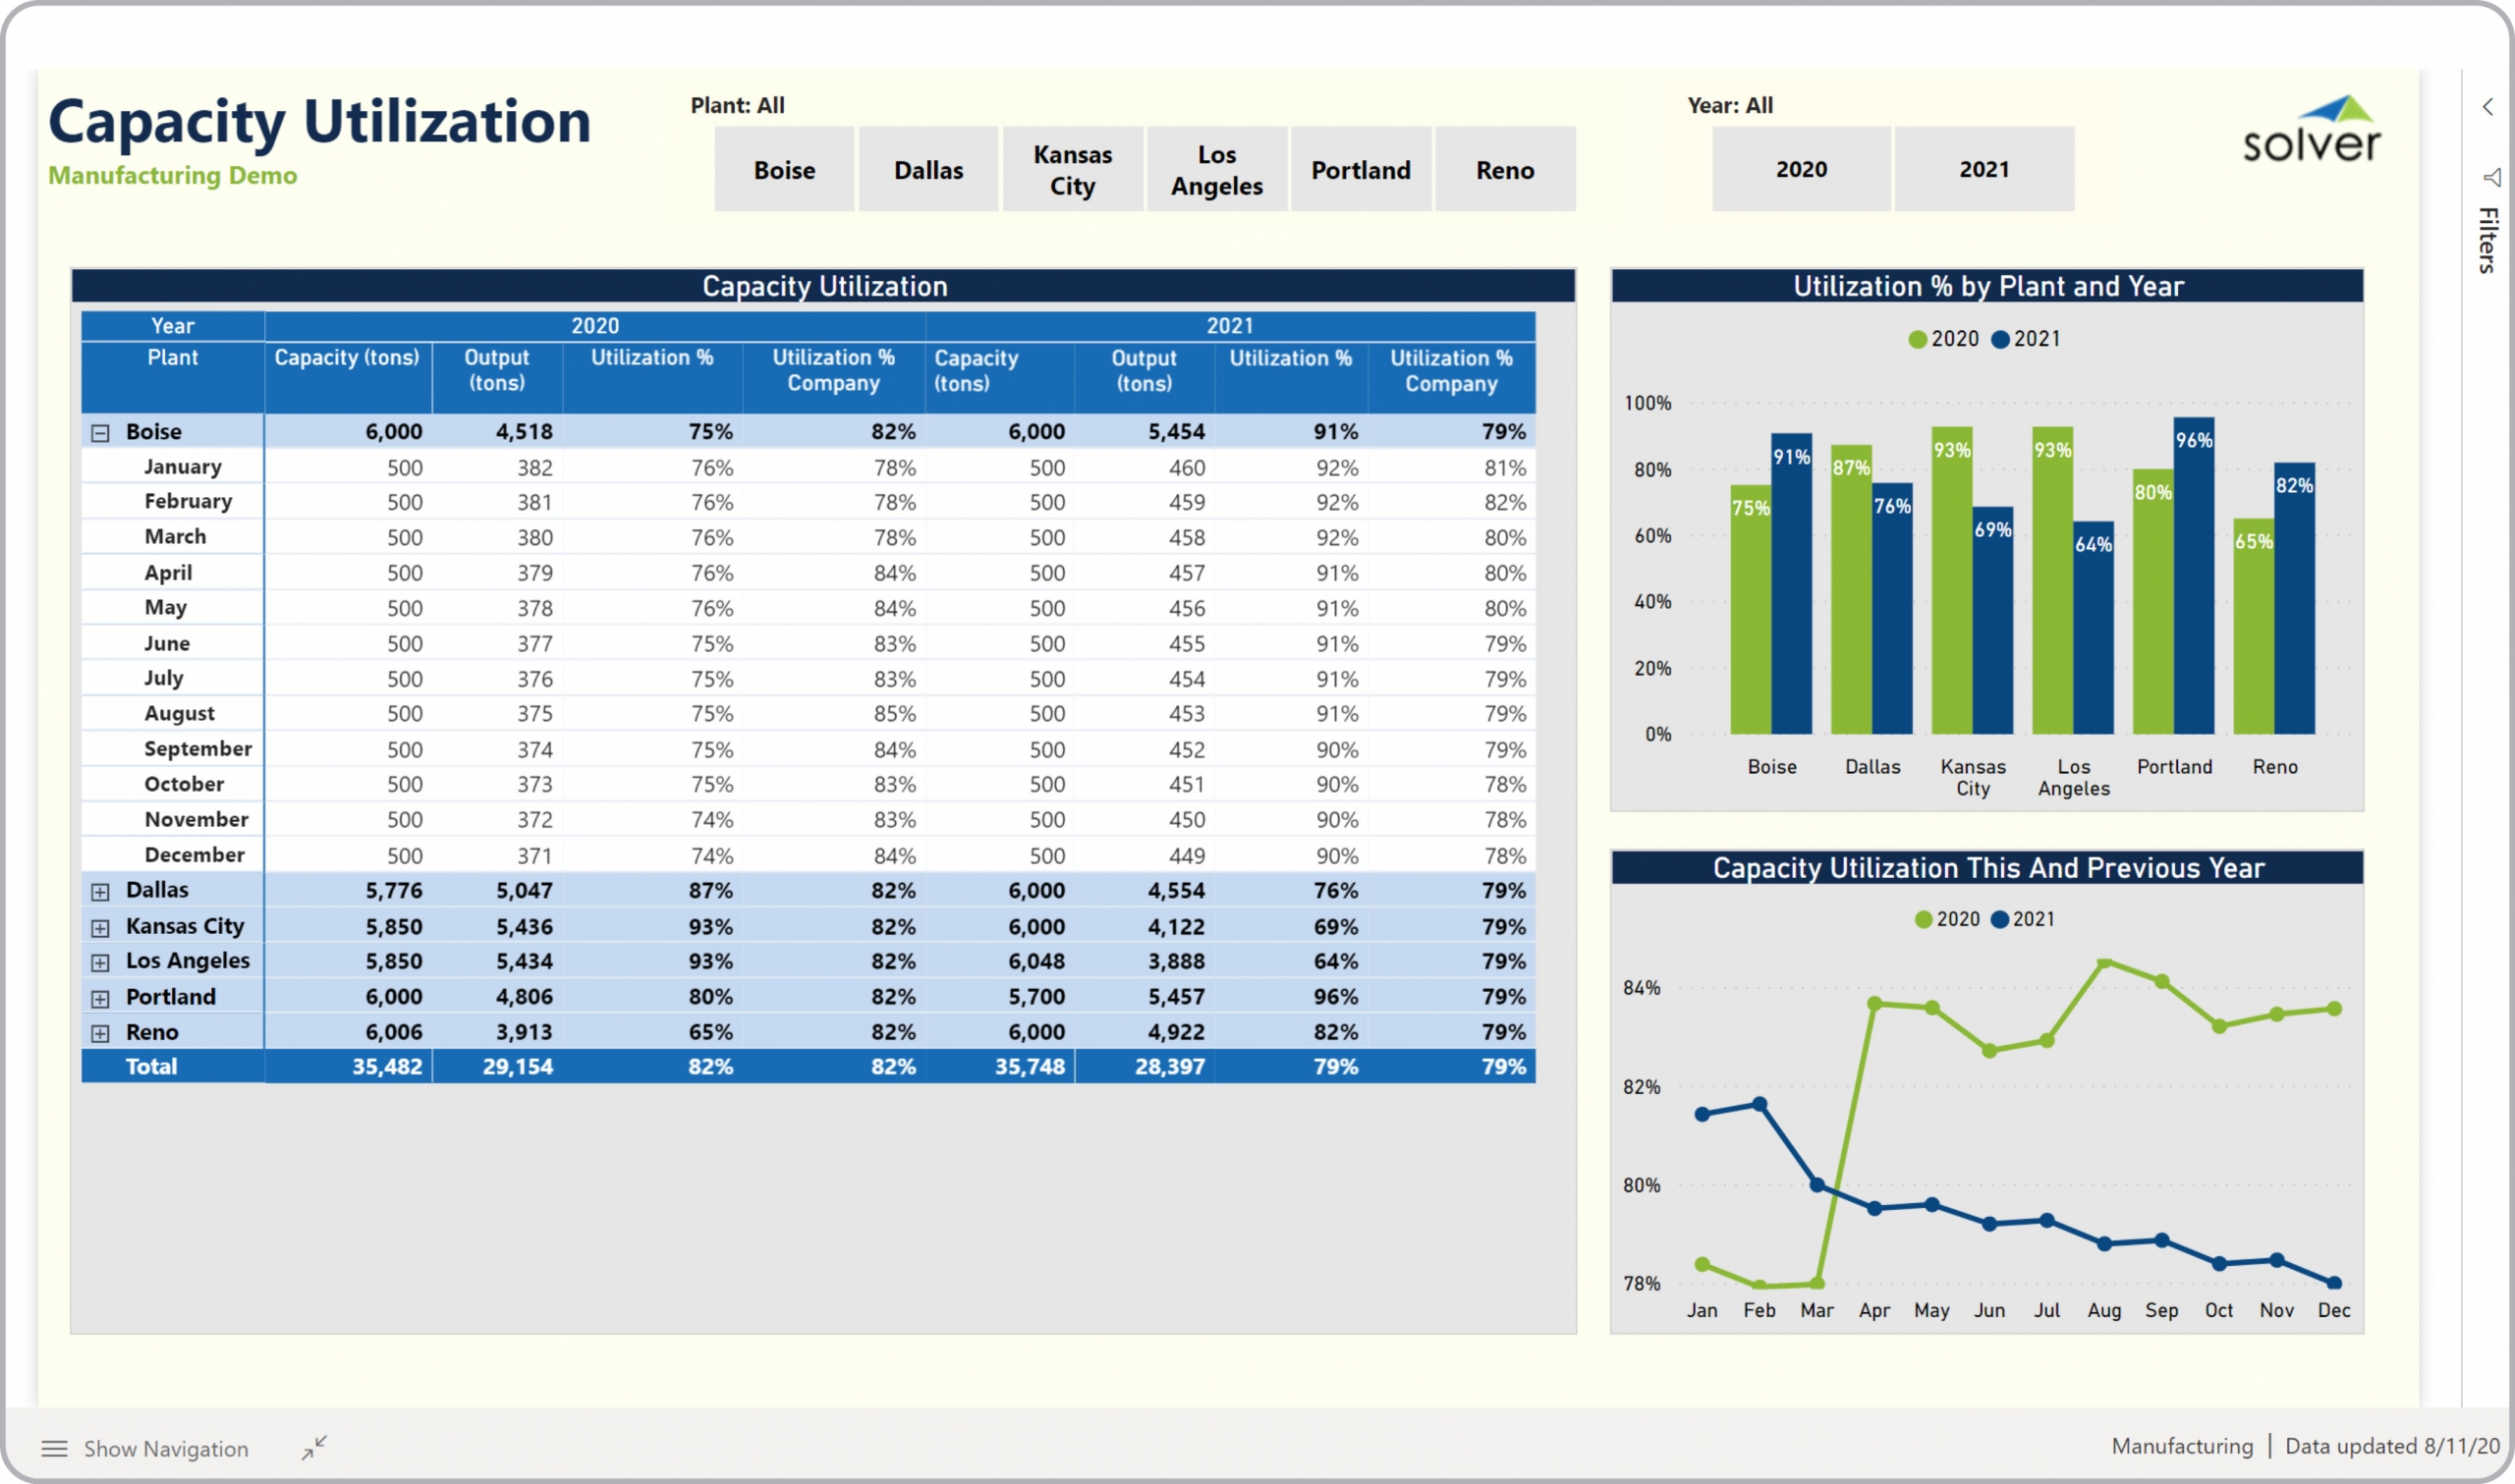
Mfg – Capacity Utilization
Power BI dashboard for utilization by manufacturing plant and by month, including trend versus prior year.
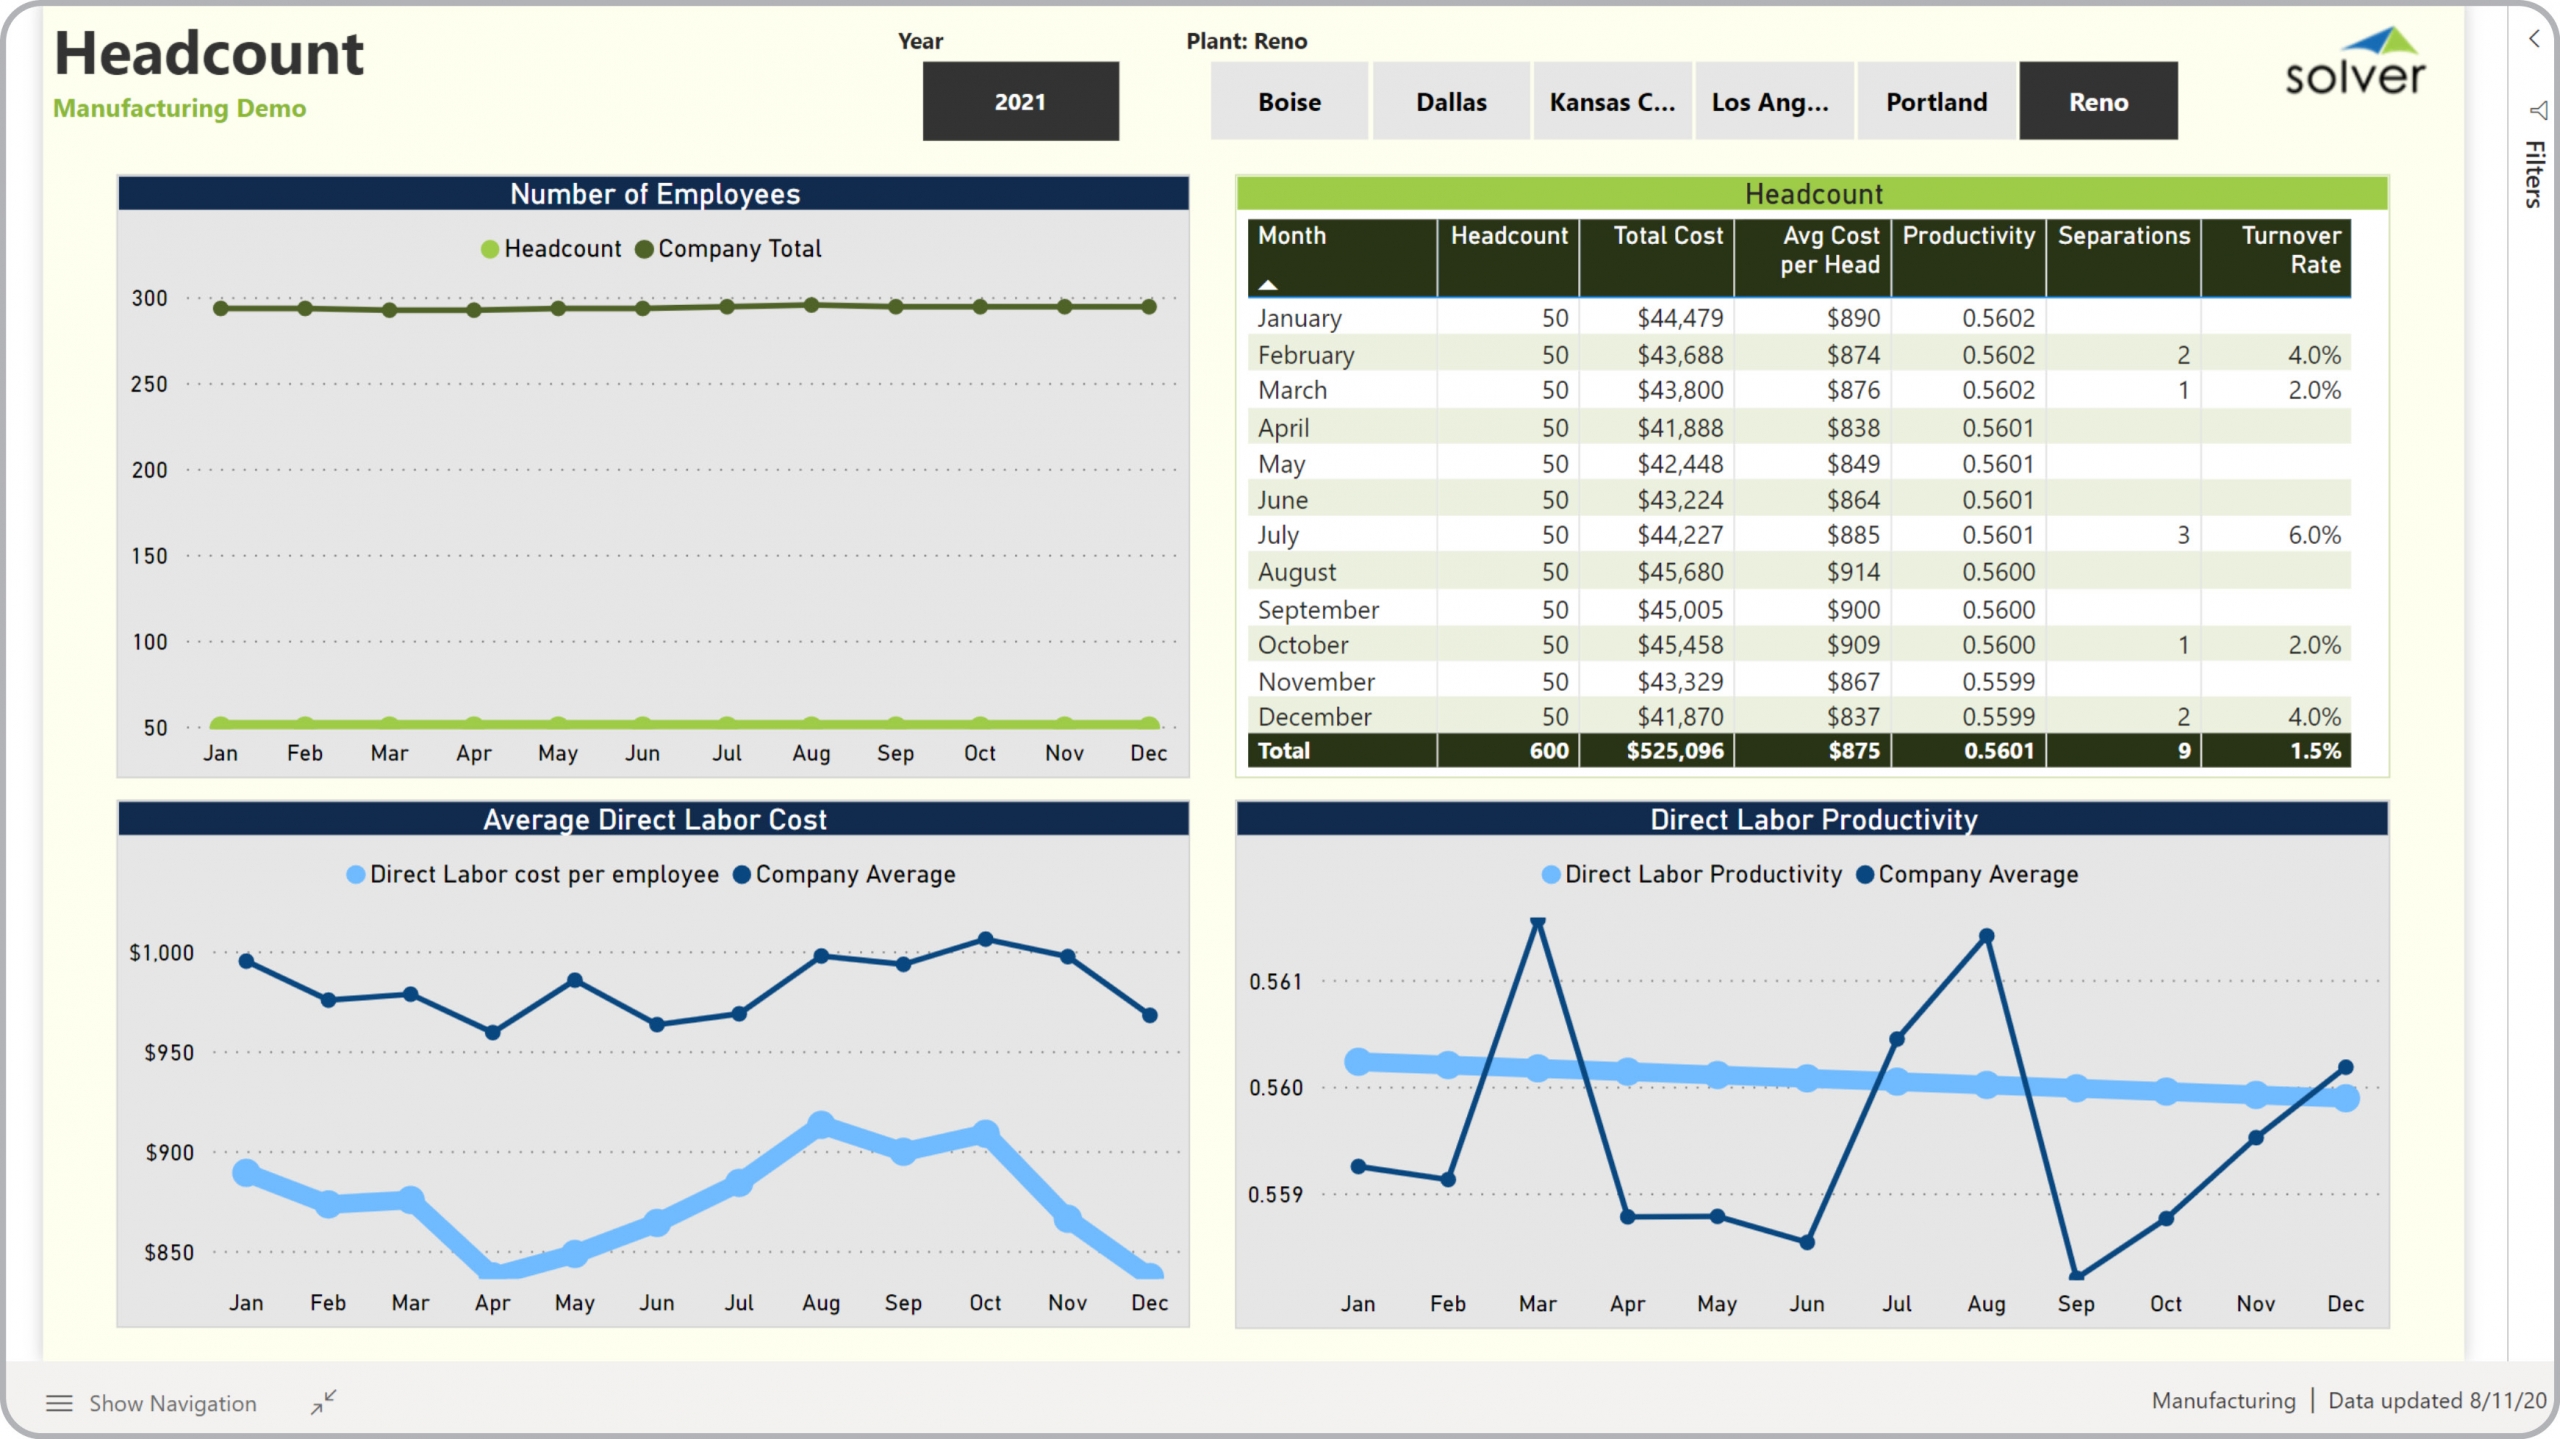
Mfg – Personnel Cost and Productivity
Power BI dashboard for headcount, labor cost and productivity analysis for a manufacturing plant.
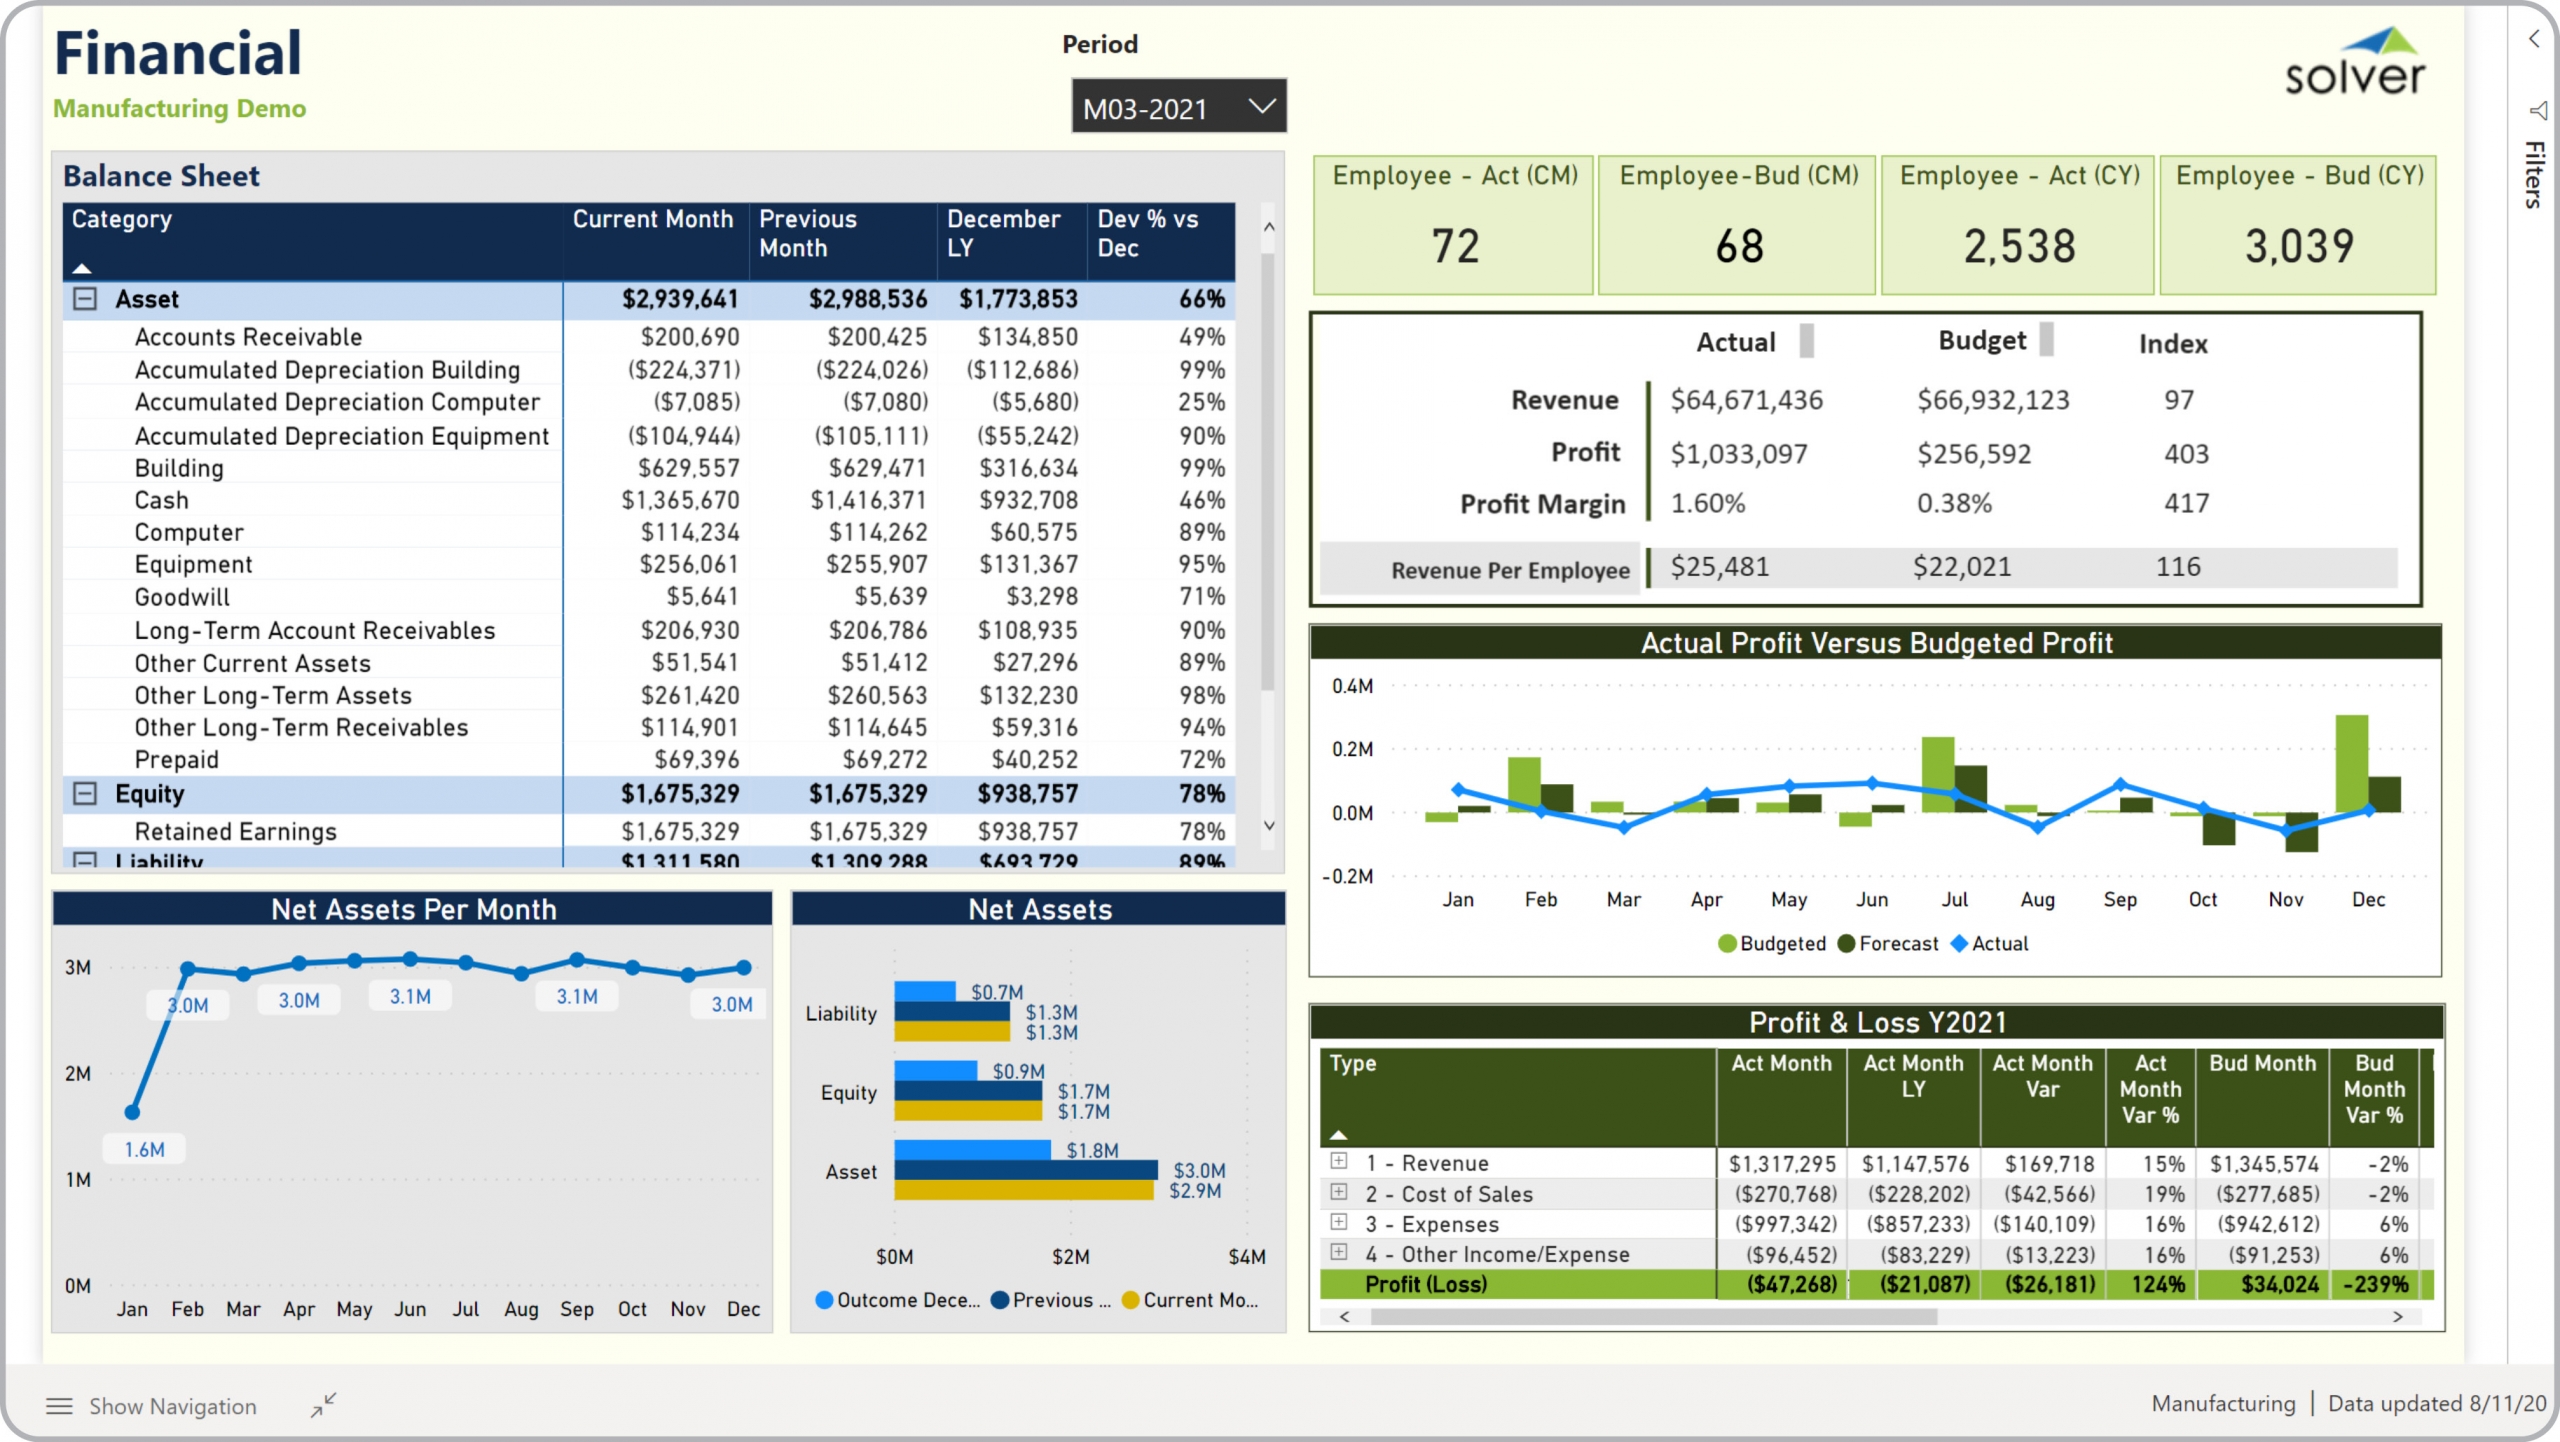
Mfg – Financial Summary
Power BI dashboard with financial highlights and headcount statistics.
Mfg – Executive Summary
Power BI dashboard showing key metrics for revenue, cost and top performers.
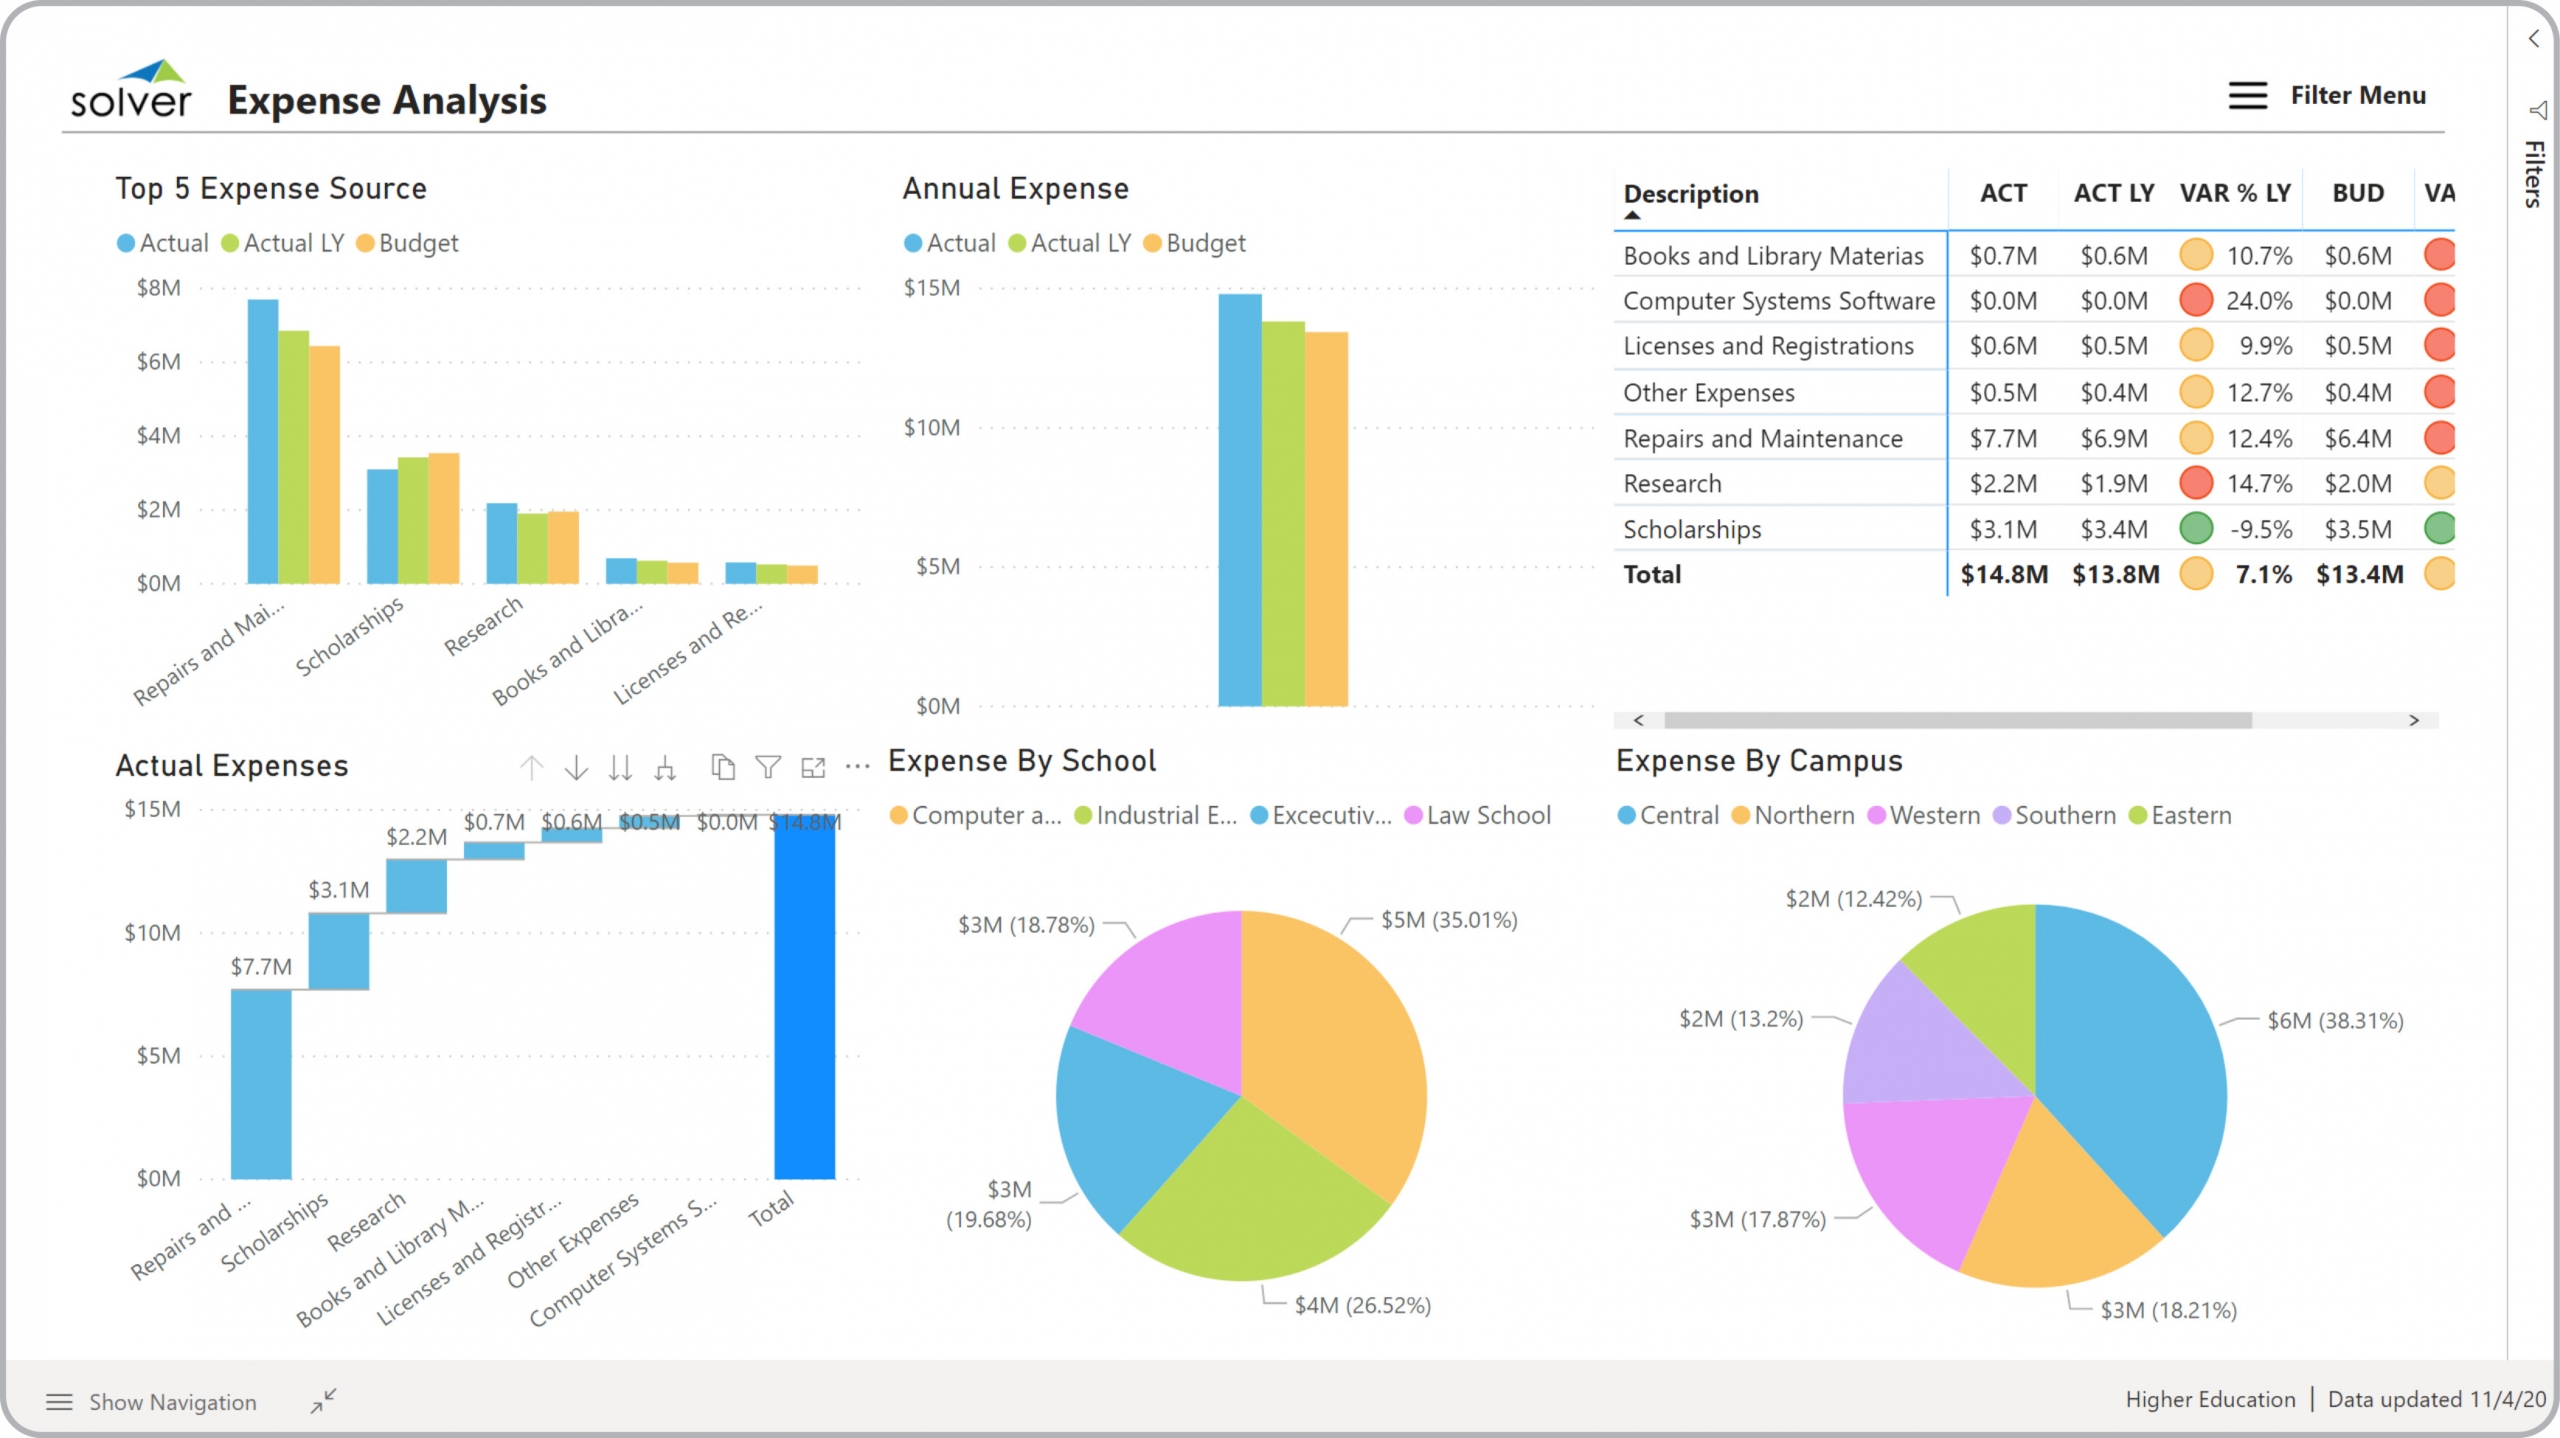
Higher Ed – Expense Analysis
Power BI dashboard that helps a university analyze expenses by campus, versus budget, by account and more.
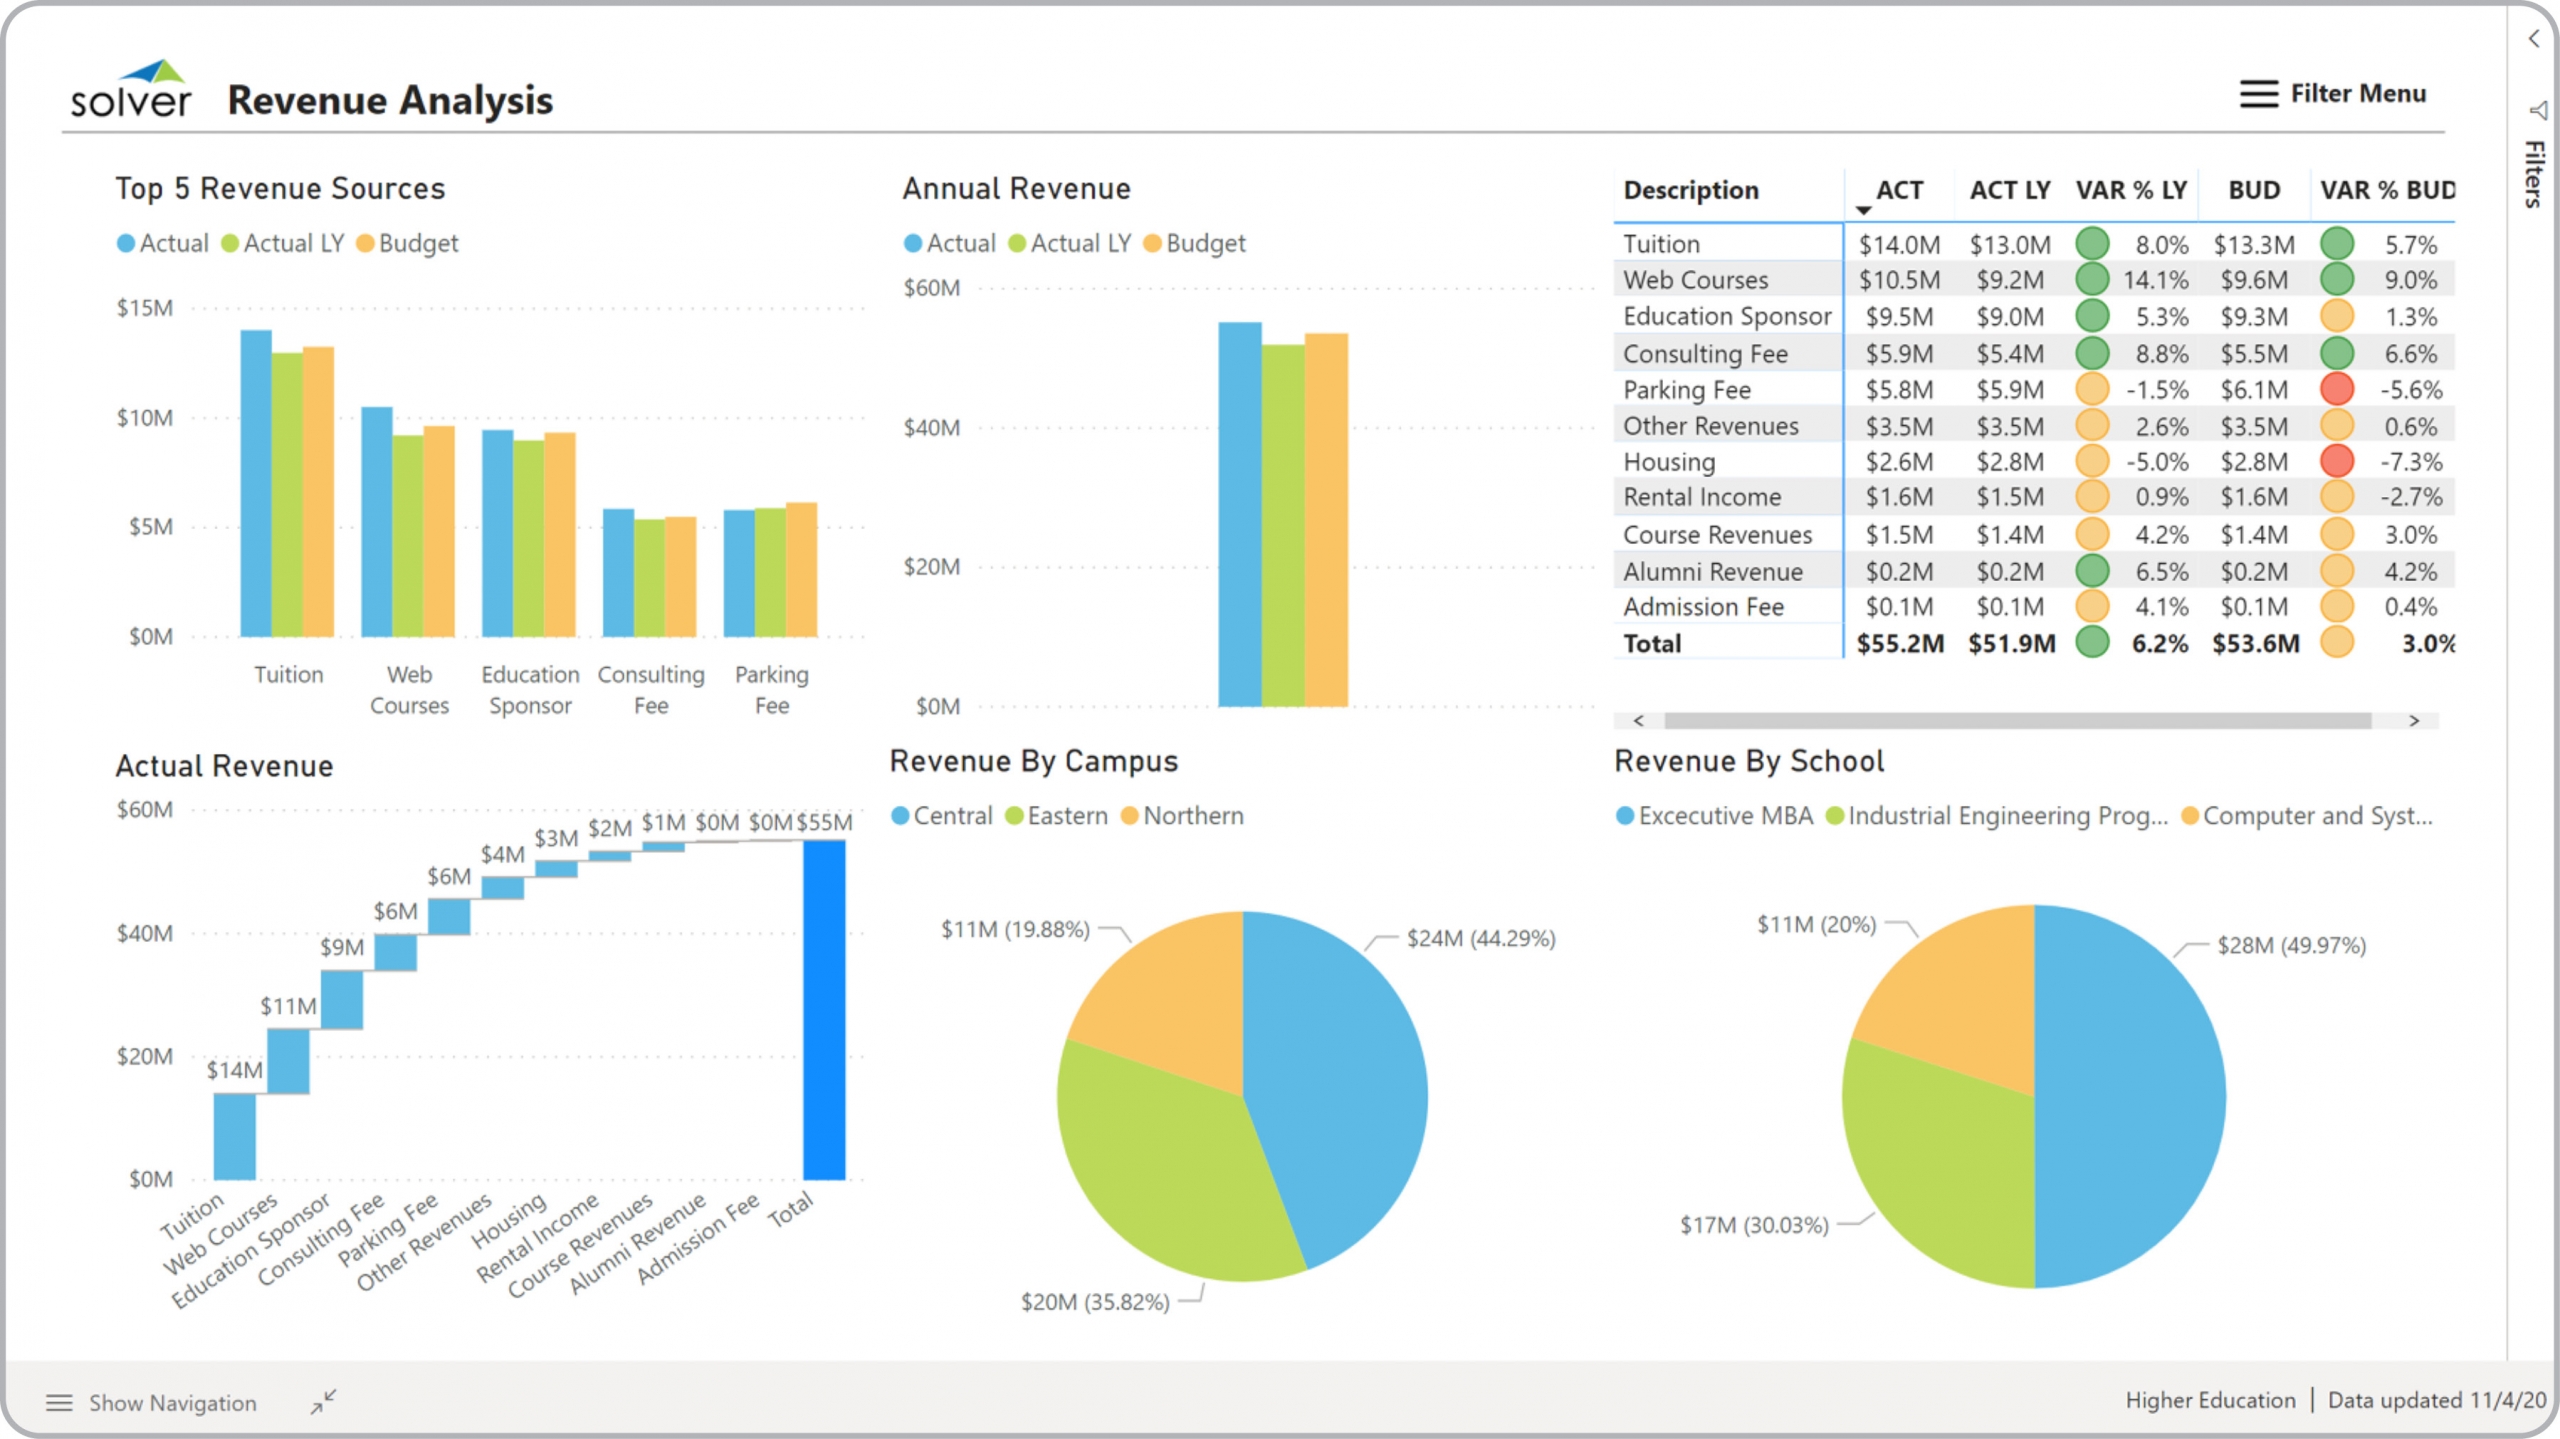
Higher Ed – Revenue Analysis
Power BI dashboard that helps a university analyze revenues by campus, versus budget, by account and more.
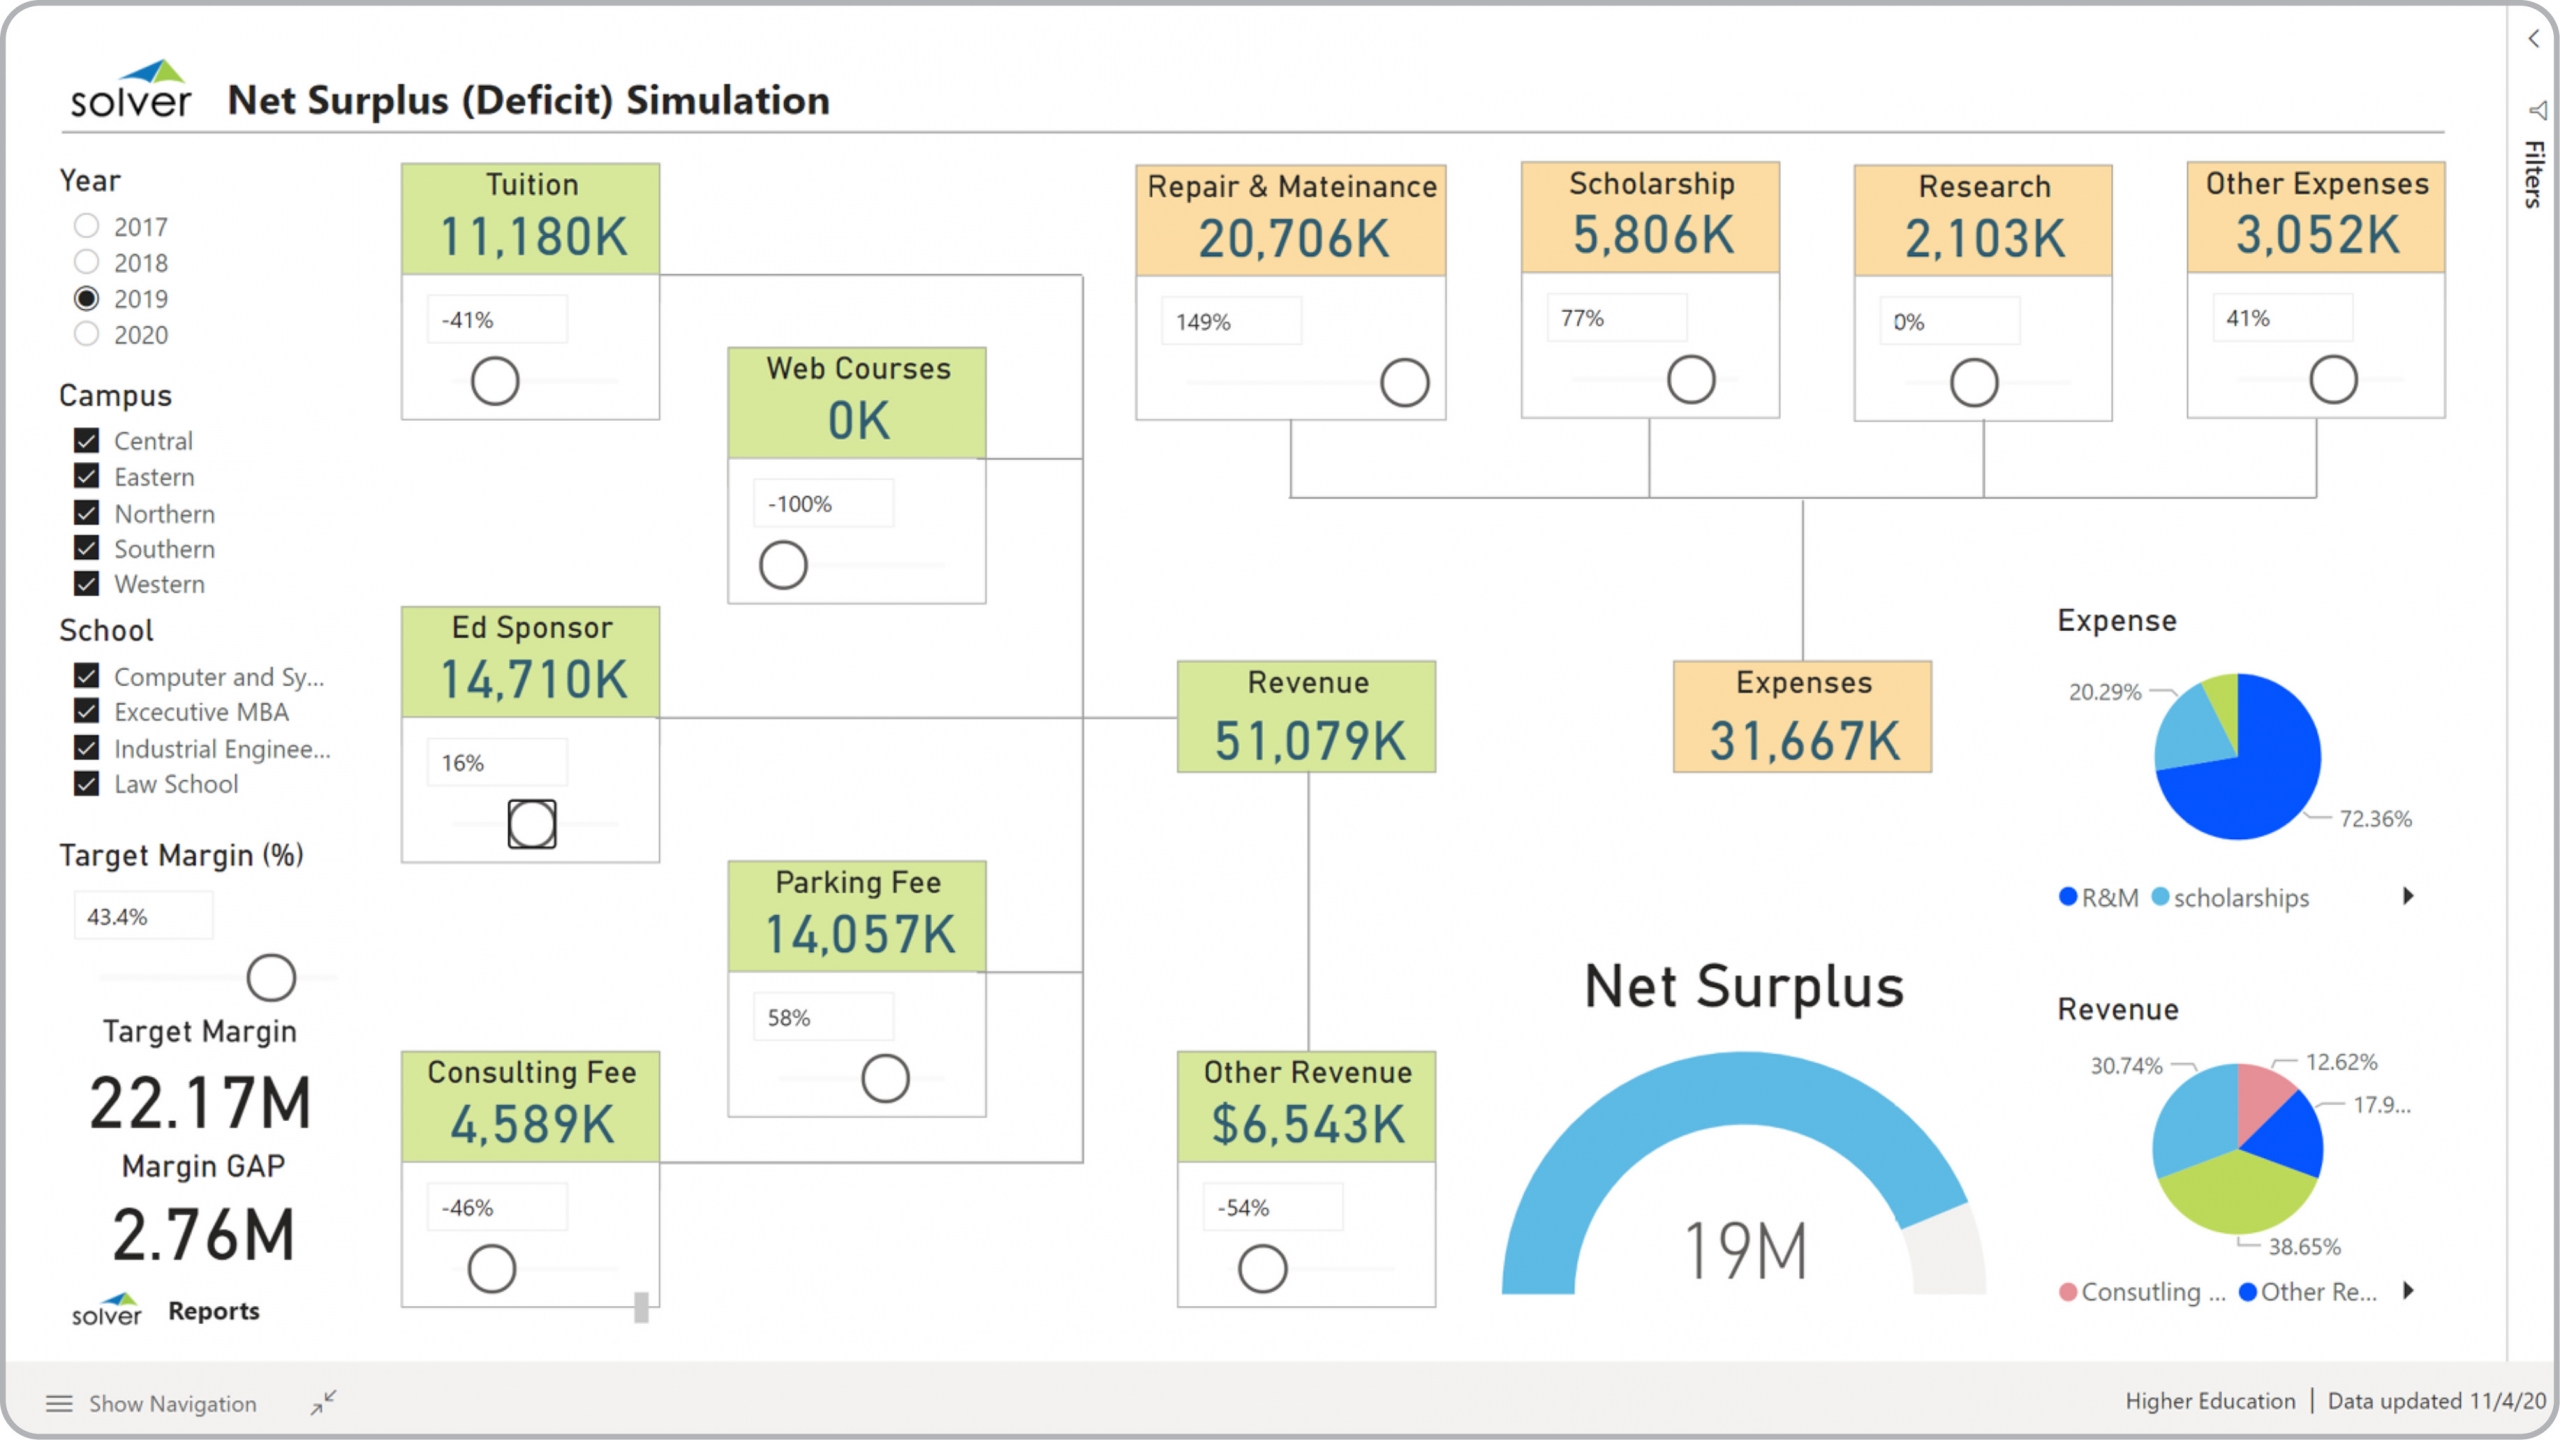
Higher Ed – Surplus (Deficit) Simulation
Power BI dashboard with interactive simulation of revenues and expense categories to see impact on surplus or deficit.
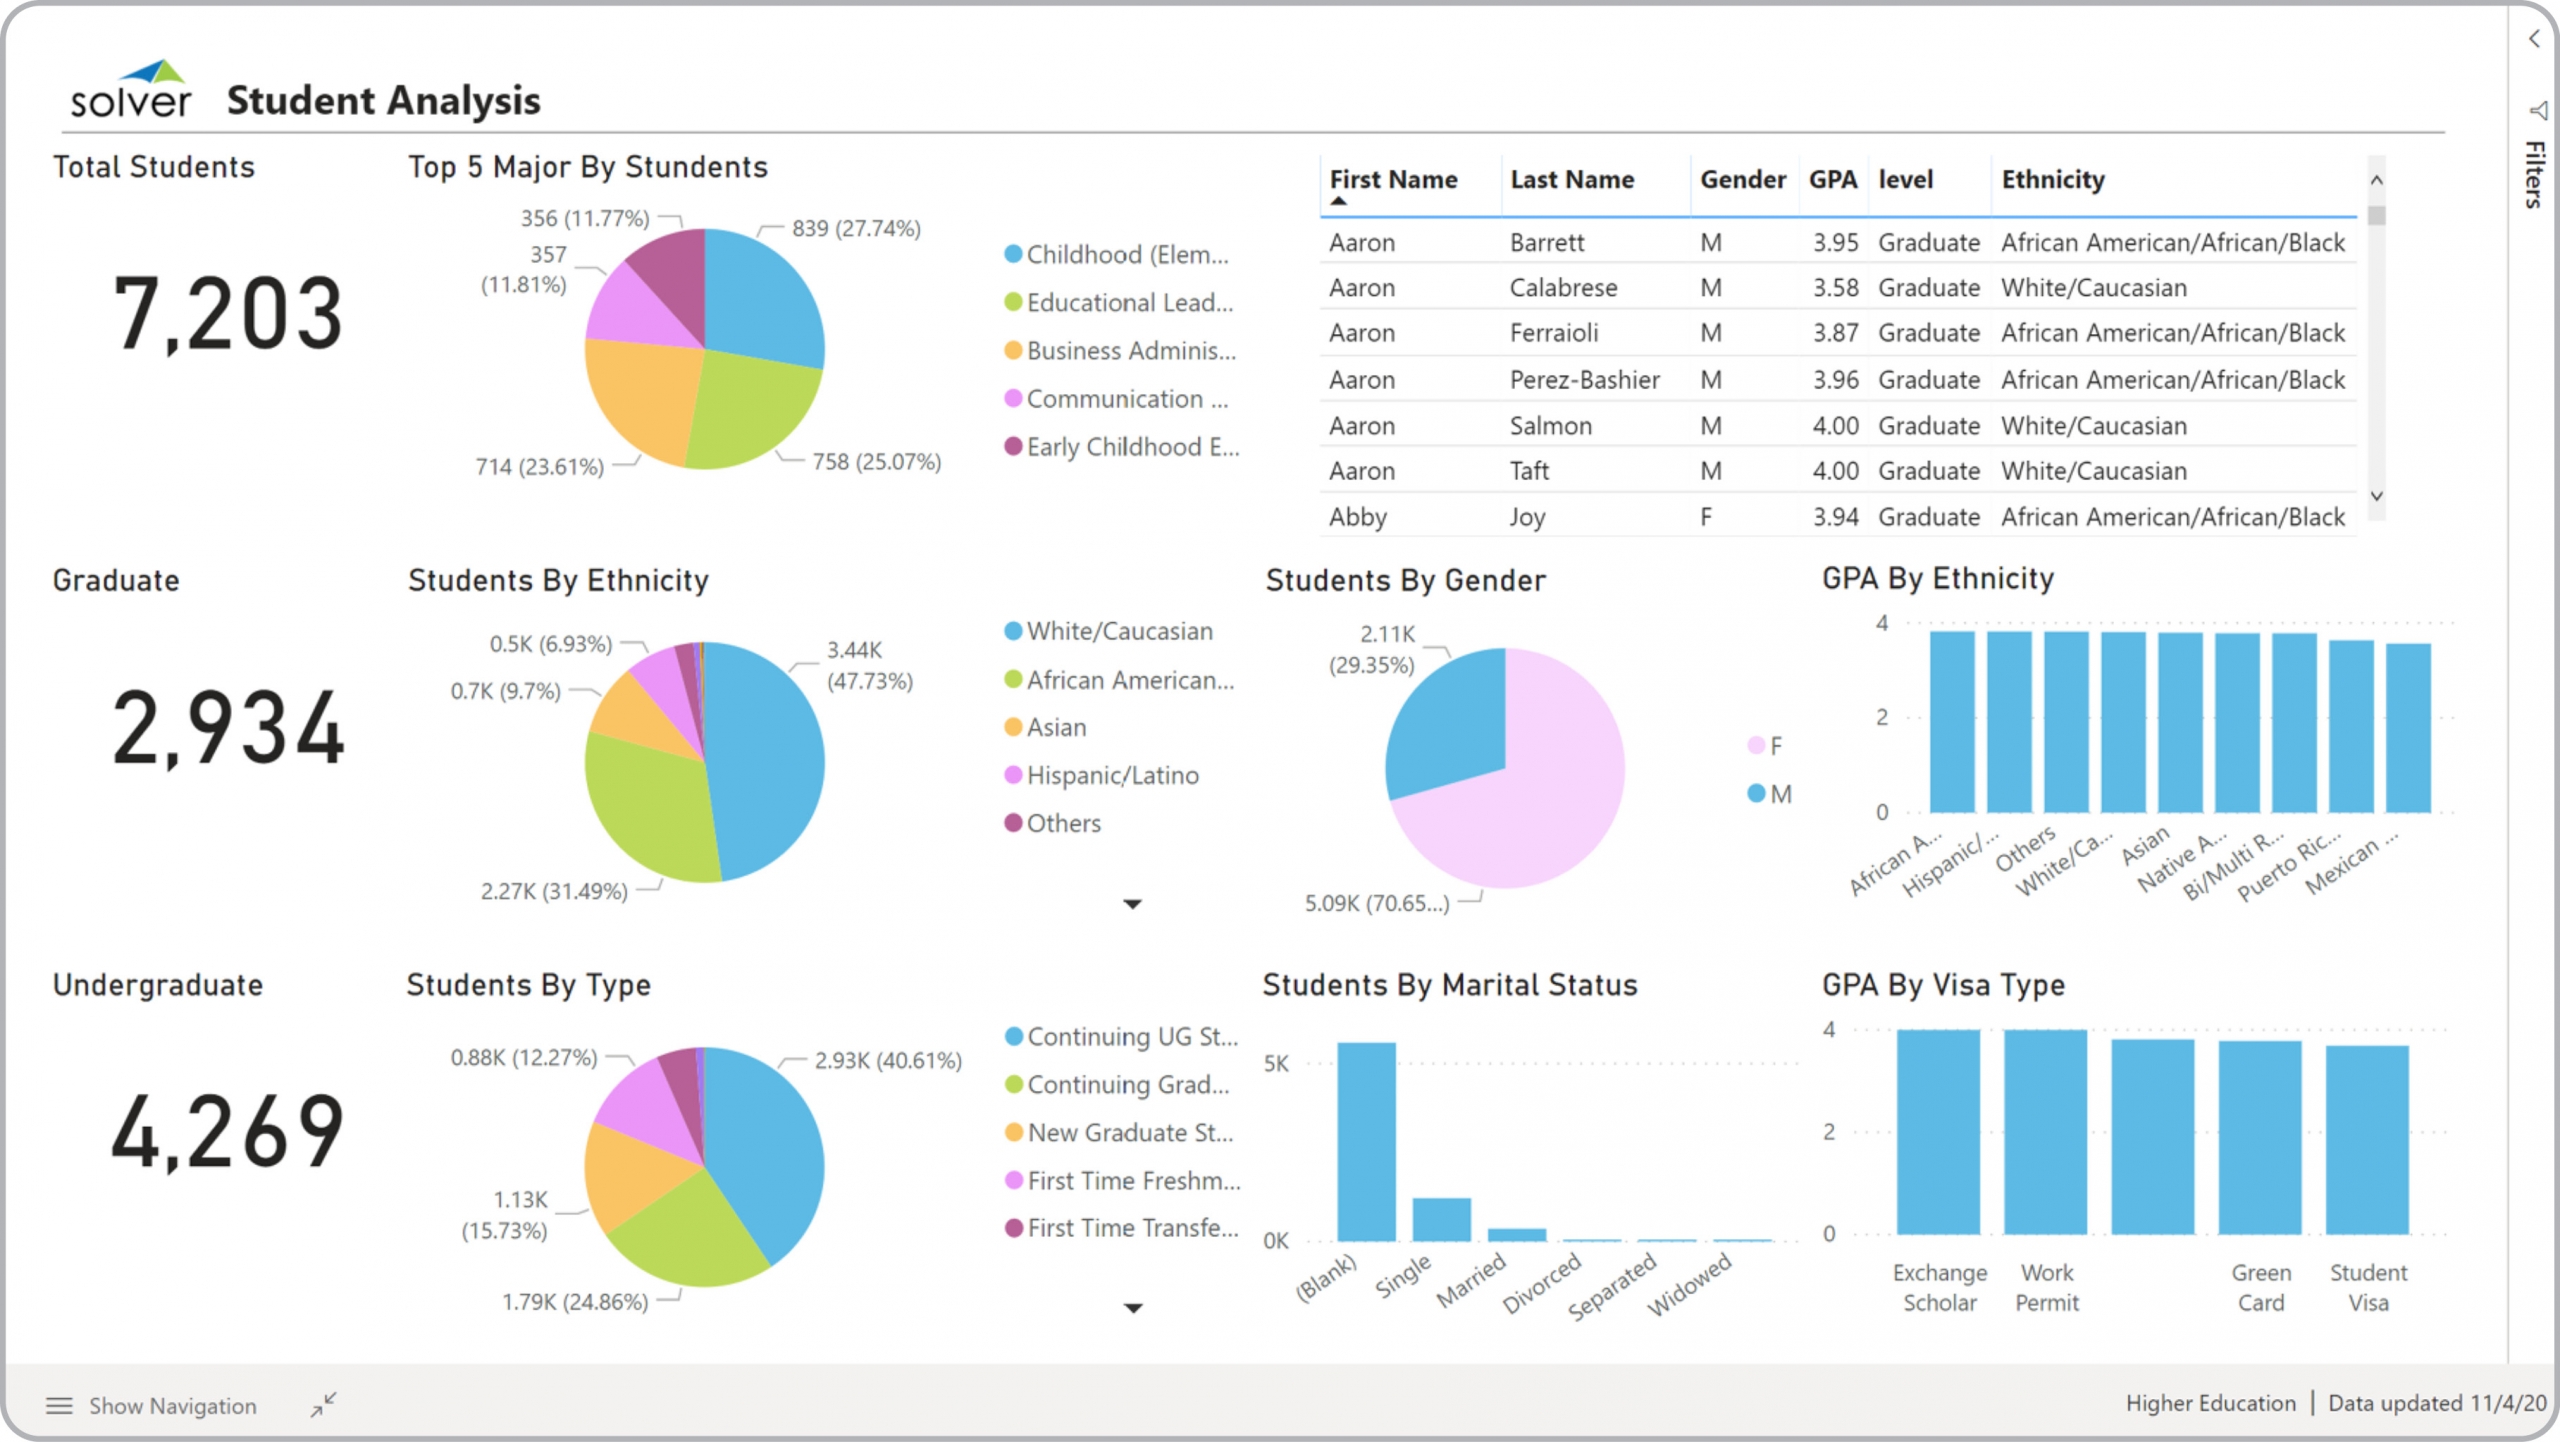
Higher Ed – Student Analysis
Power BI dashboard to analyze student KPIs for gender, ethnicity, major and program.
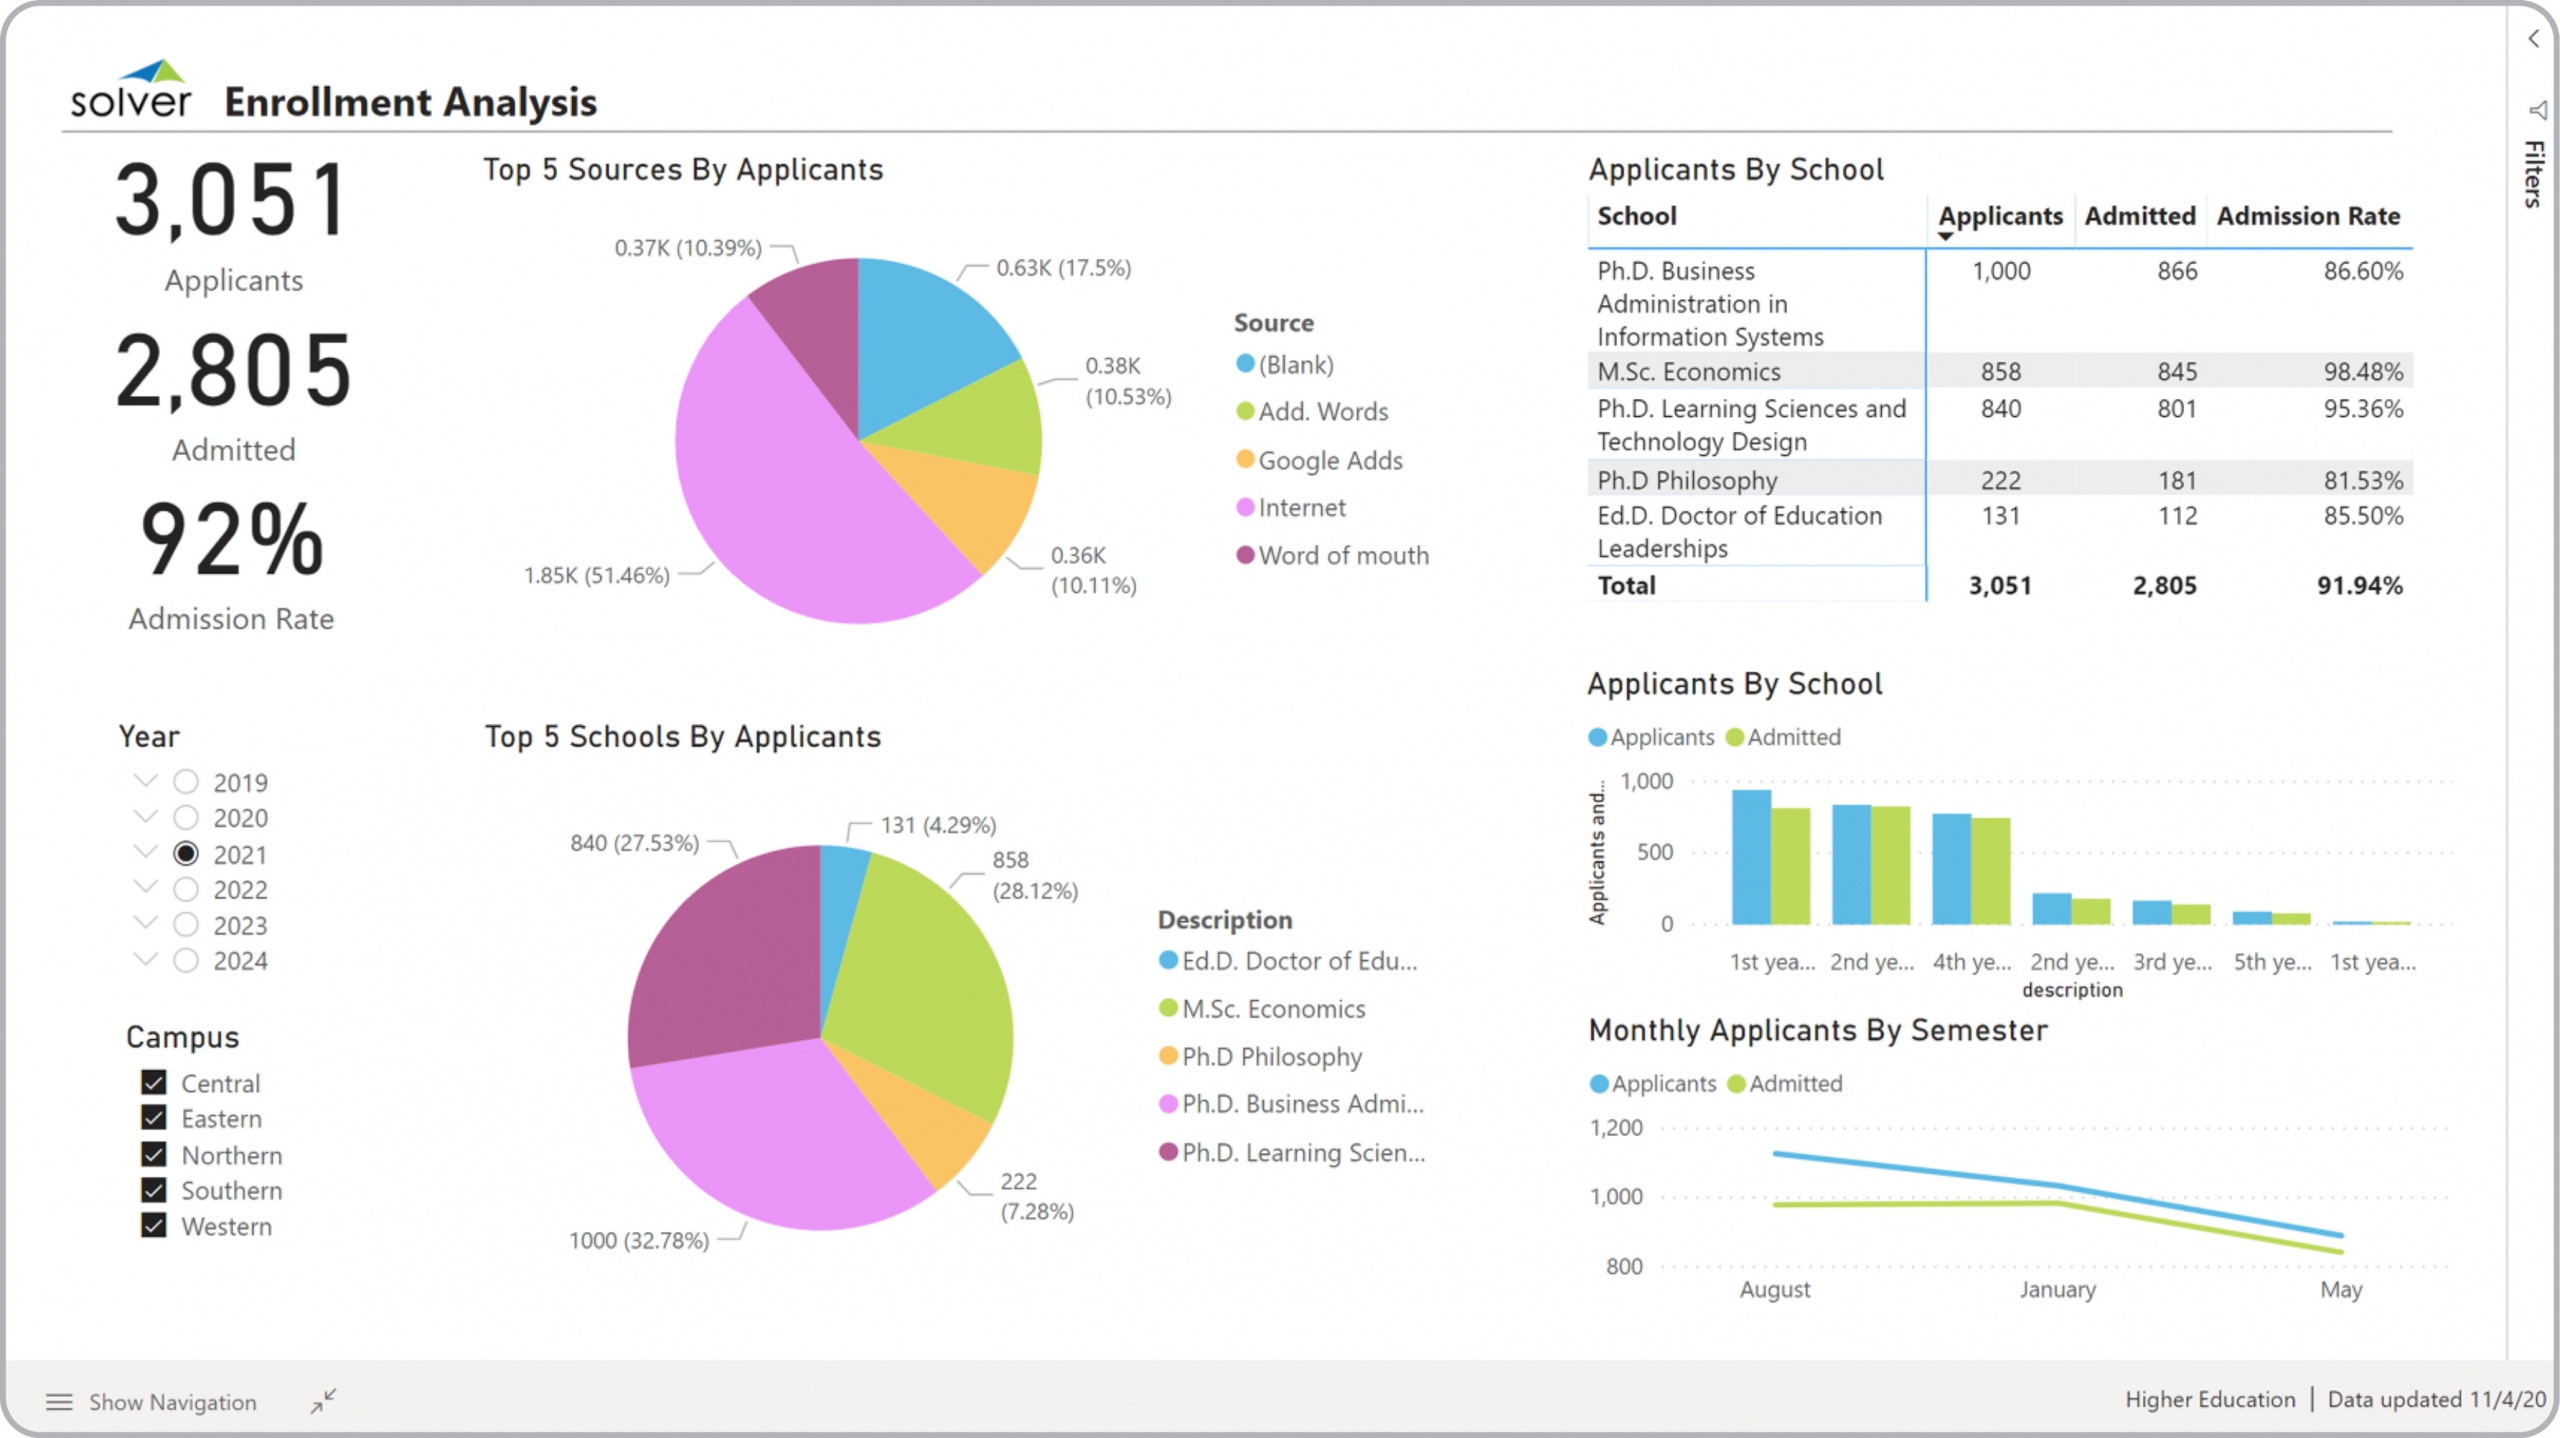
Higher Ed – Enrollment Analysis
Power BI dashboard with metrics for applicants, admissions, school and campus.
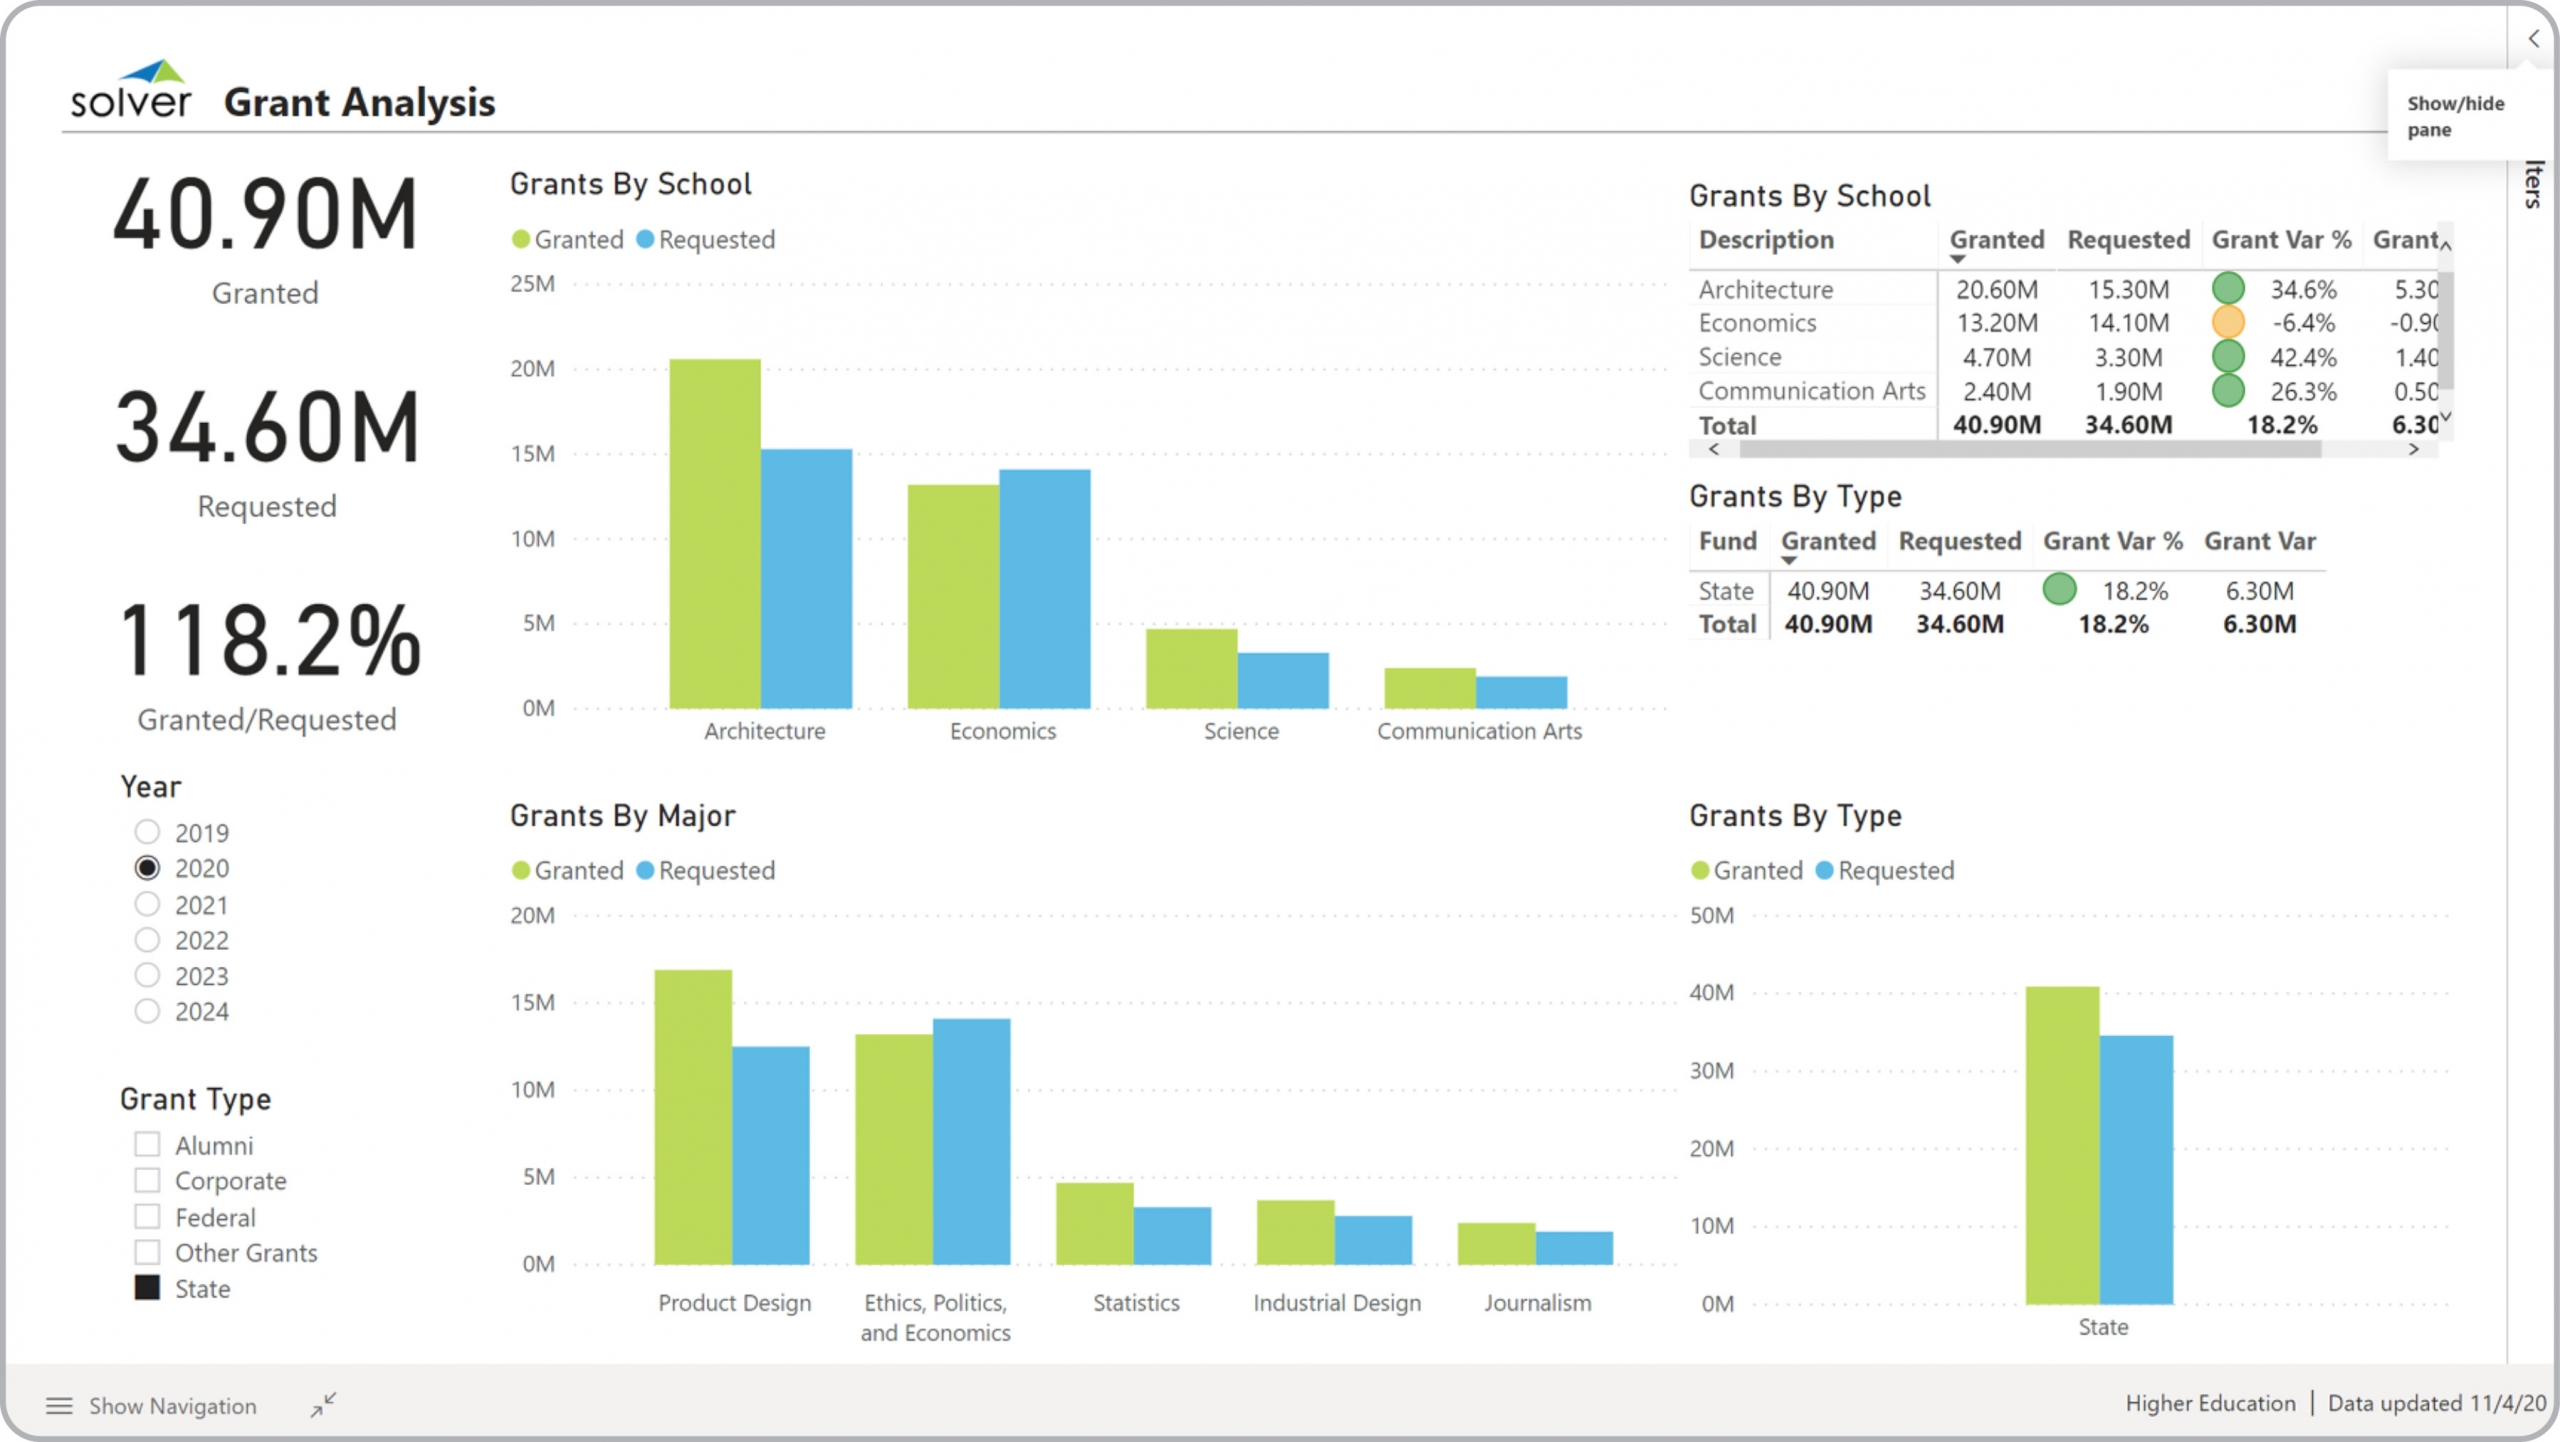
Higher Ed – Grant Analysis
Power BI dashboard for analyzing metrics like amount granted versus requested, and grants by type, school and major.
Pharma – Sales Management Dashboard
Sales analysis and trends for products, business units, channel and samples.
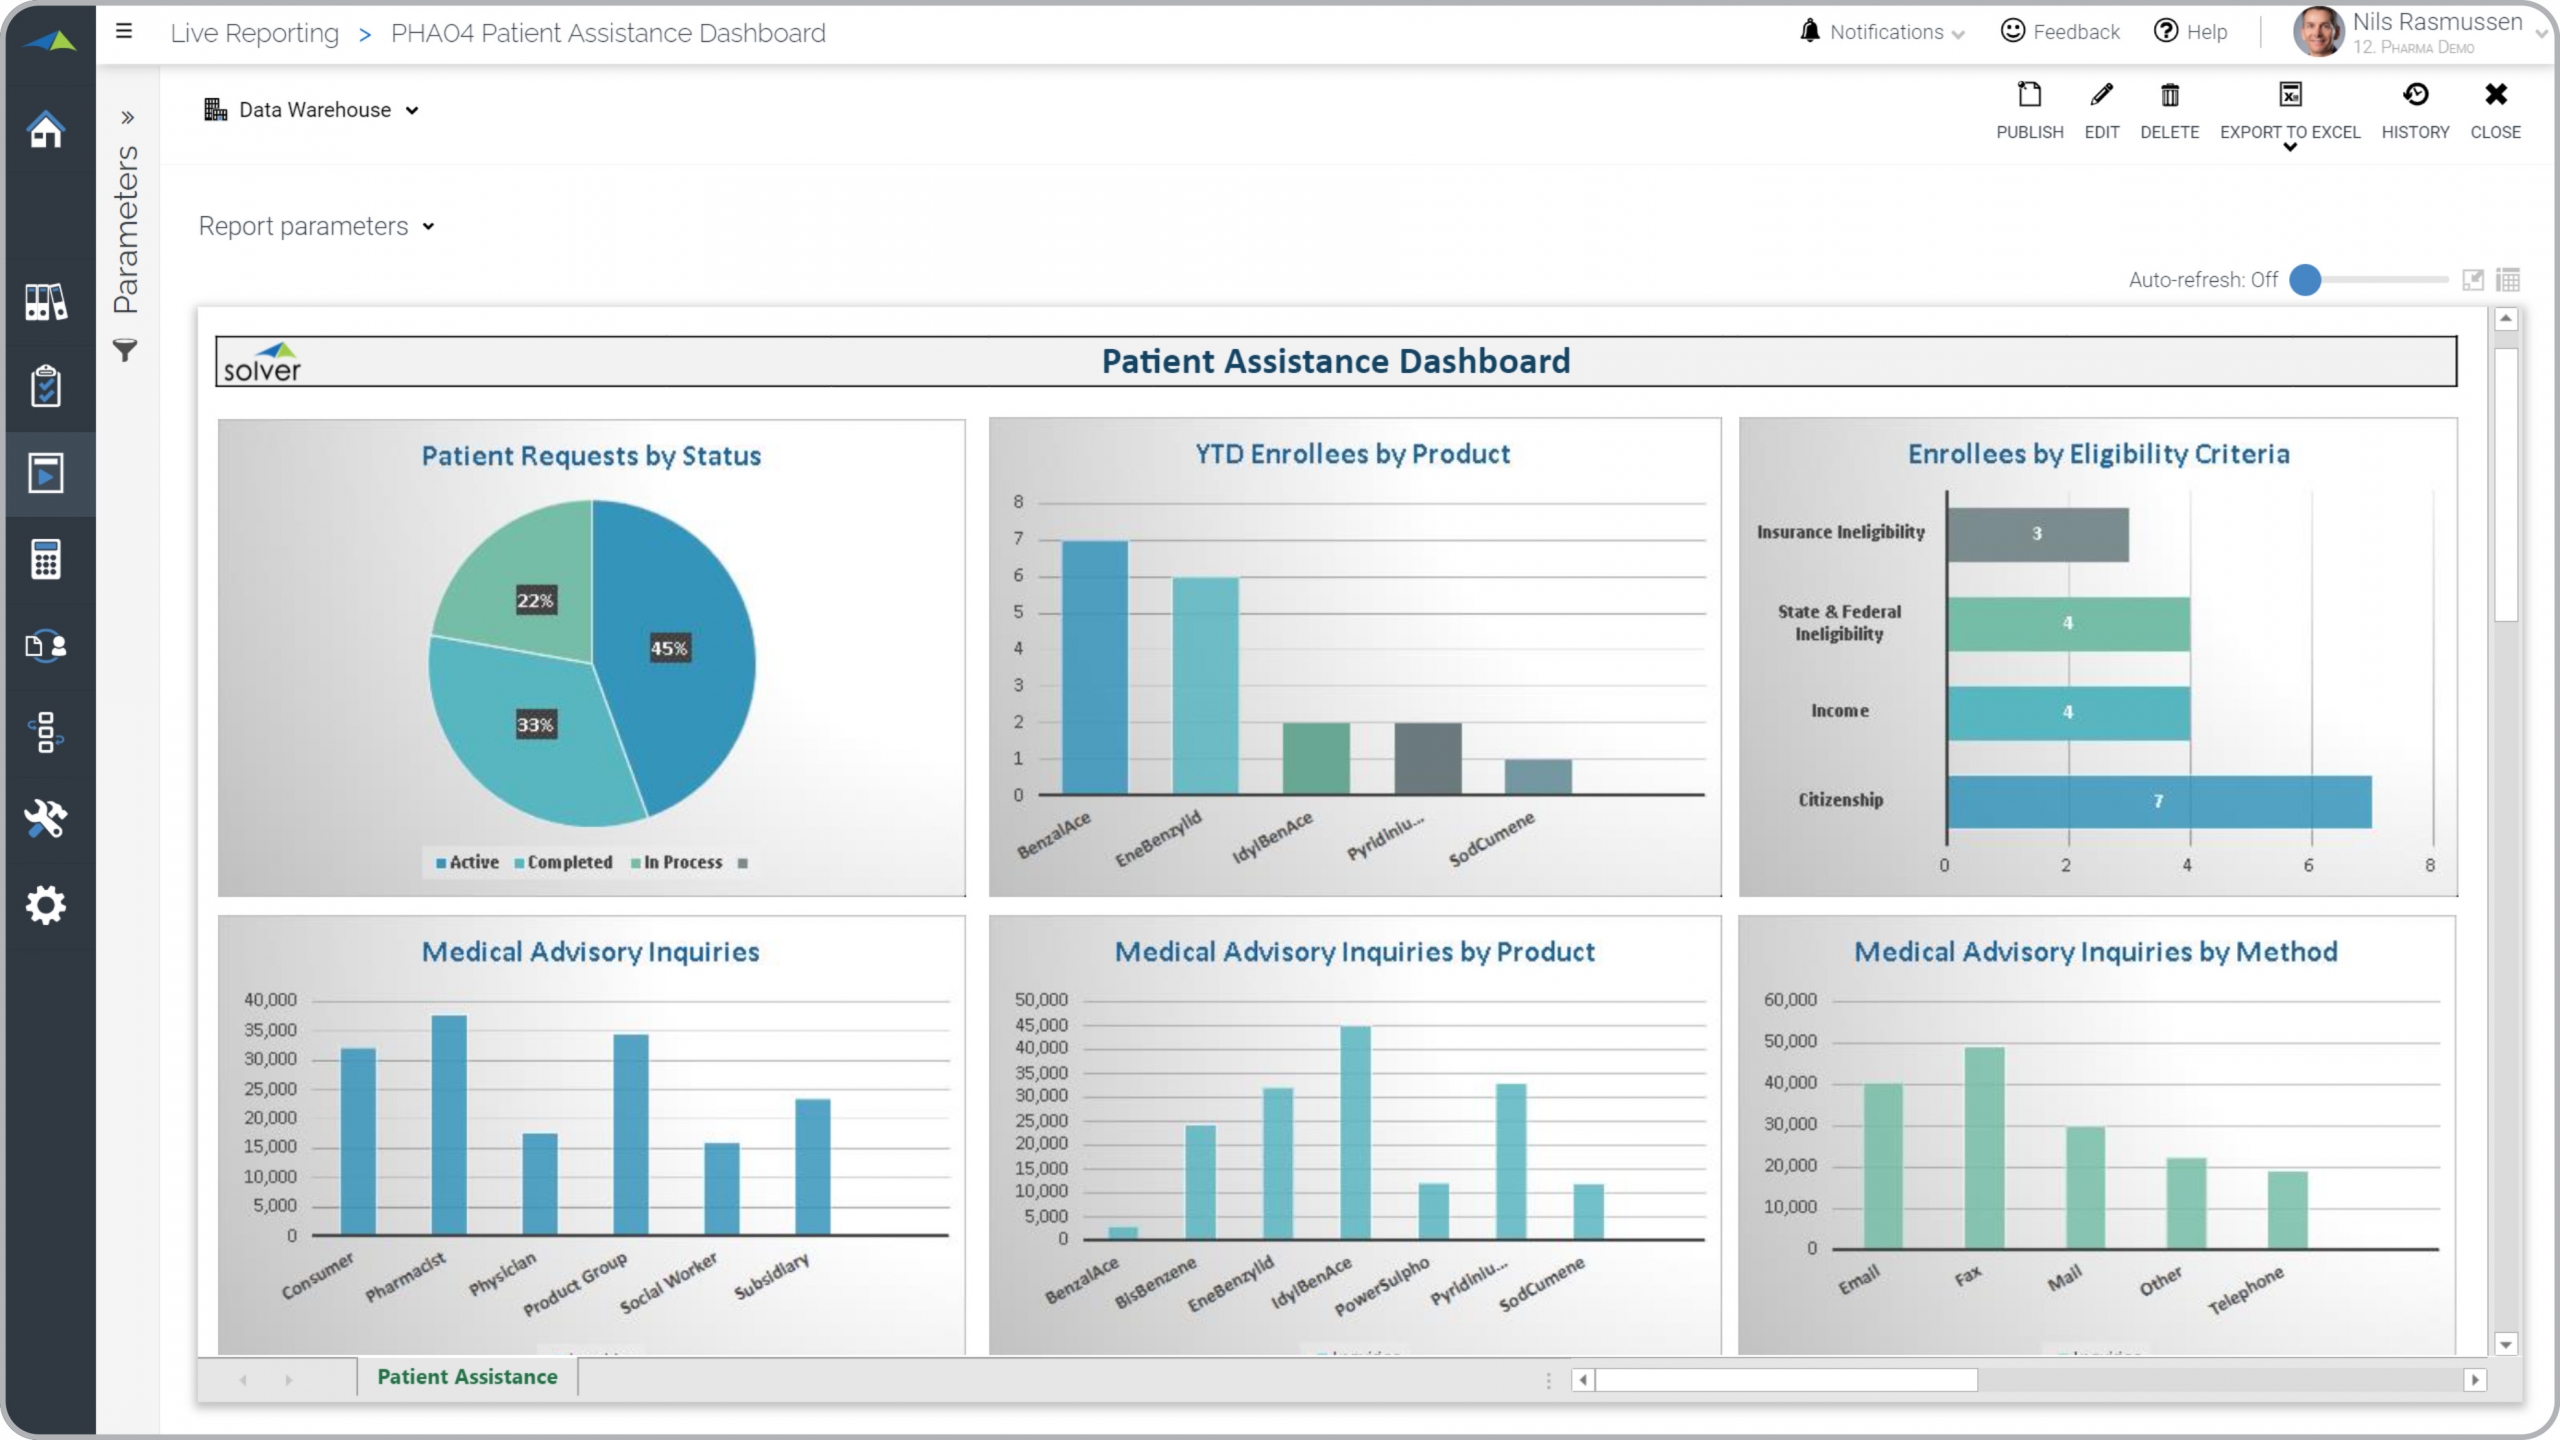
Pharma – Patient Assistance Dashboard
Drug patient analysis including by request status, enrollment and eligibility.
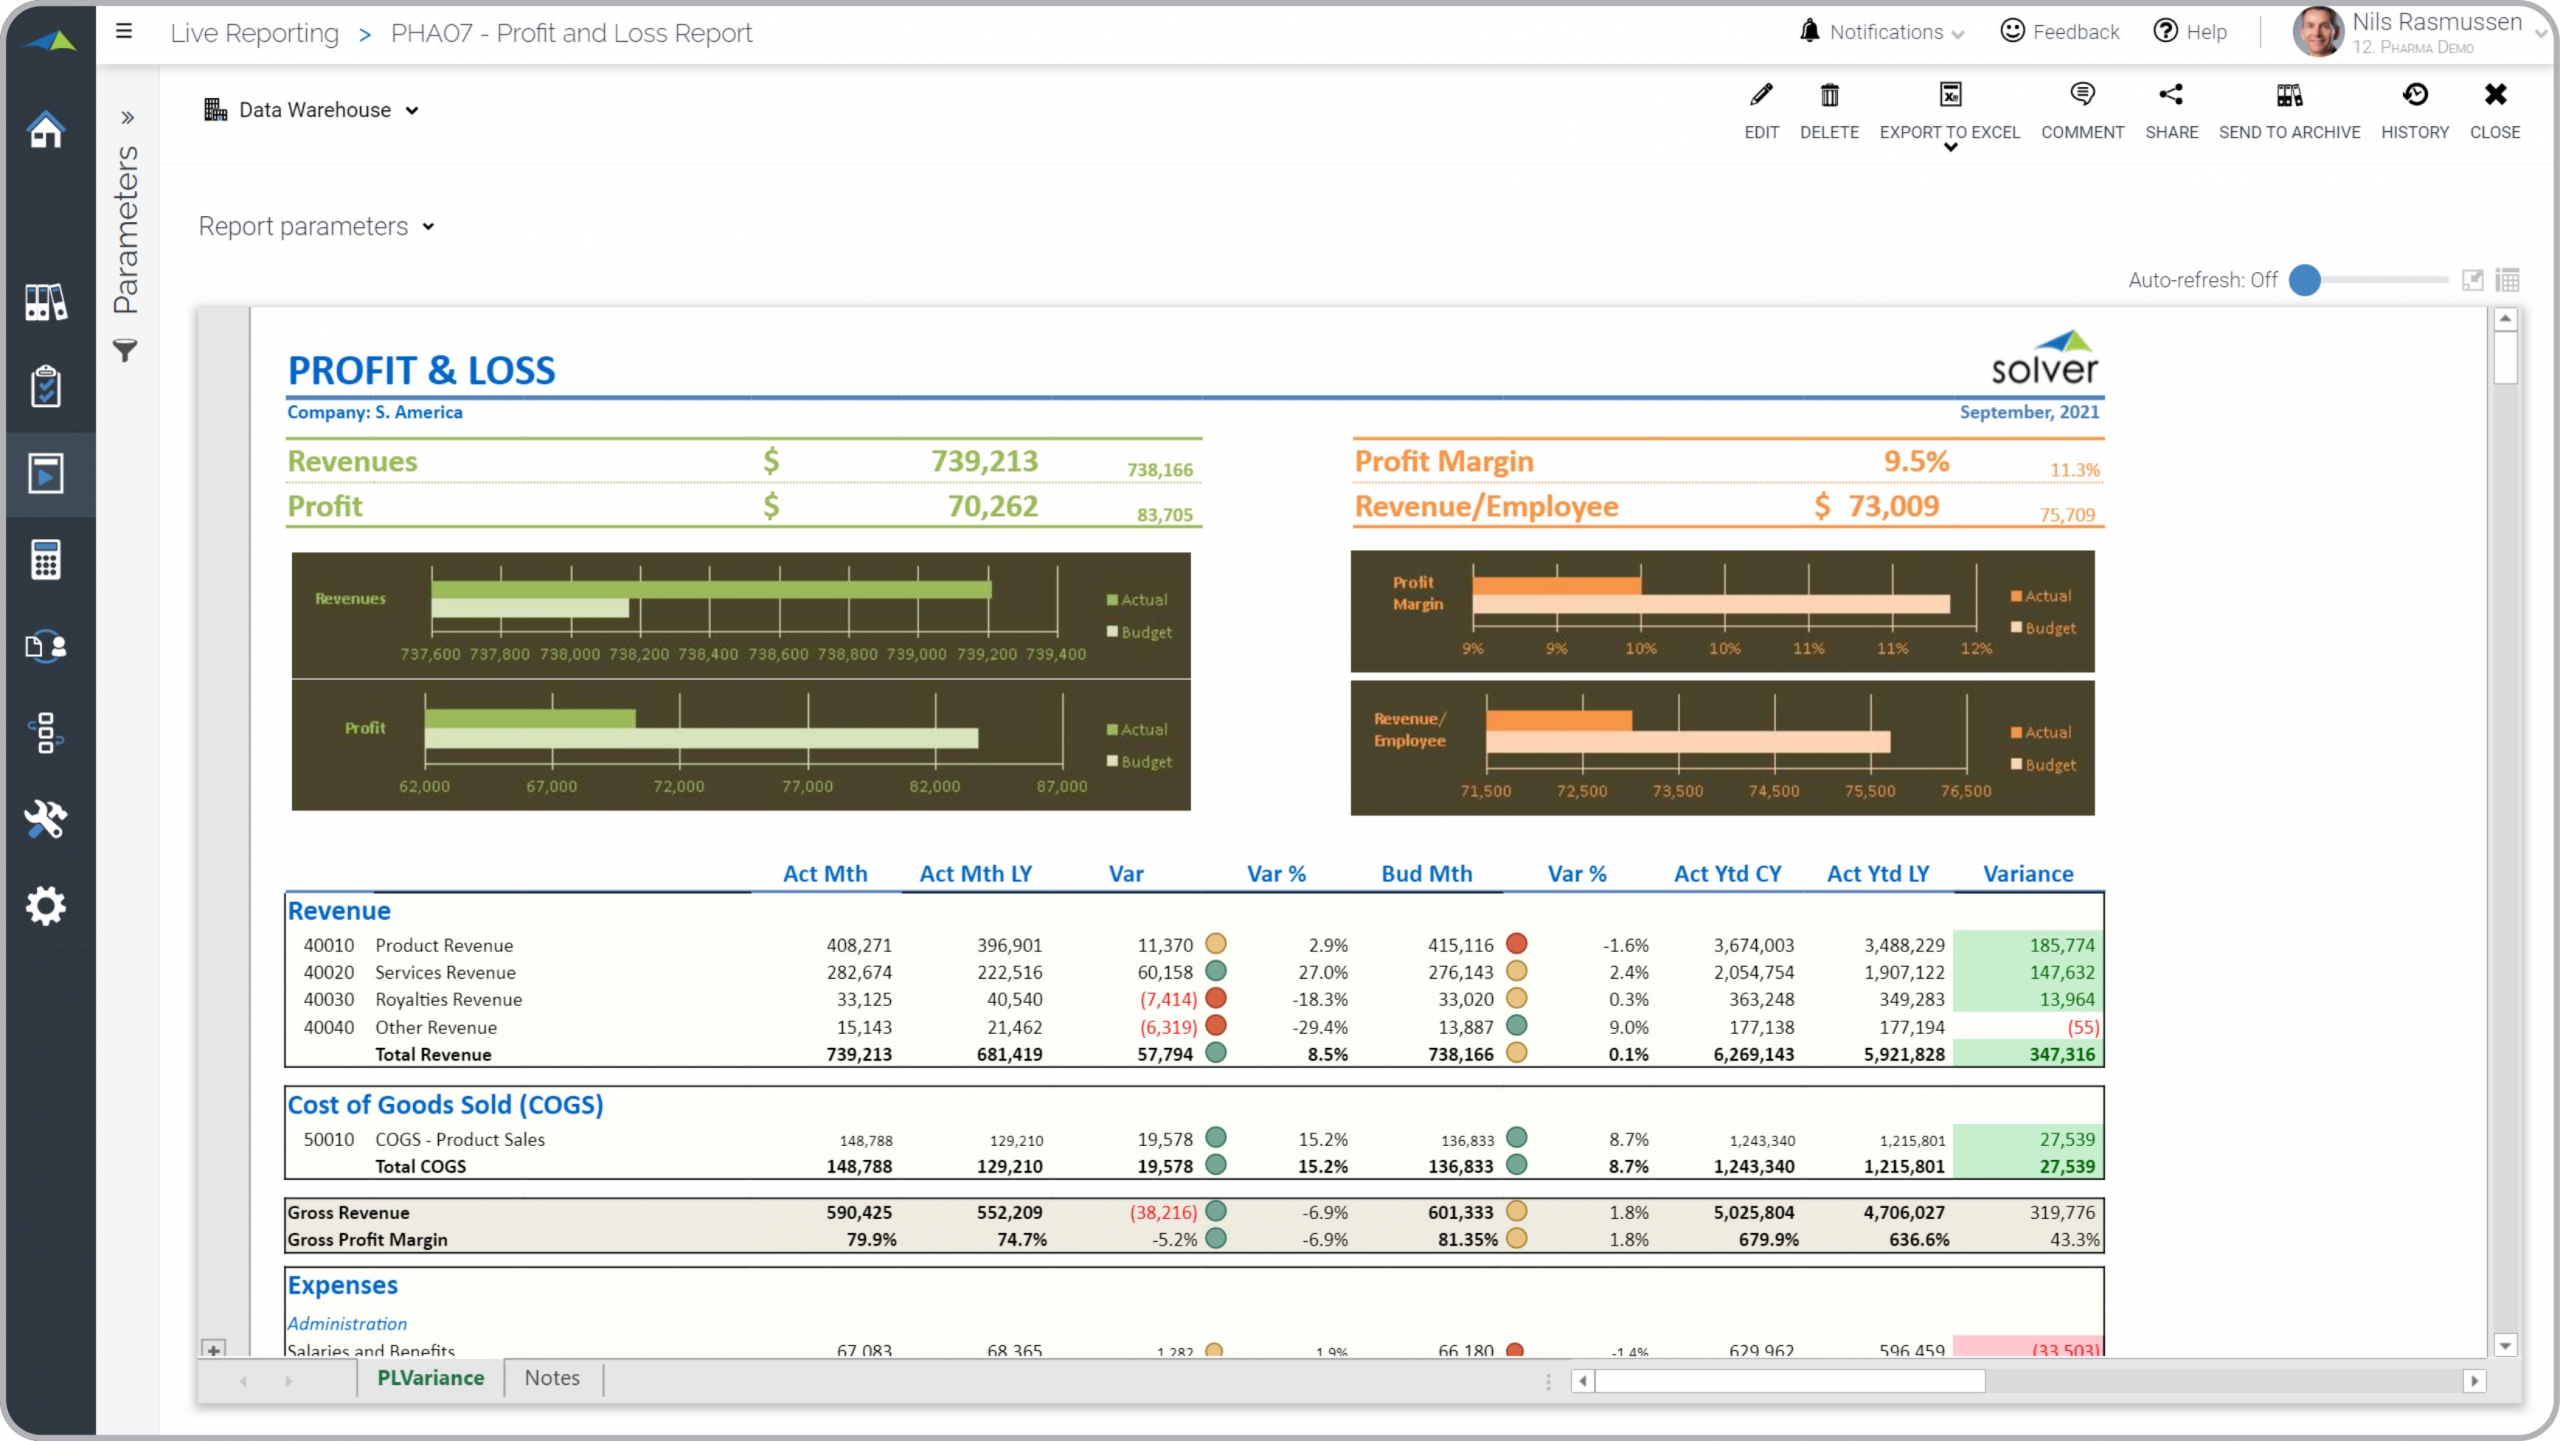
Pharma – Profit & Loss Report
Analytical Profit & Loss report with charts and traffic lights for easier analysis.
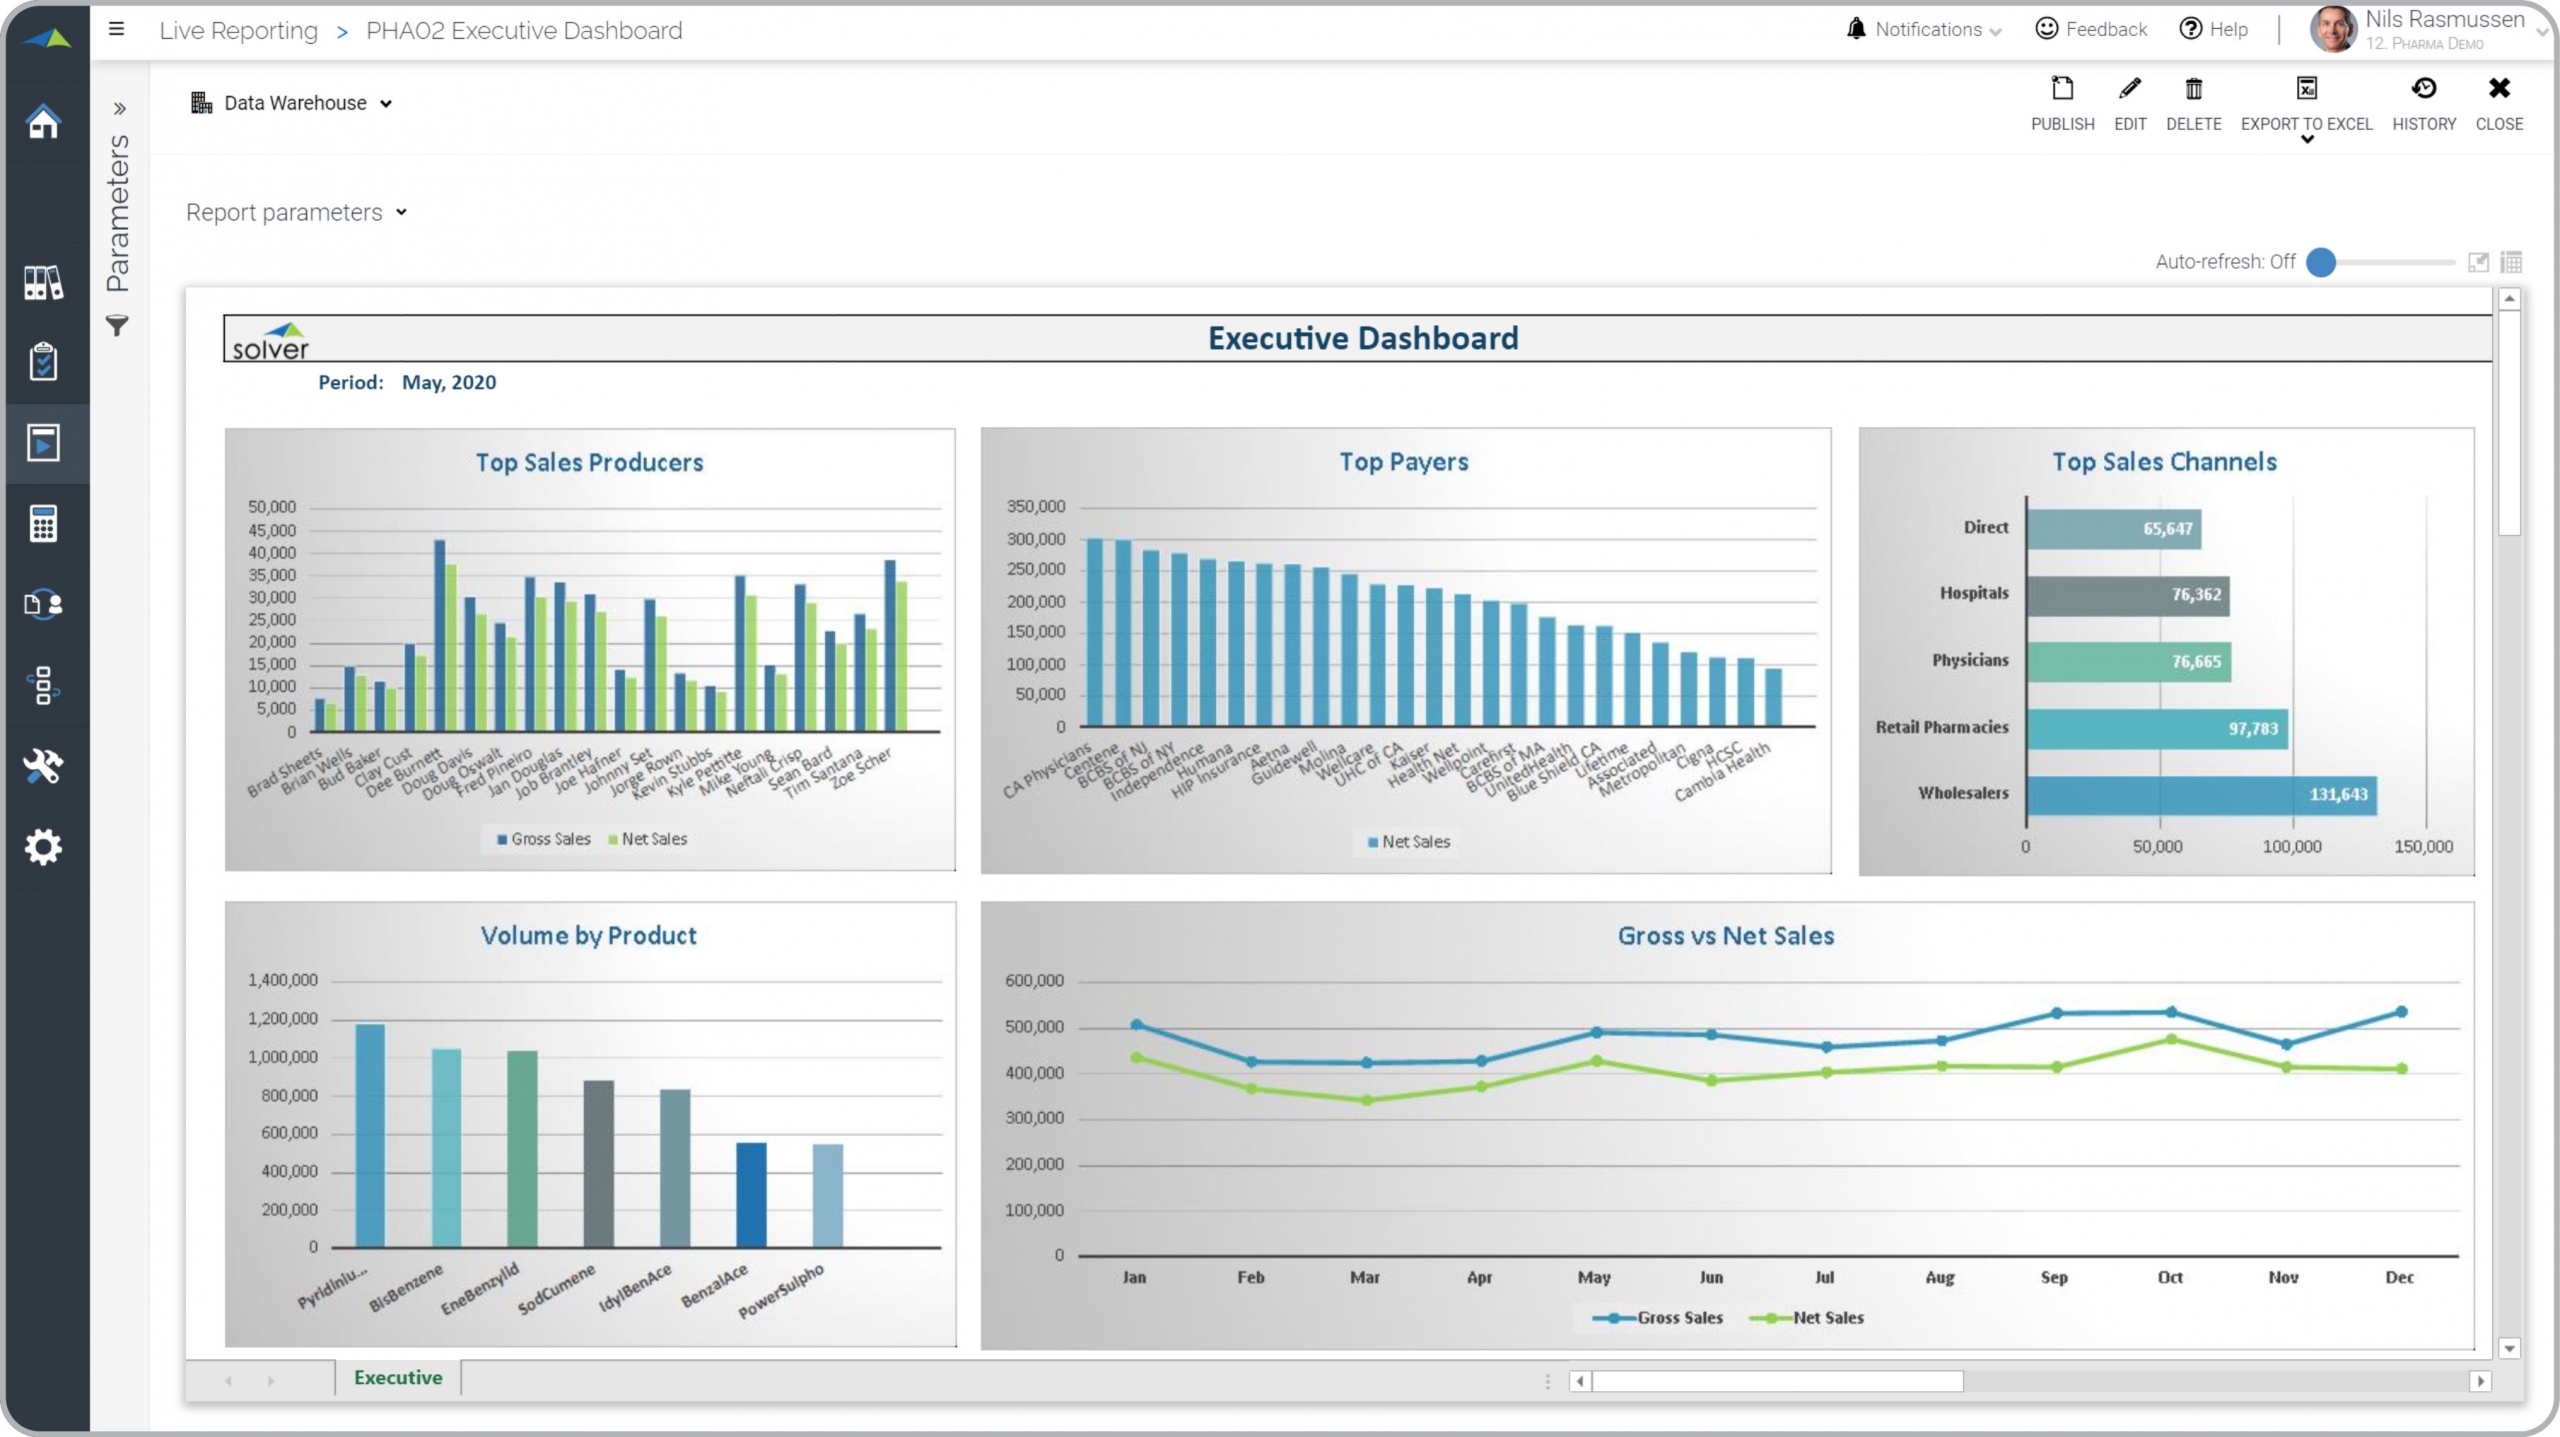
Pharma – Executive Dashboard
Sales figures and KPI trends and comparisons for pharma products, producers and payers.
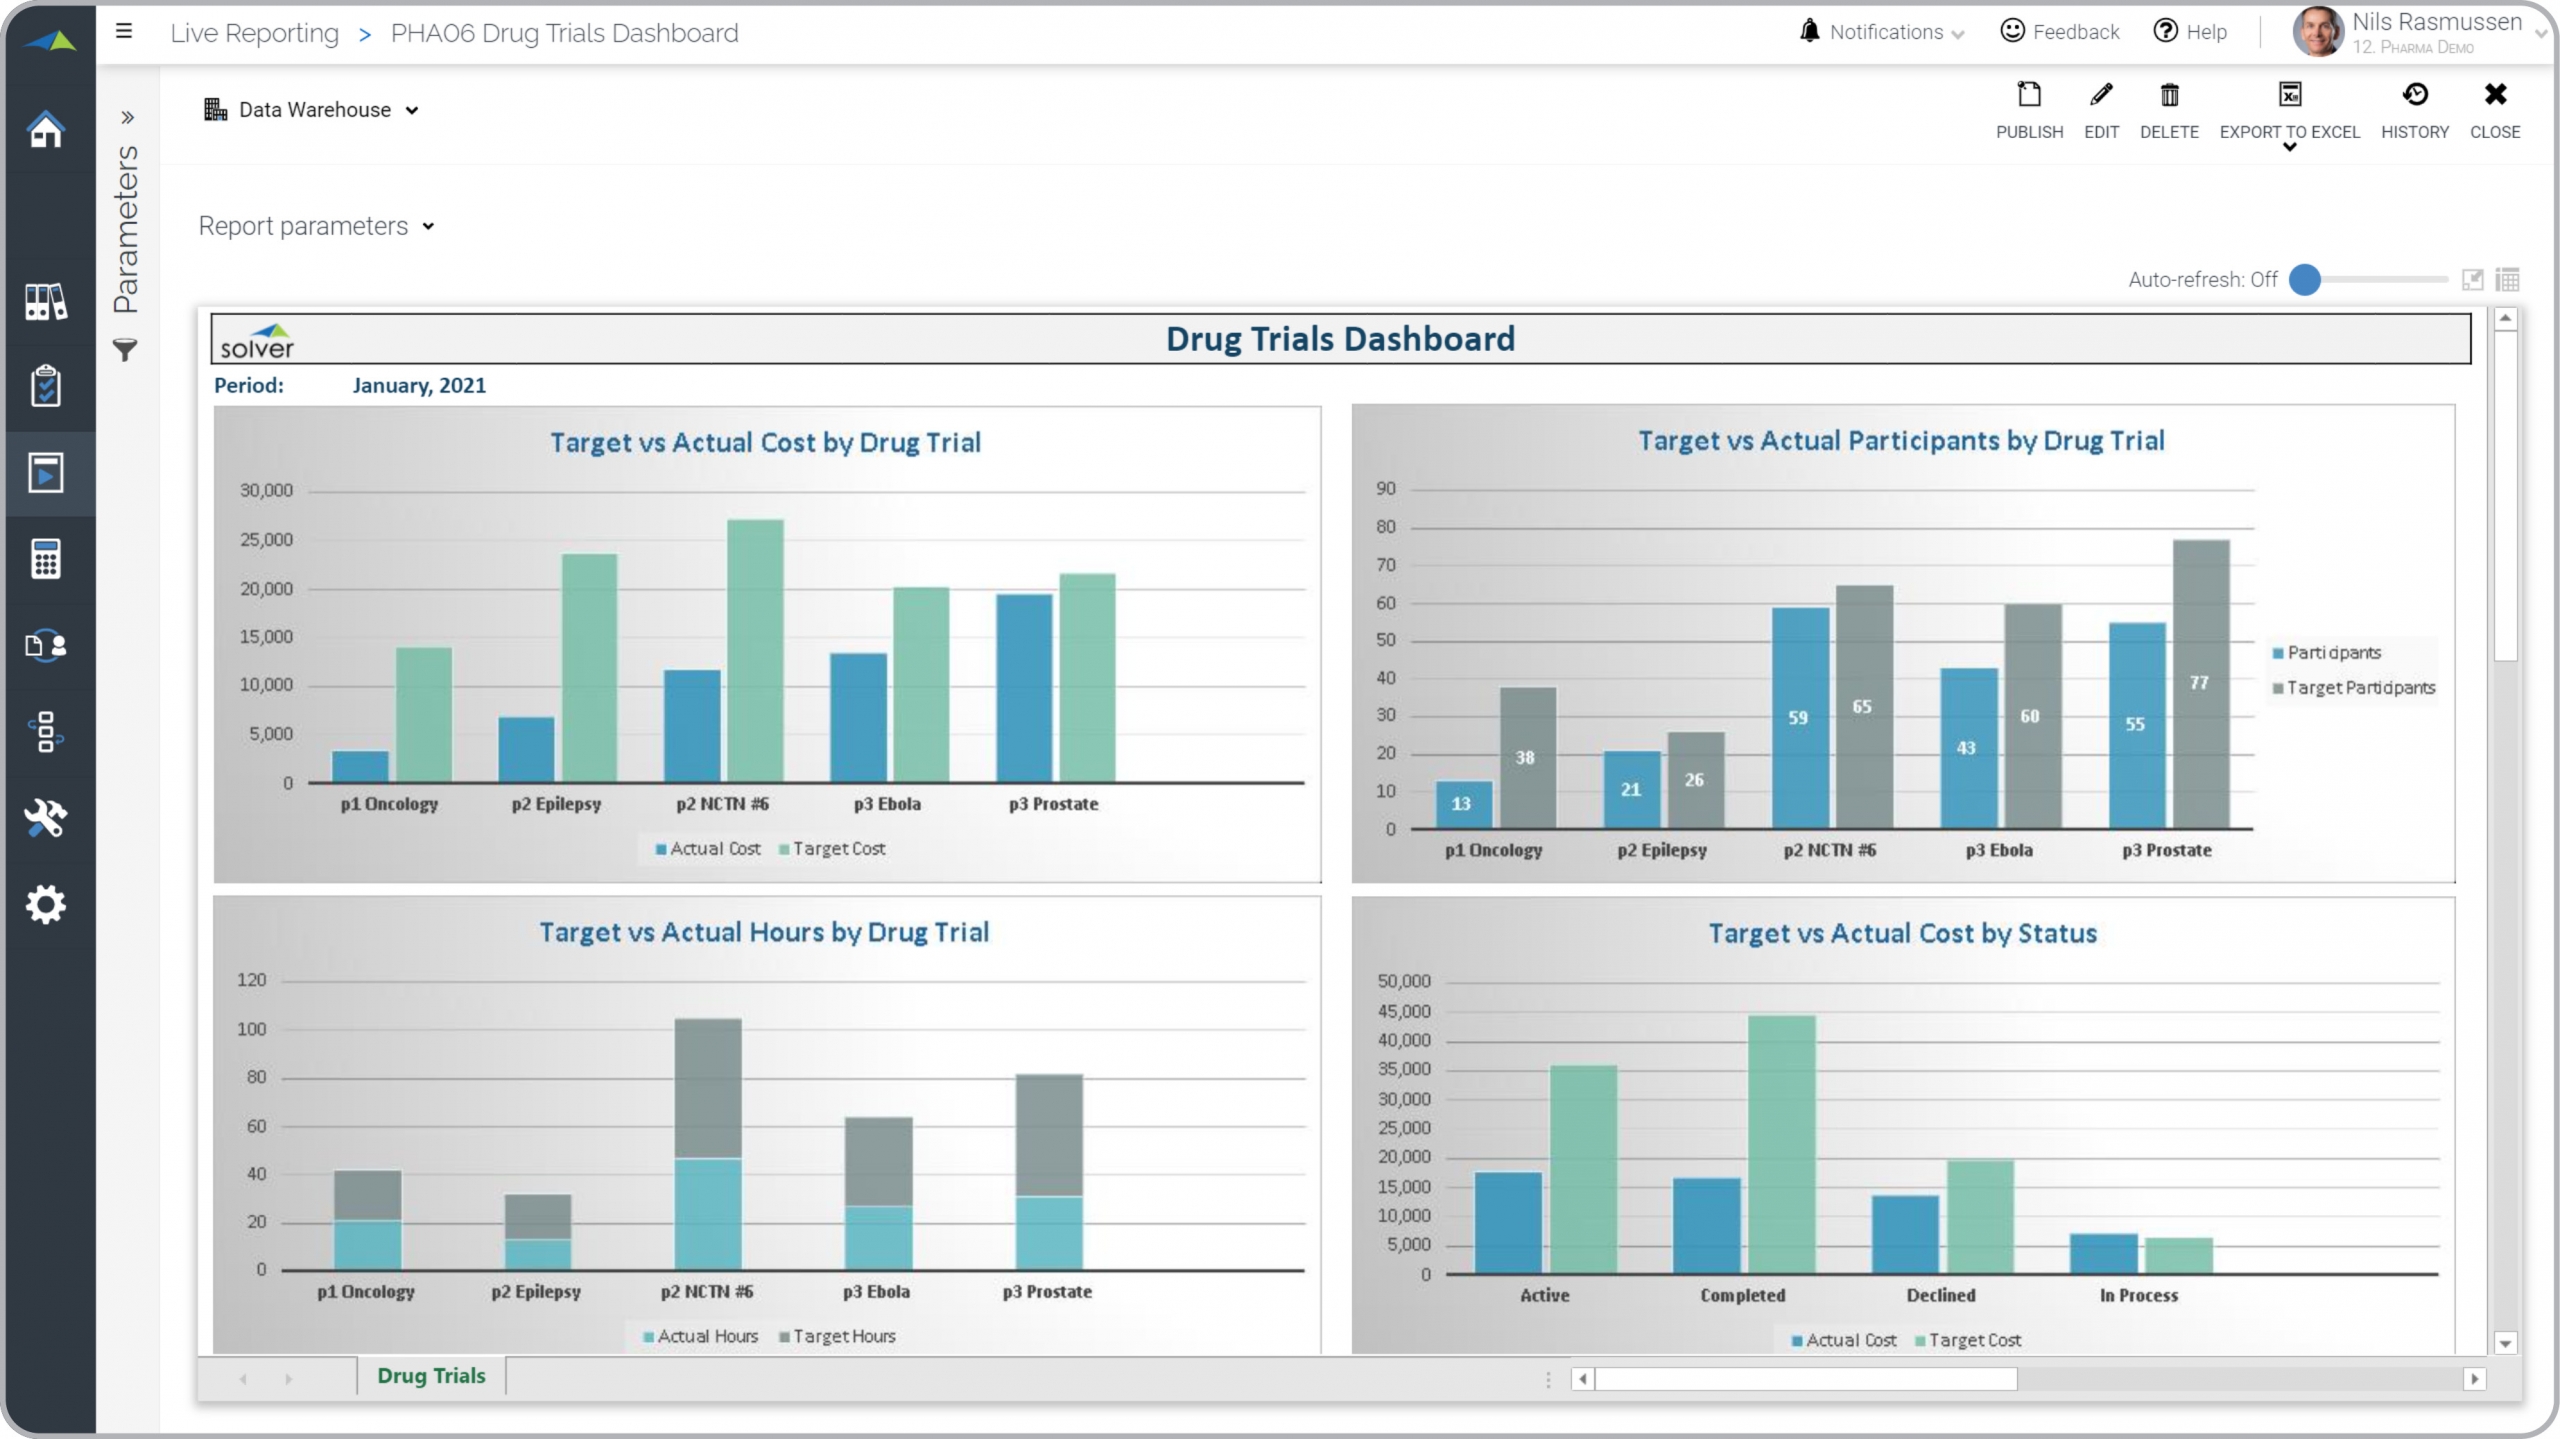
Pharma – Drug Trials Dashboard
KPI analysis for drug trial actual vs budgeted costs, participants, hours and status.
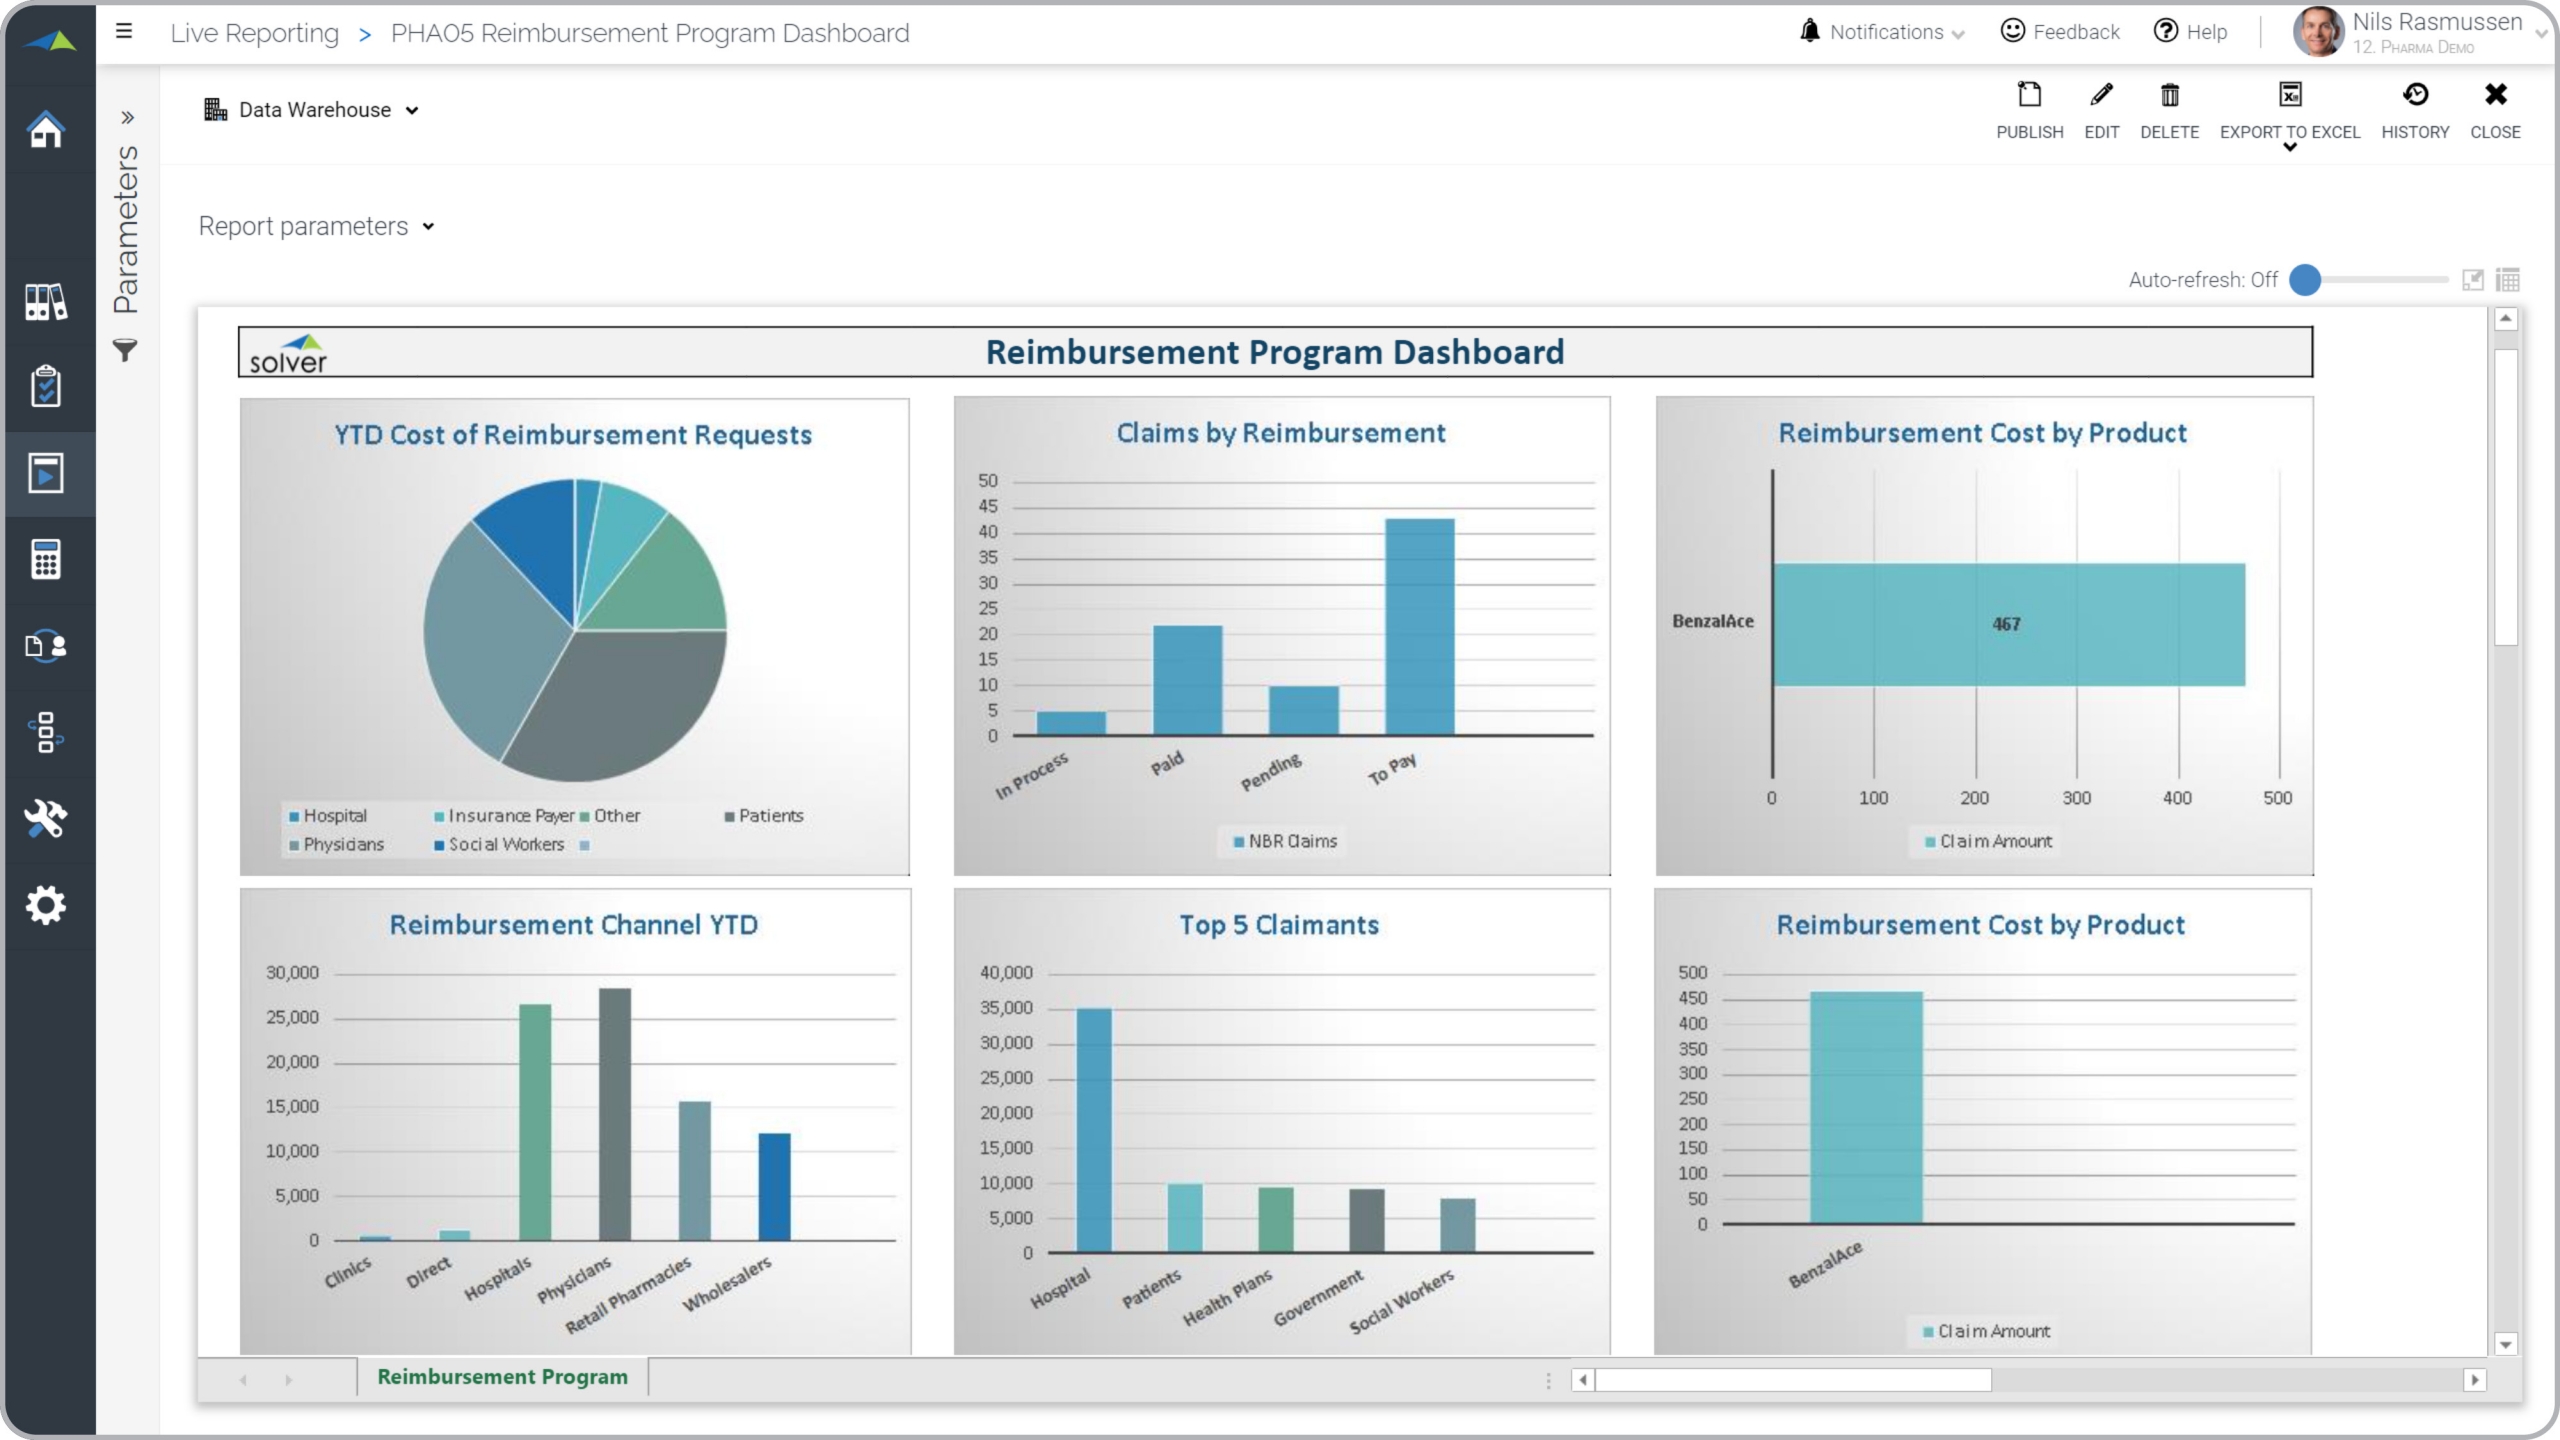
Pharma – Reimbursement Dashboard
Shows reimbursement metrics like requests, claims and channel.
Pharma – Drug Project Cost Forecast
Planning input for to enter forecasted (or budgeted) expenses per drug project.
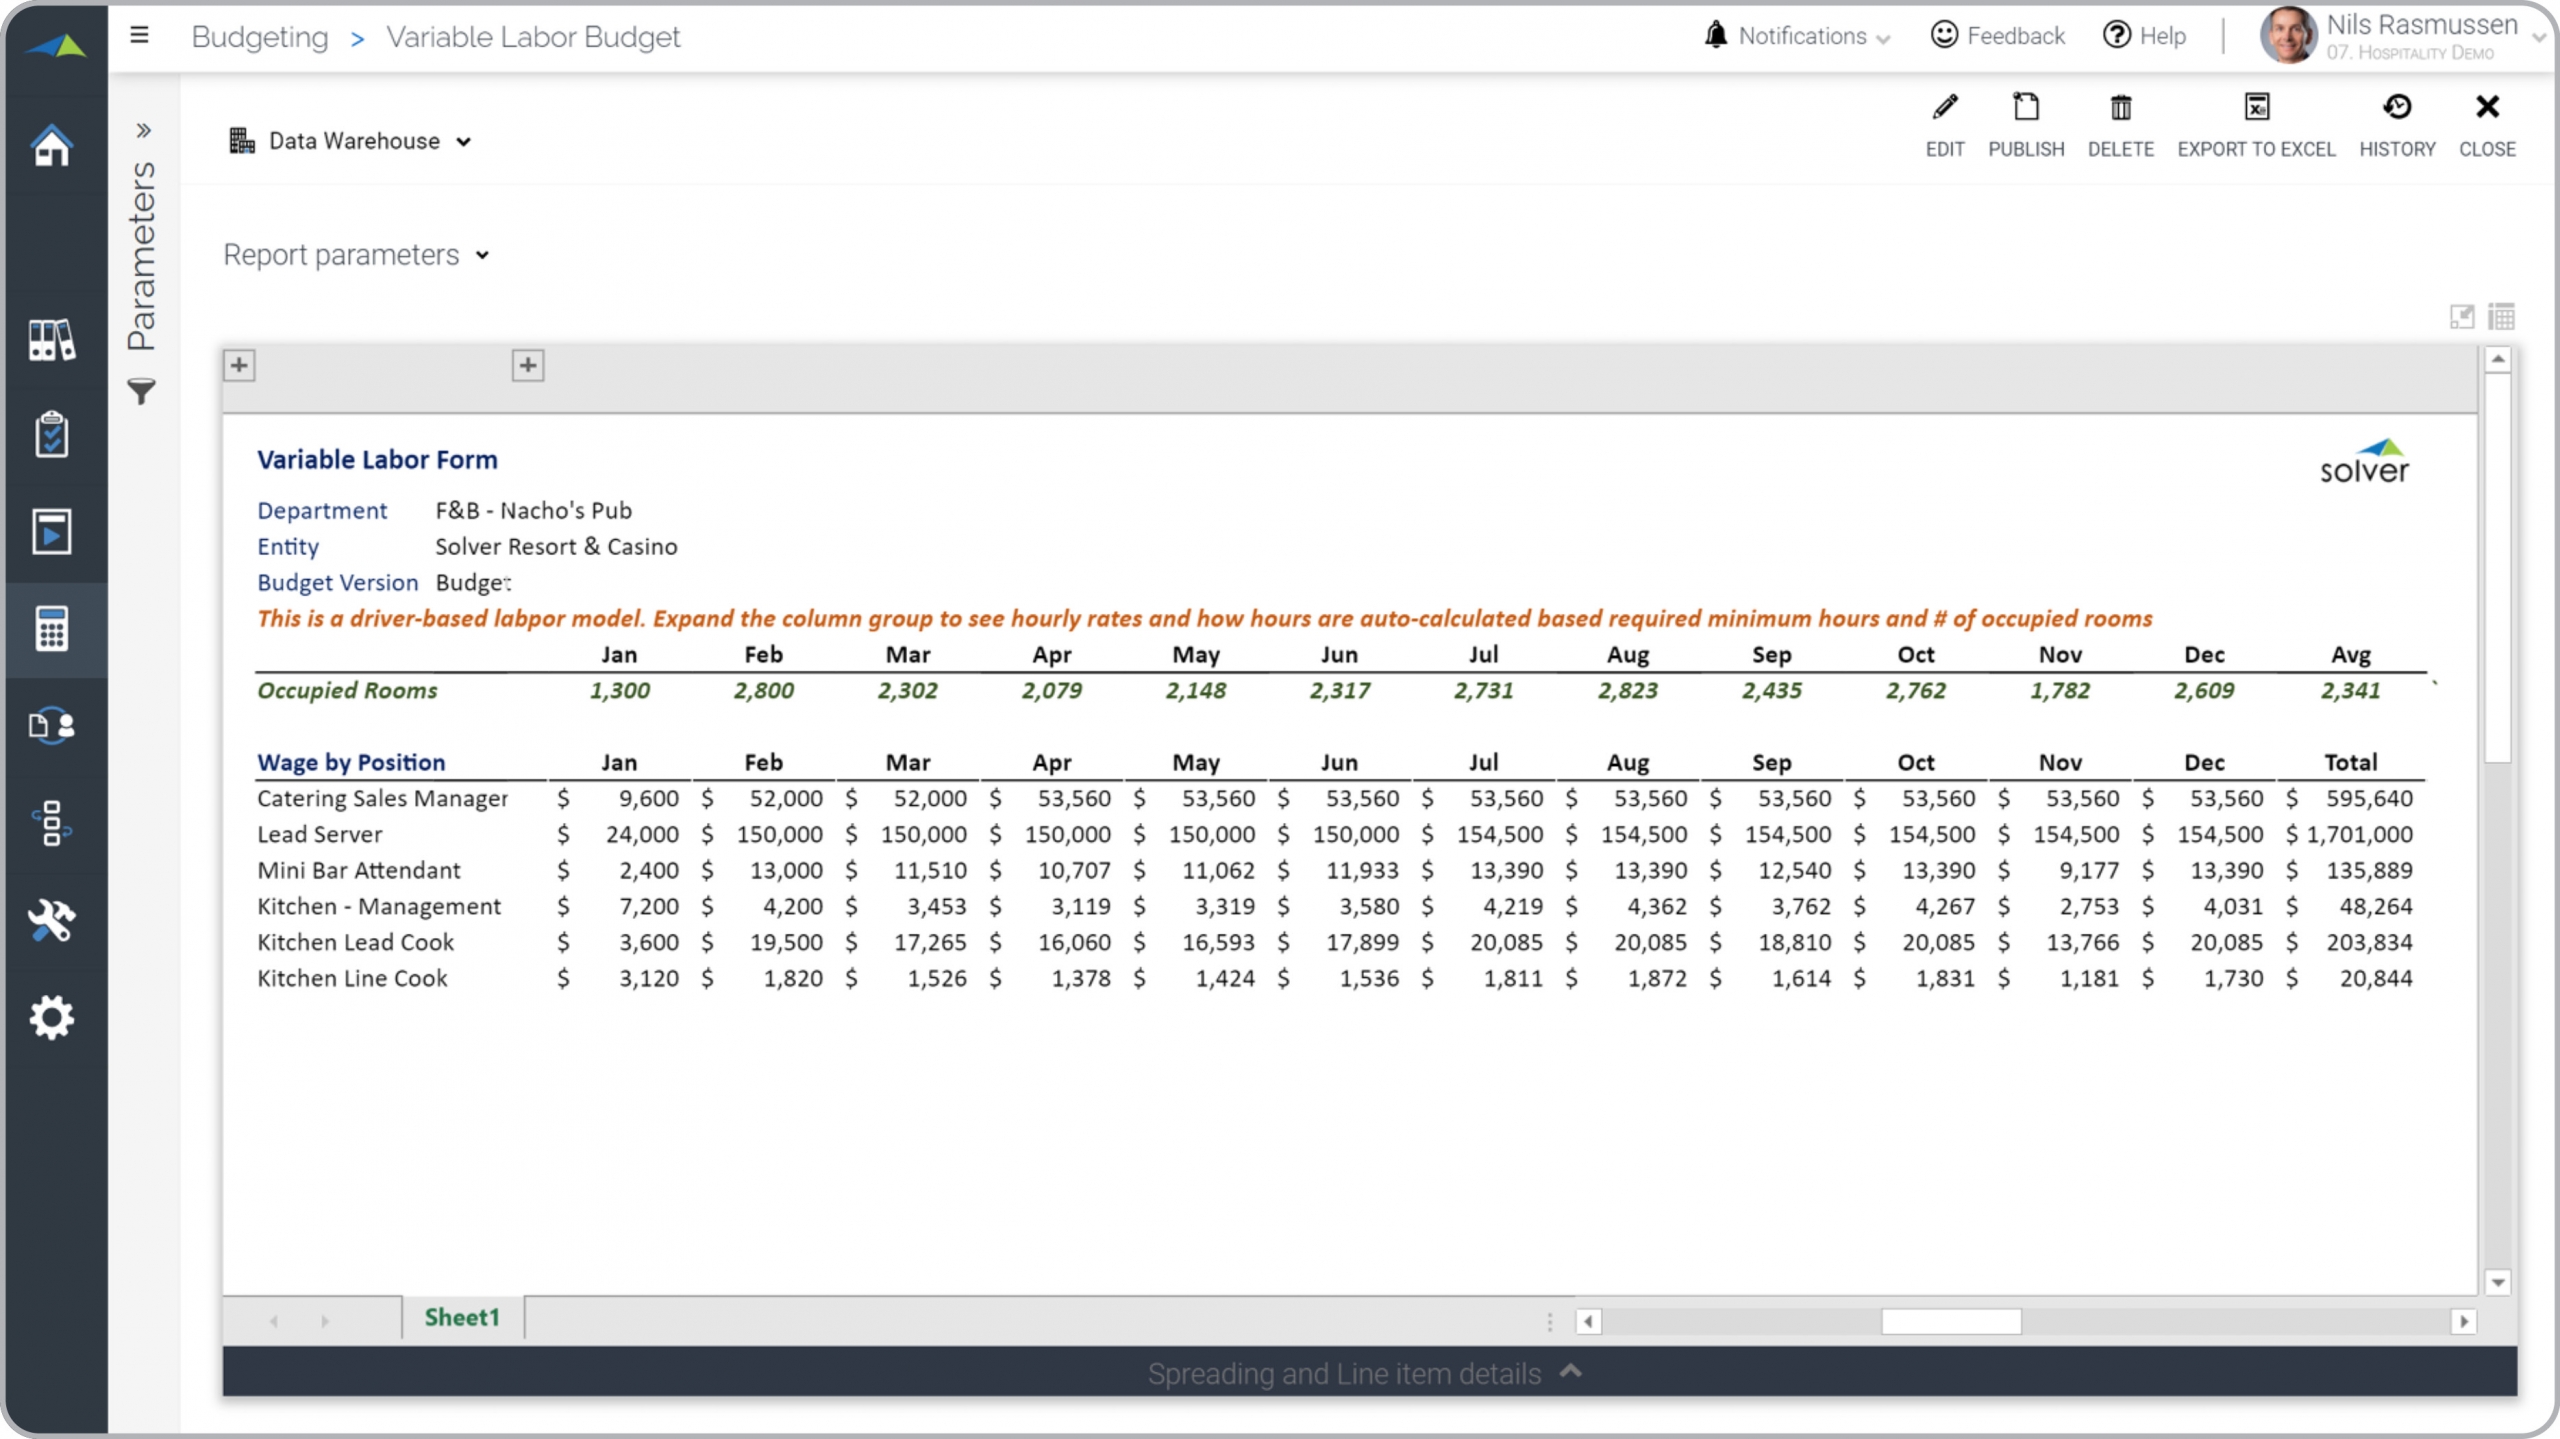
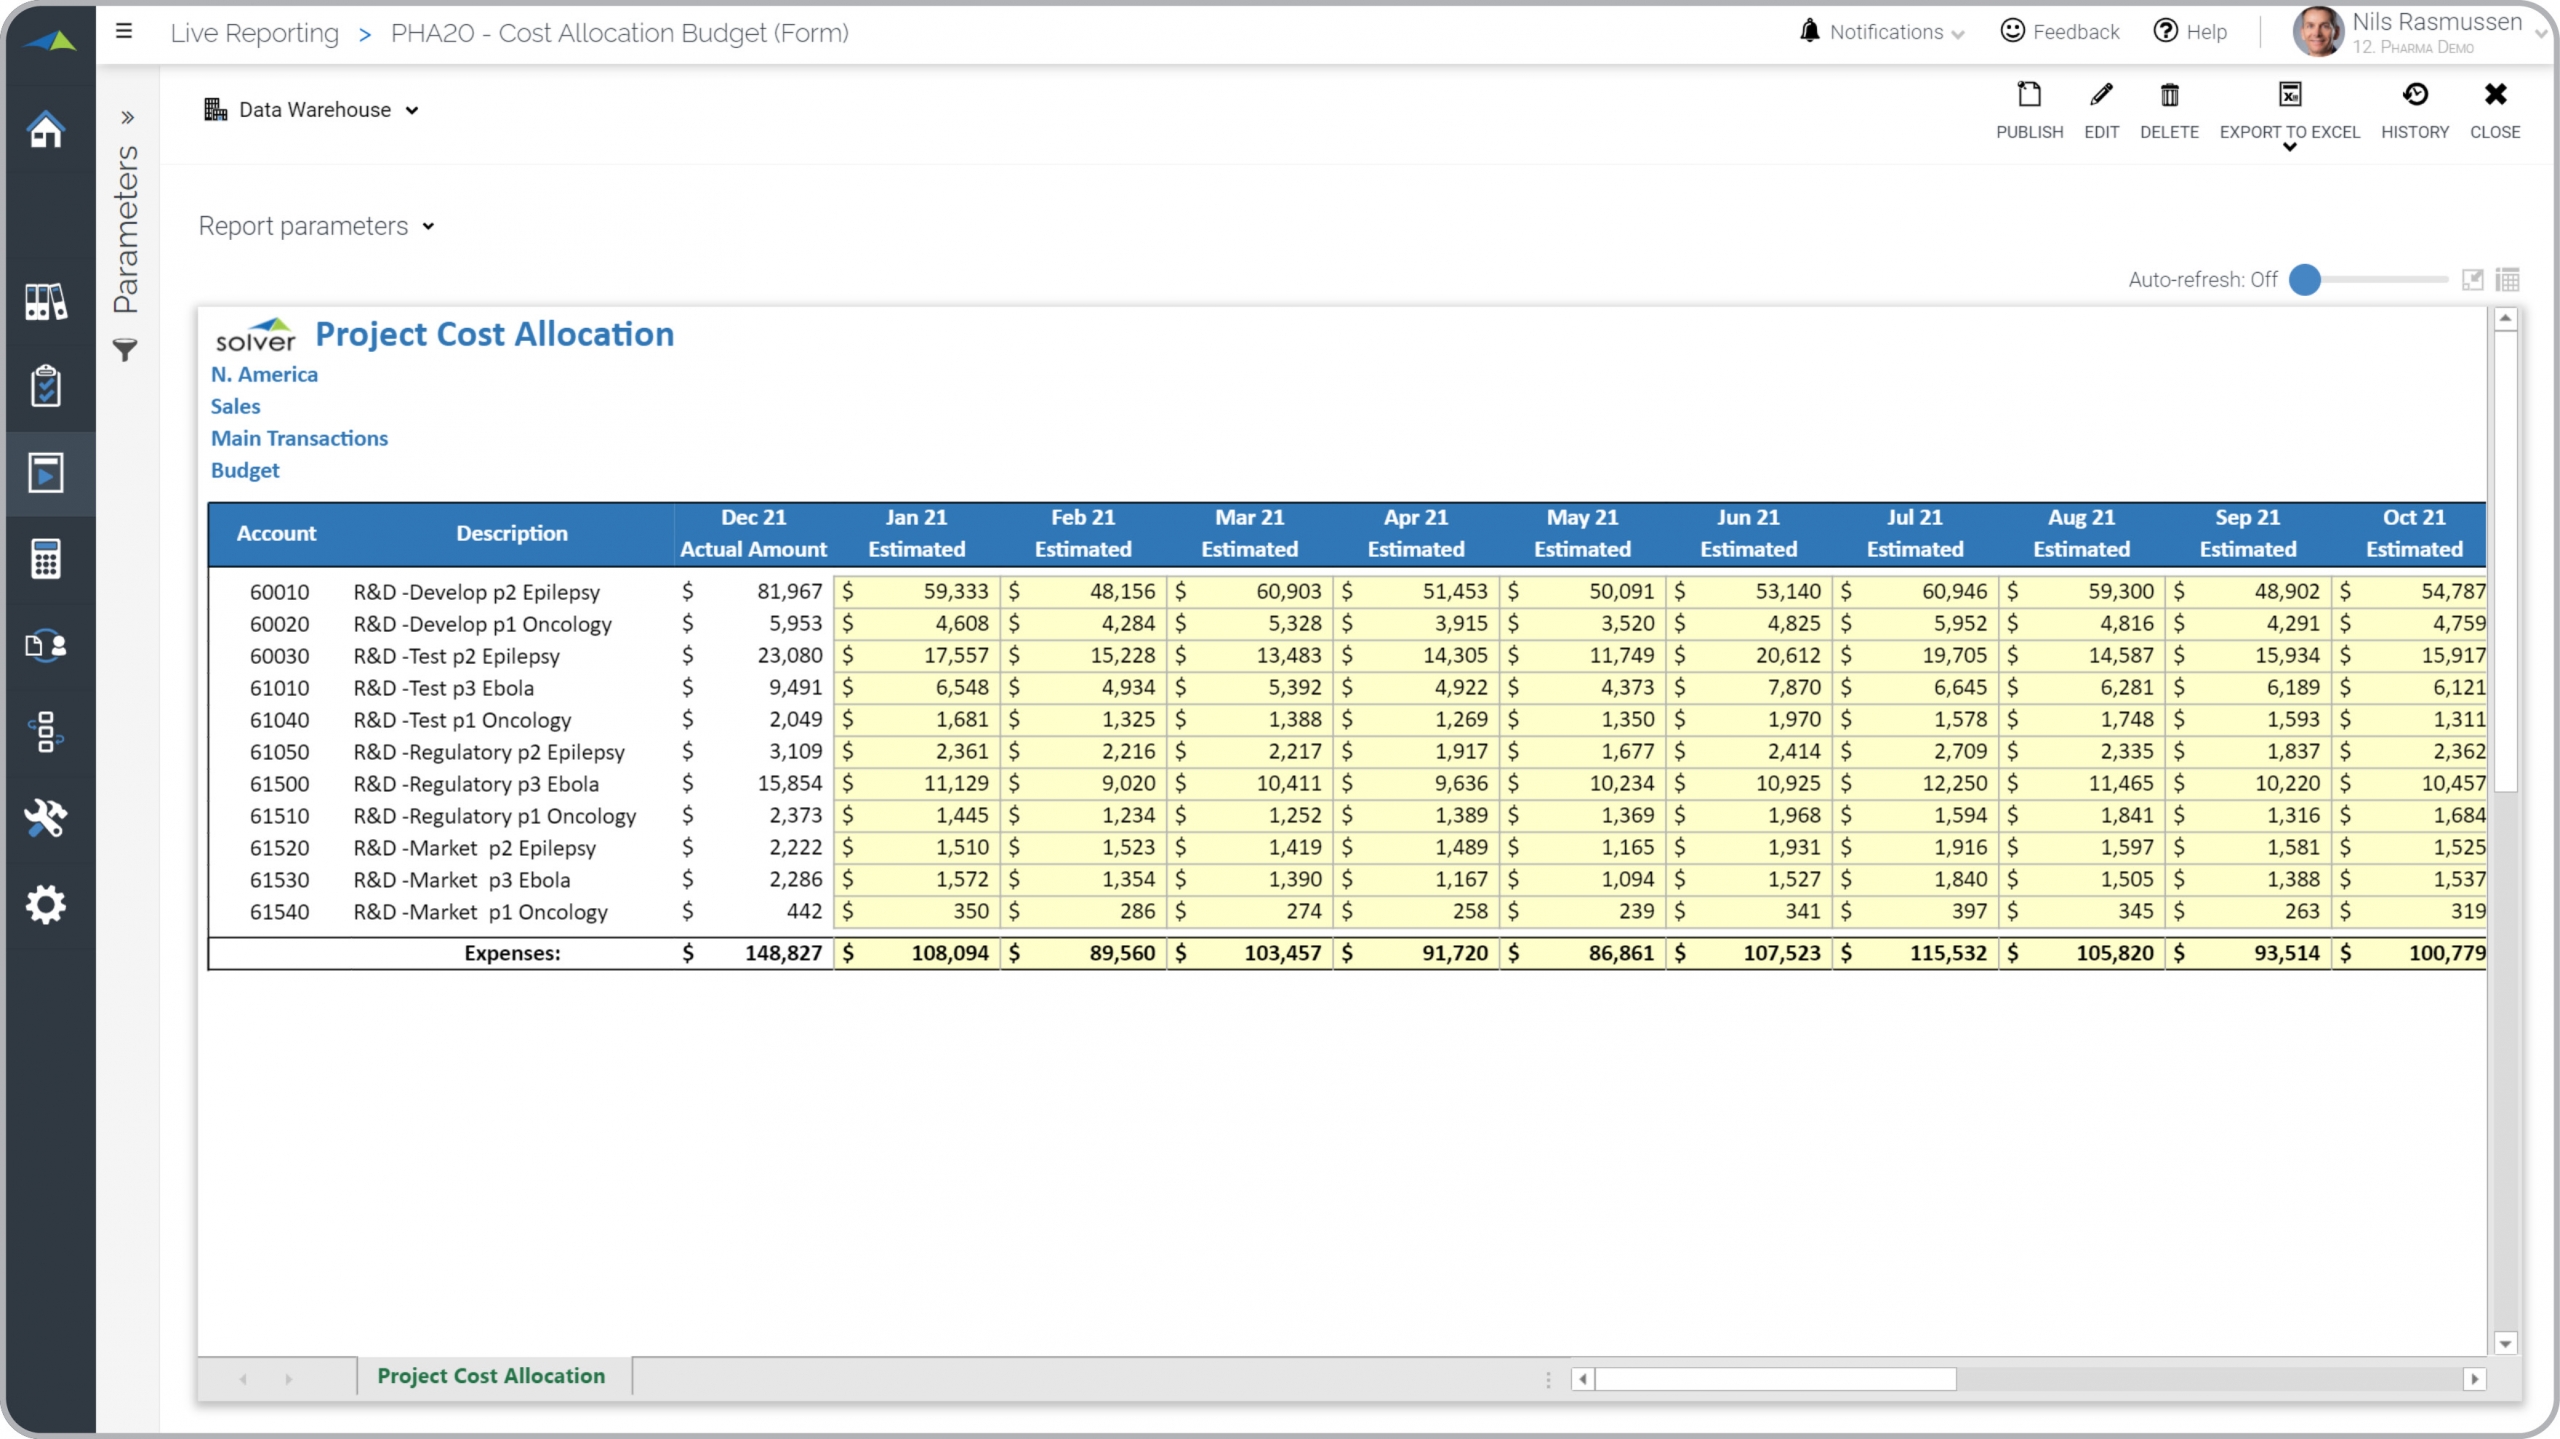
Hospitality – Variable Labor Budget
Driver-based budget input form to capture the variable labor budget.
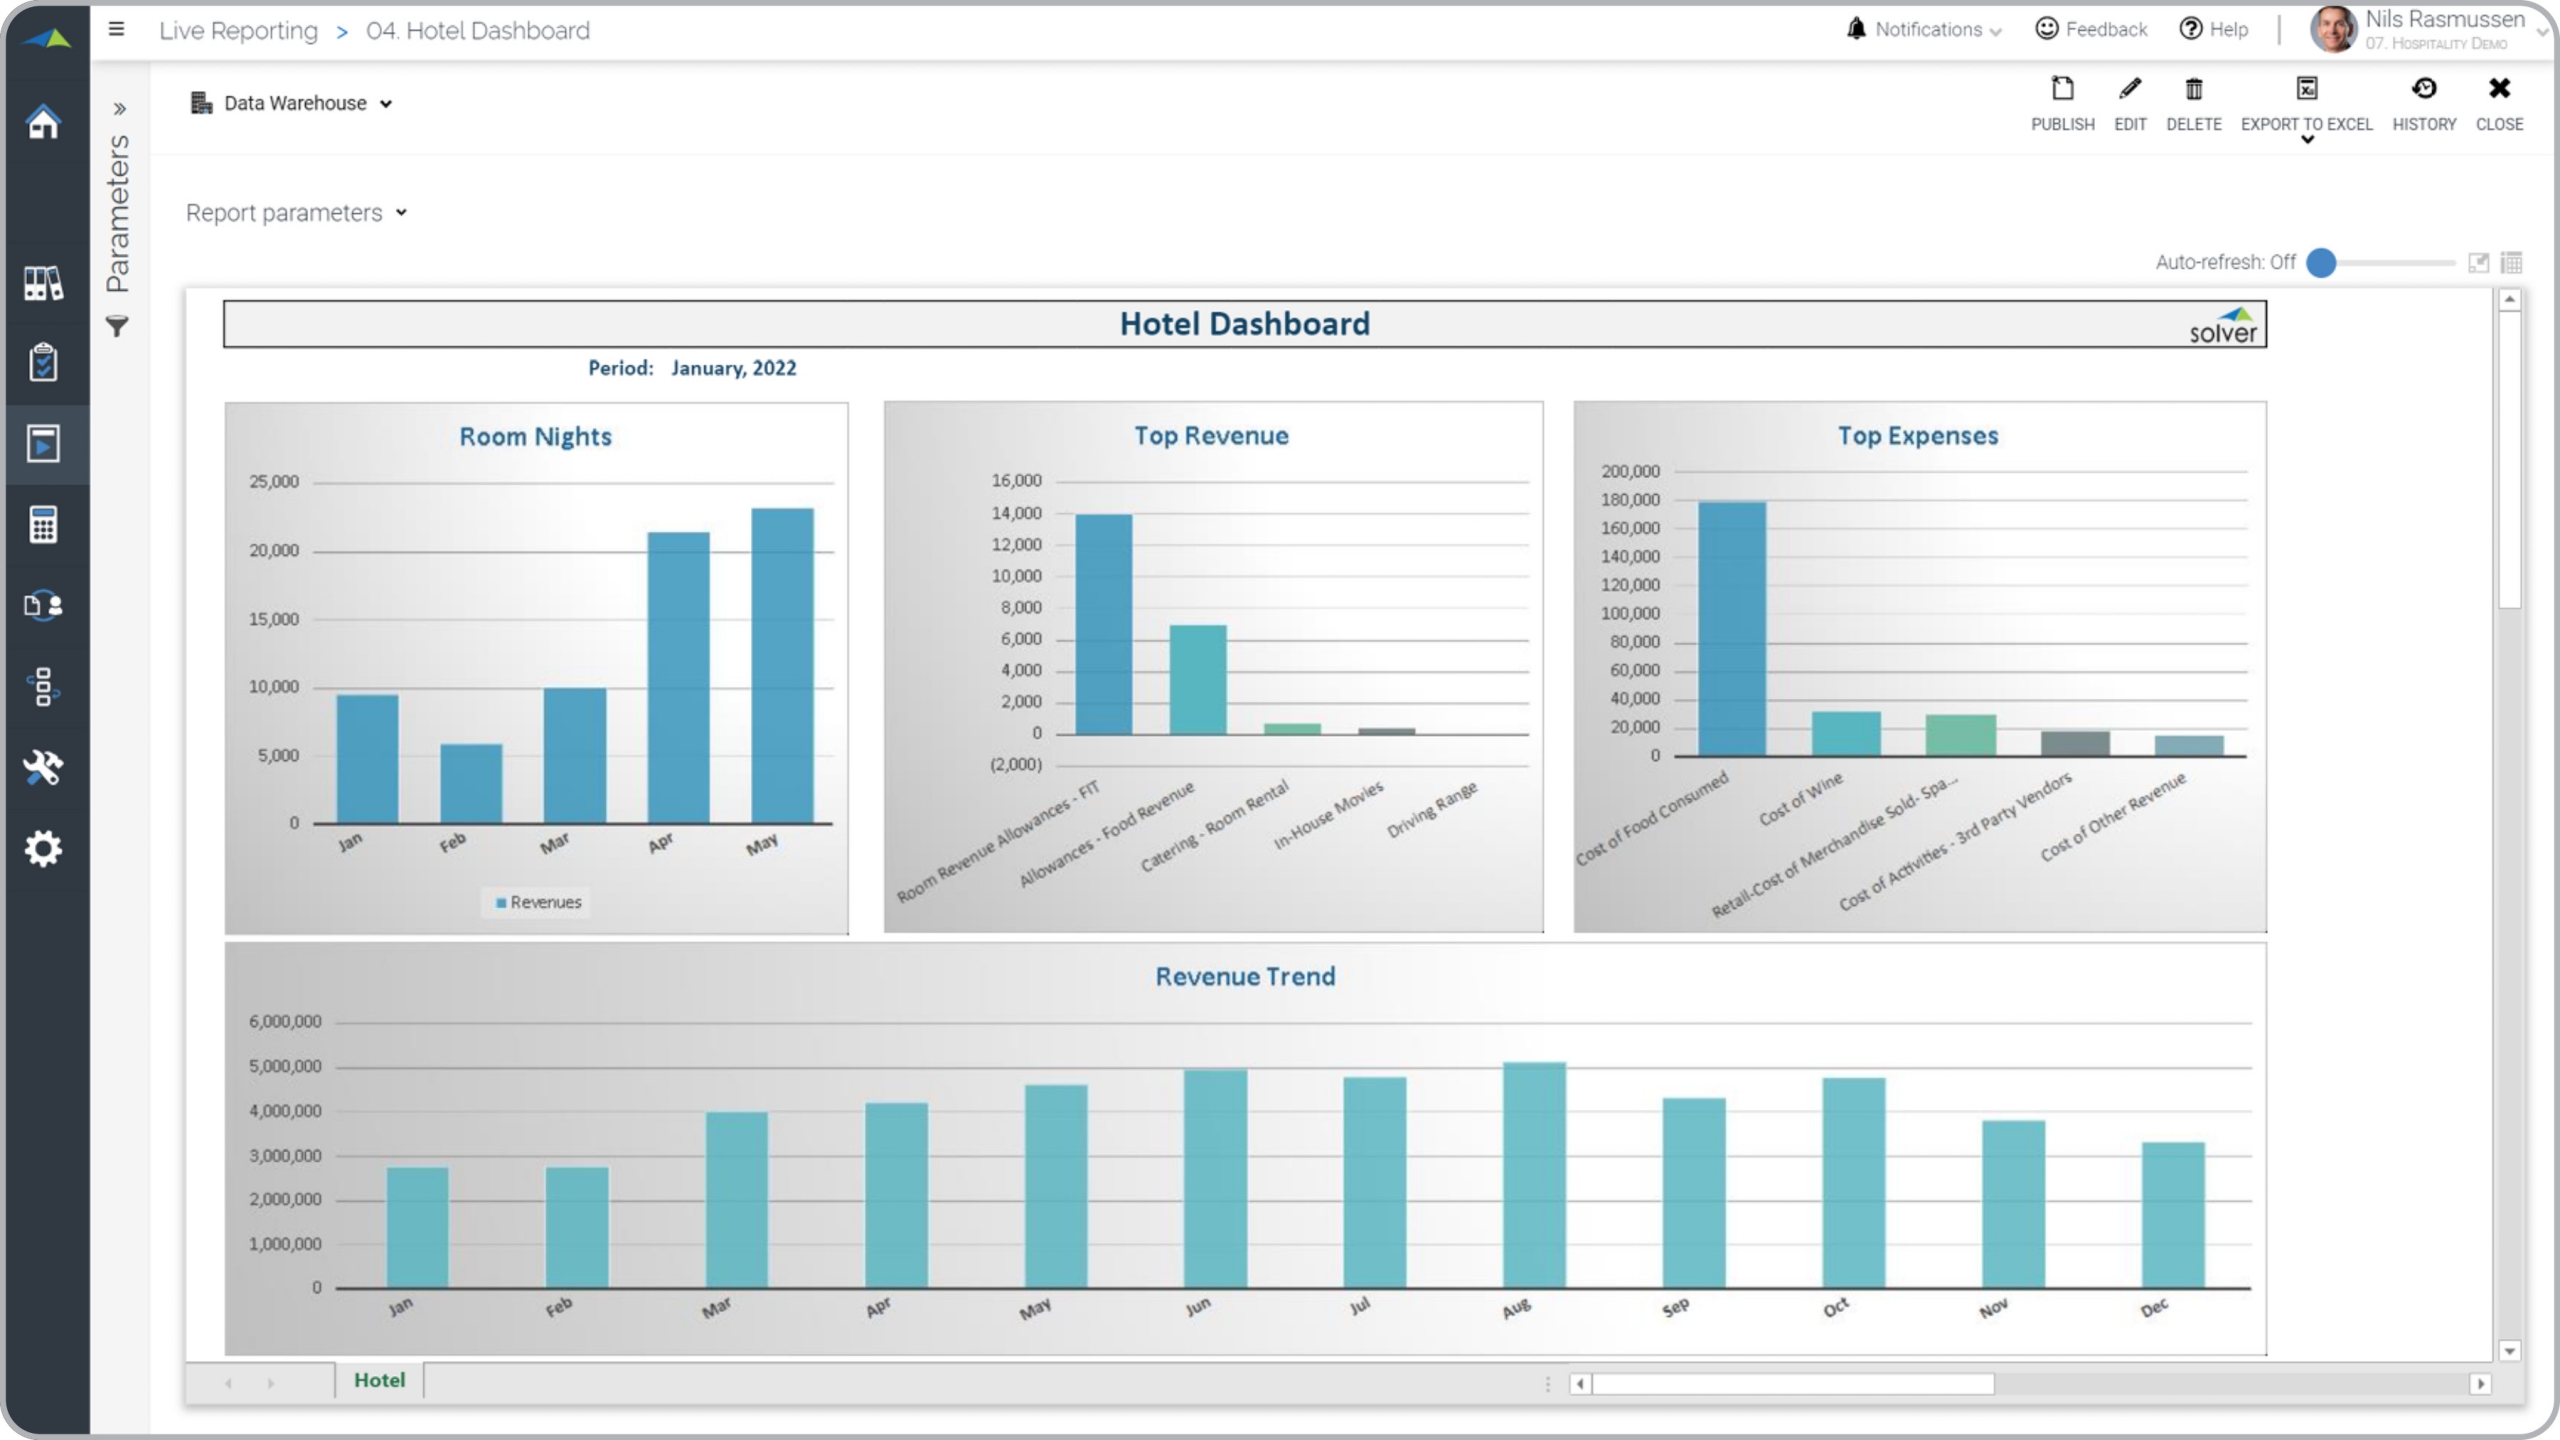
Hospitality – Hotel Dashboard
Hotel analysis with monthly room nights sold and revenues and expenses per department.
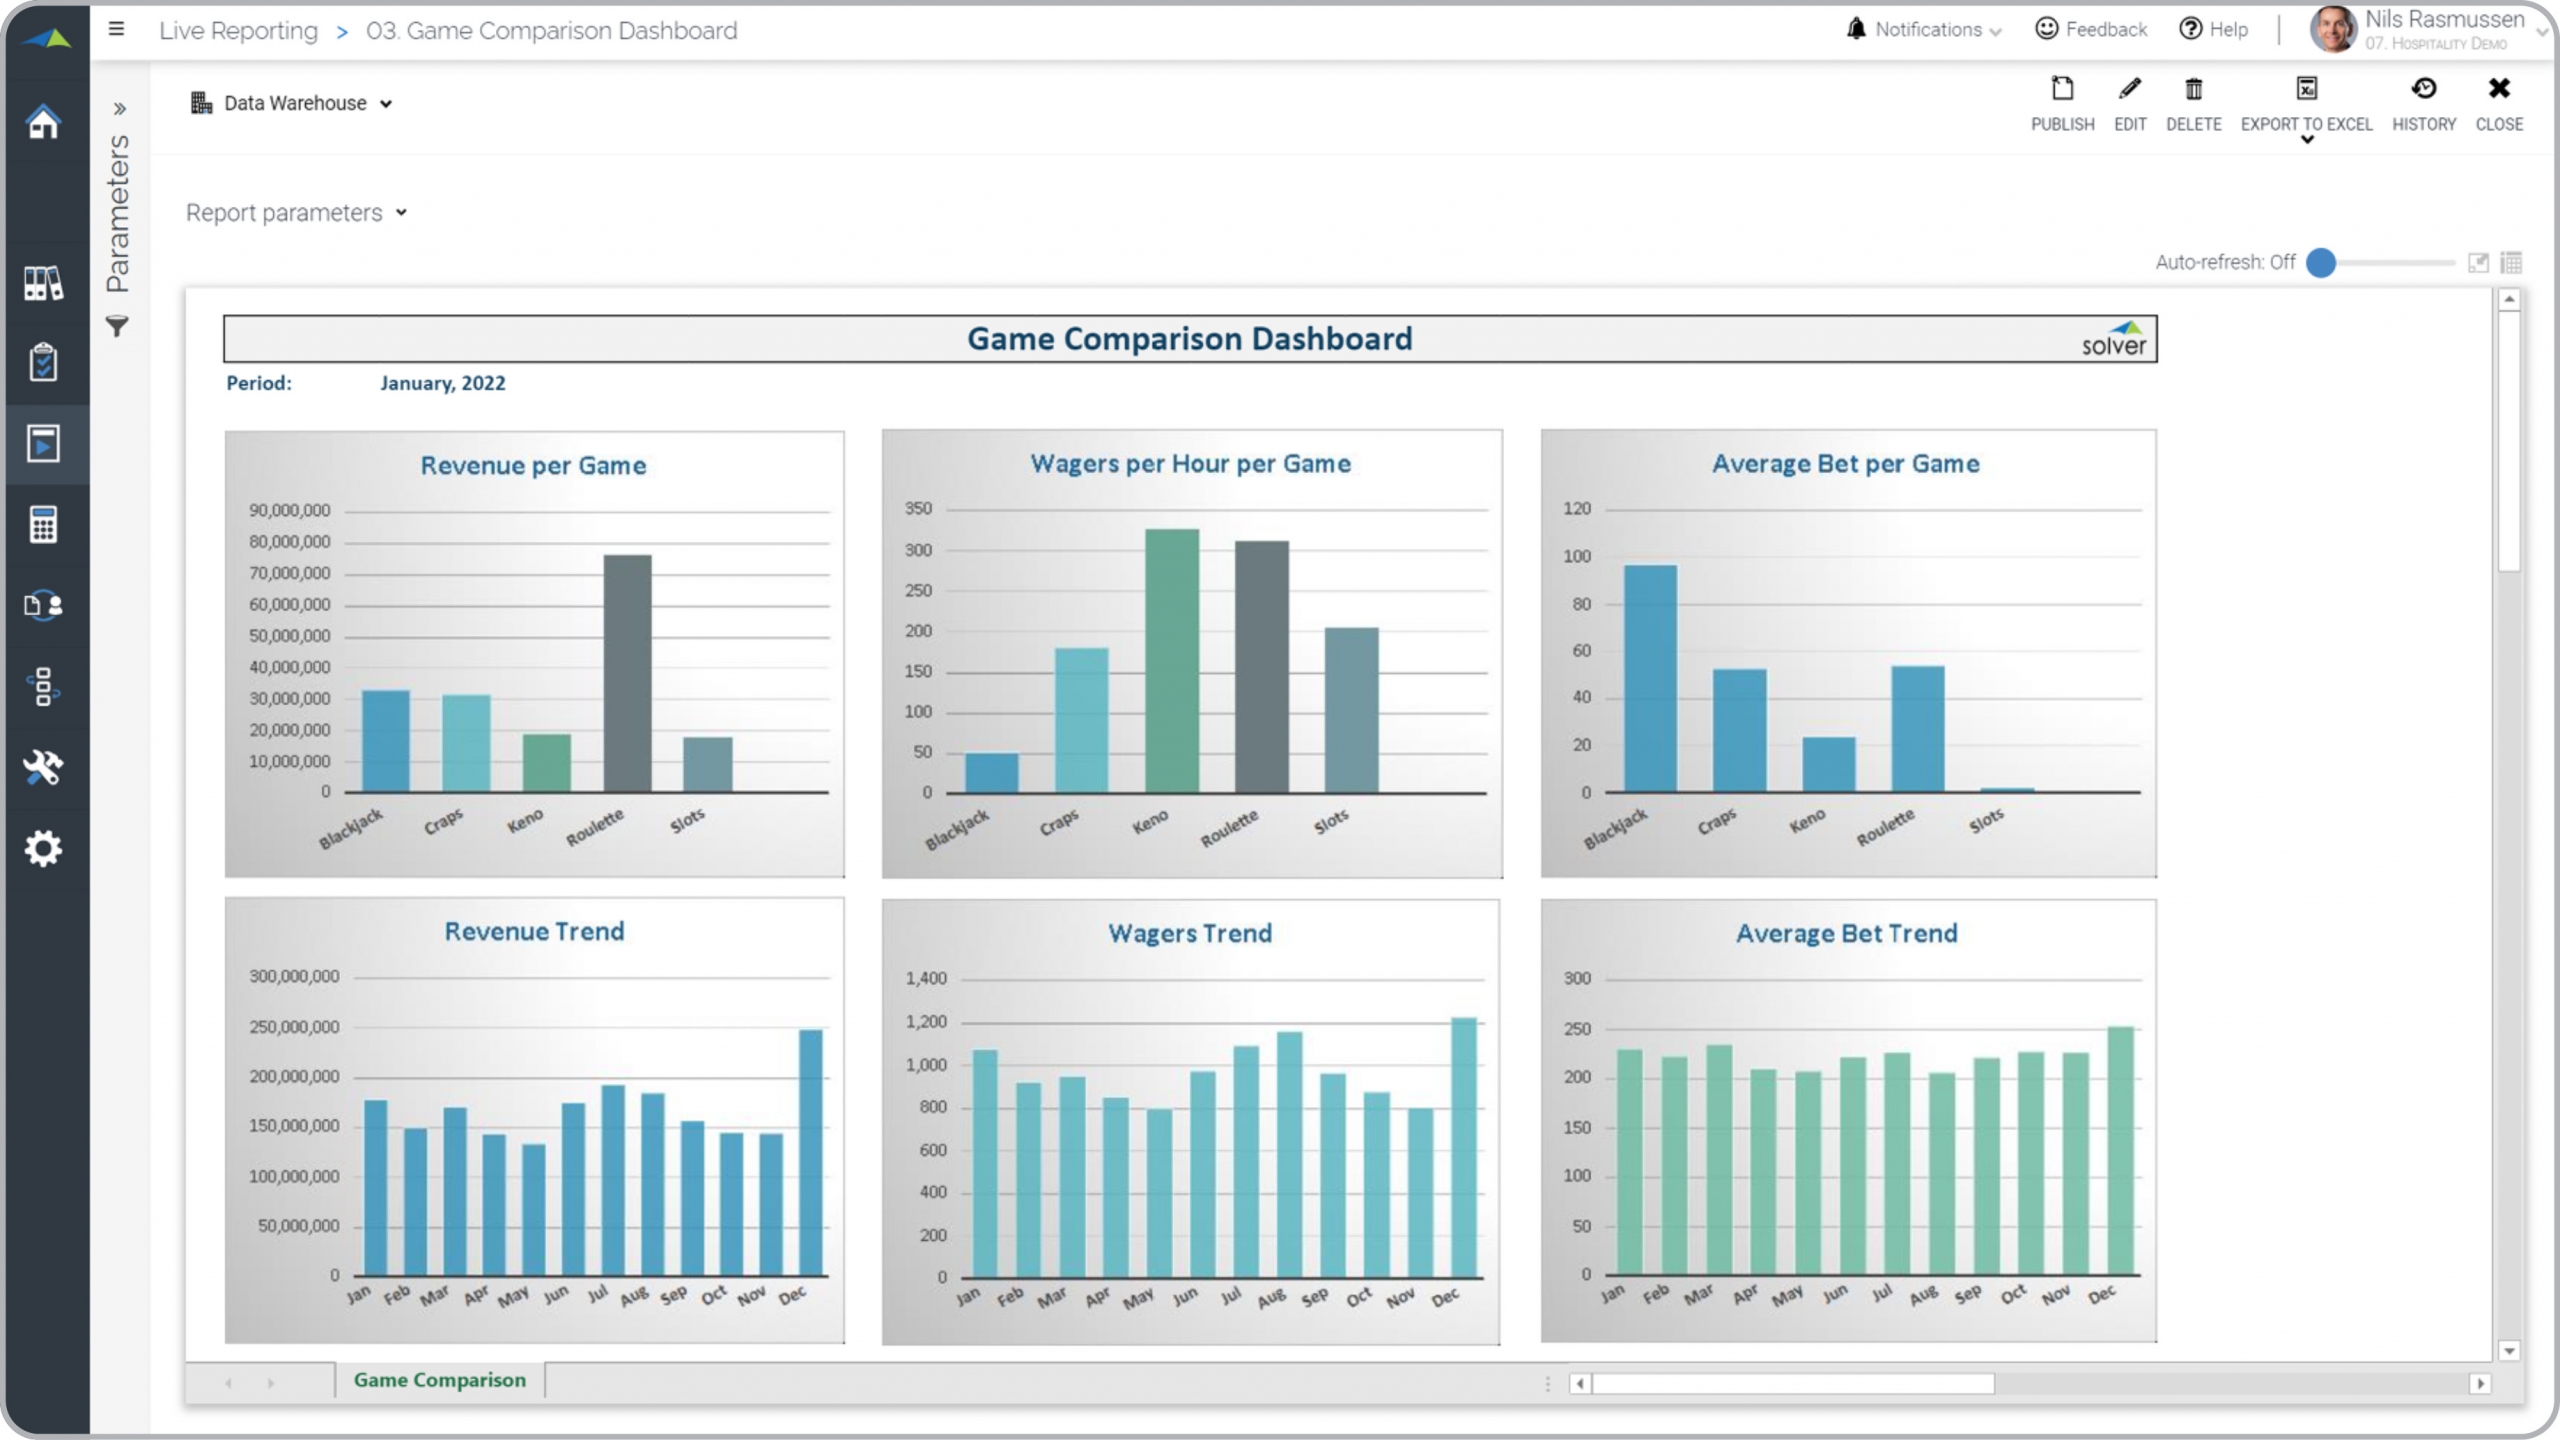
Hospitality – Casino Game Comparison Dashboard
Comparison and trends of different metrics for casino games.
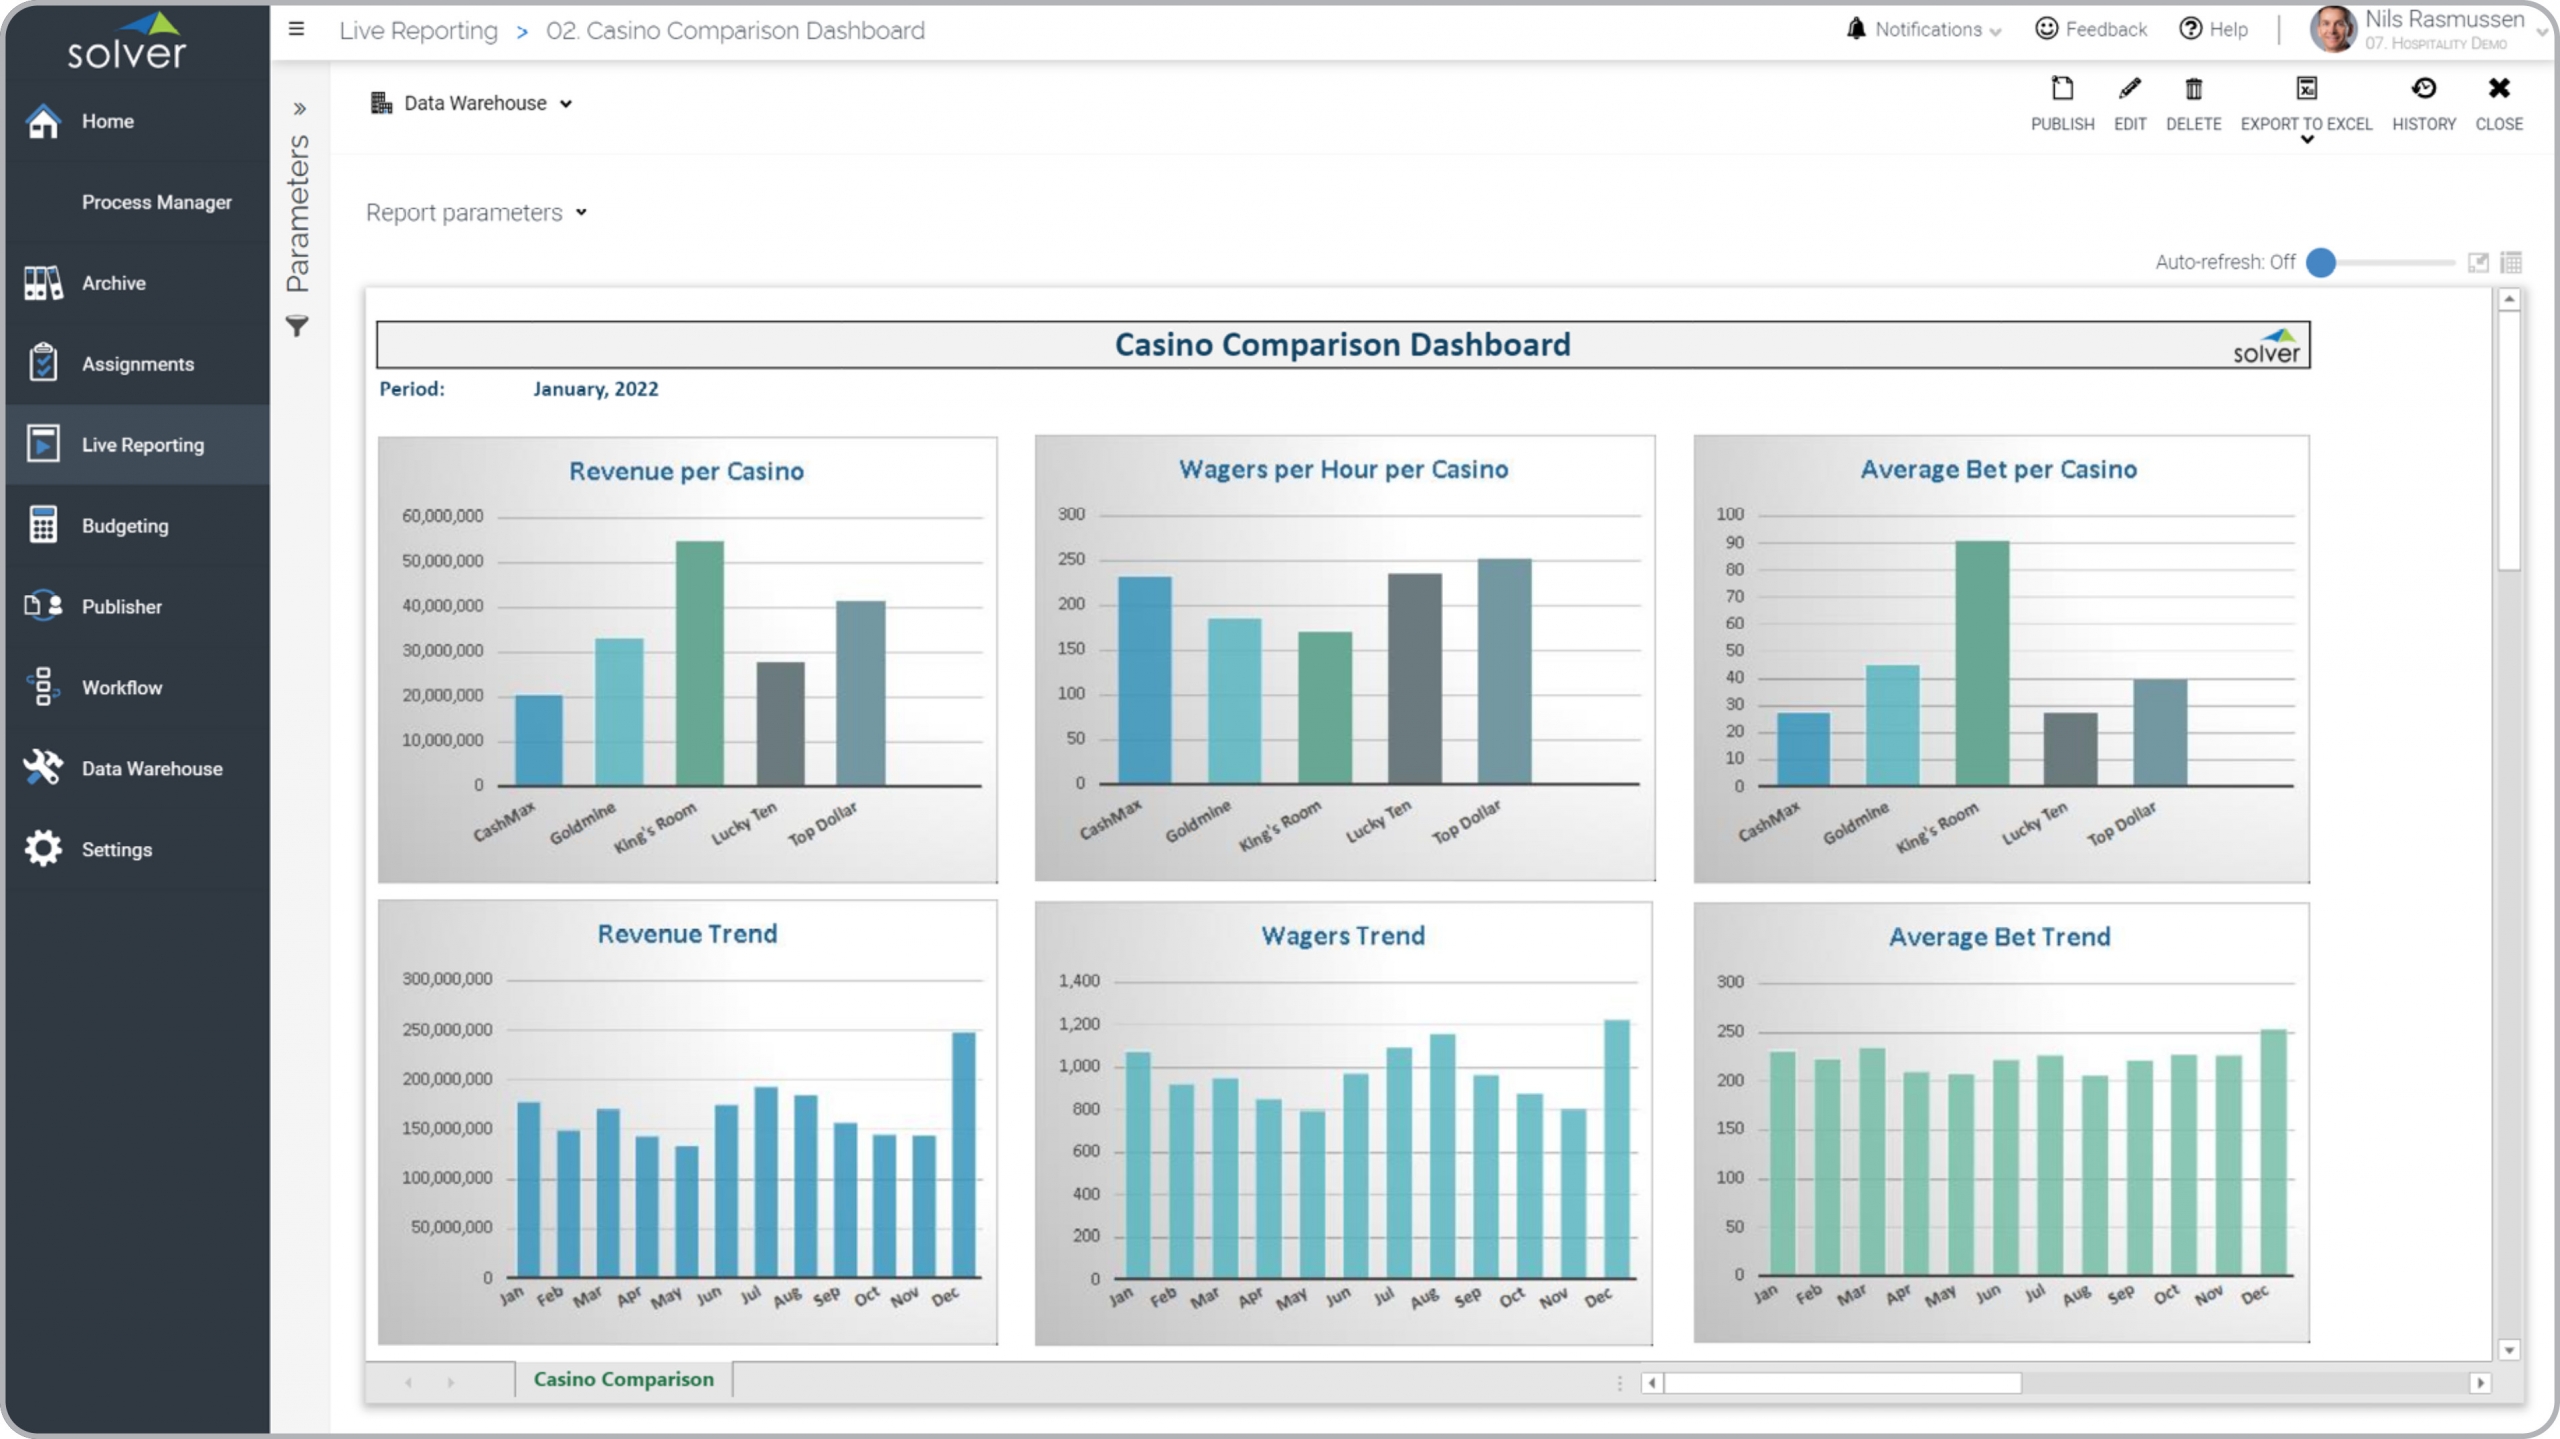
Hospitality – Casino Comparison Dashboard
Comparison of Revenues, wagers and bets for different casino department and monthly trend.
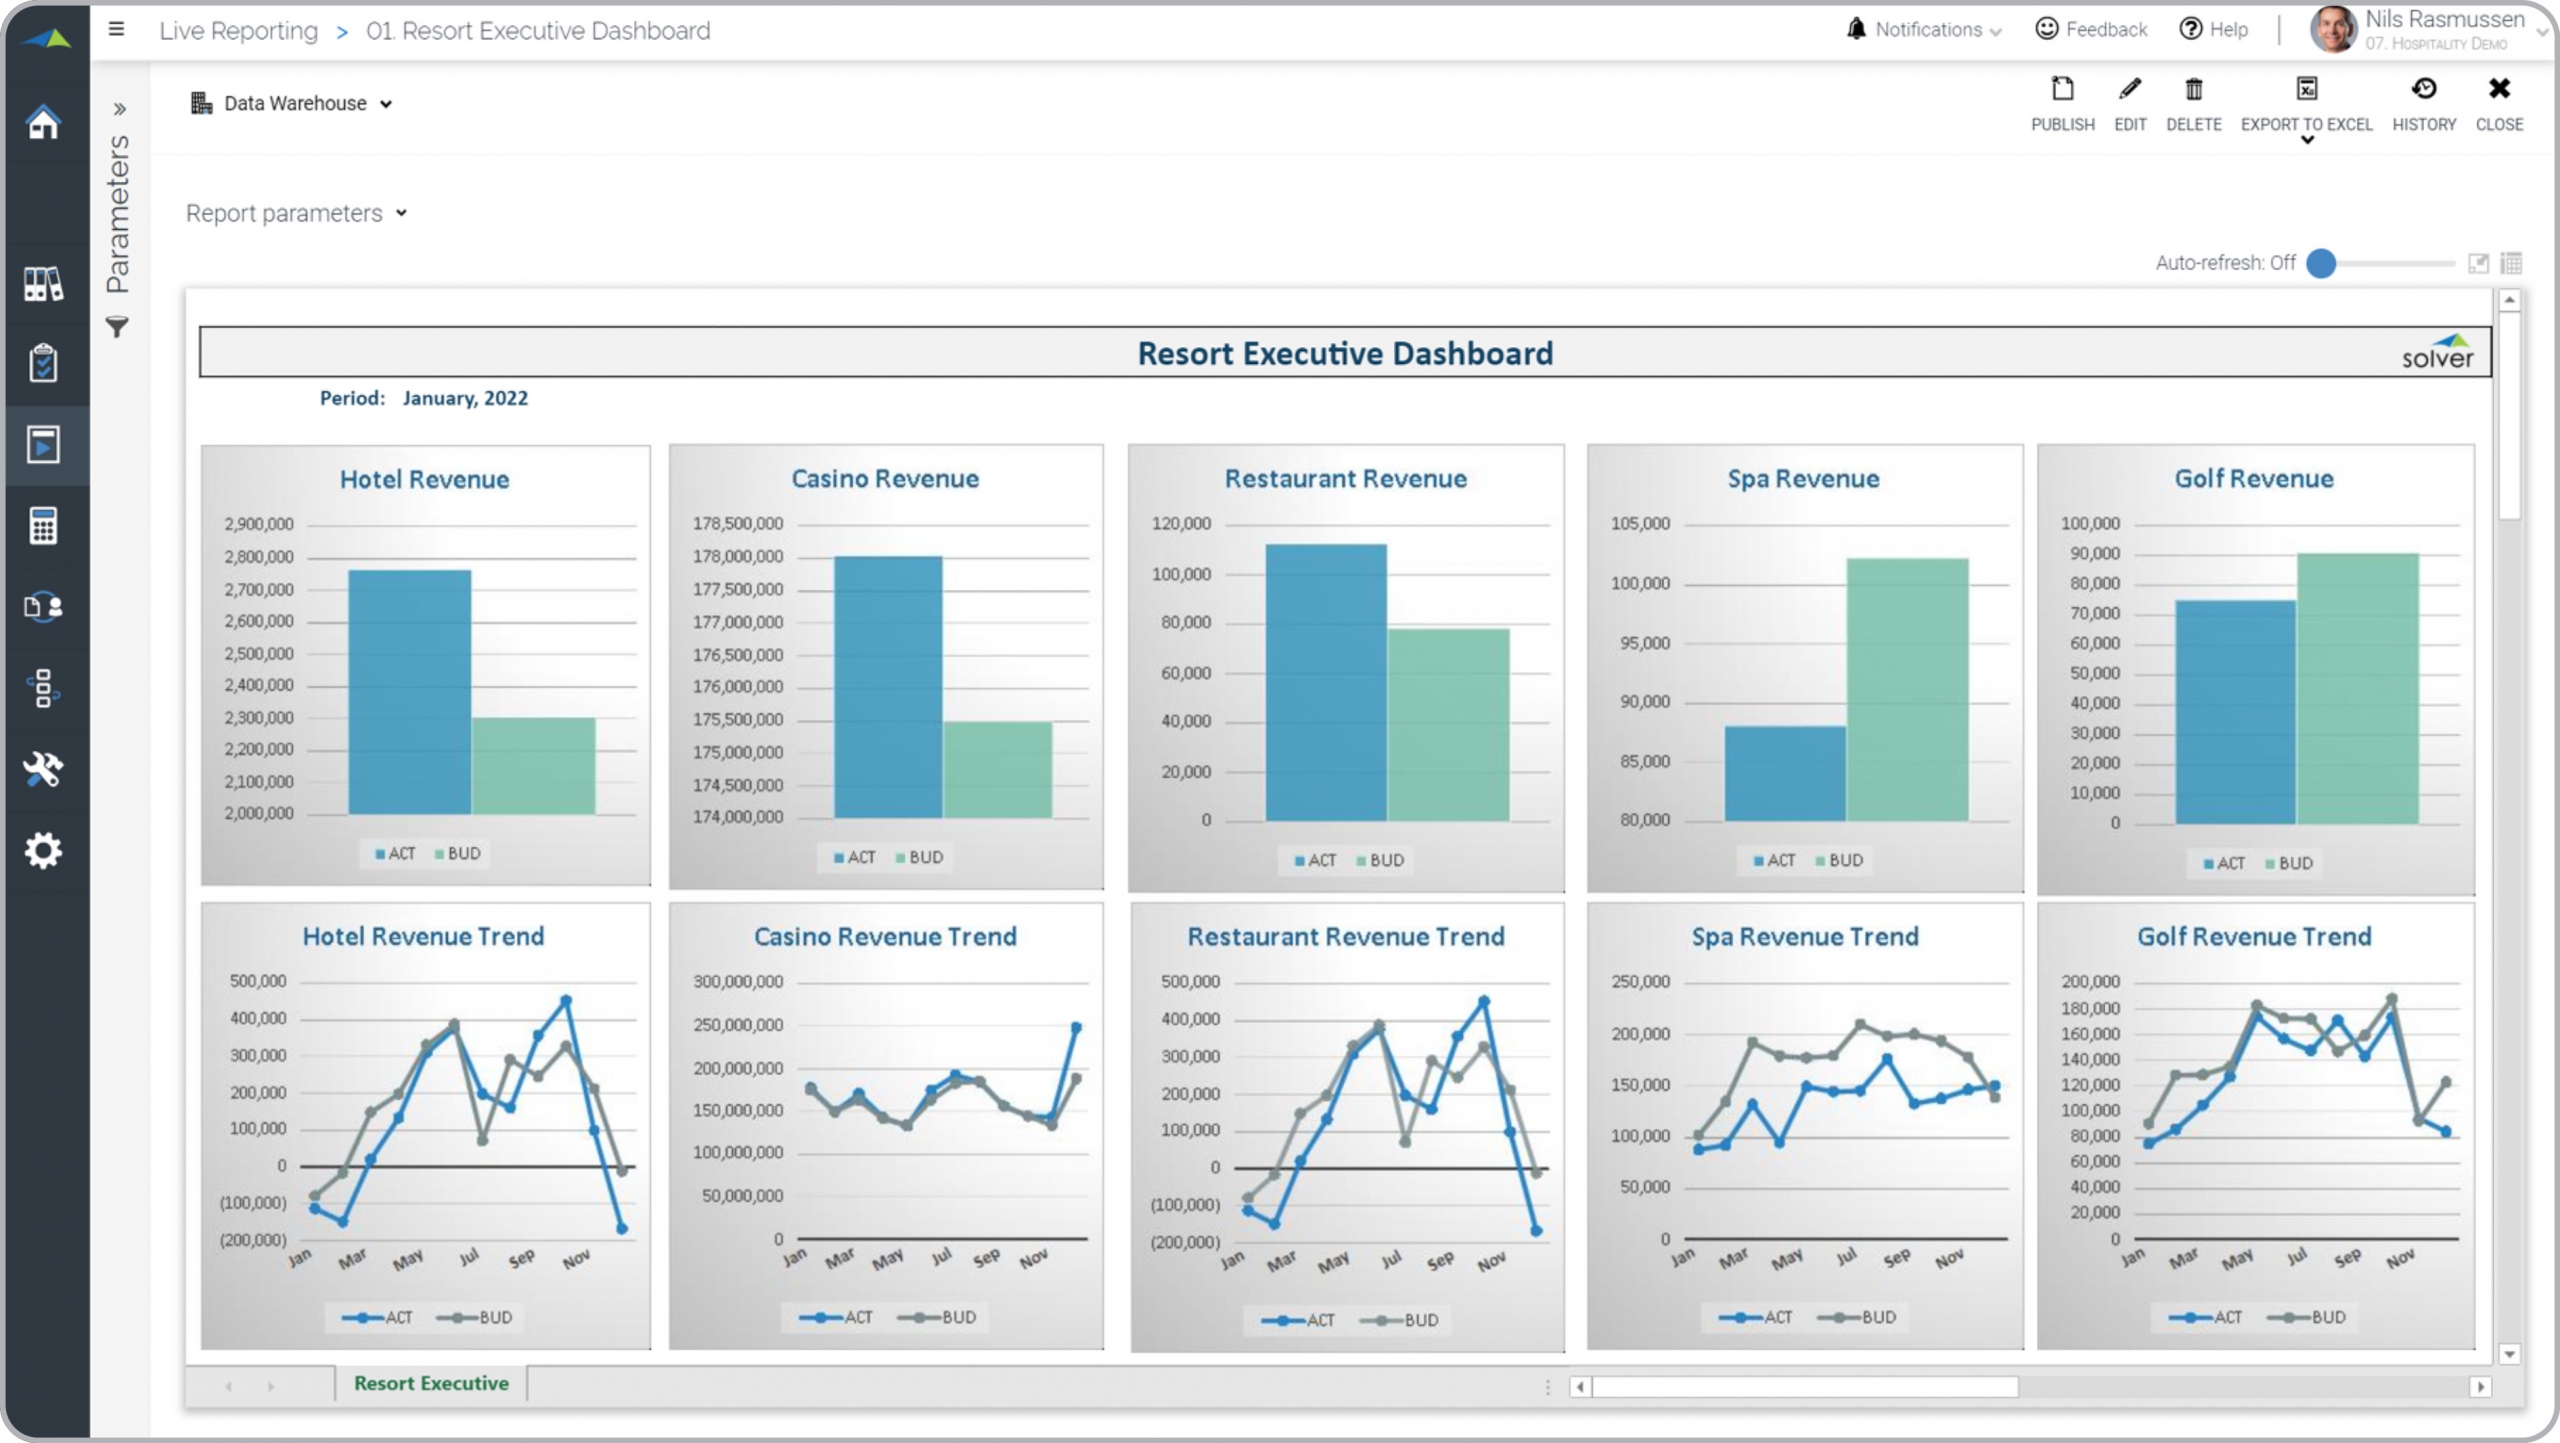
Hospitality – Executive Dashboard
Monthly actual to budget variances and trends for hotel, restaurant and other revenues.
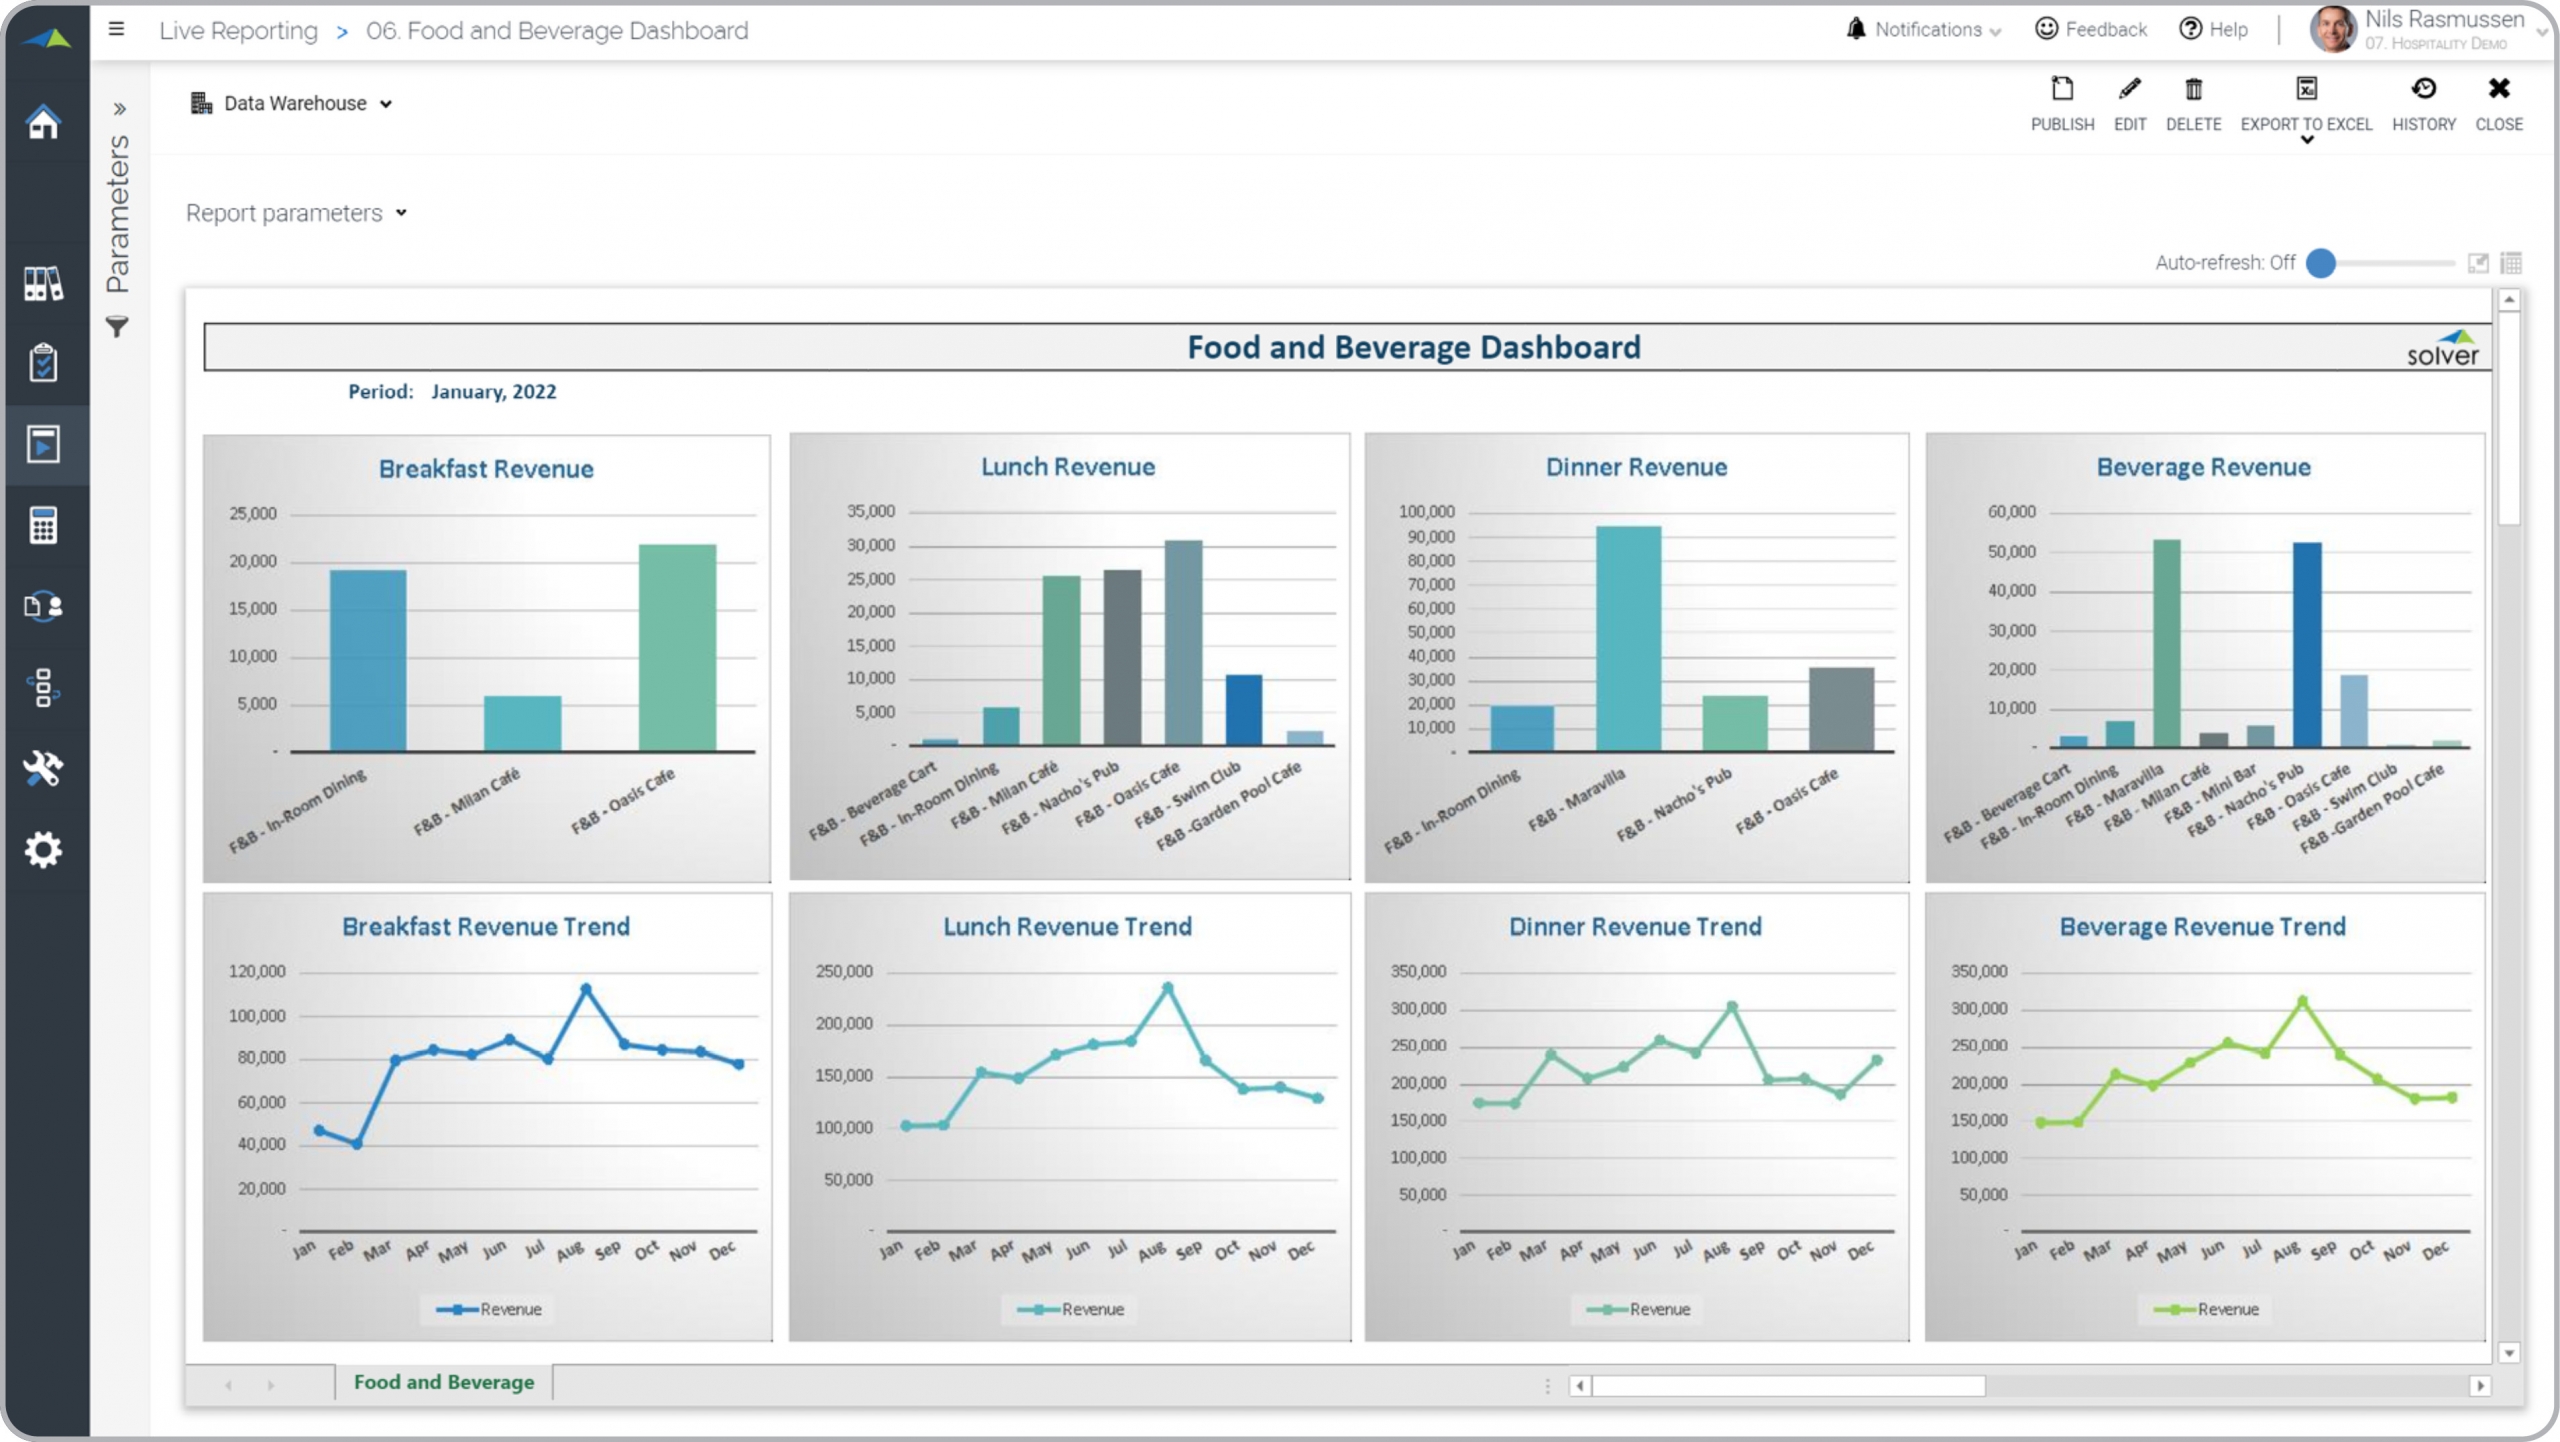
Hospitality – Food & Beverage Dashboard
Analysis of food & beverage kpis with restaurant comparison and monthly trend.
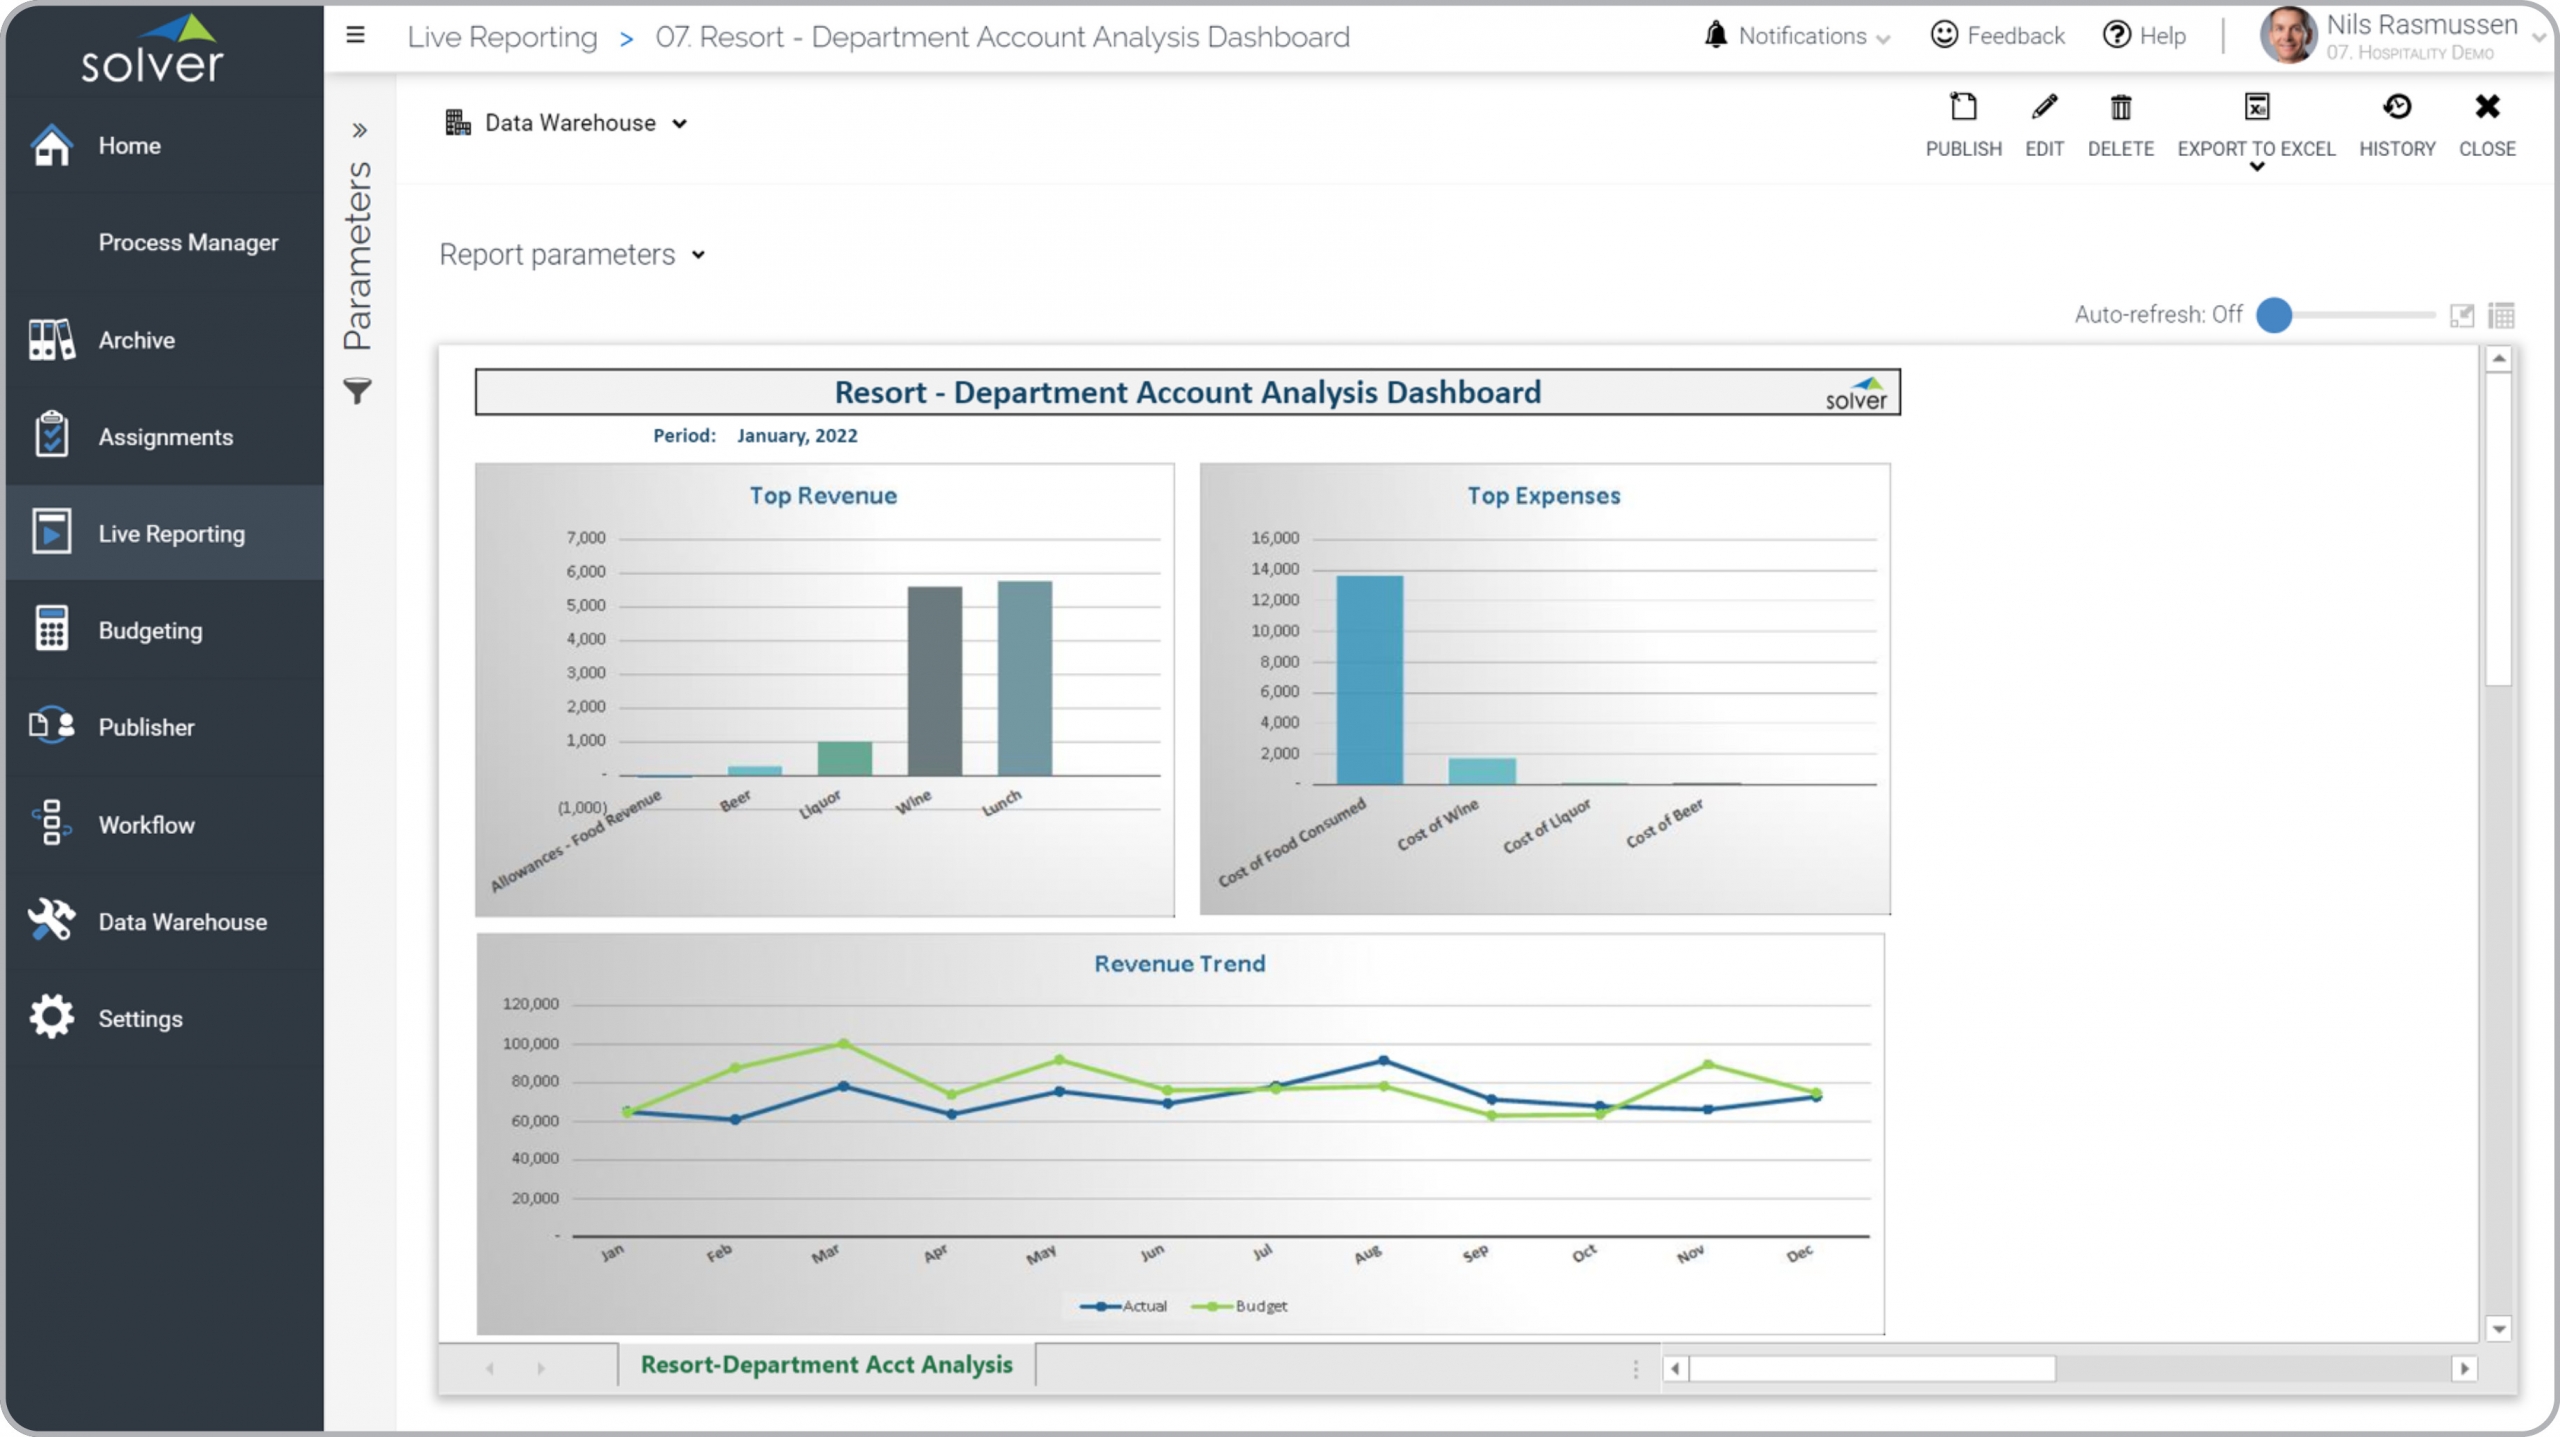
Hospitality – Resort Account Analysis
Graphical view of top revenue and expense account categories and total revenue trend.
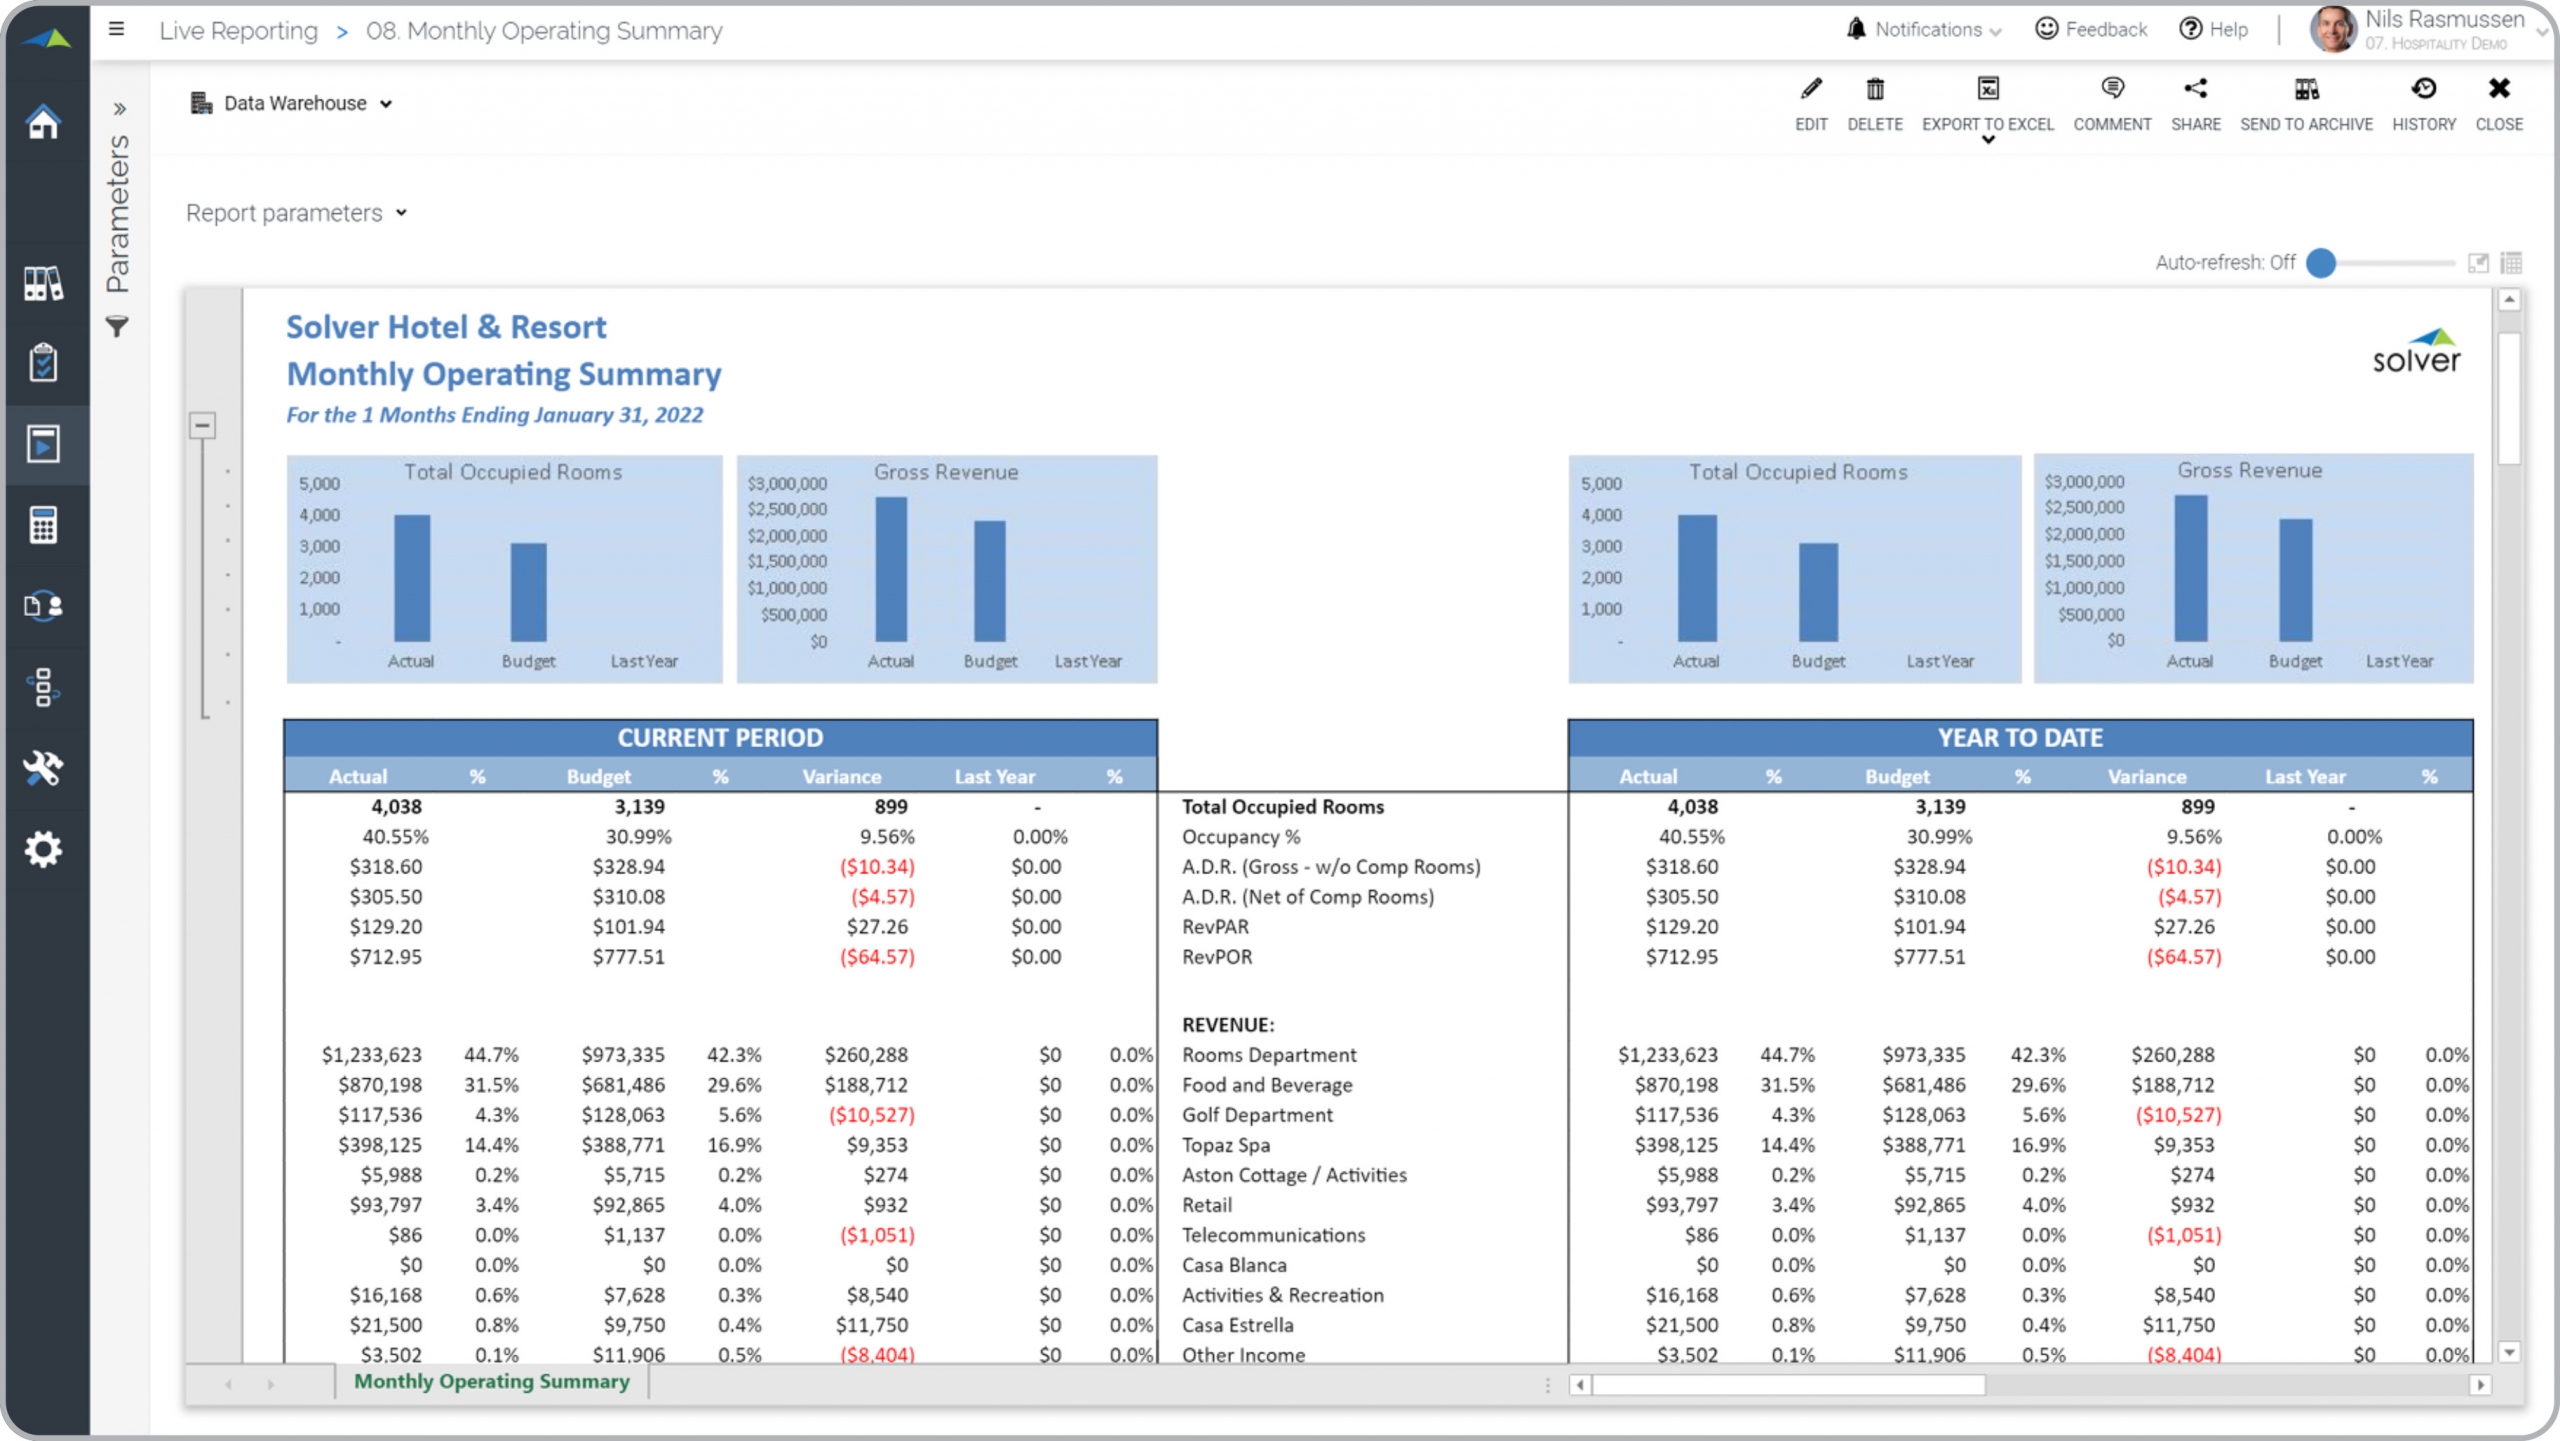
Hospitality – Hotel & Resort Monthly Operating Summary
Profit & Loss report with operational KPIs.
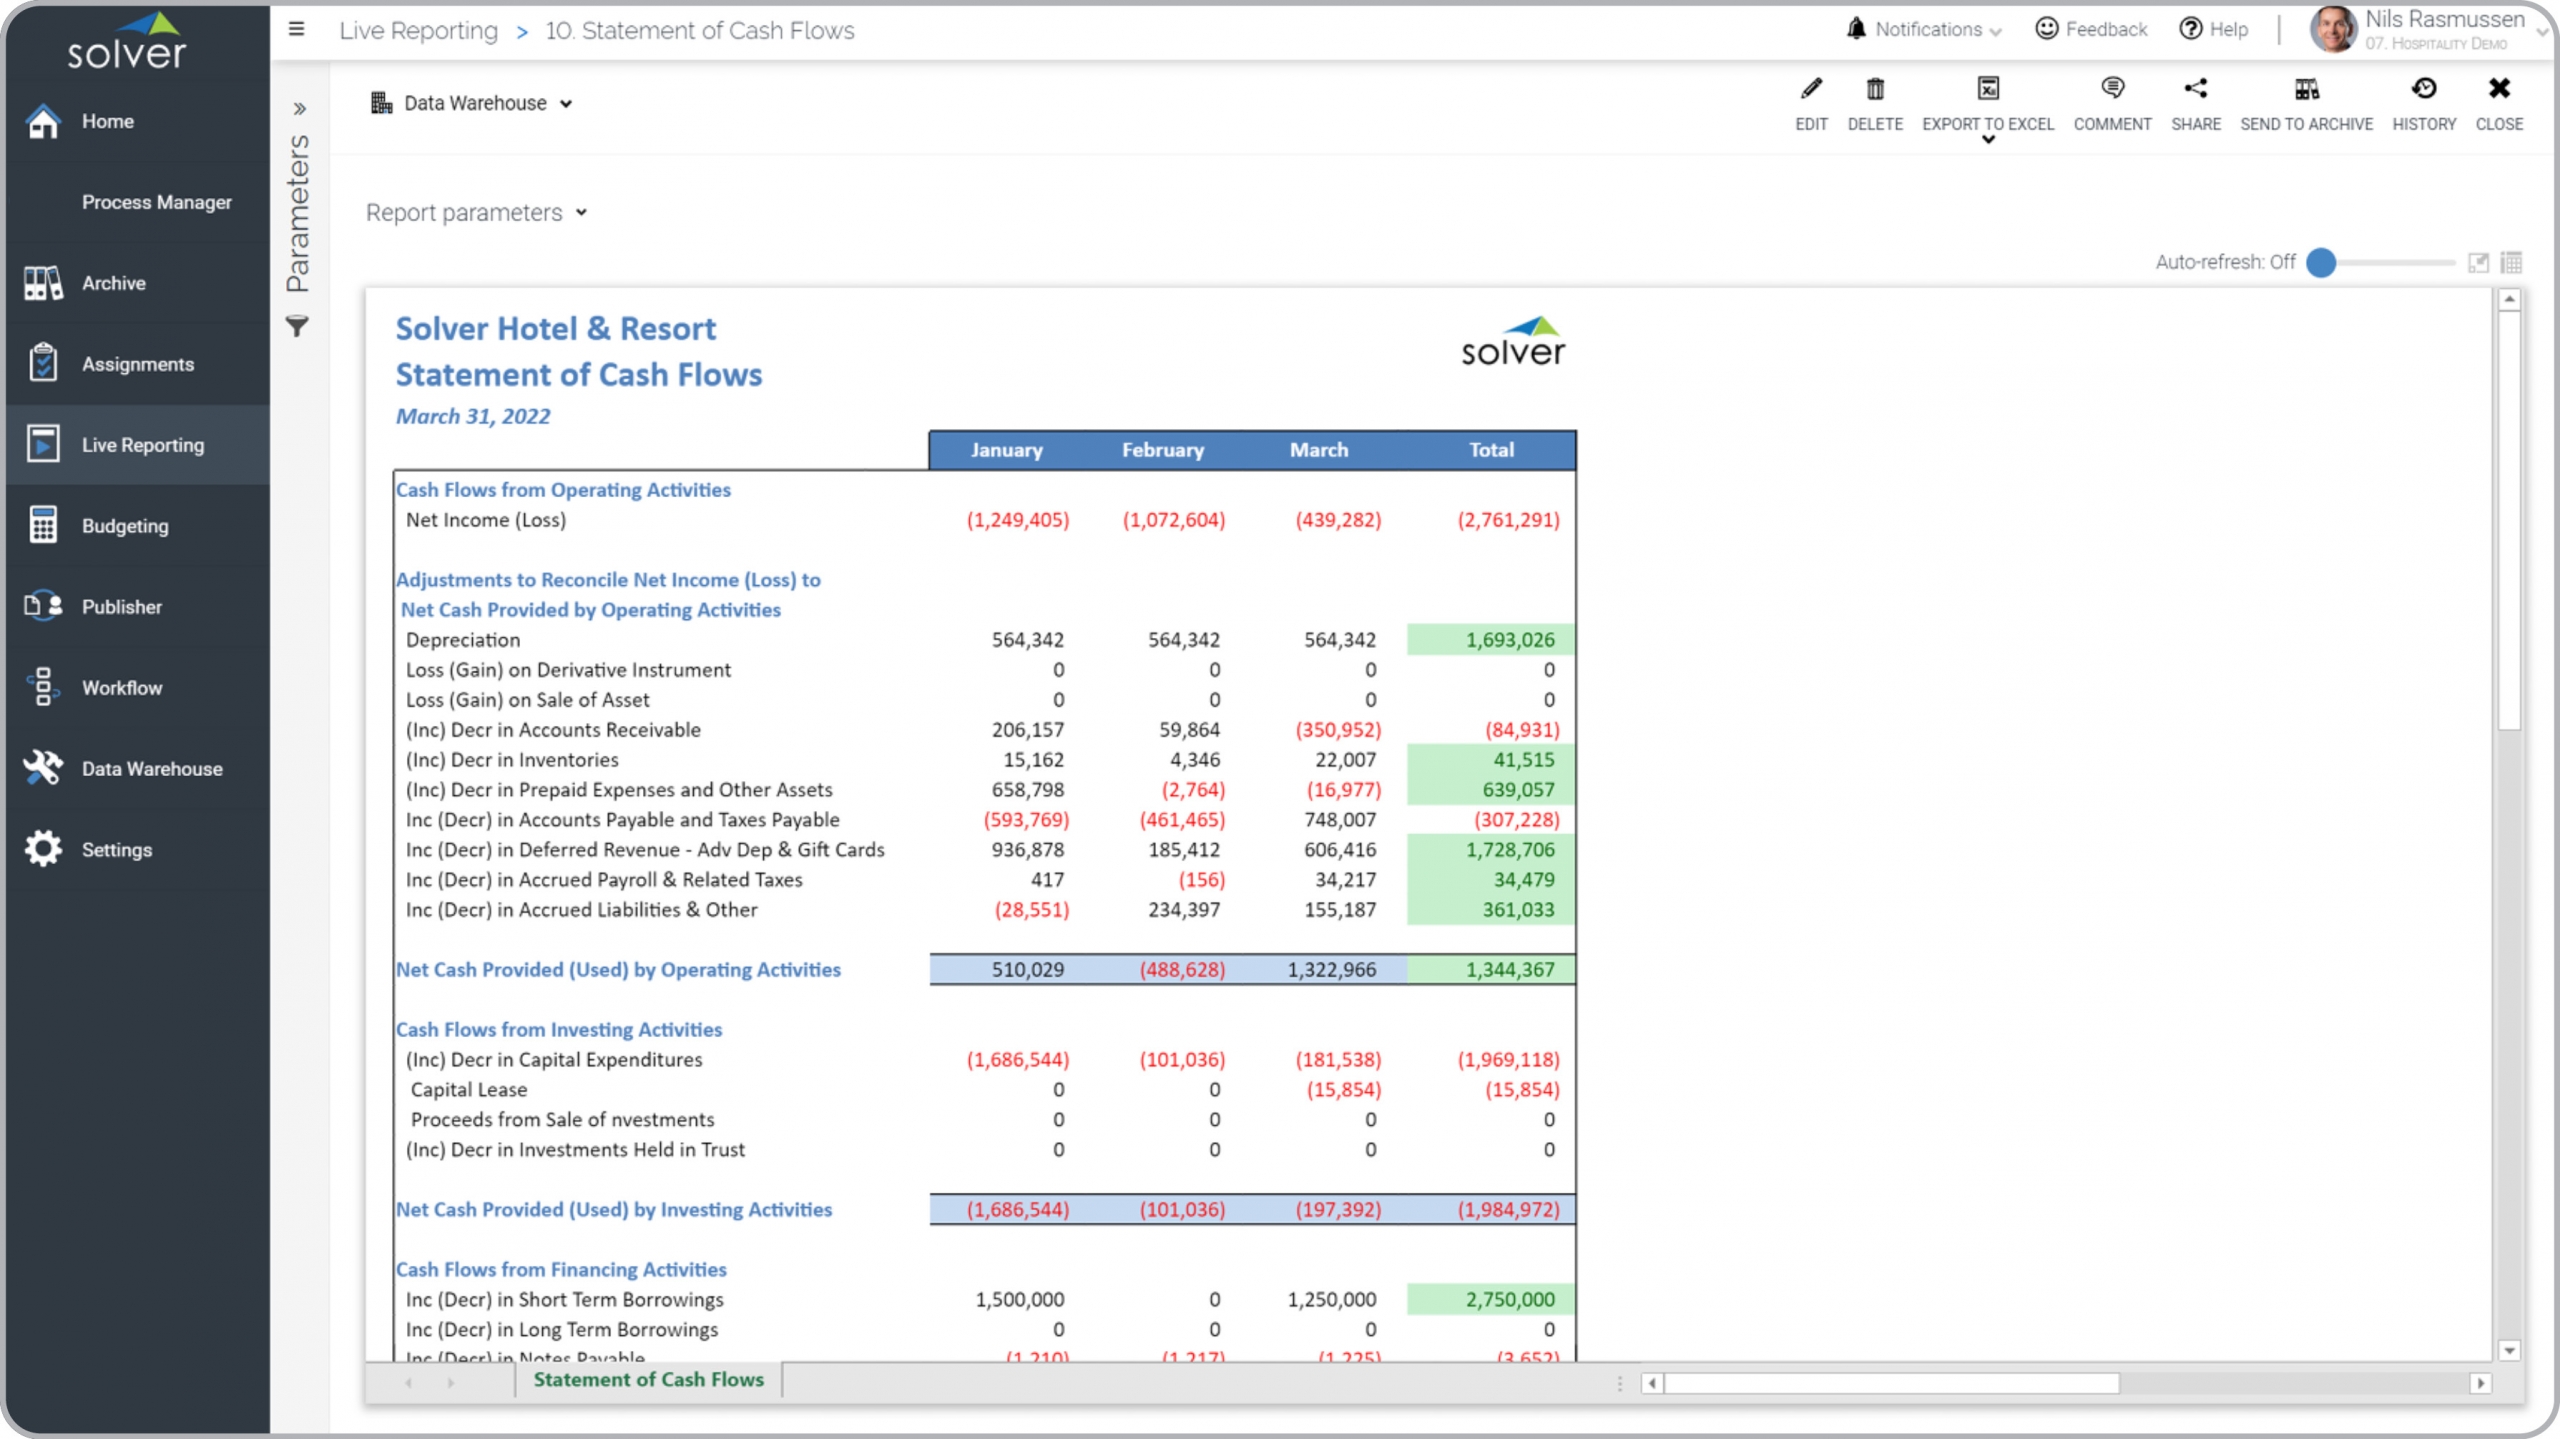
Hospitality – Hotel & Resort Monthly Cash Flow
Cash Flow statement with monthly changes and total year-to-date cash flow.
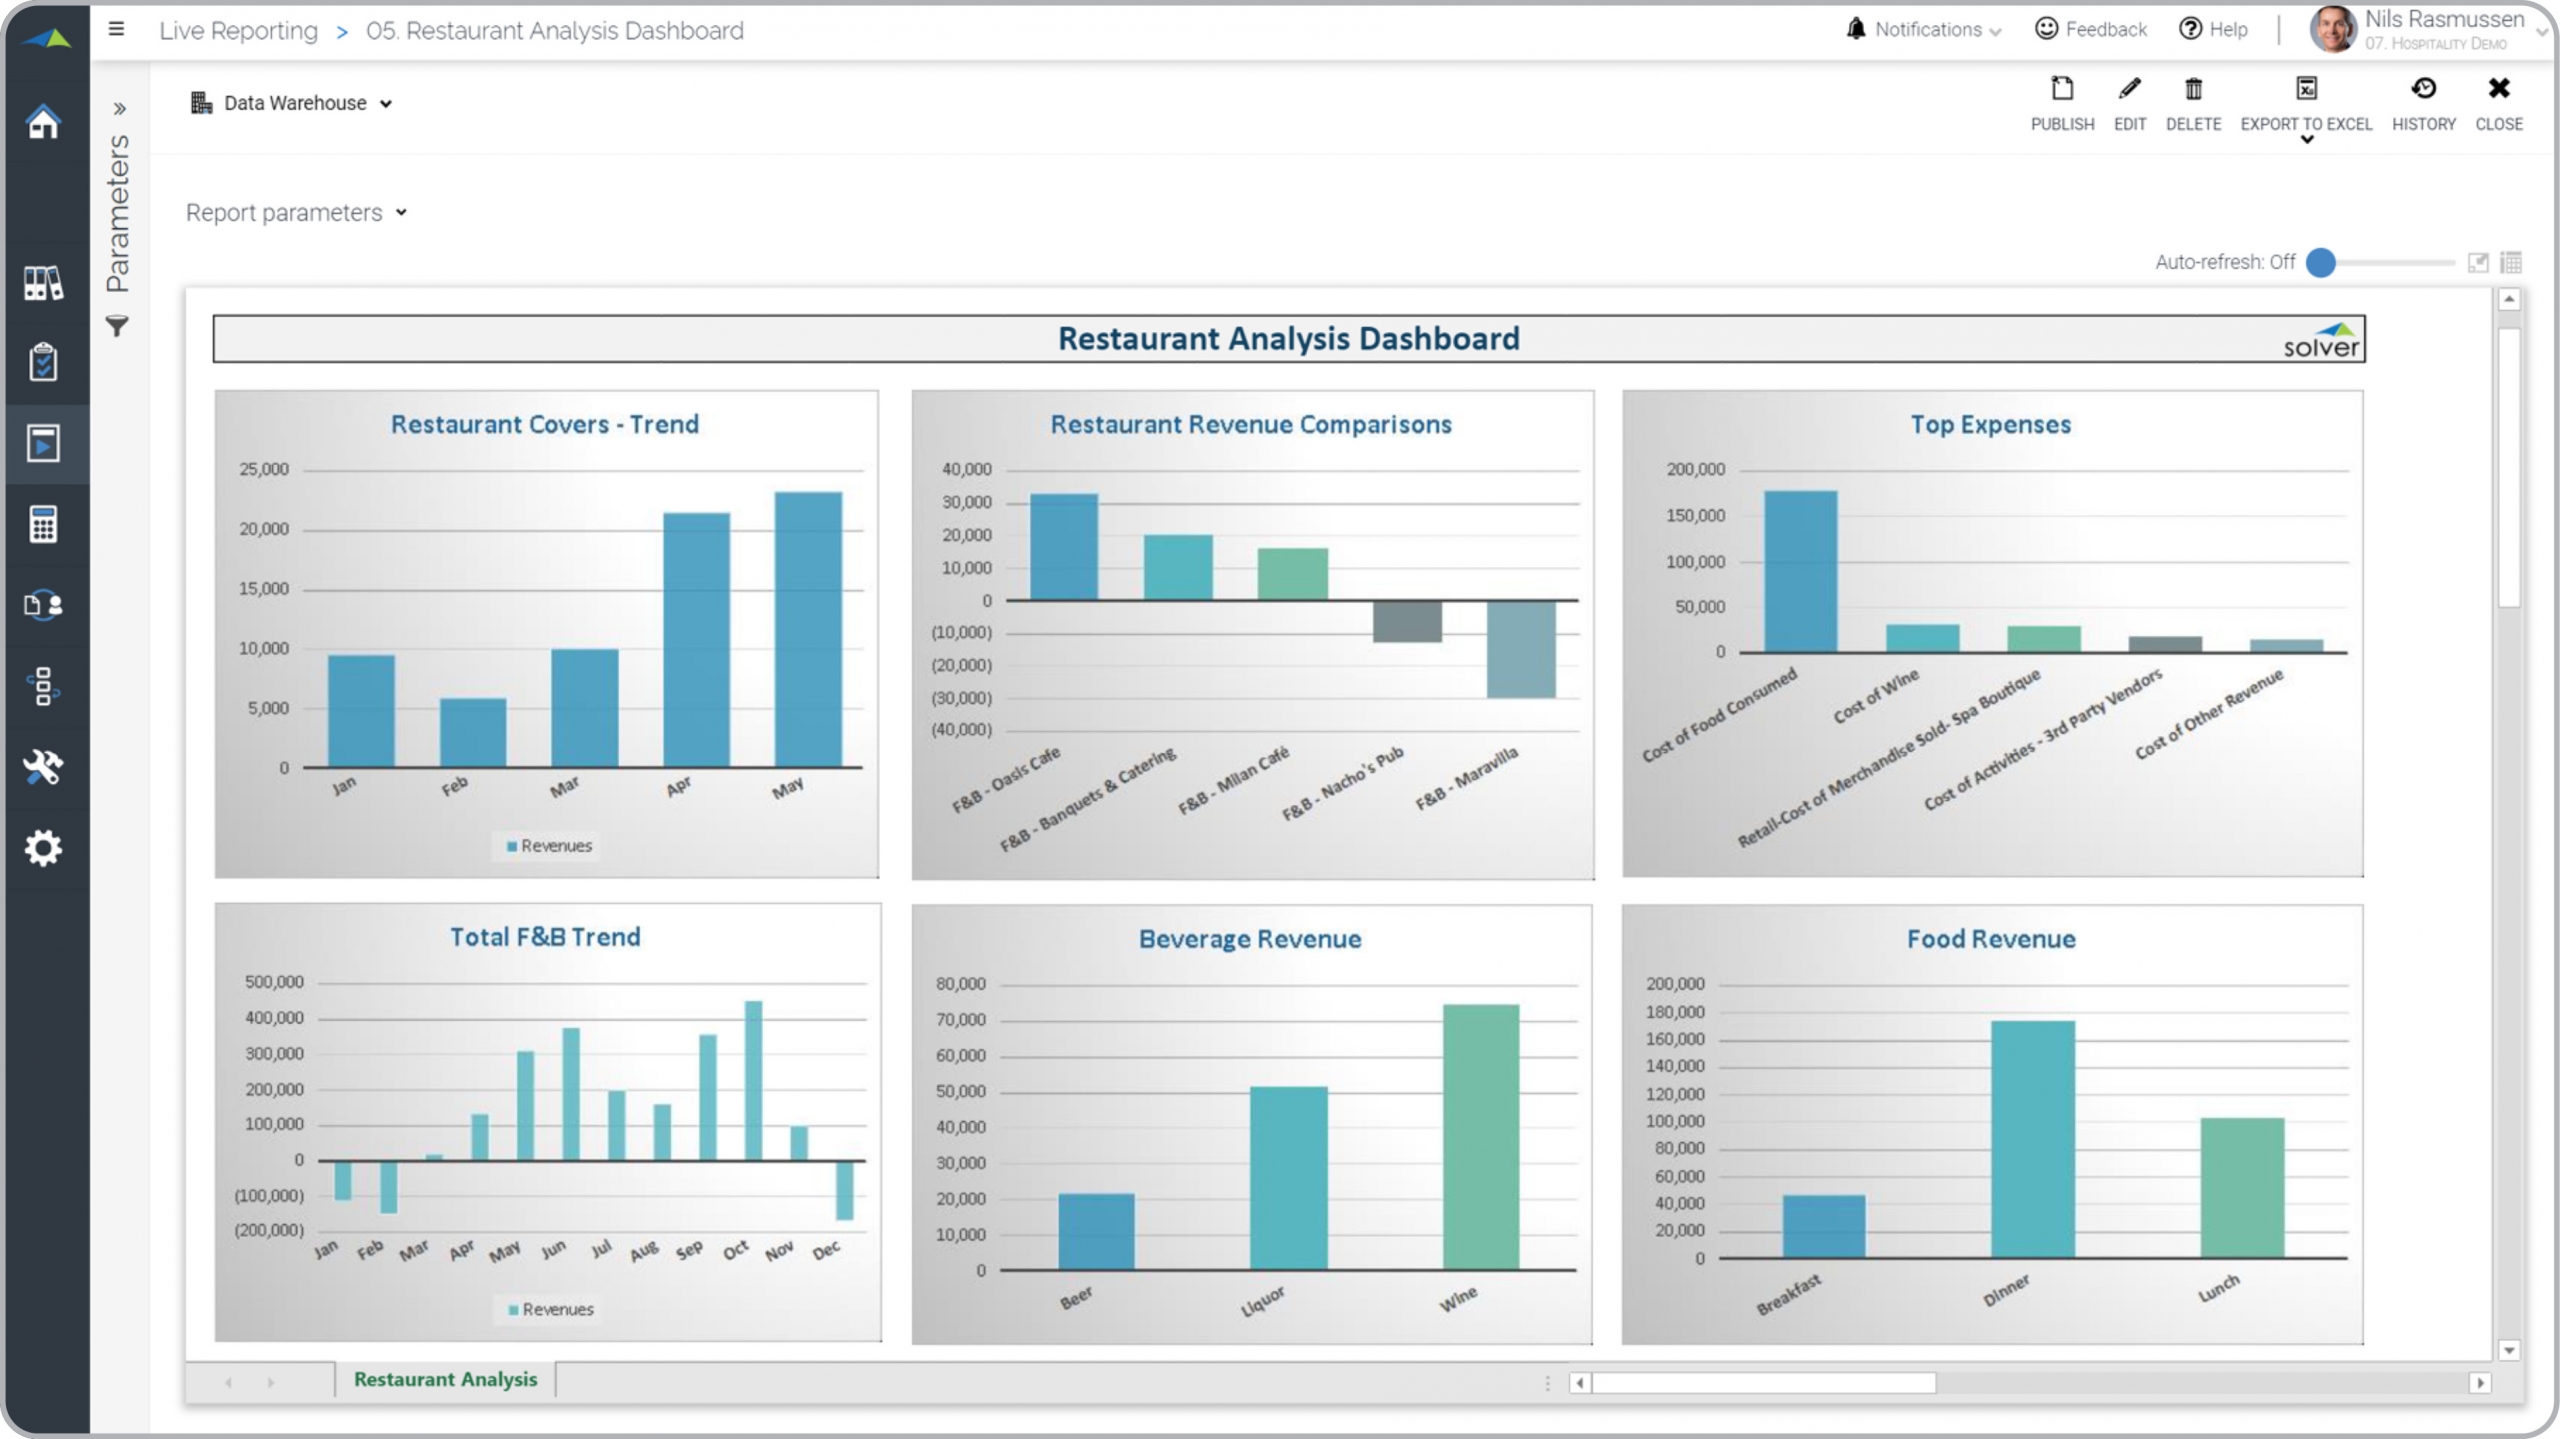
Hospitality – Restaurant Analysis Dashboard
Shows charts for key restaurant metrics like covers, F&B trend, beverage and food revenue.
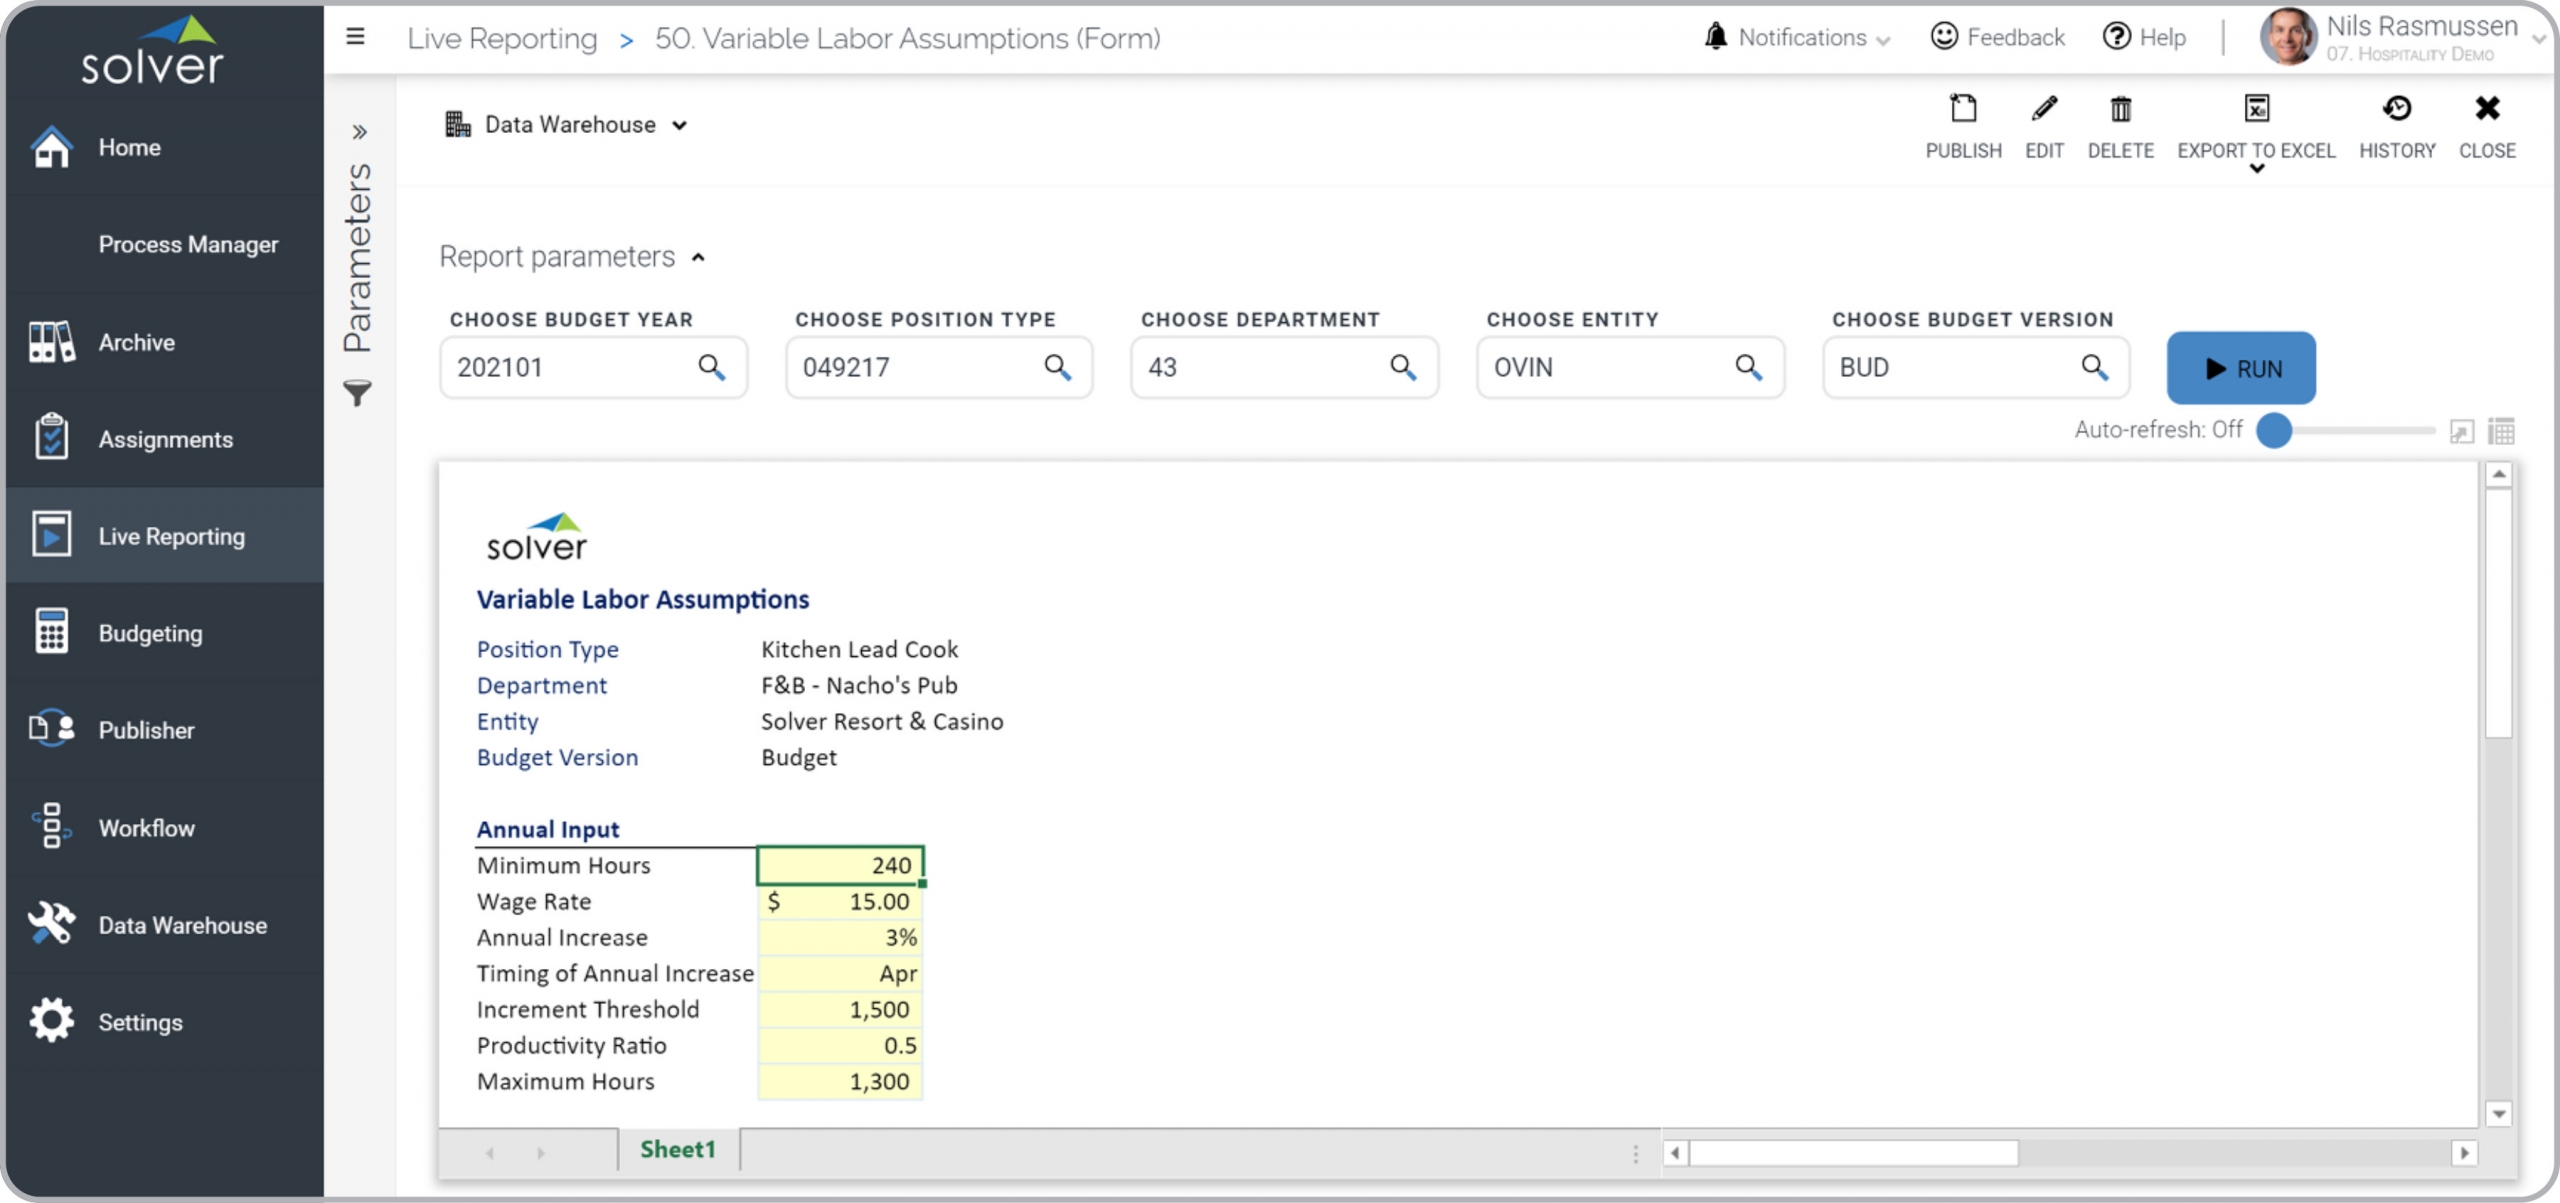
Hospitality – Variable Labor Budget Assumptions
Budget input form to capture variable labor assumptions to be used in the Labor Budget.
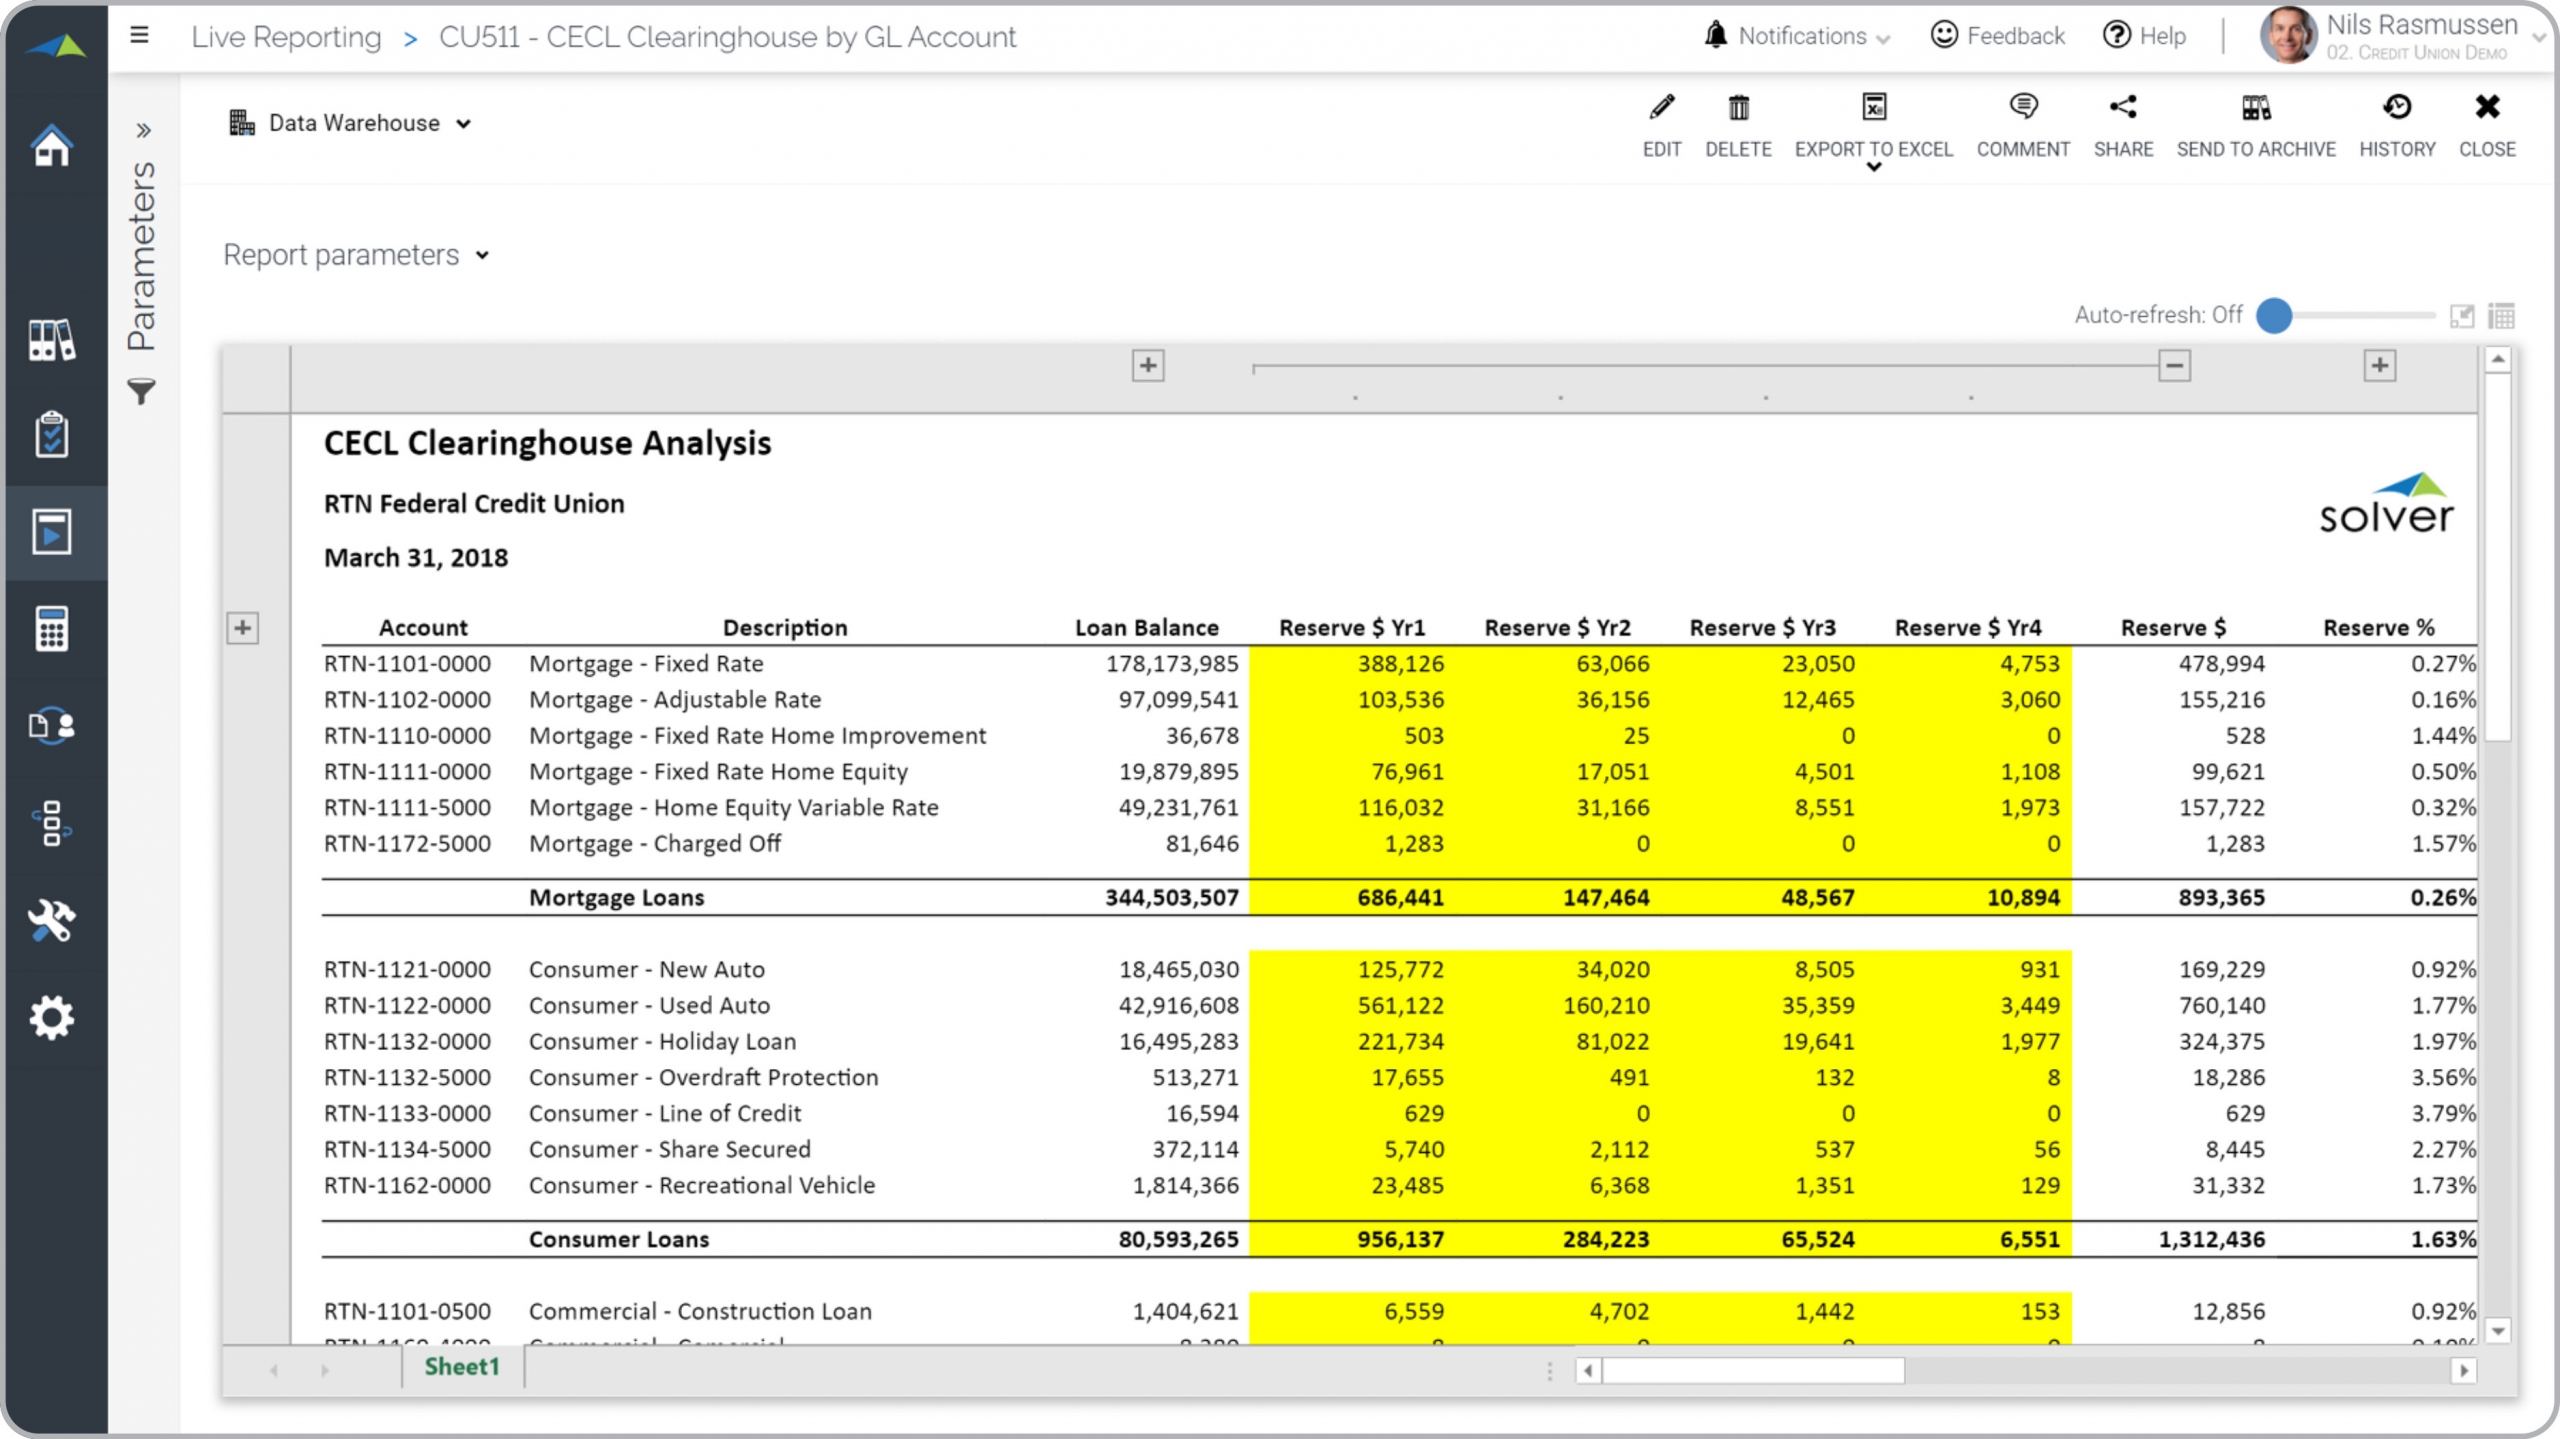
Credit Union – CECL Clearinghouse Analysis by GL Account
Clearinghouse analysis by GL account.
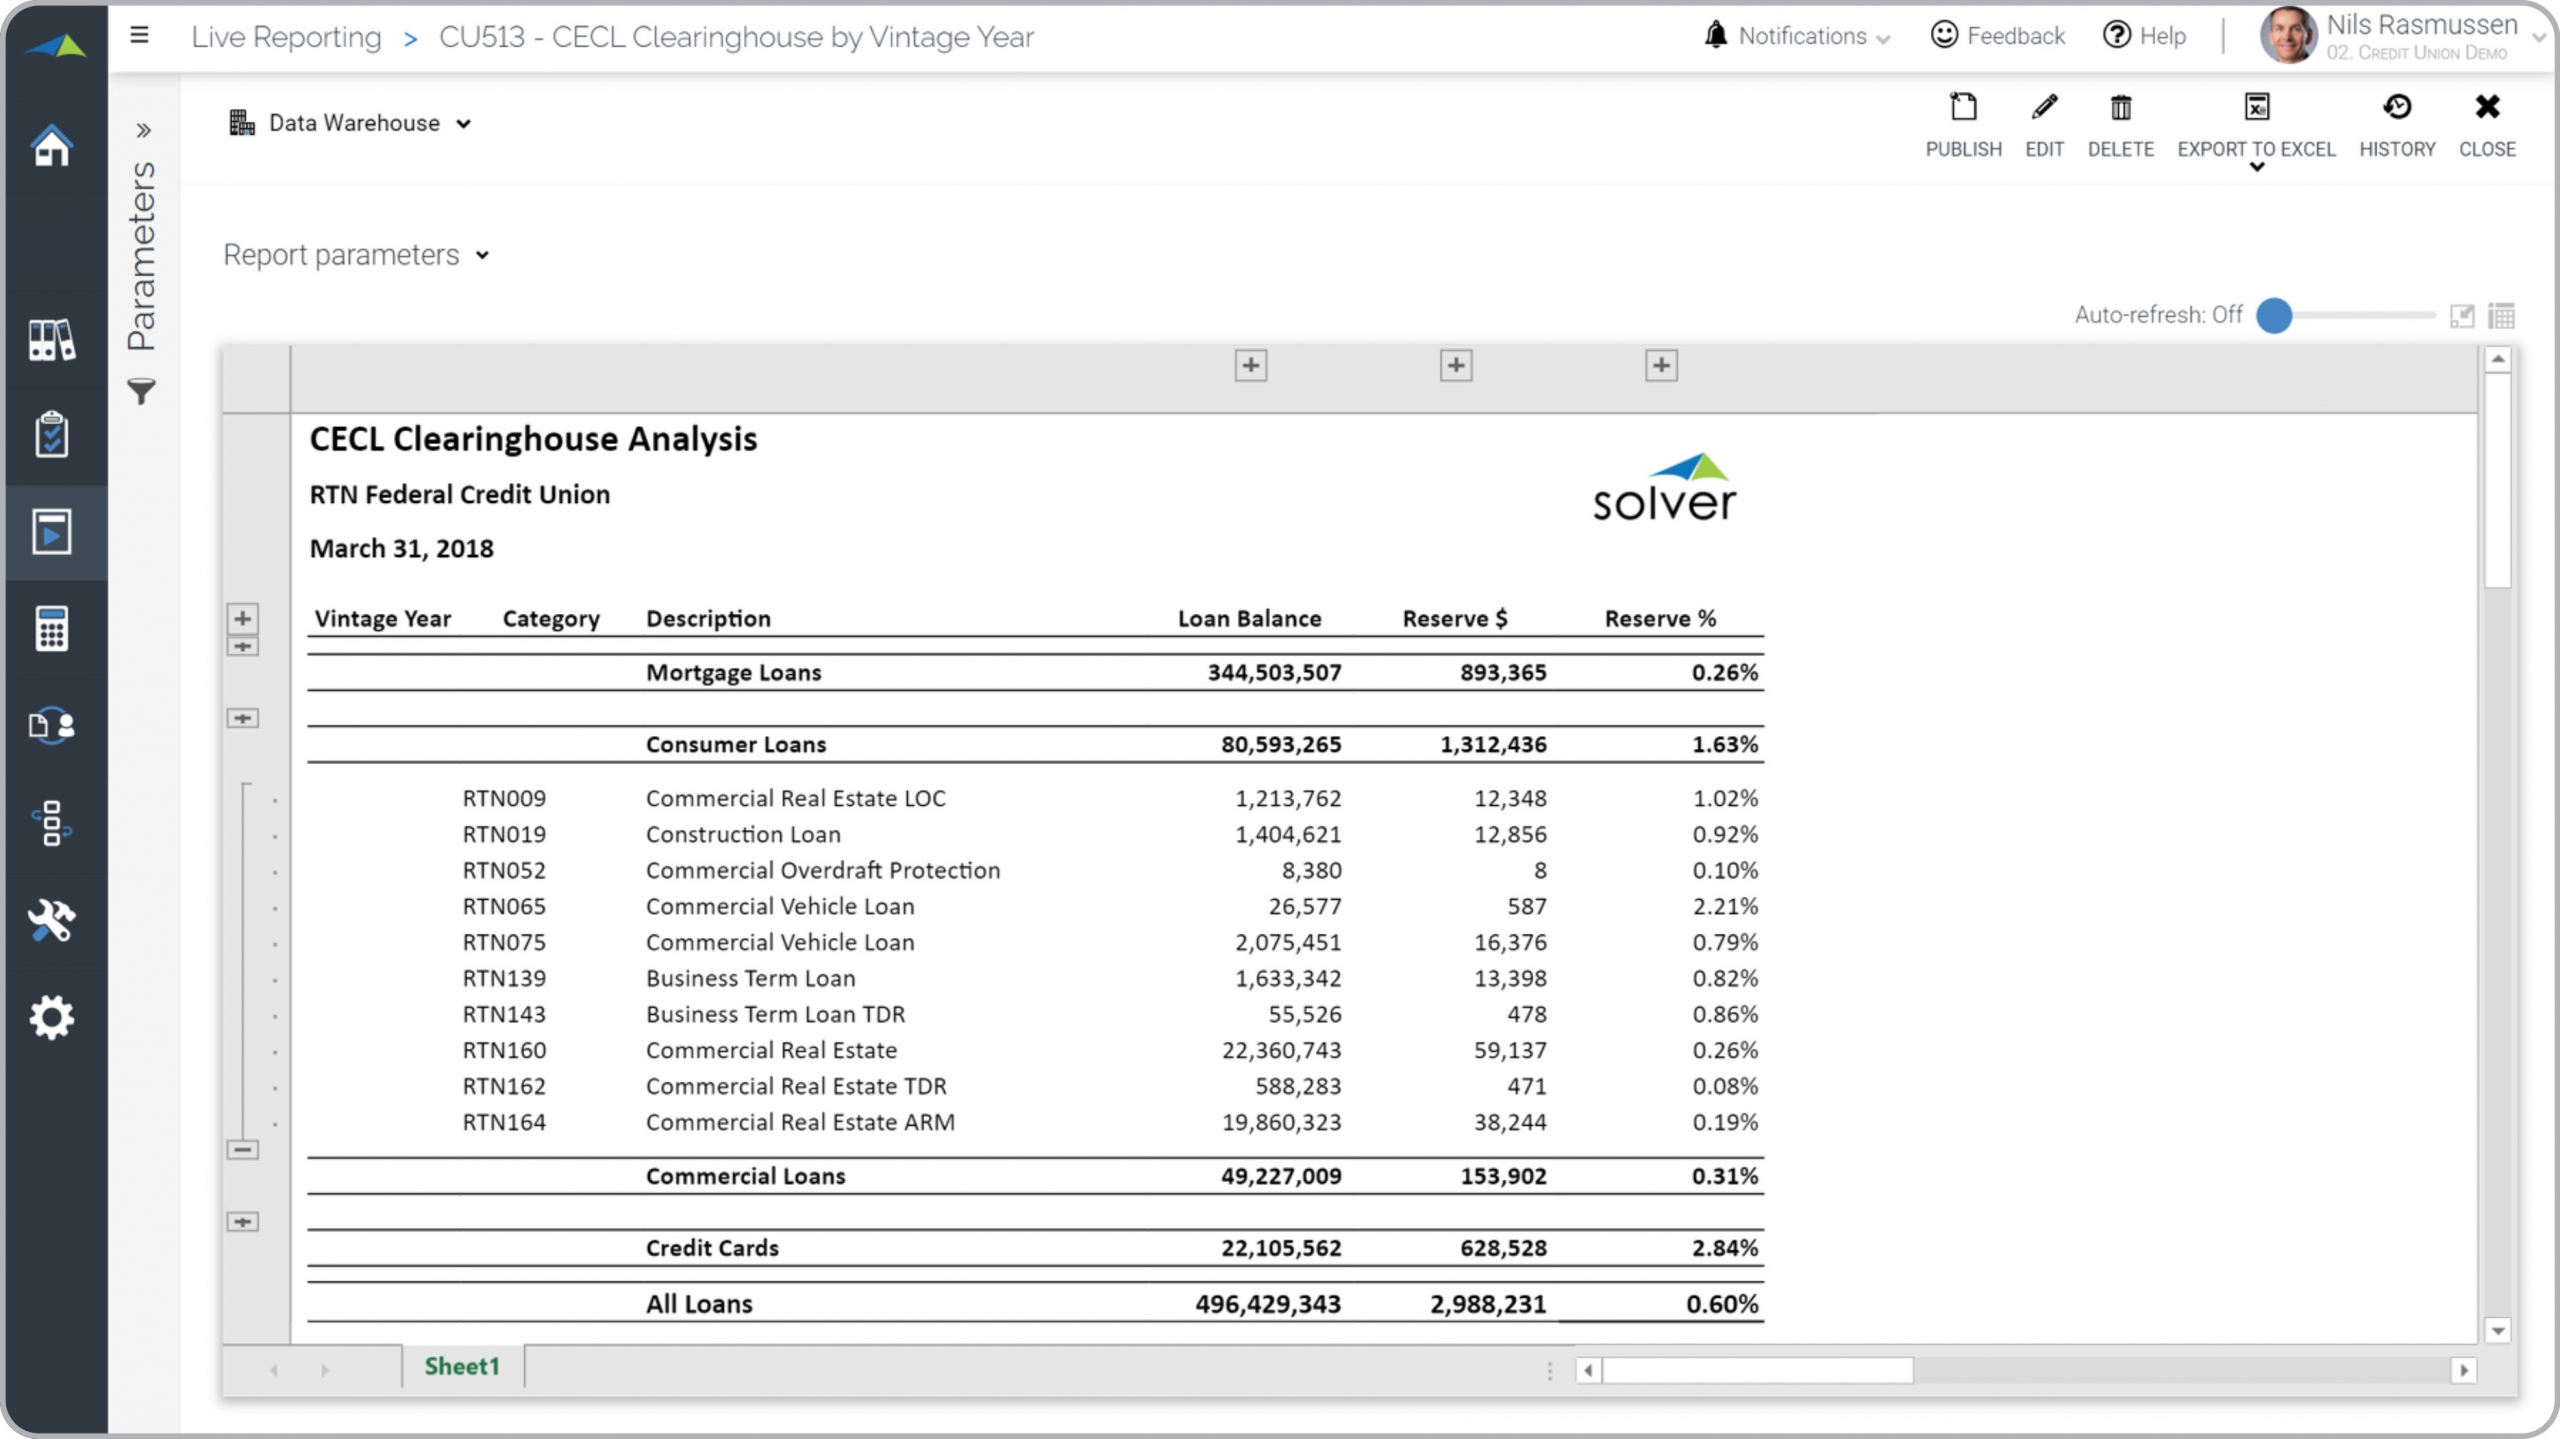
Credit Union – CECL Clearinghouse Analysis by Vintage Year
Clearinghouse analysis by vintage year.
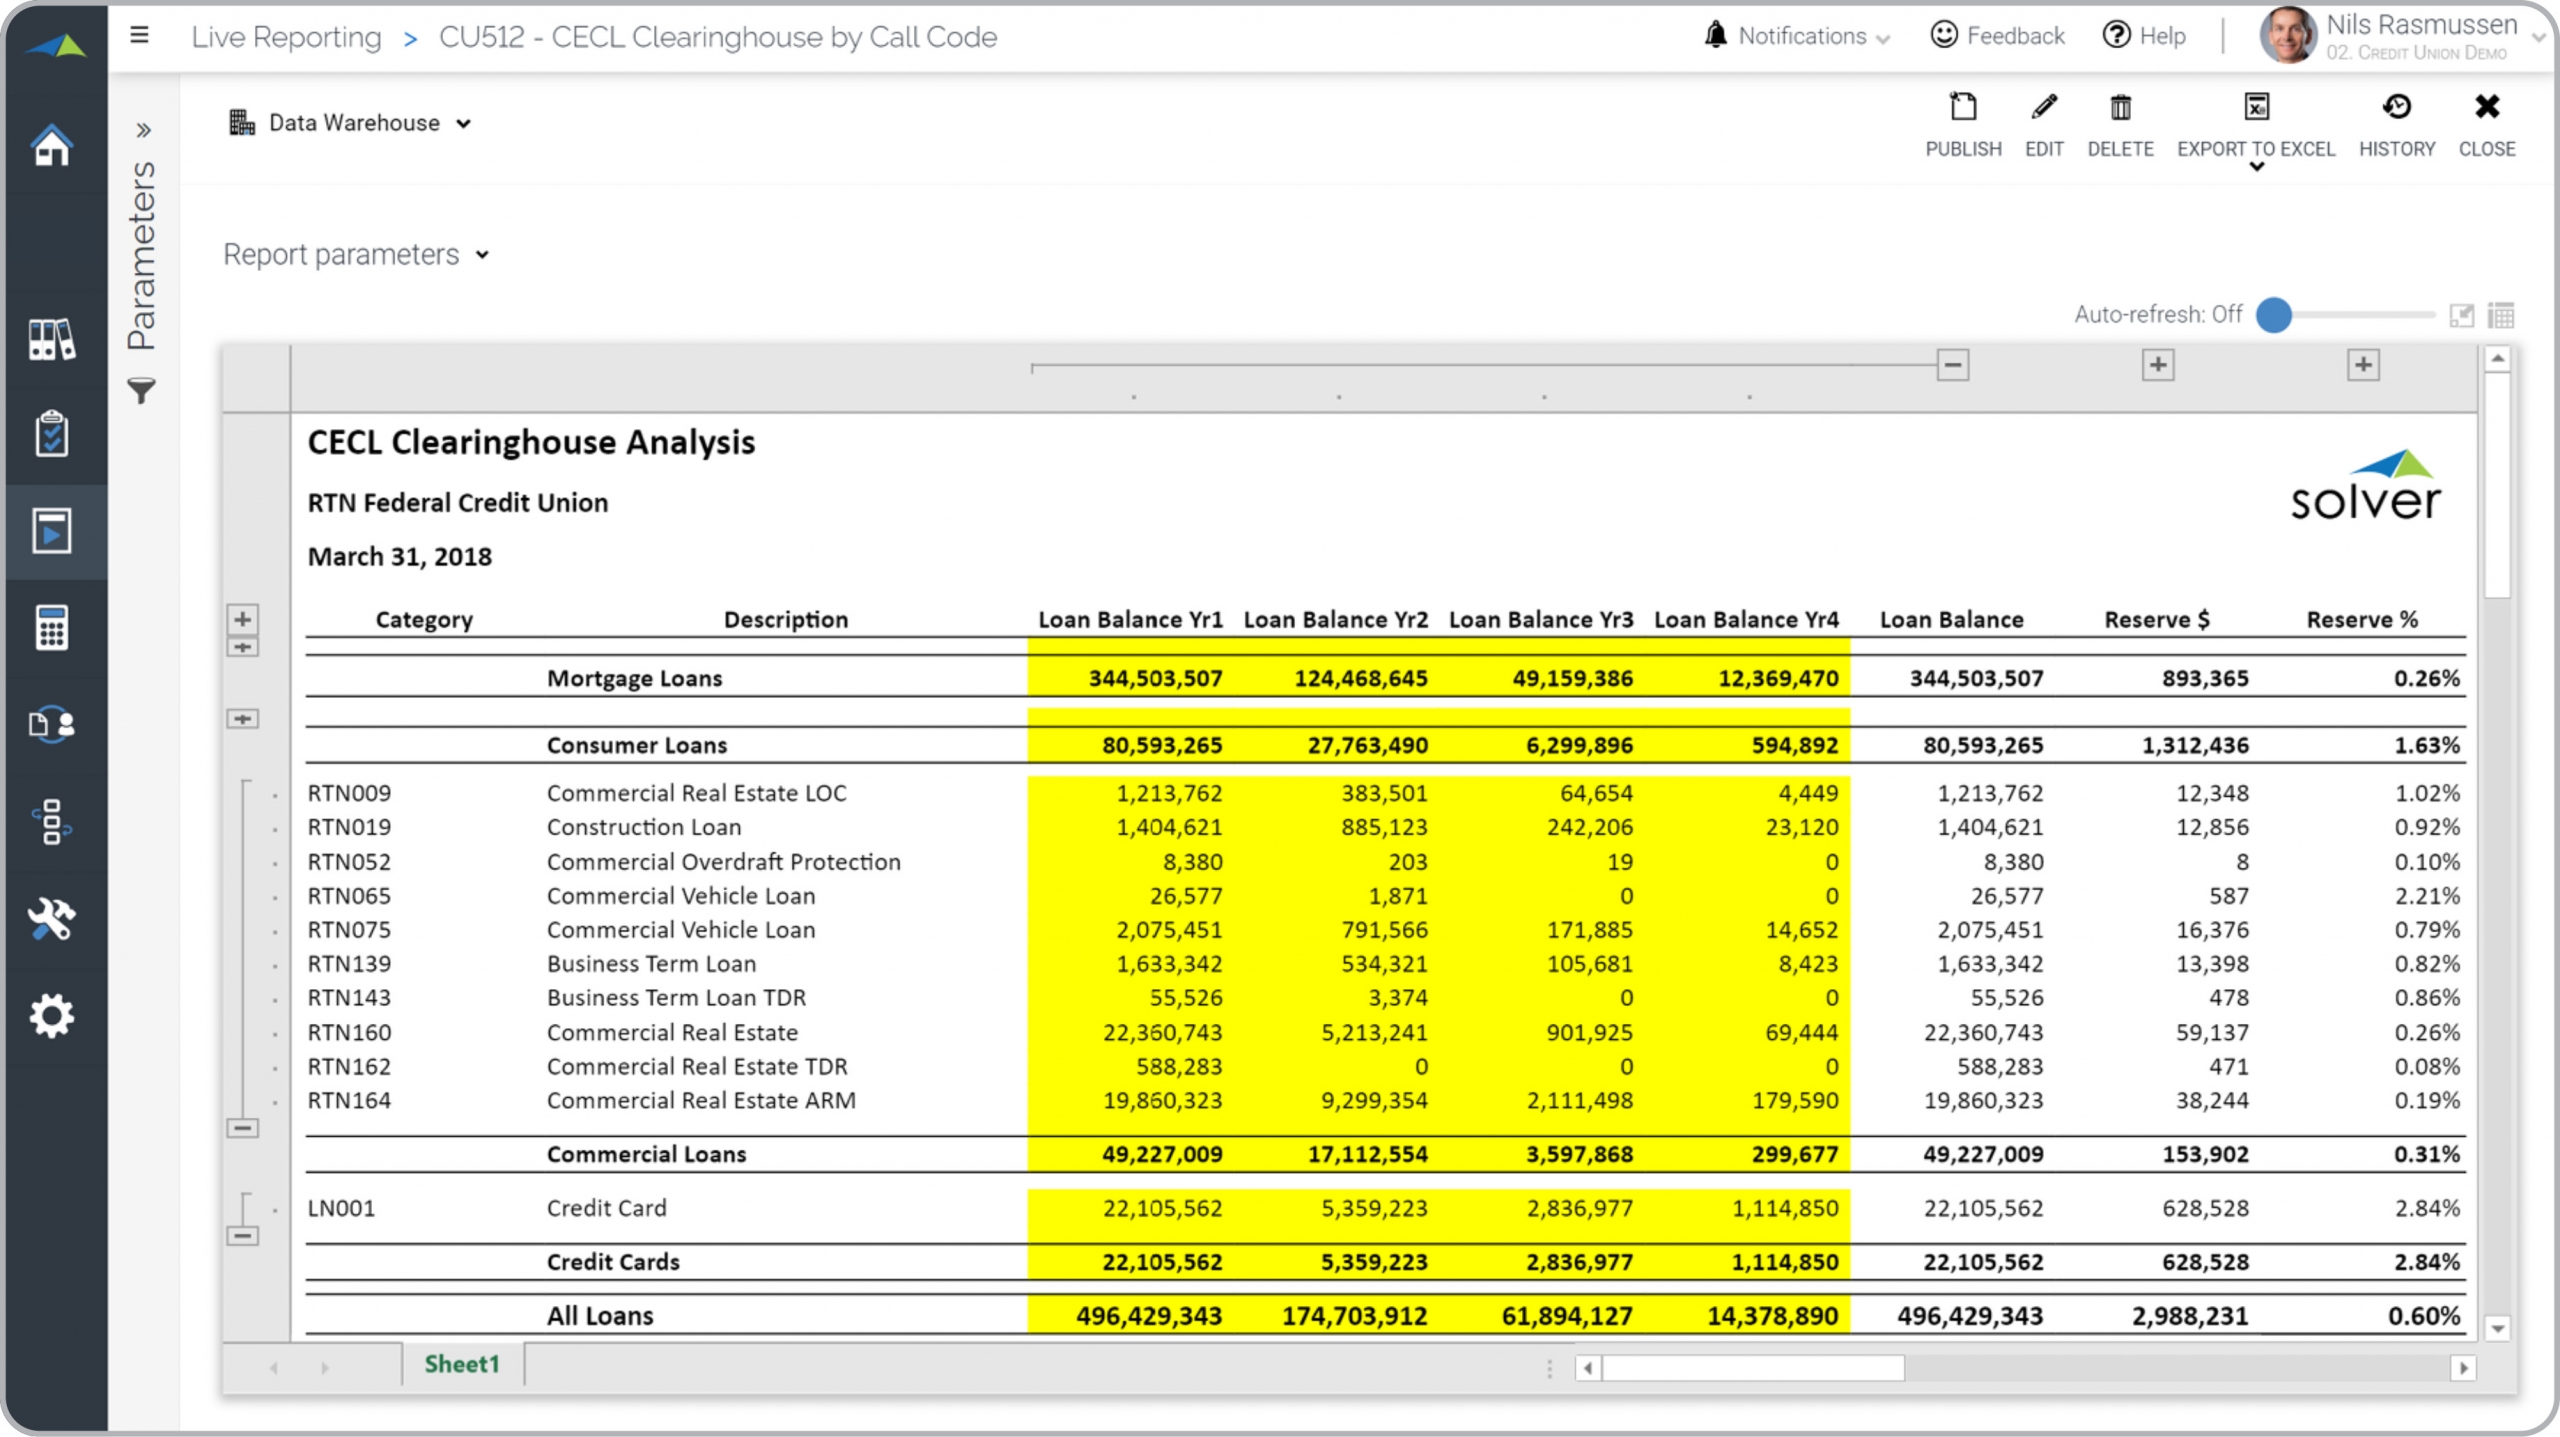
Credit Union – CECL Clearinghouse Analysis by Call Code
Clearinghouse analysis by Call Code.
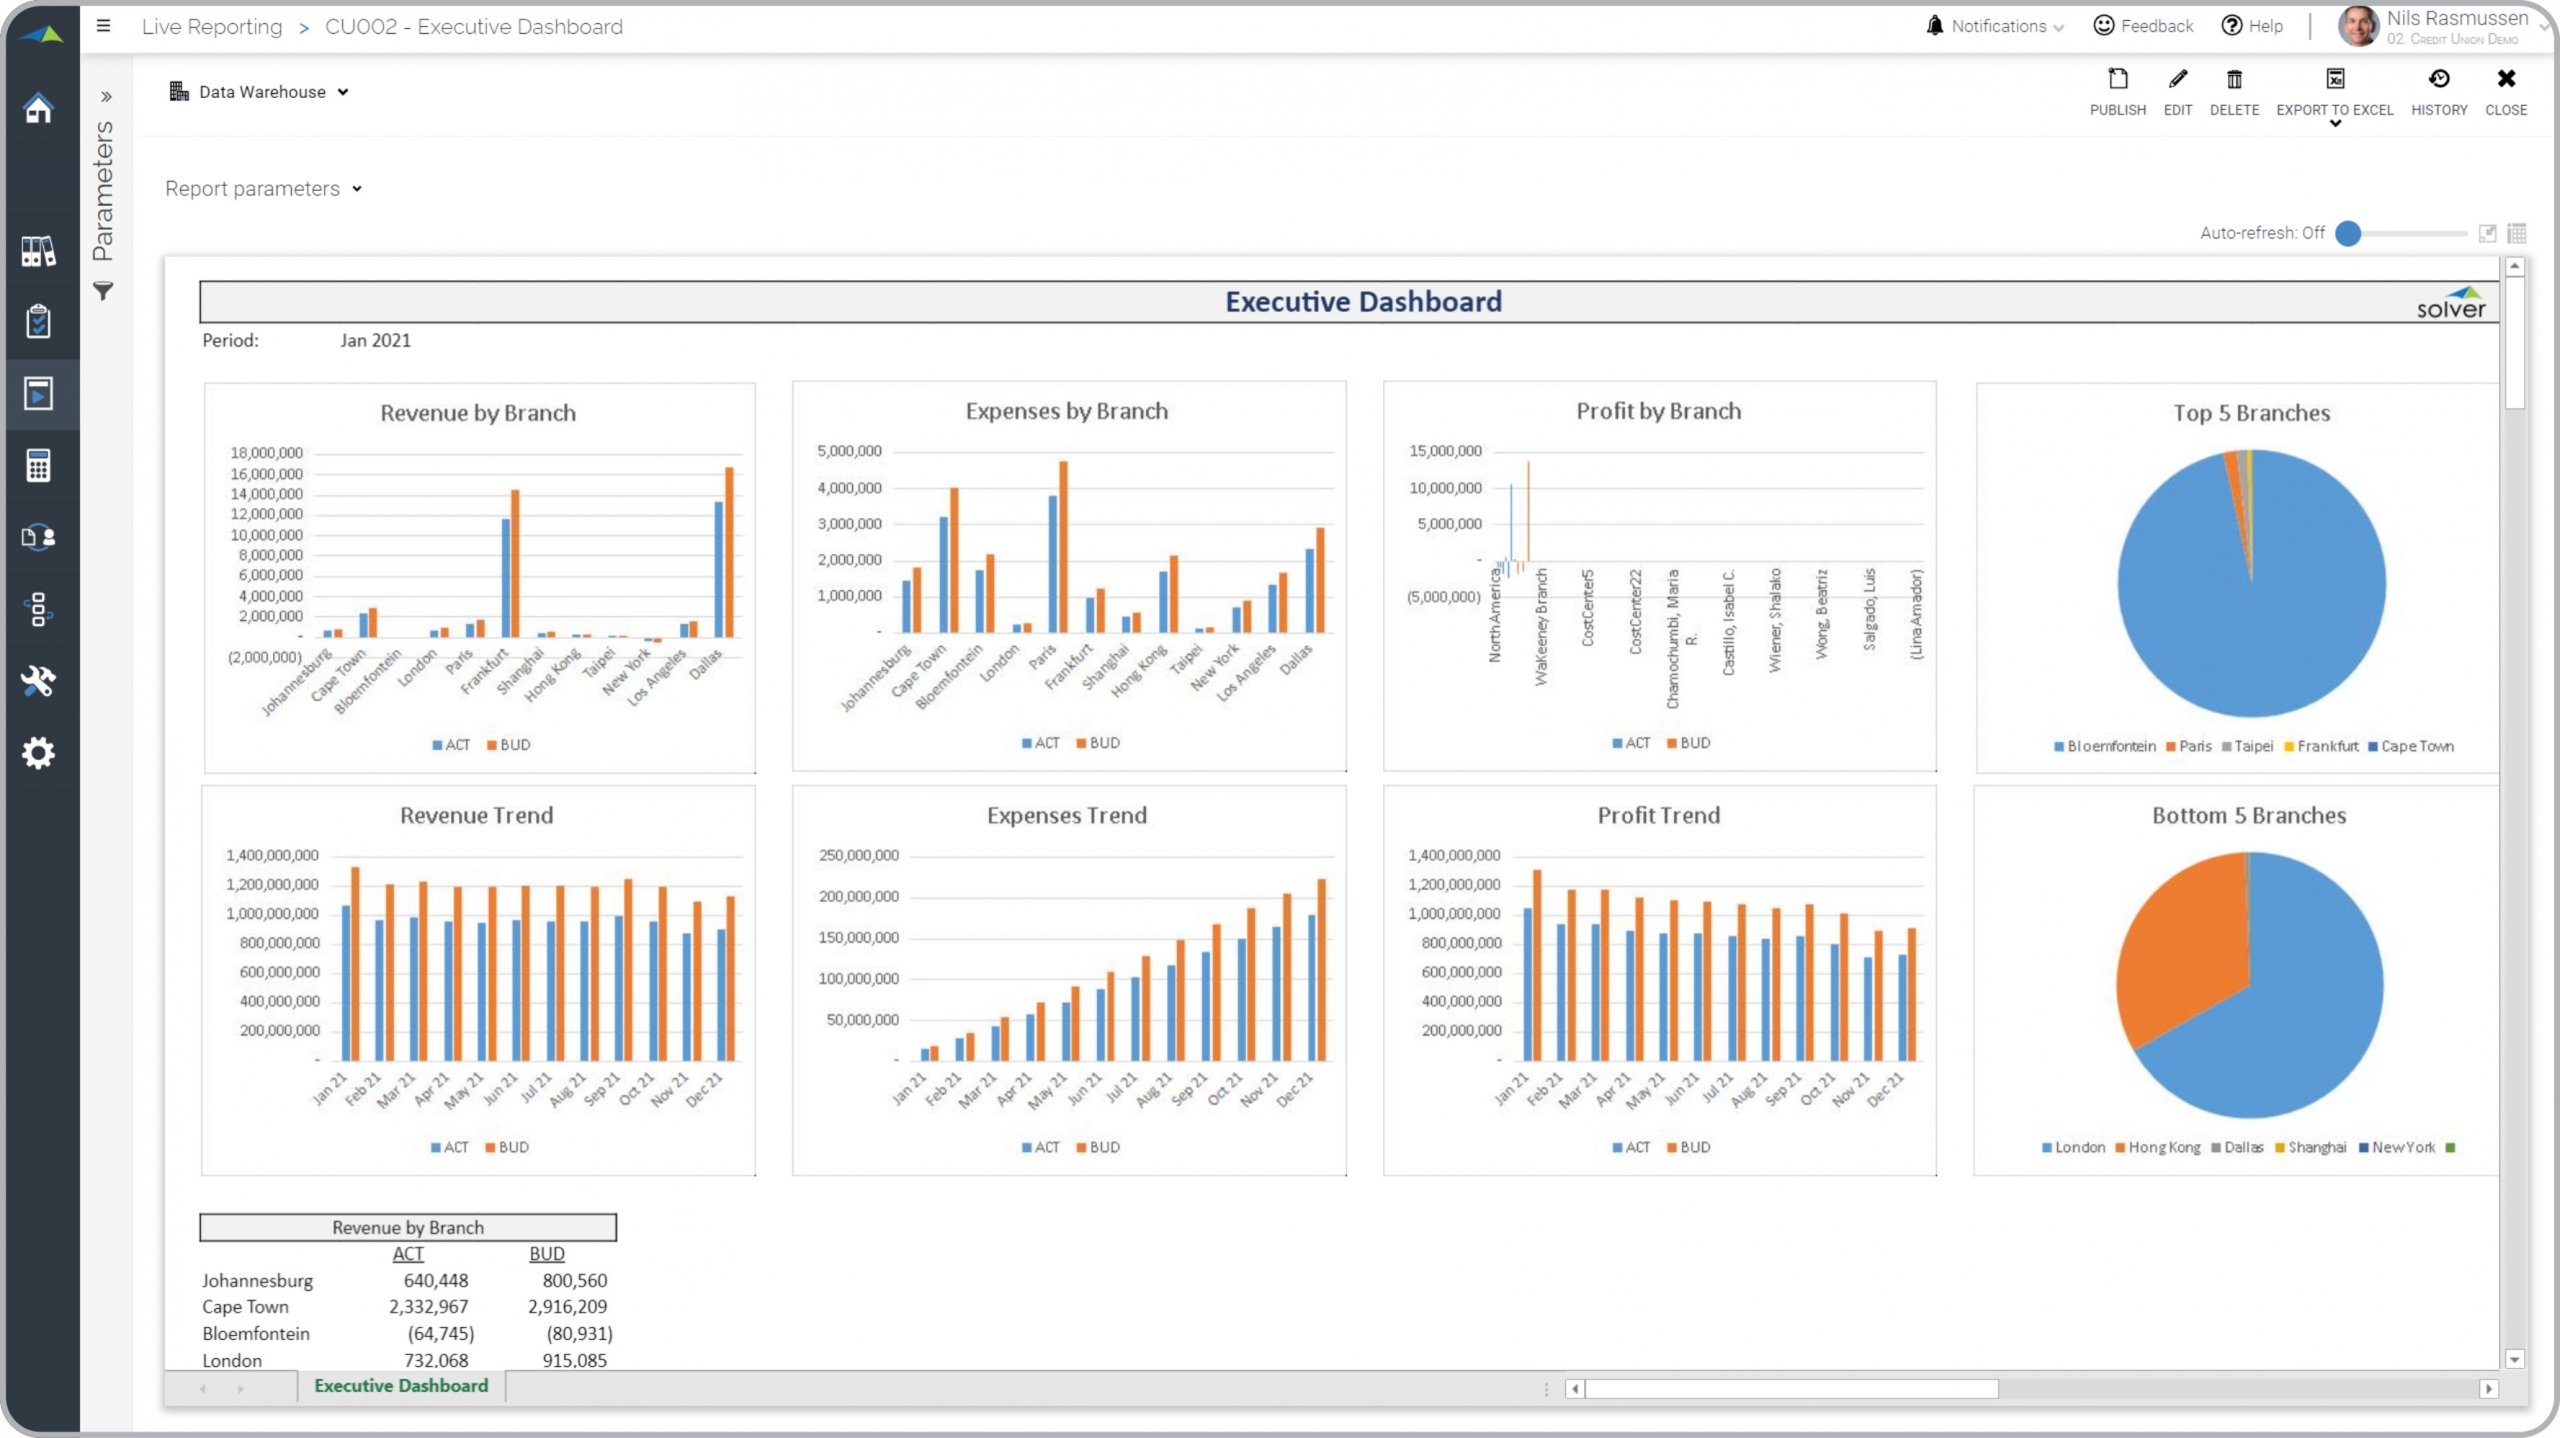
Credit Union – Executive Dashboard
Revenue, Expense and Profit by month and branch comparison.
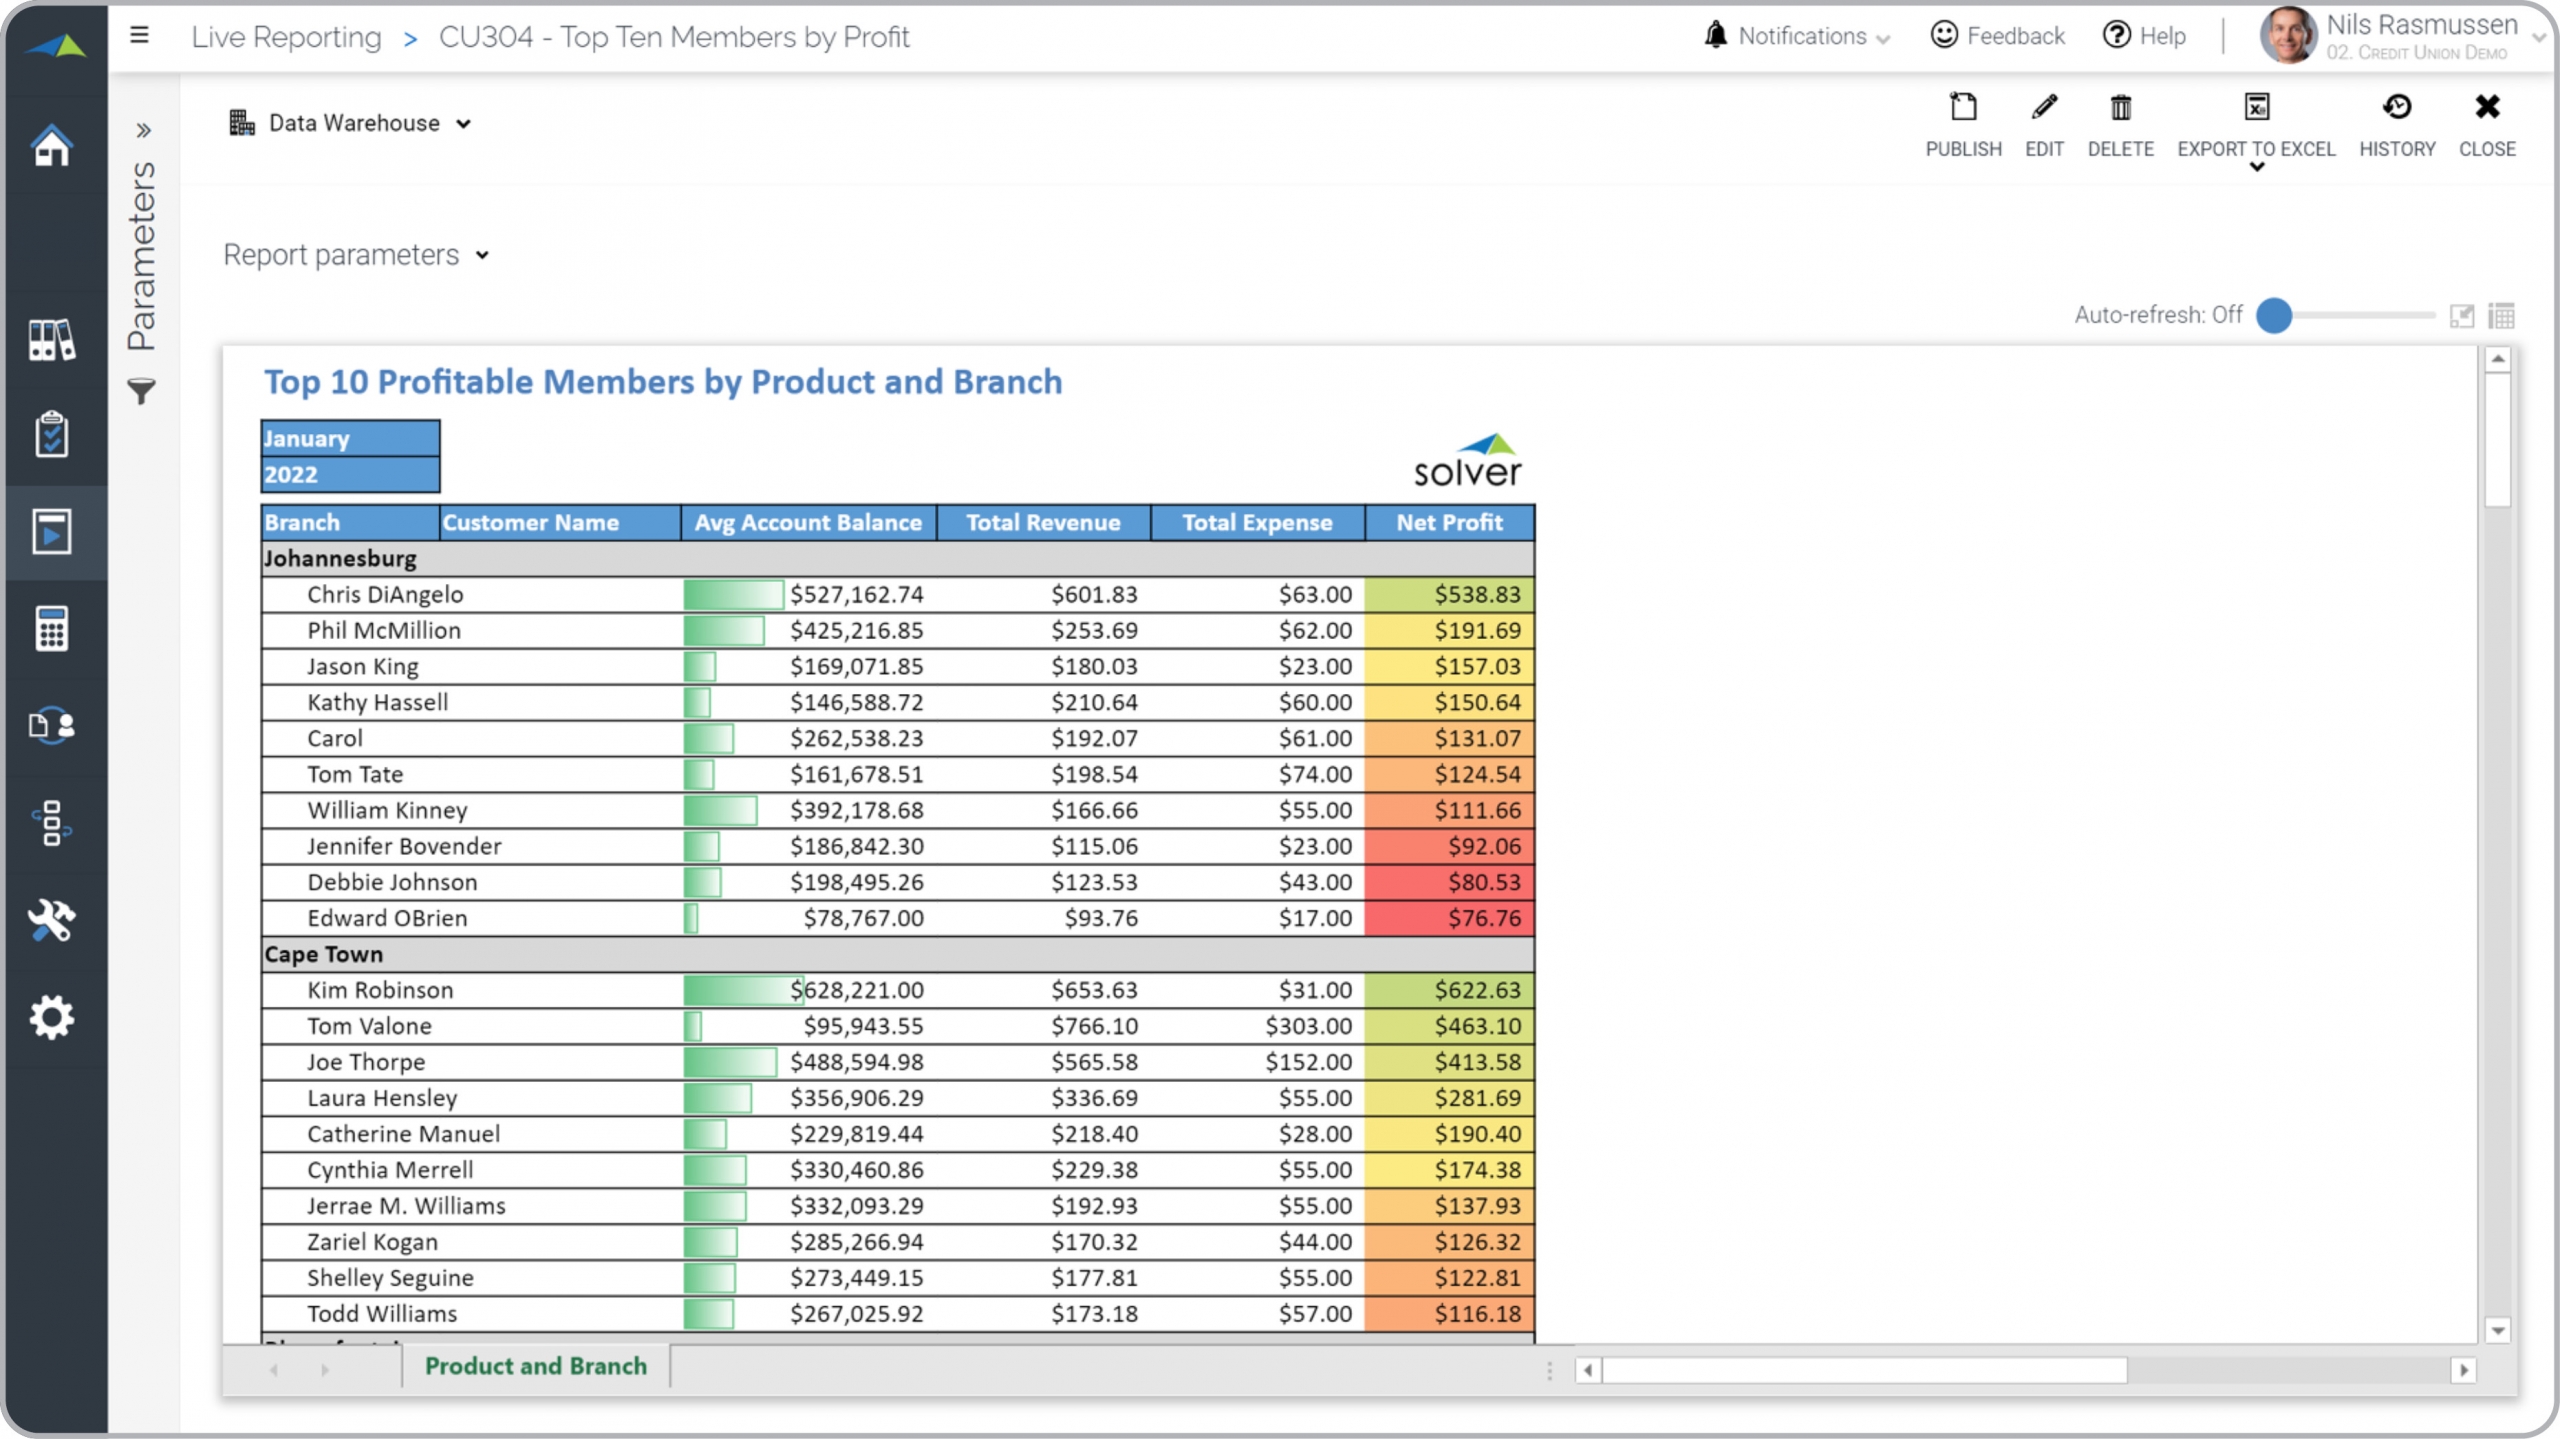
Credit Union – Top 10 Members by Profit
Top members by branch, ranked by Net Profit.
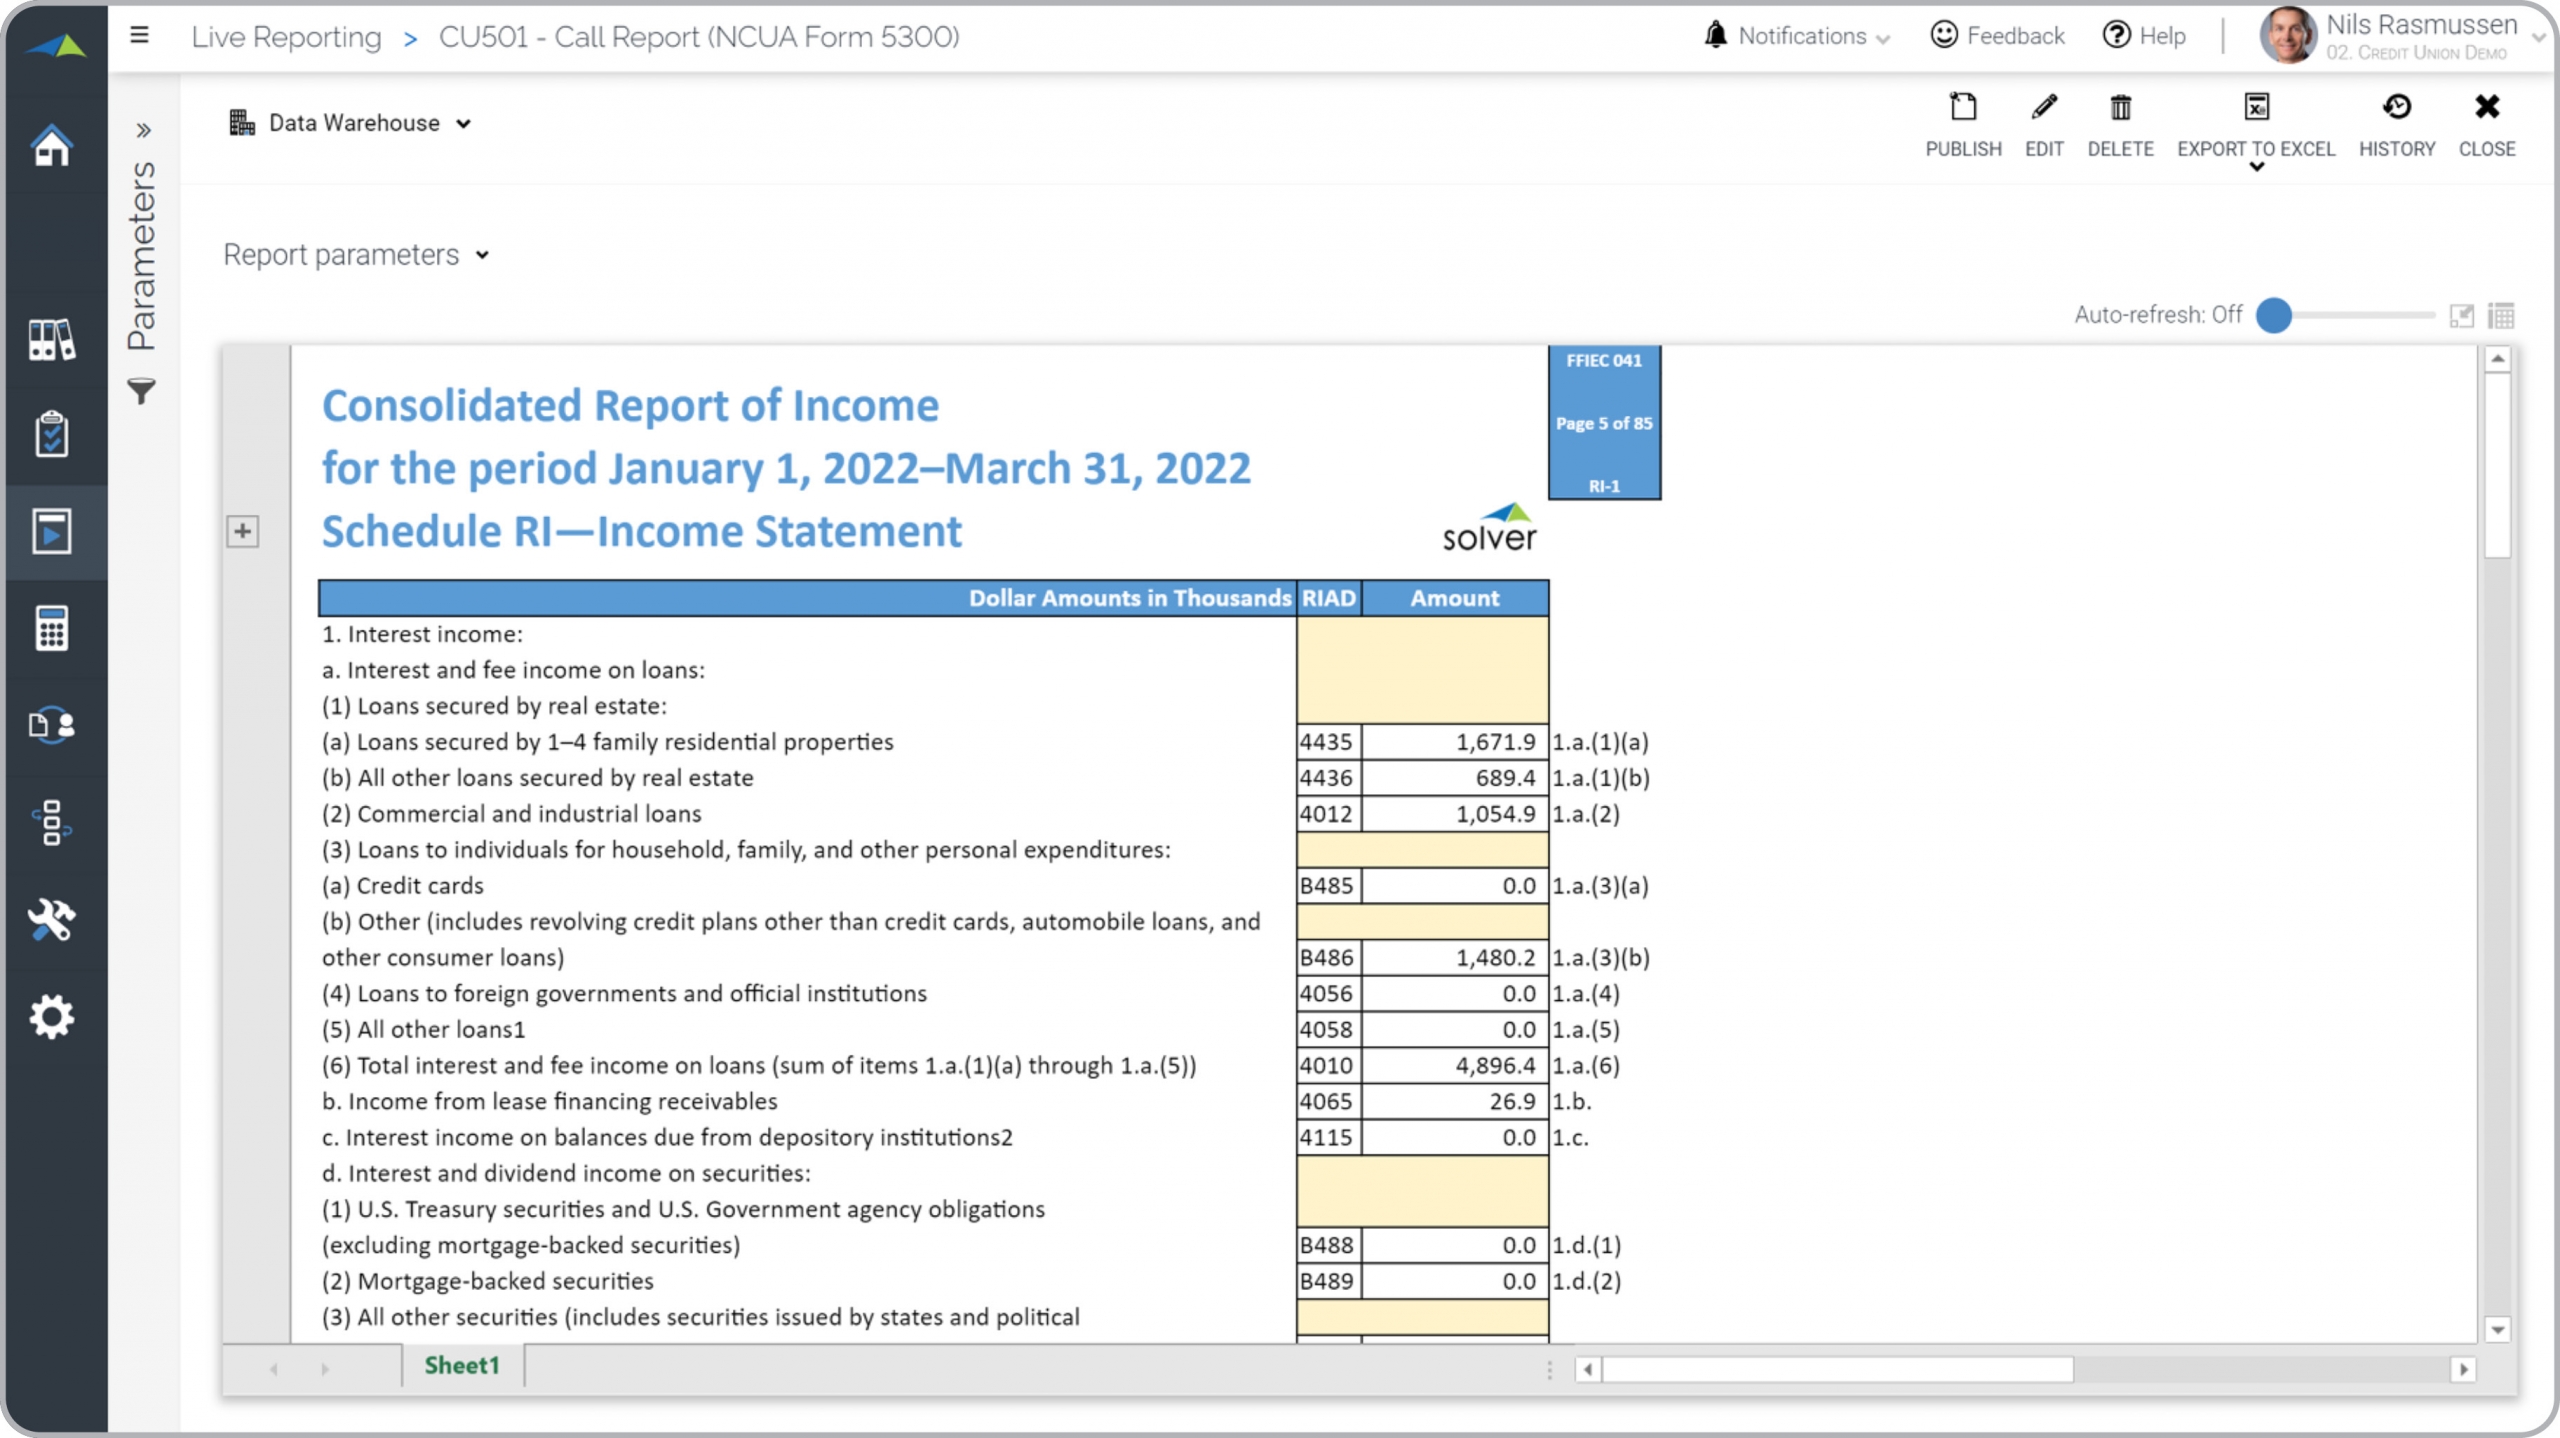
Credit Union – Call Report NCUA 5300
NCUA form 5300 with specific layout.
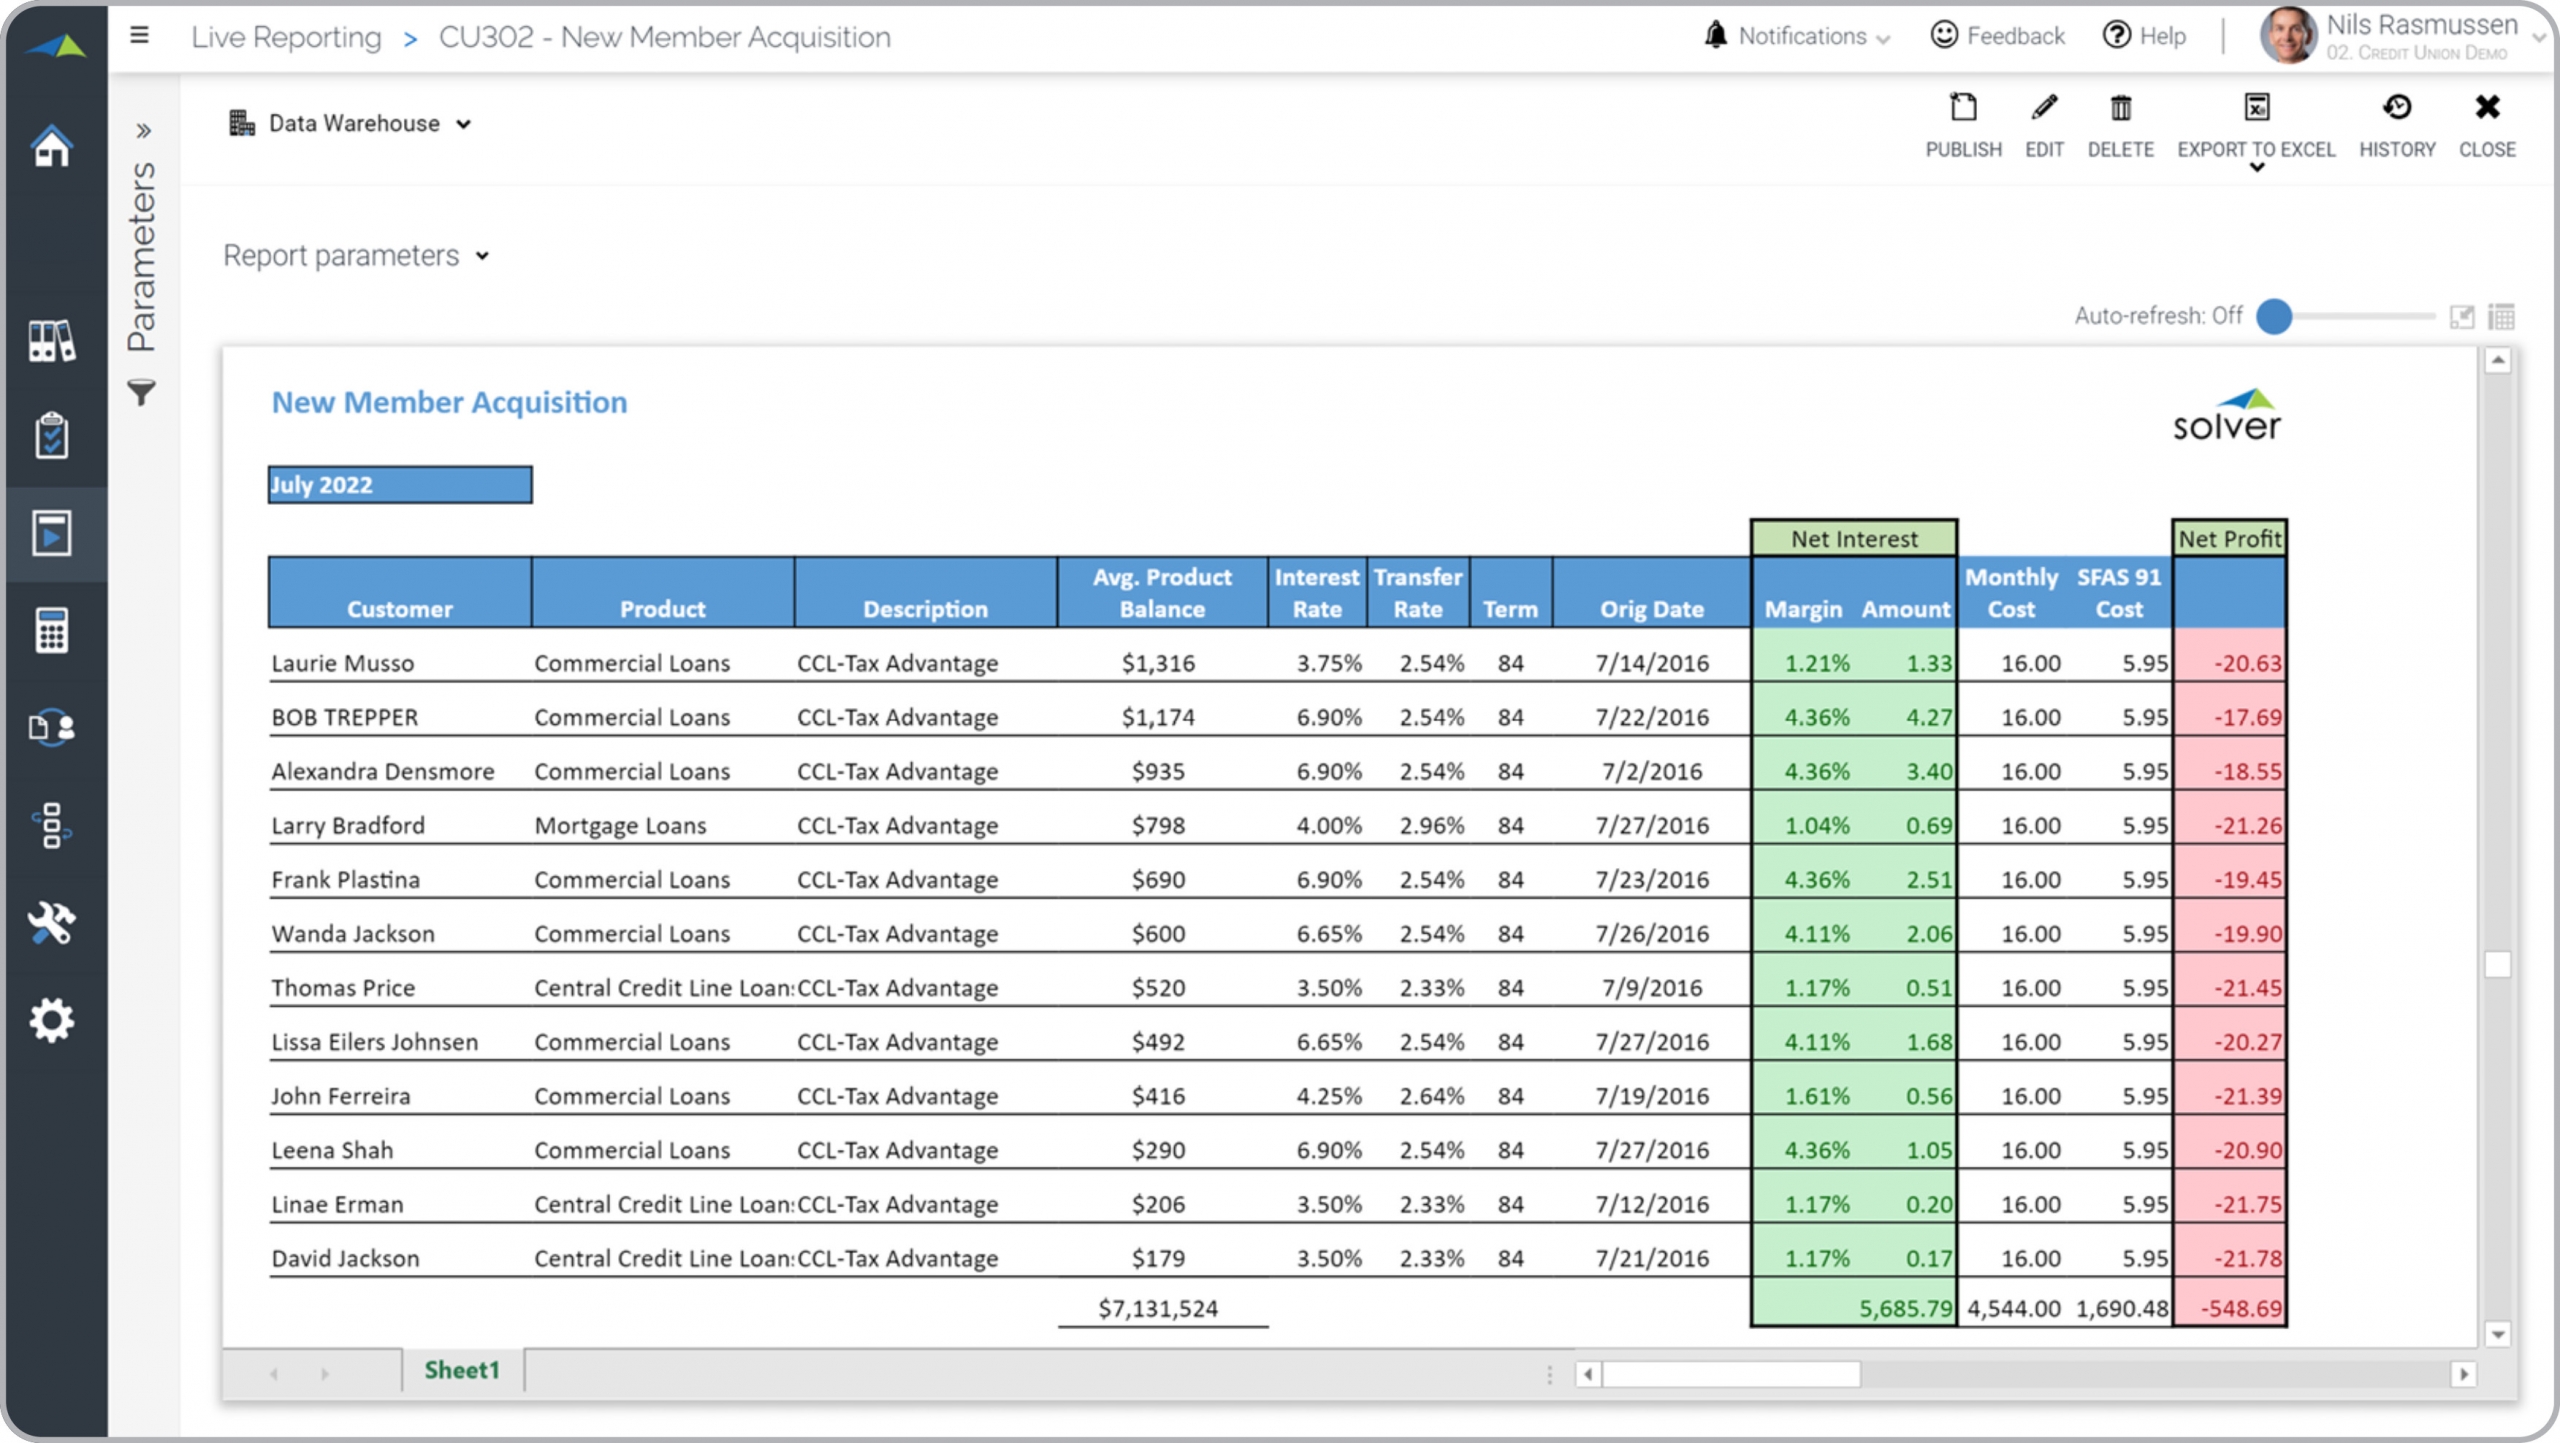
Credit Union – New Member Acquisition
Analysis of profit and other metrics for newly acquired members.
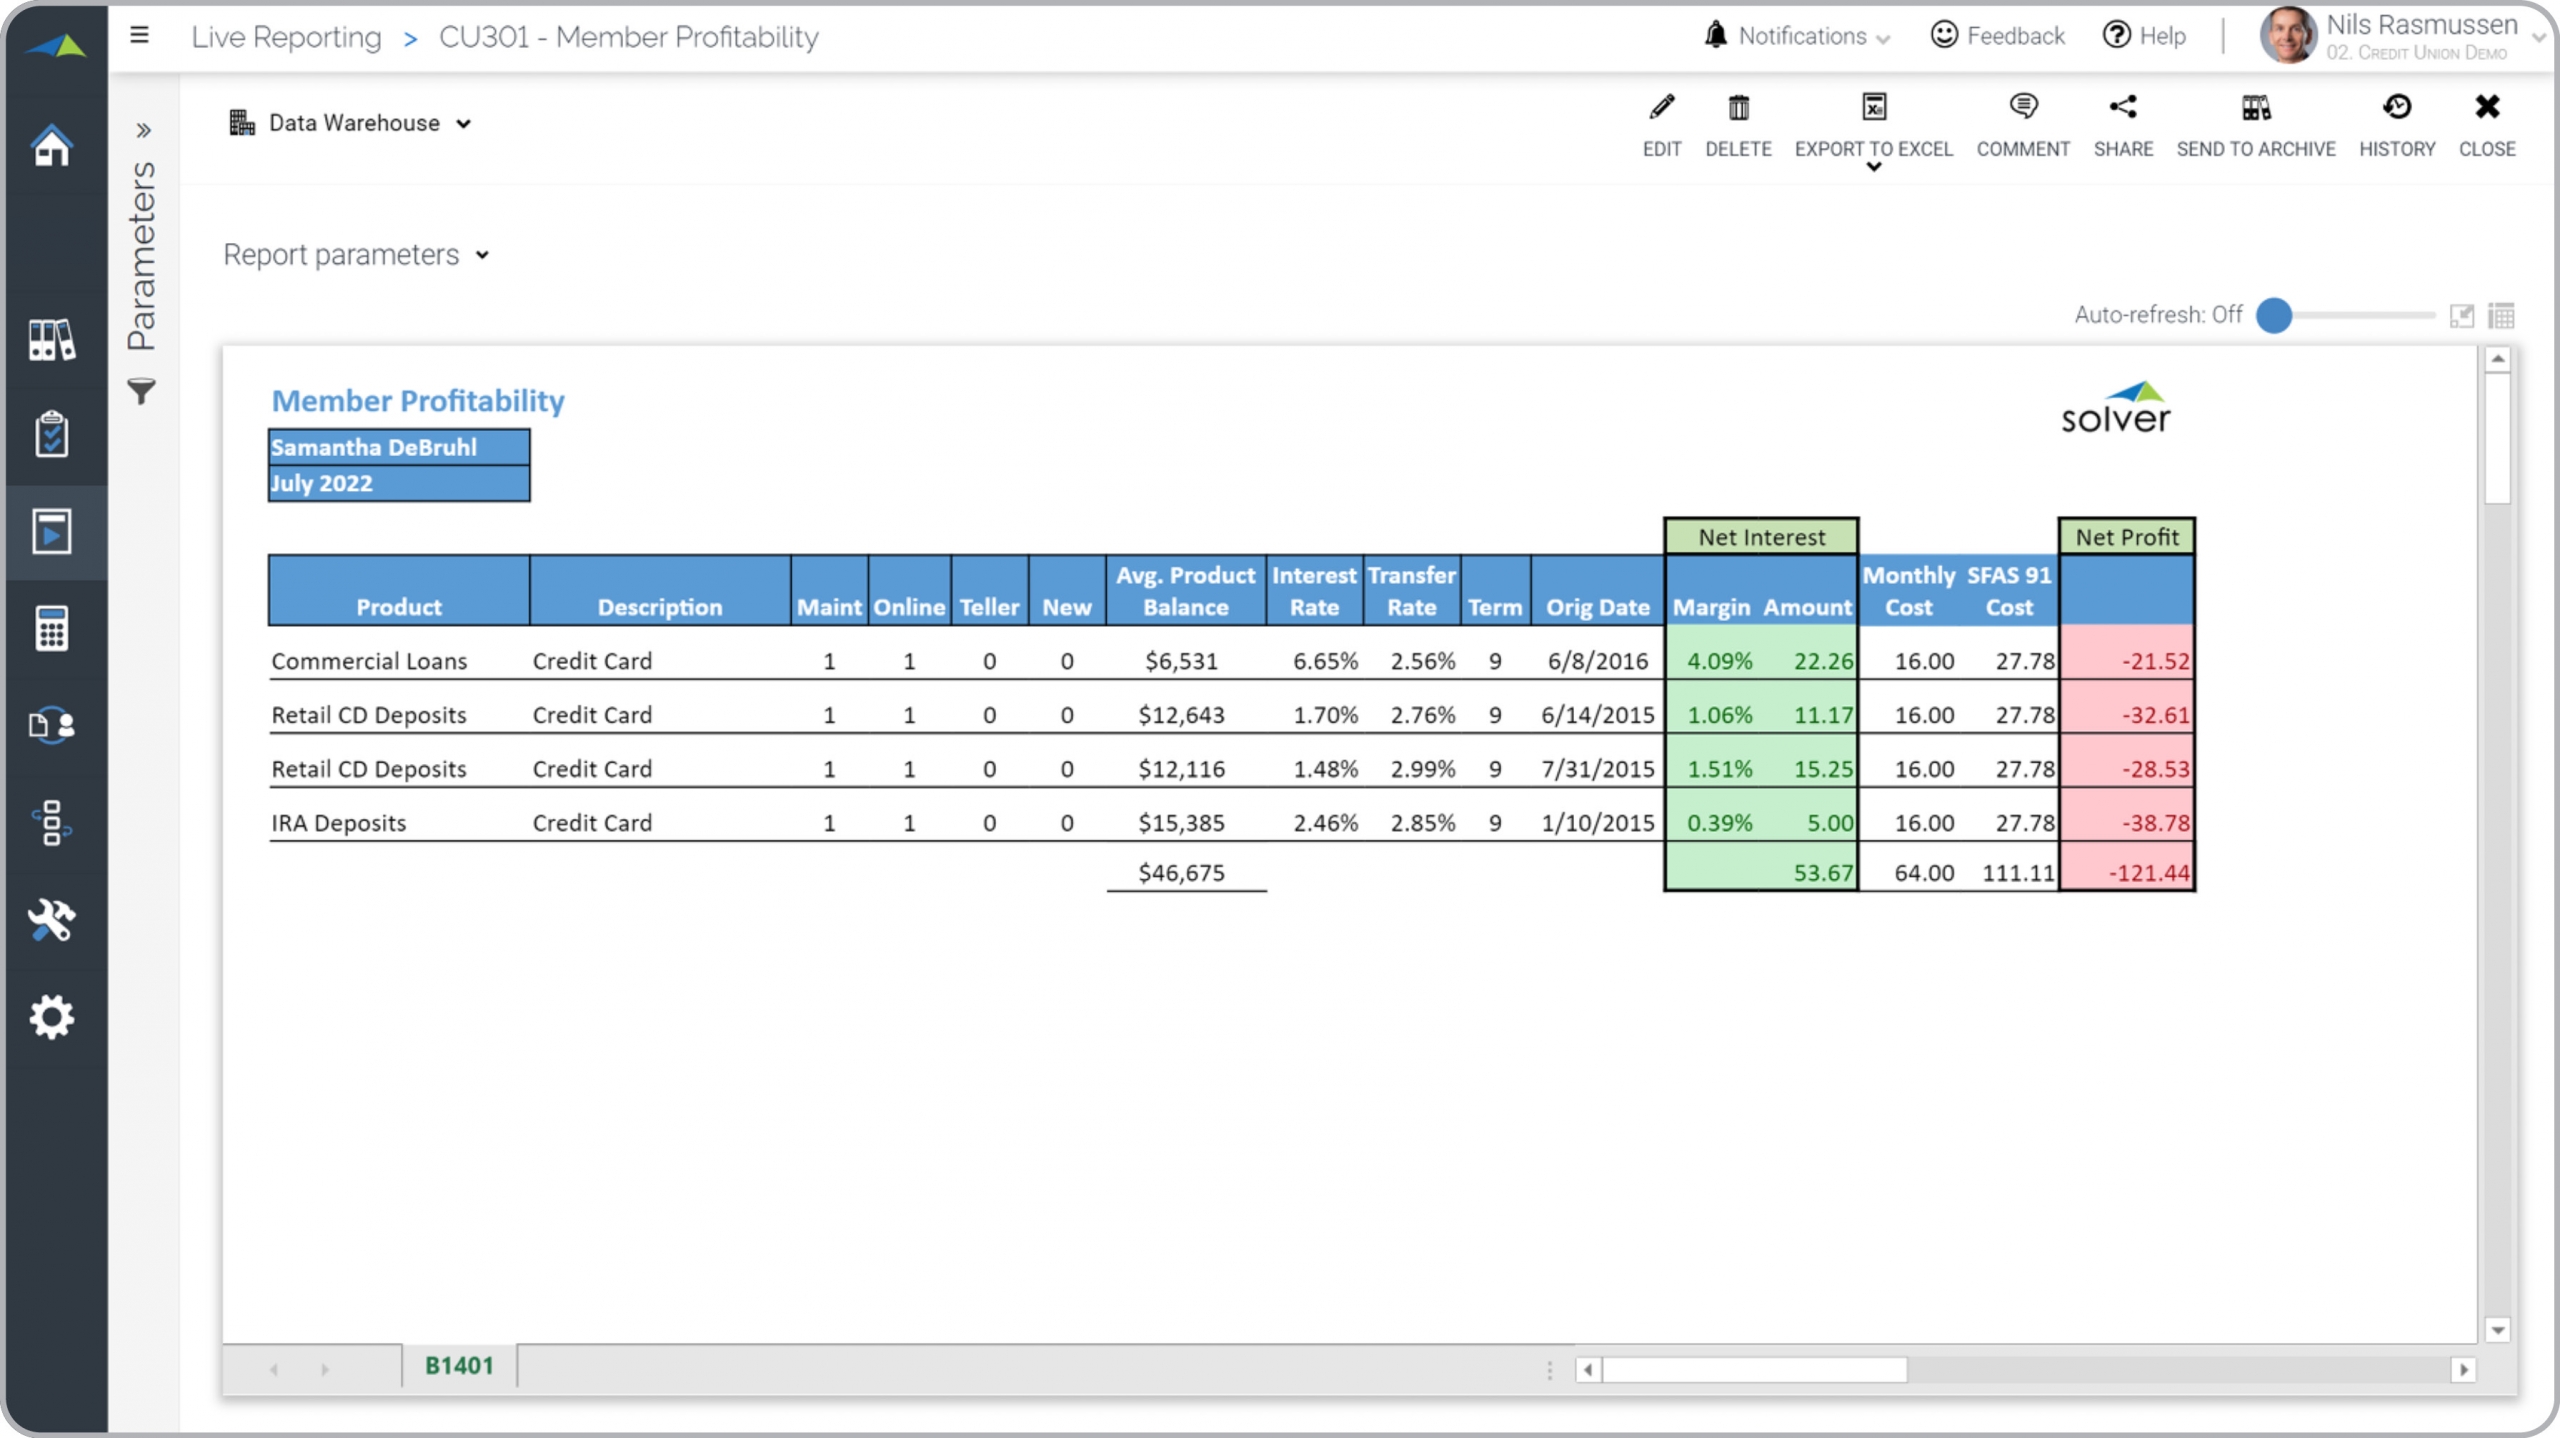
Credit Union – Member Profitability
Interest and profit by product for individual members.

Credit Union – Individual Account Profitability
Interest and profit by product for individual accounts.
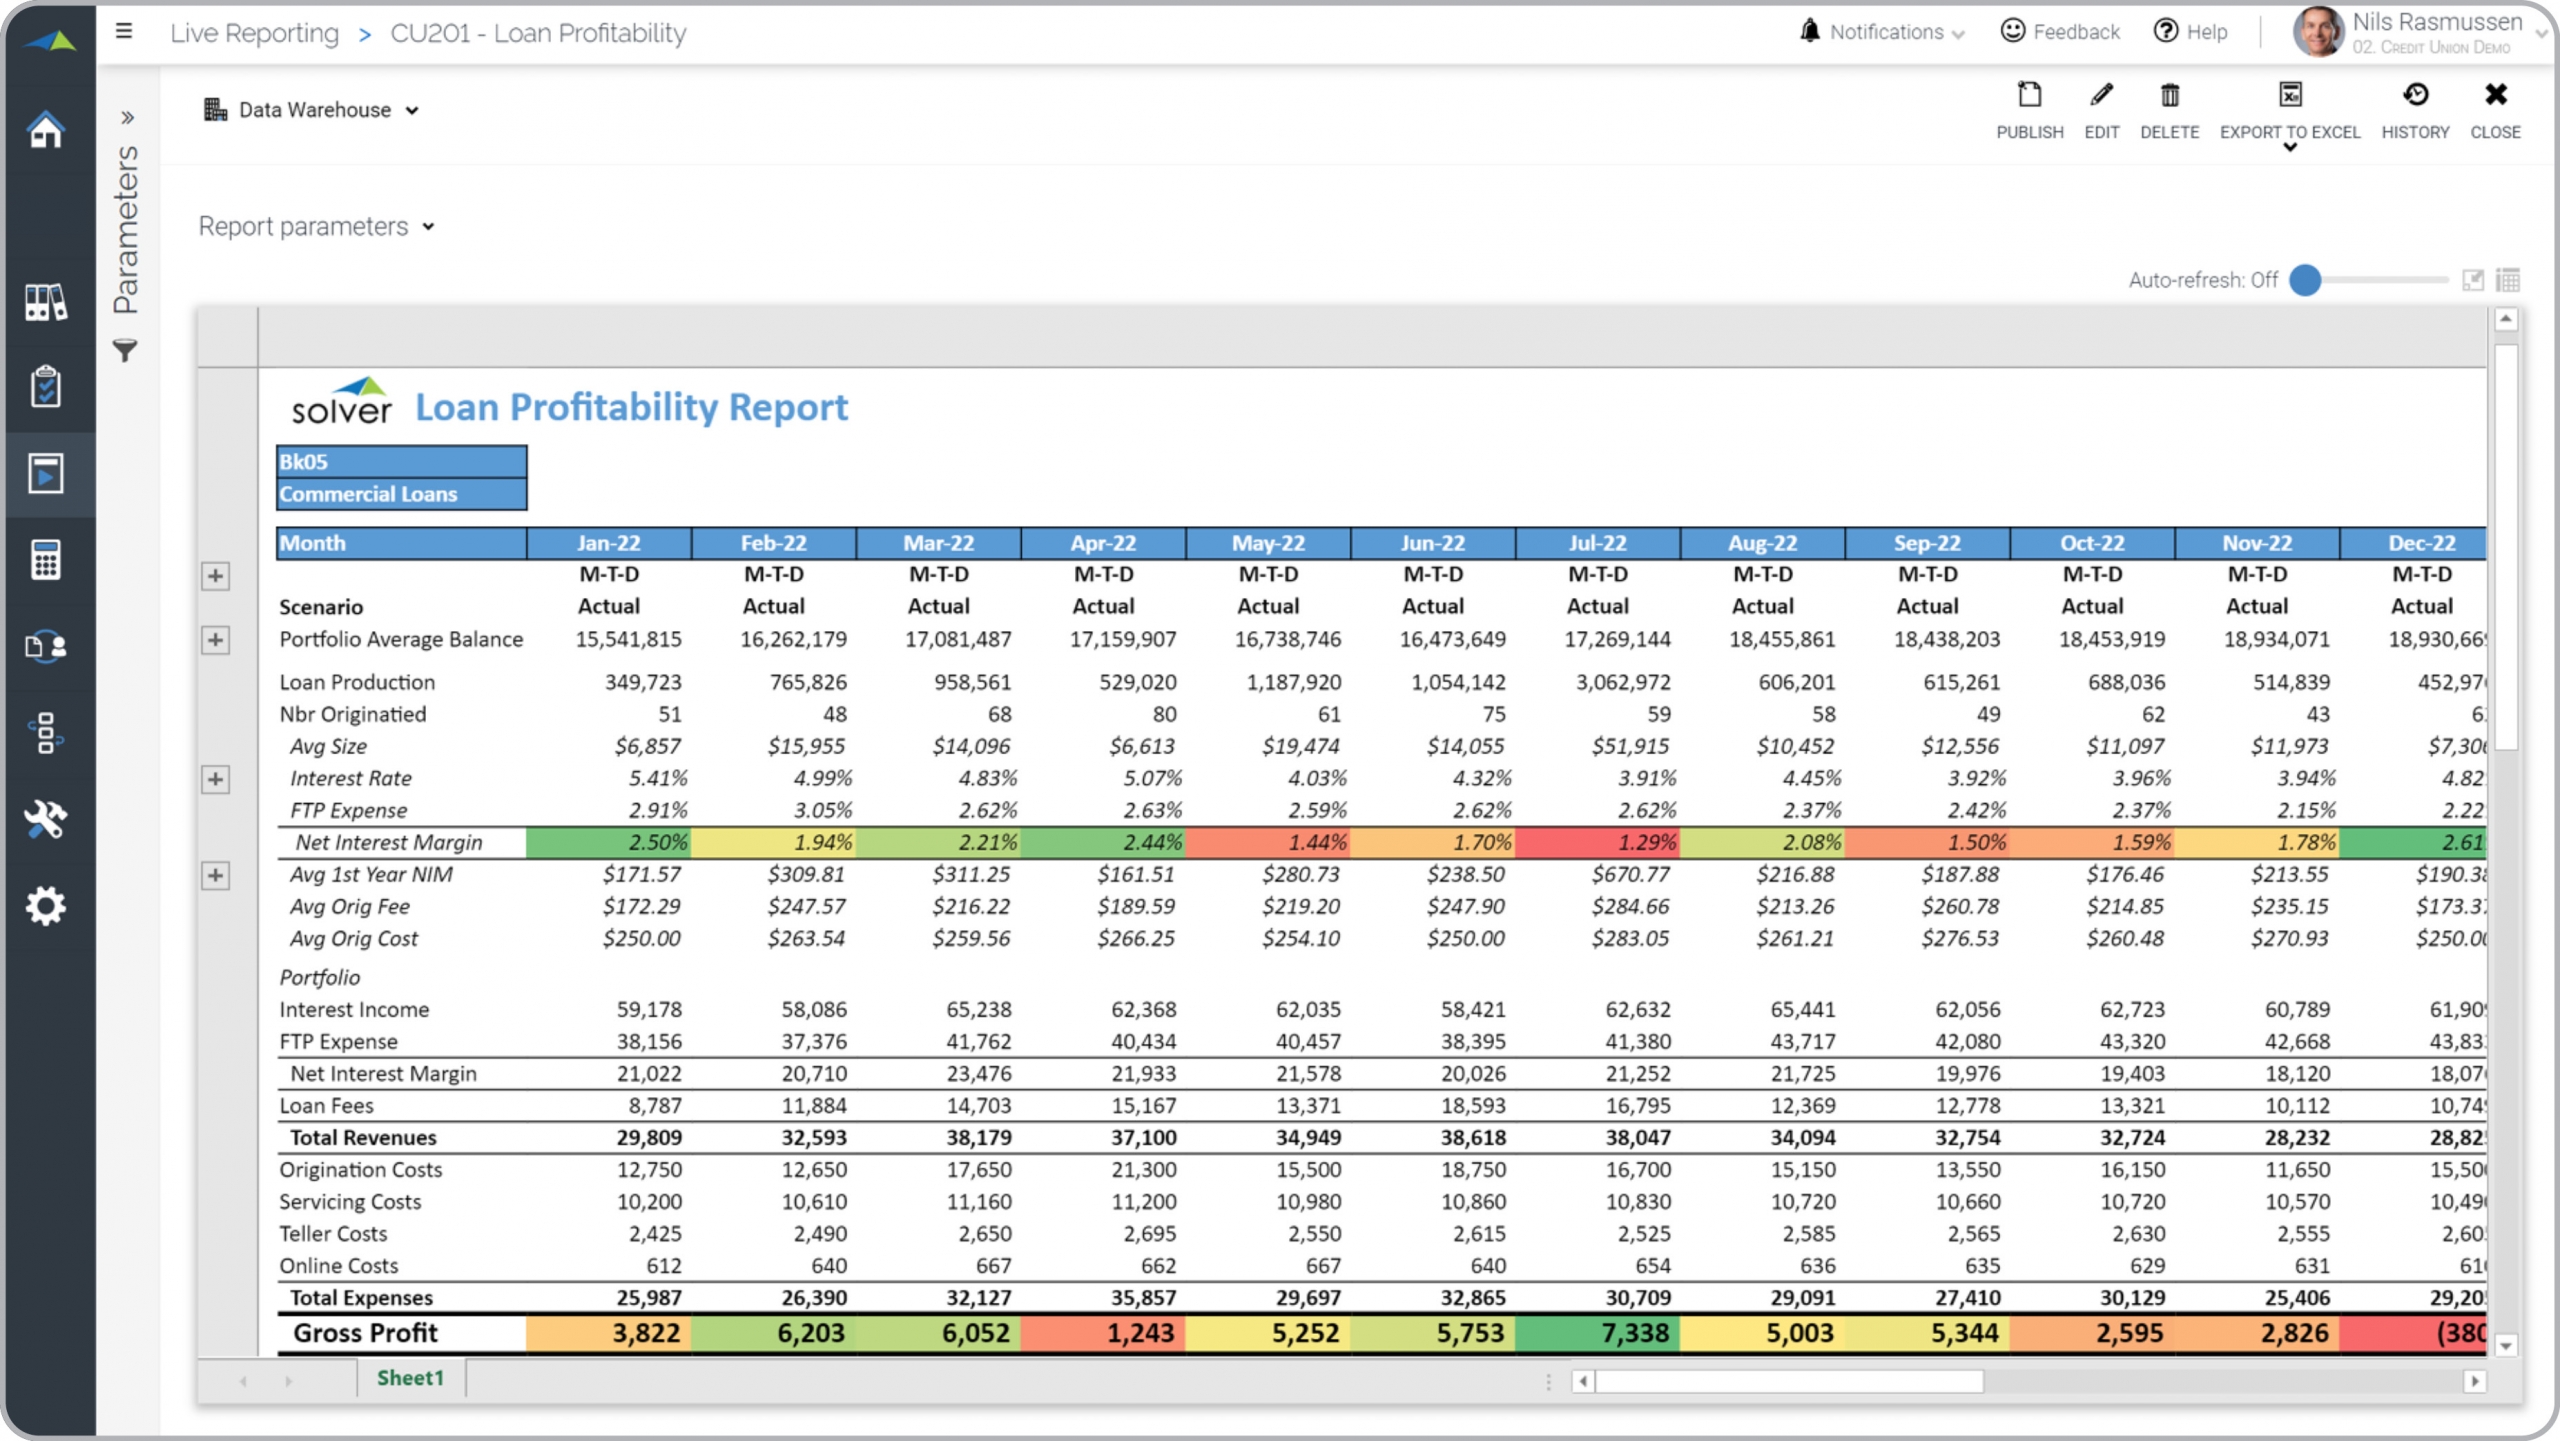
Credit Union – Loan Profitability Report
Monthly trend analysis of loan profitability.
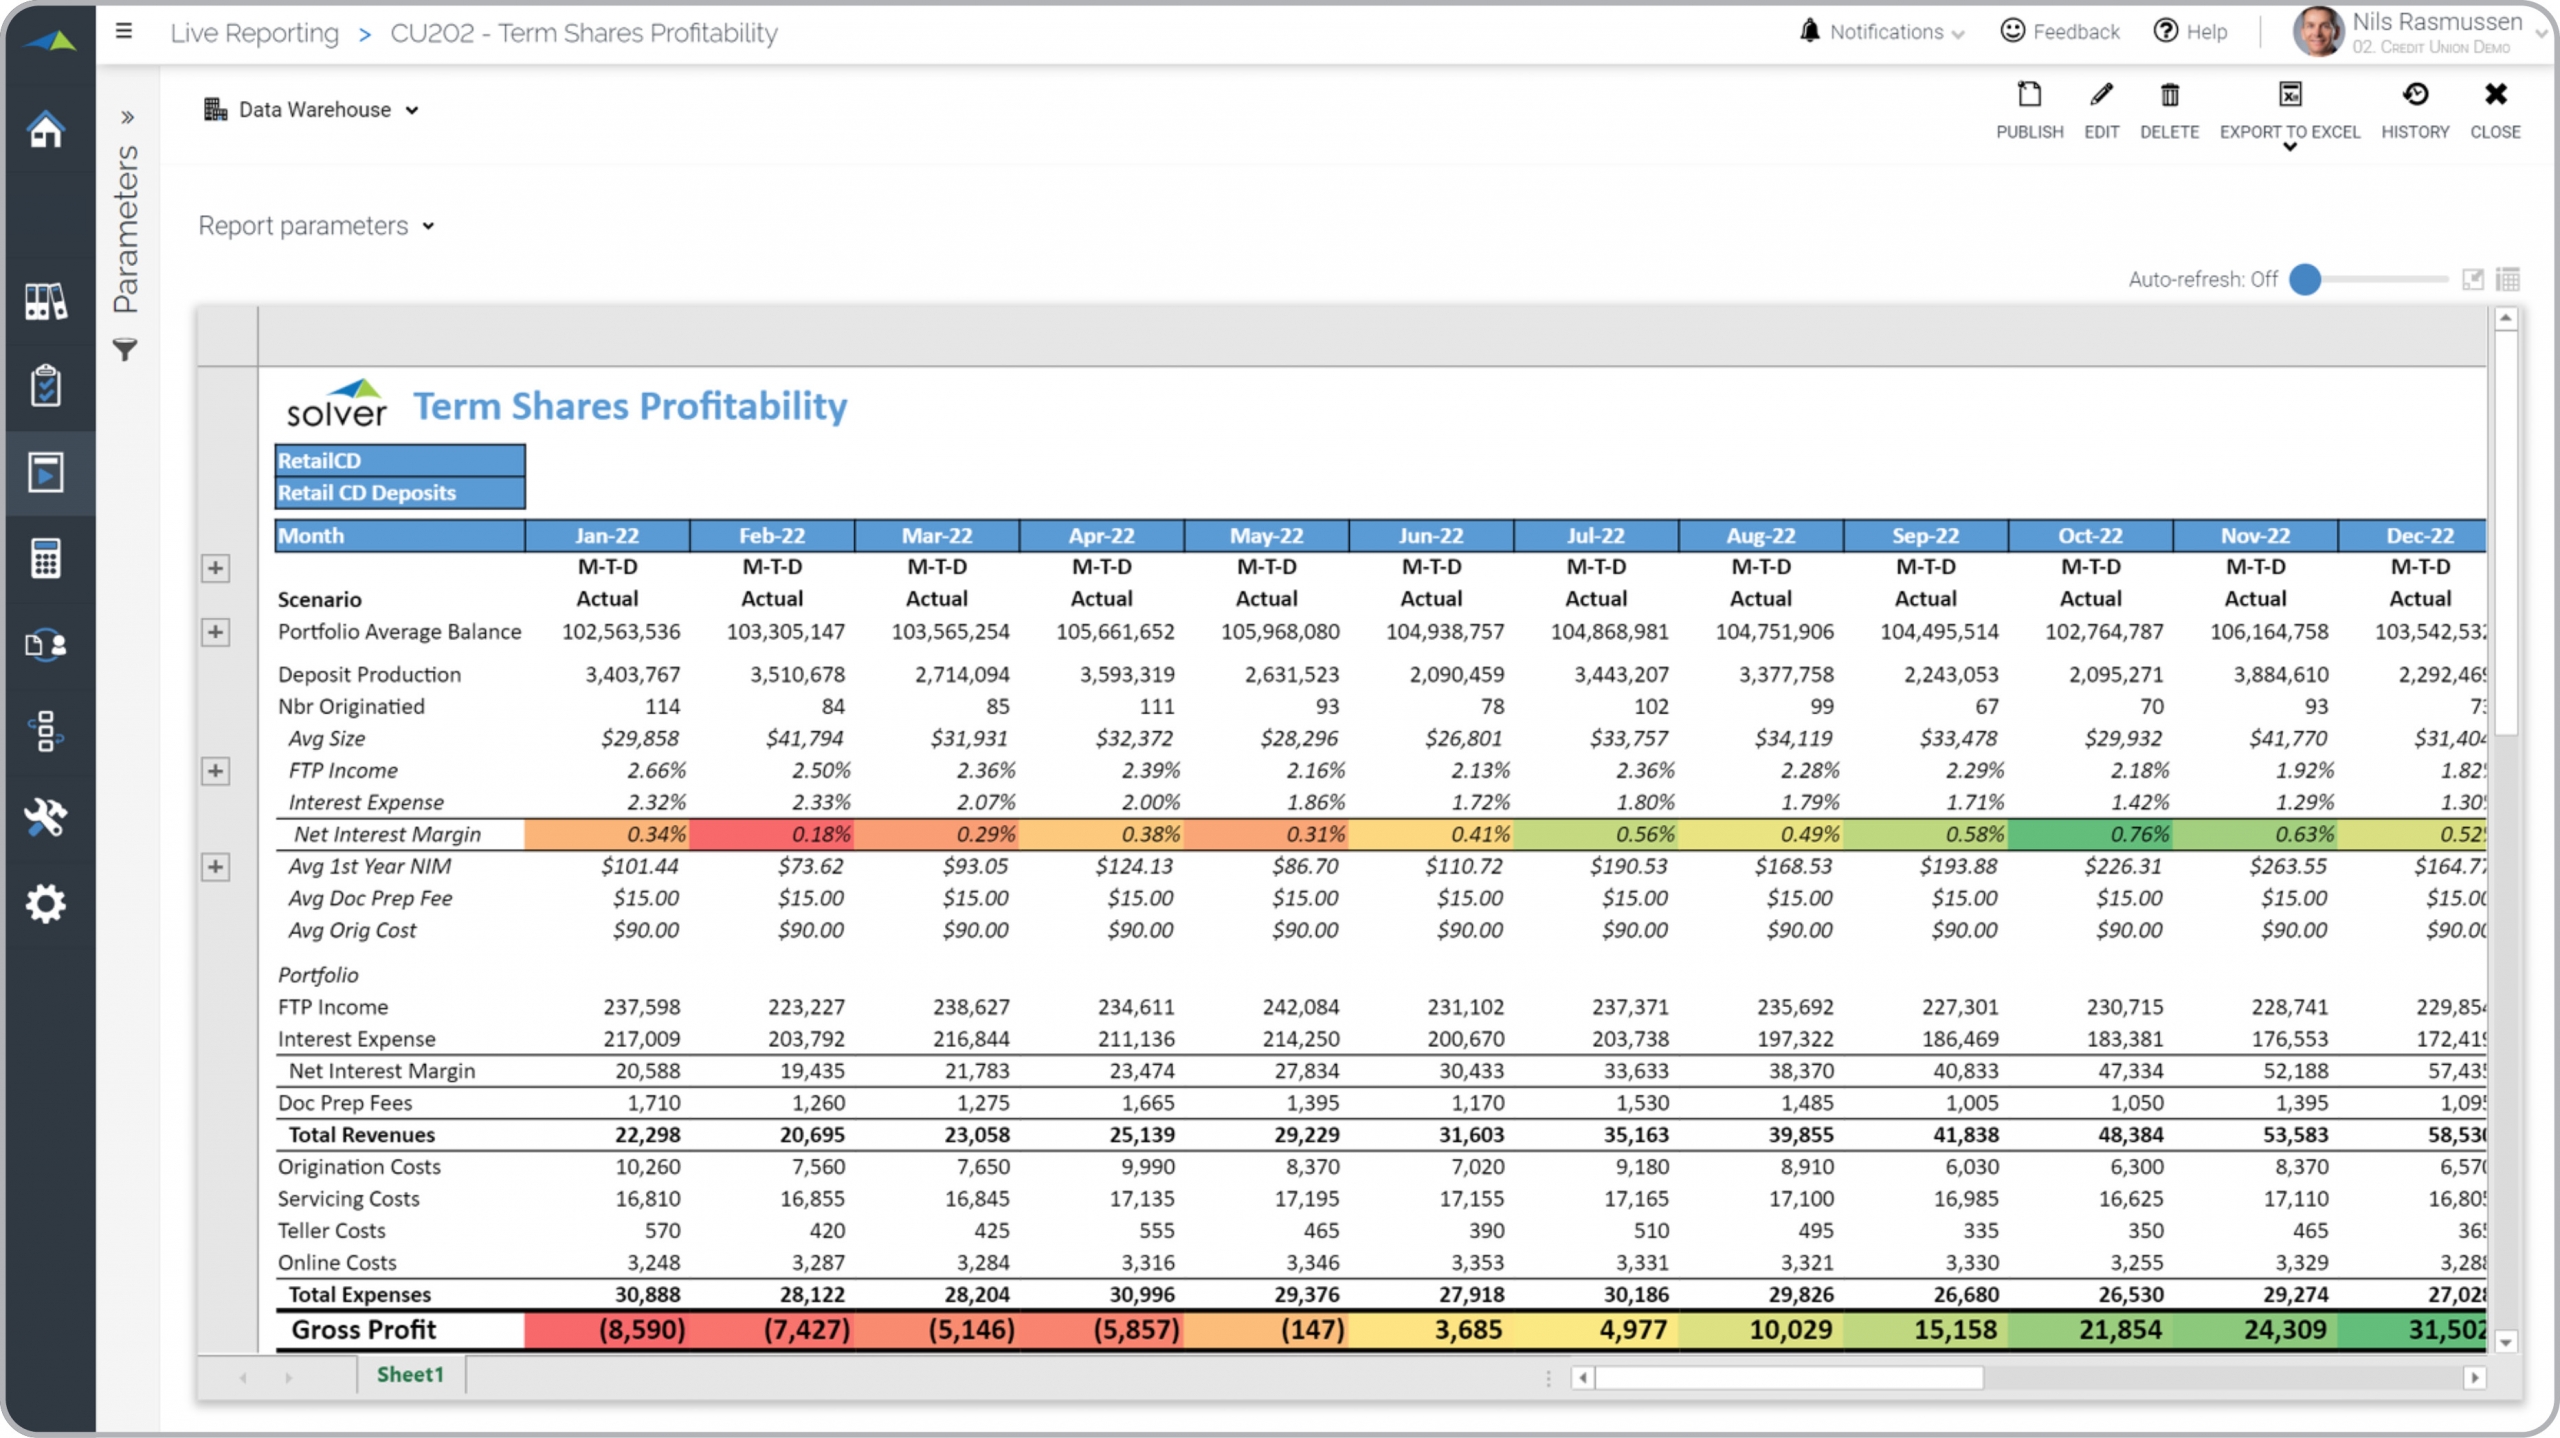
Credit Union – Term Shares Profitability
Monthly trend analysis of term shares profitability.
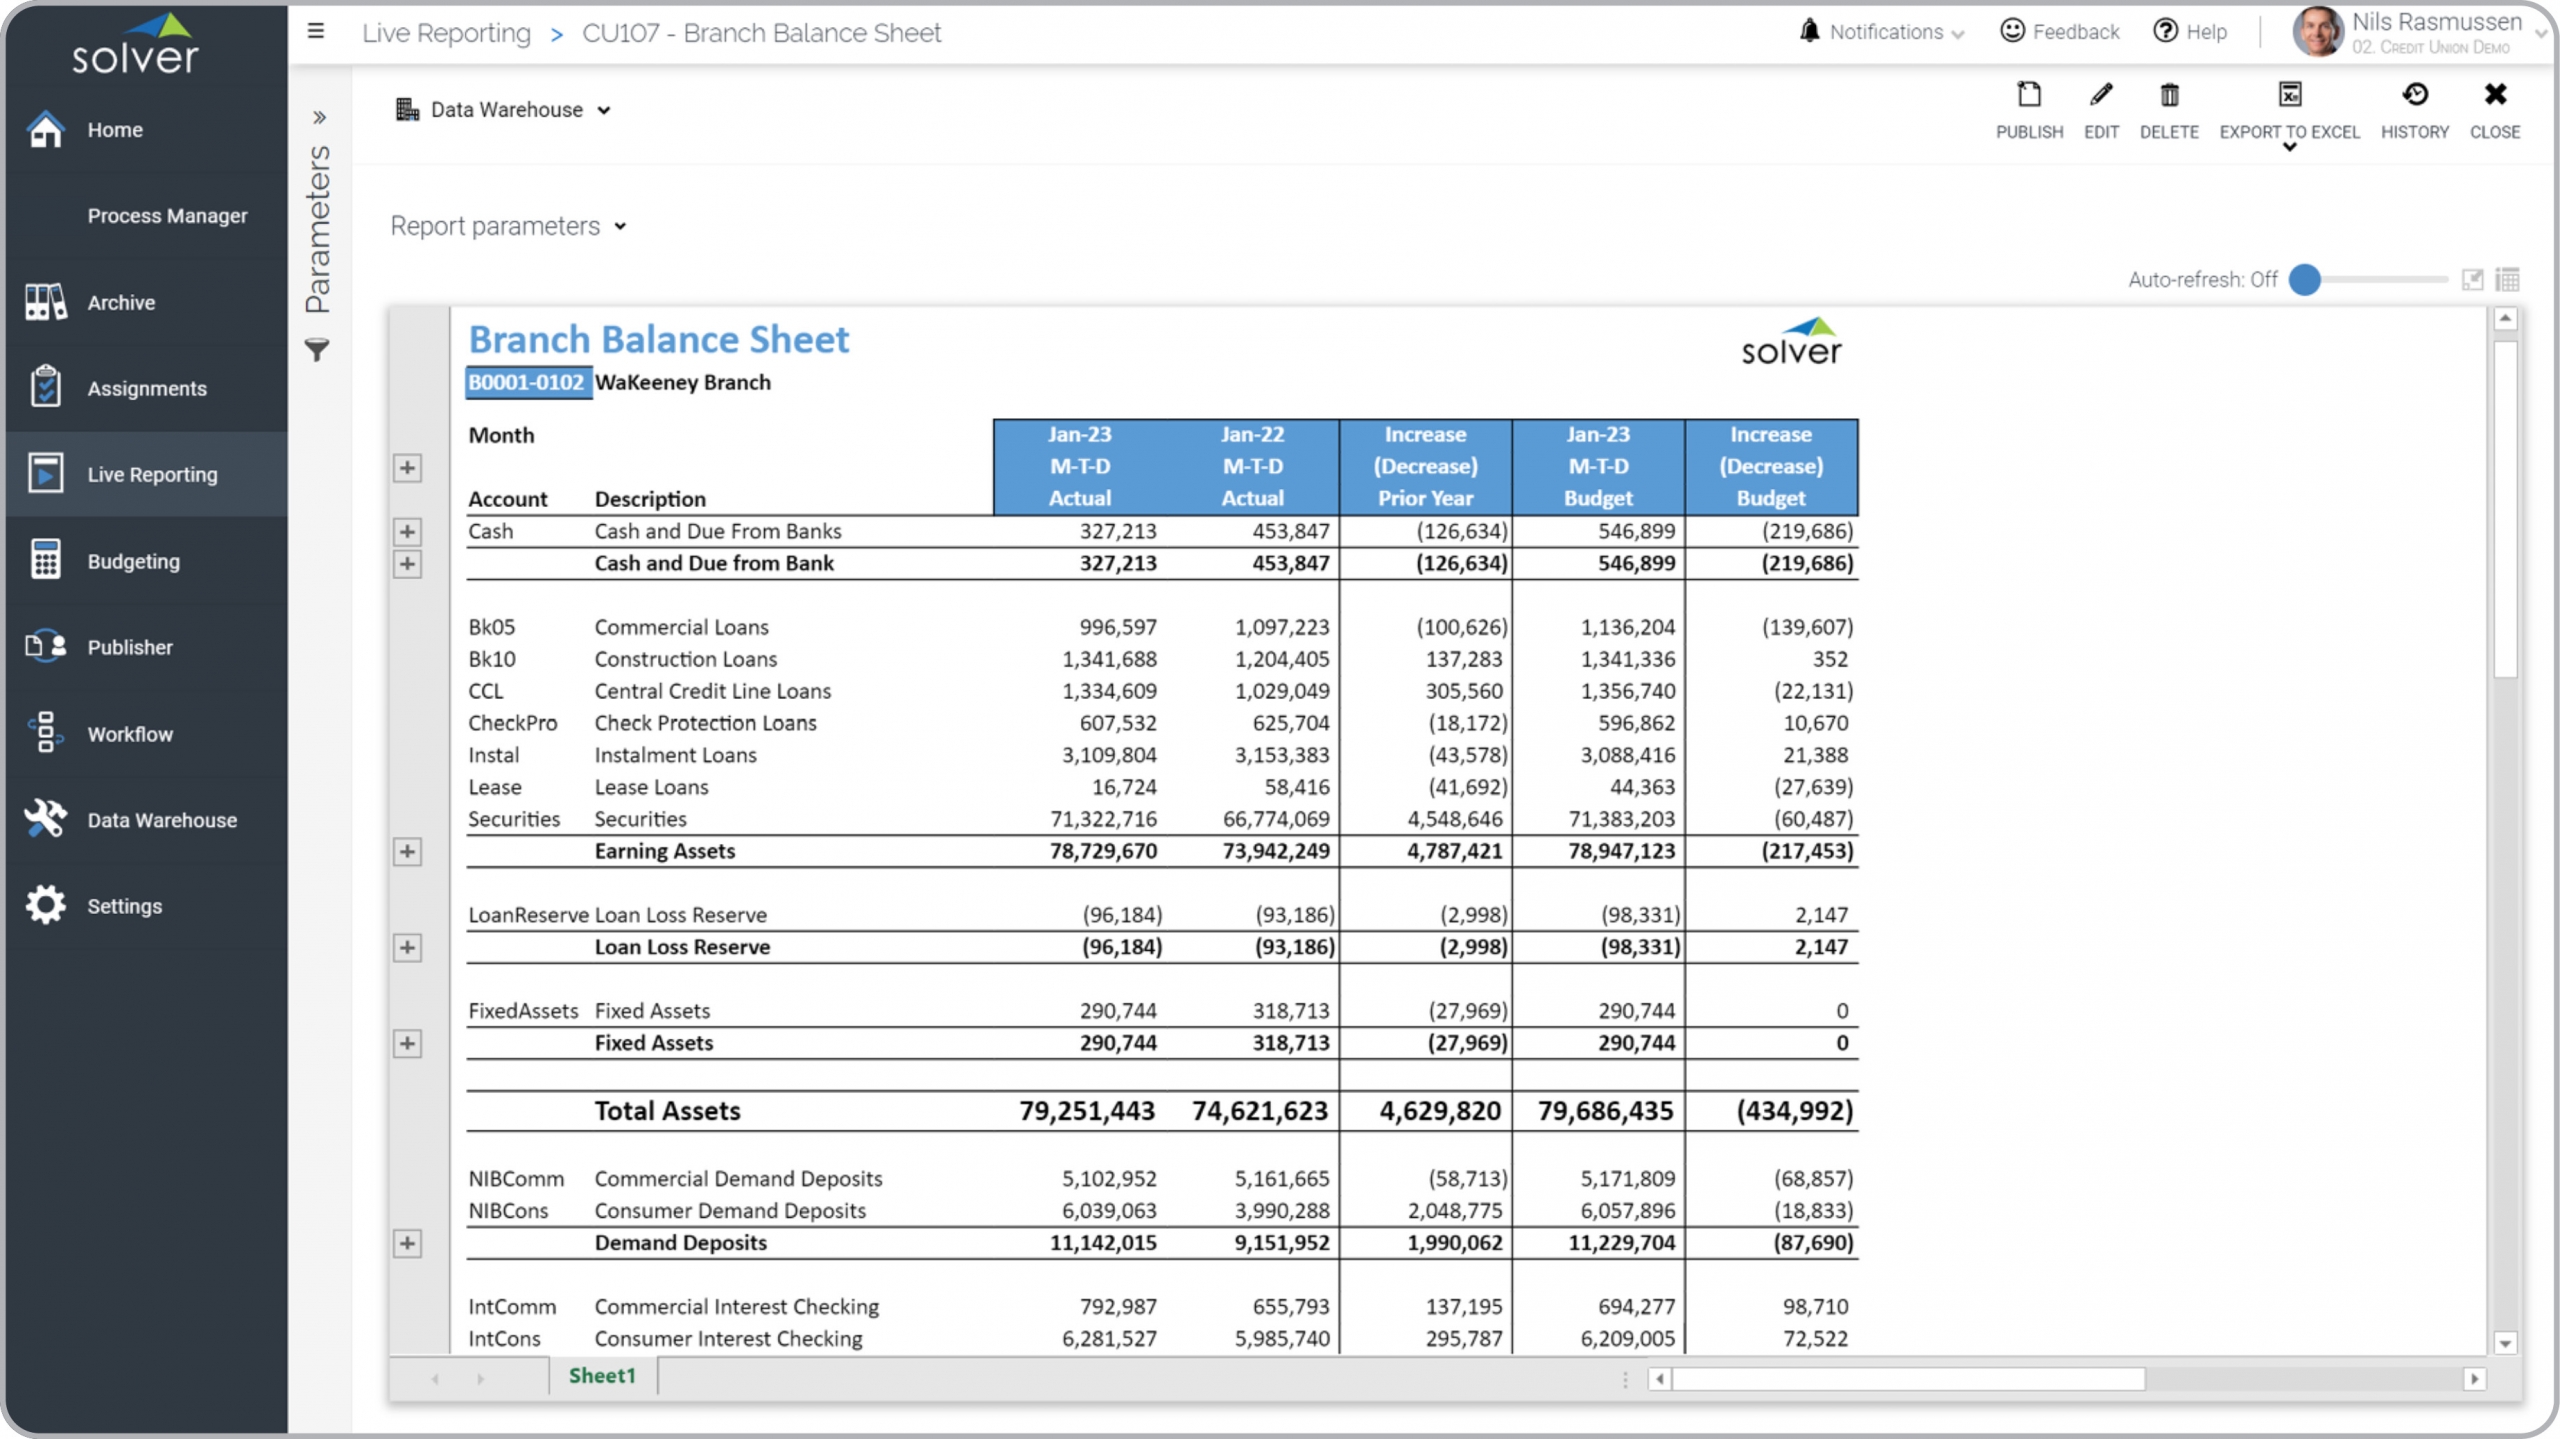
Credit Union – Branch Balance Sheet
Actual versus budget report with variance.
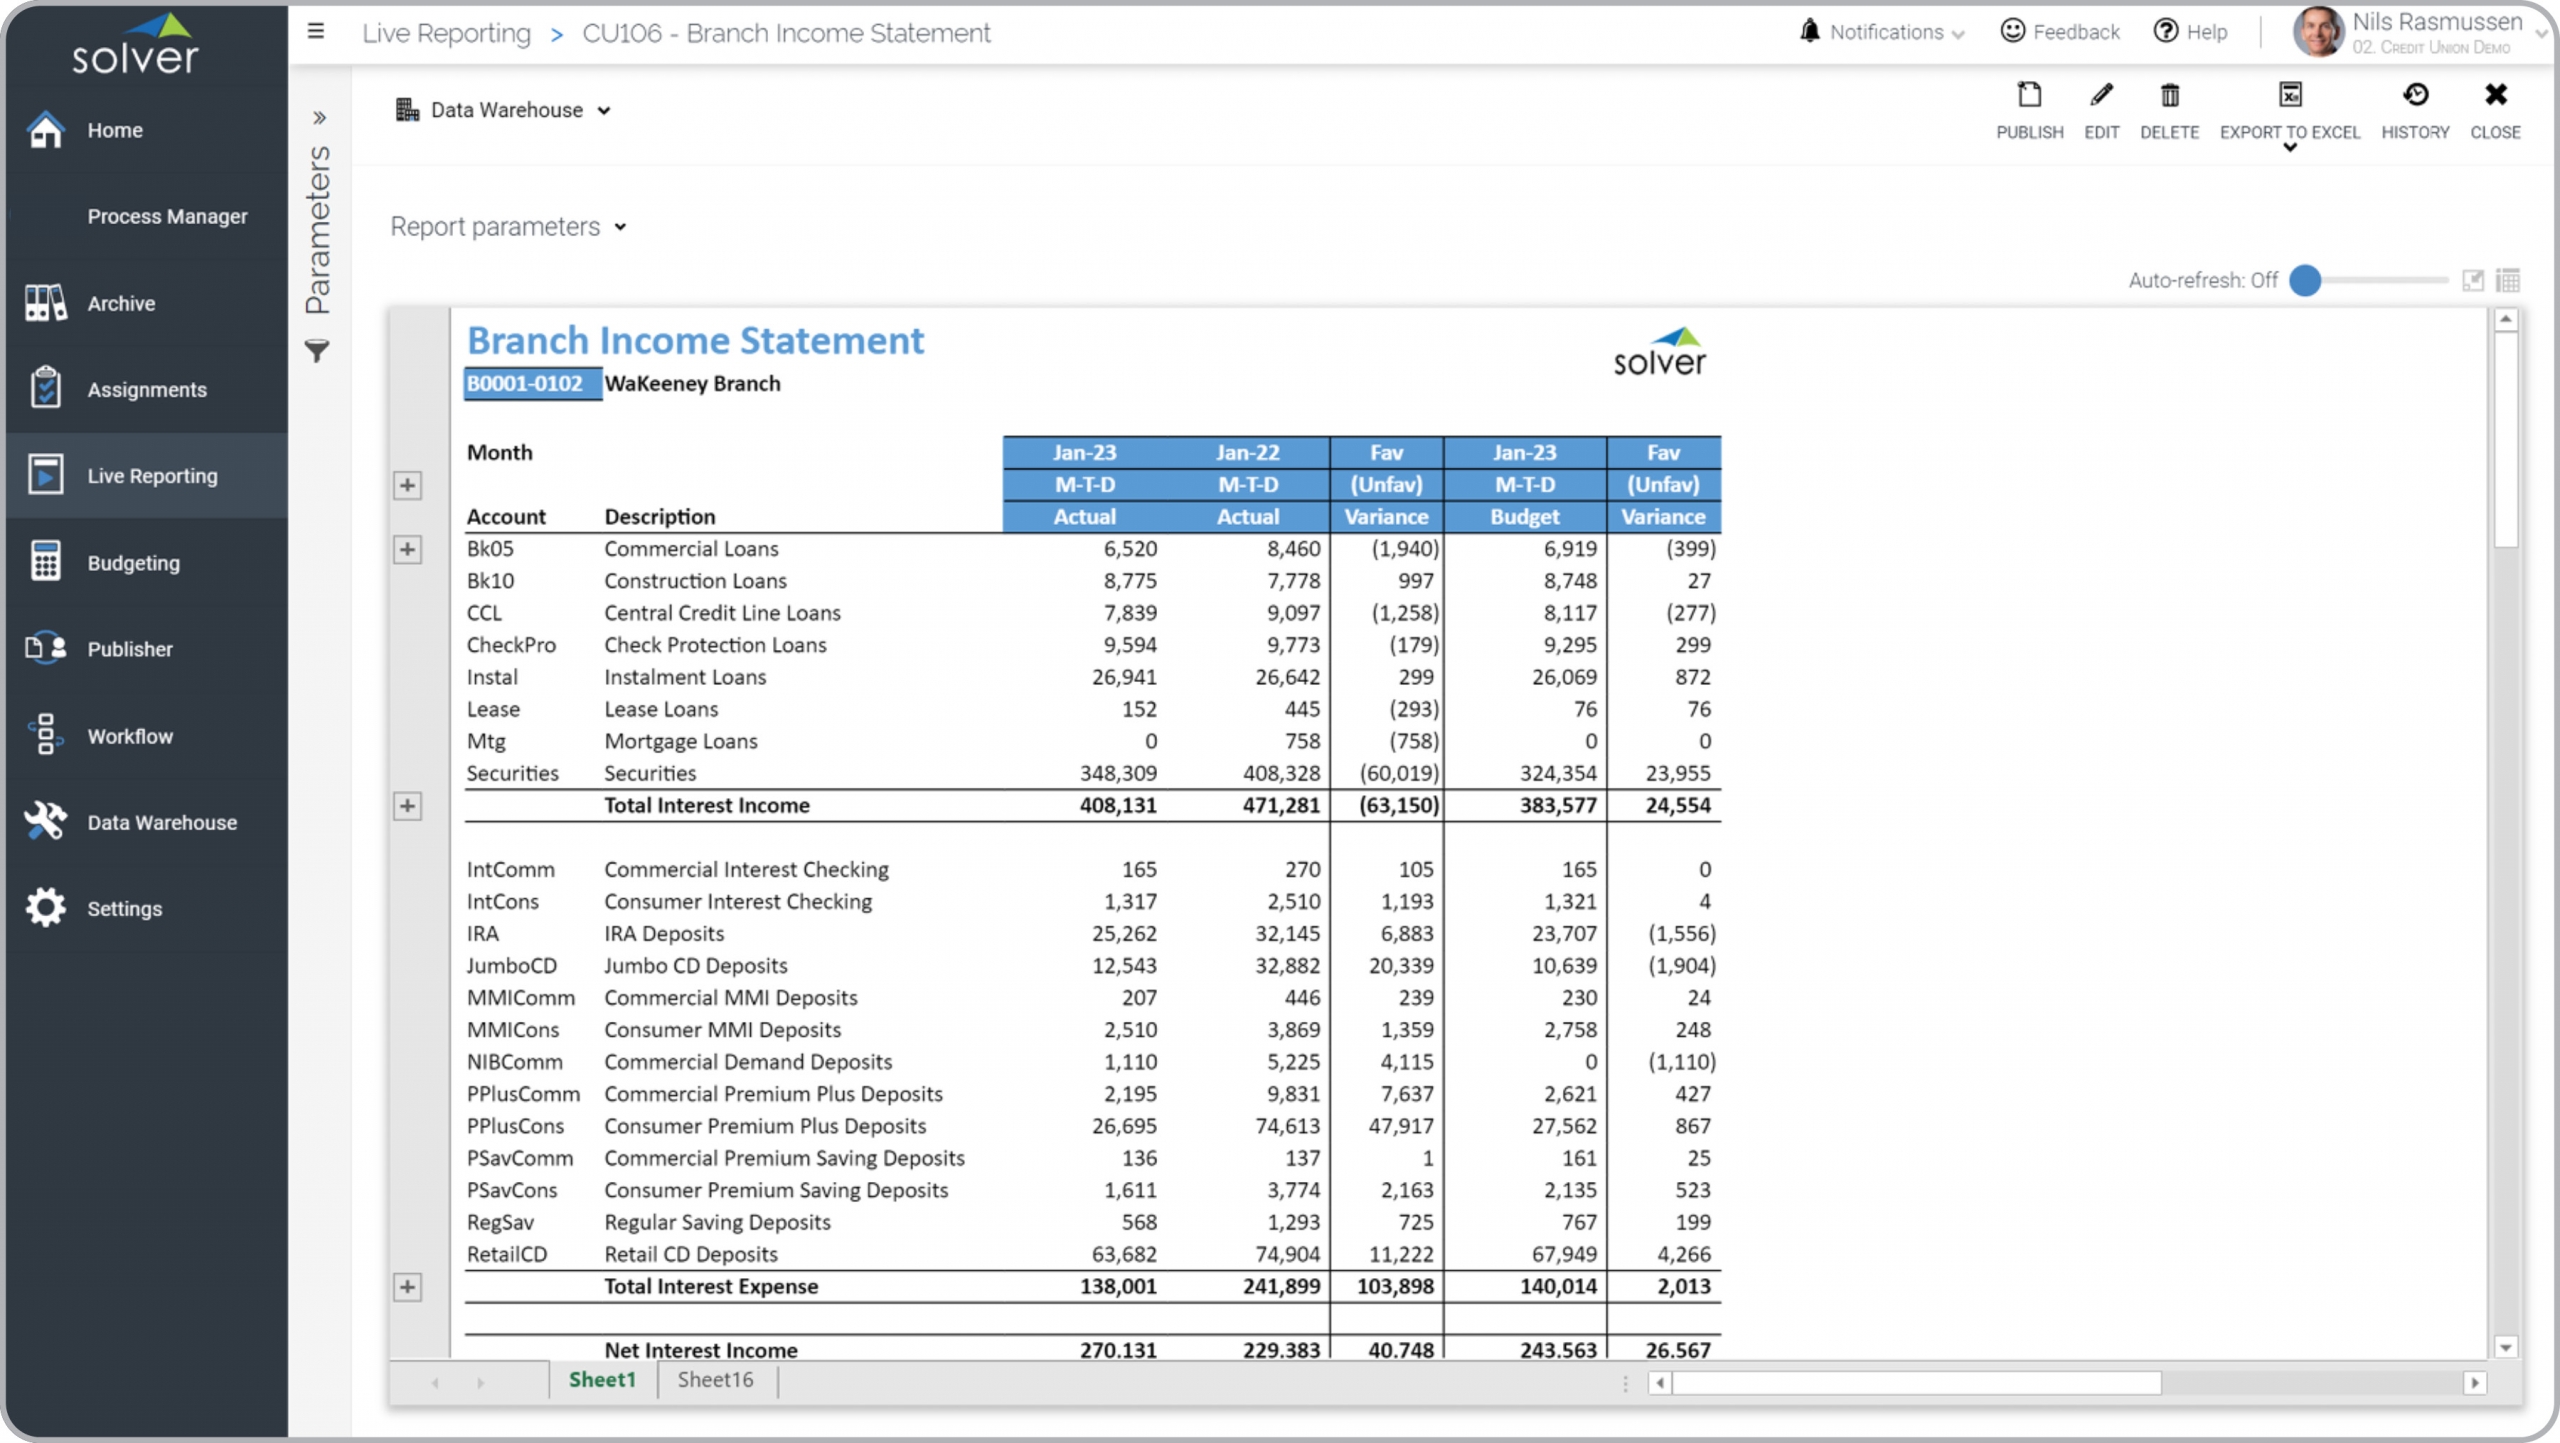
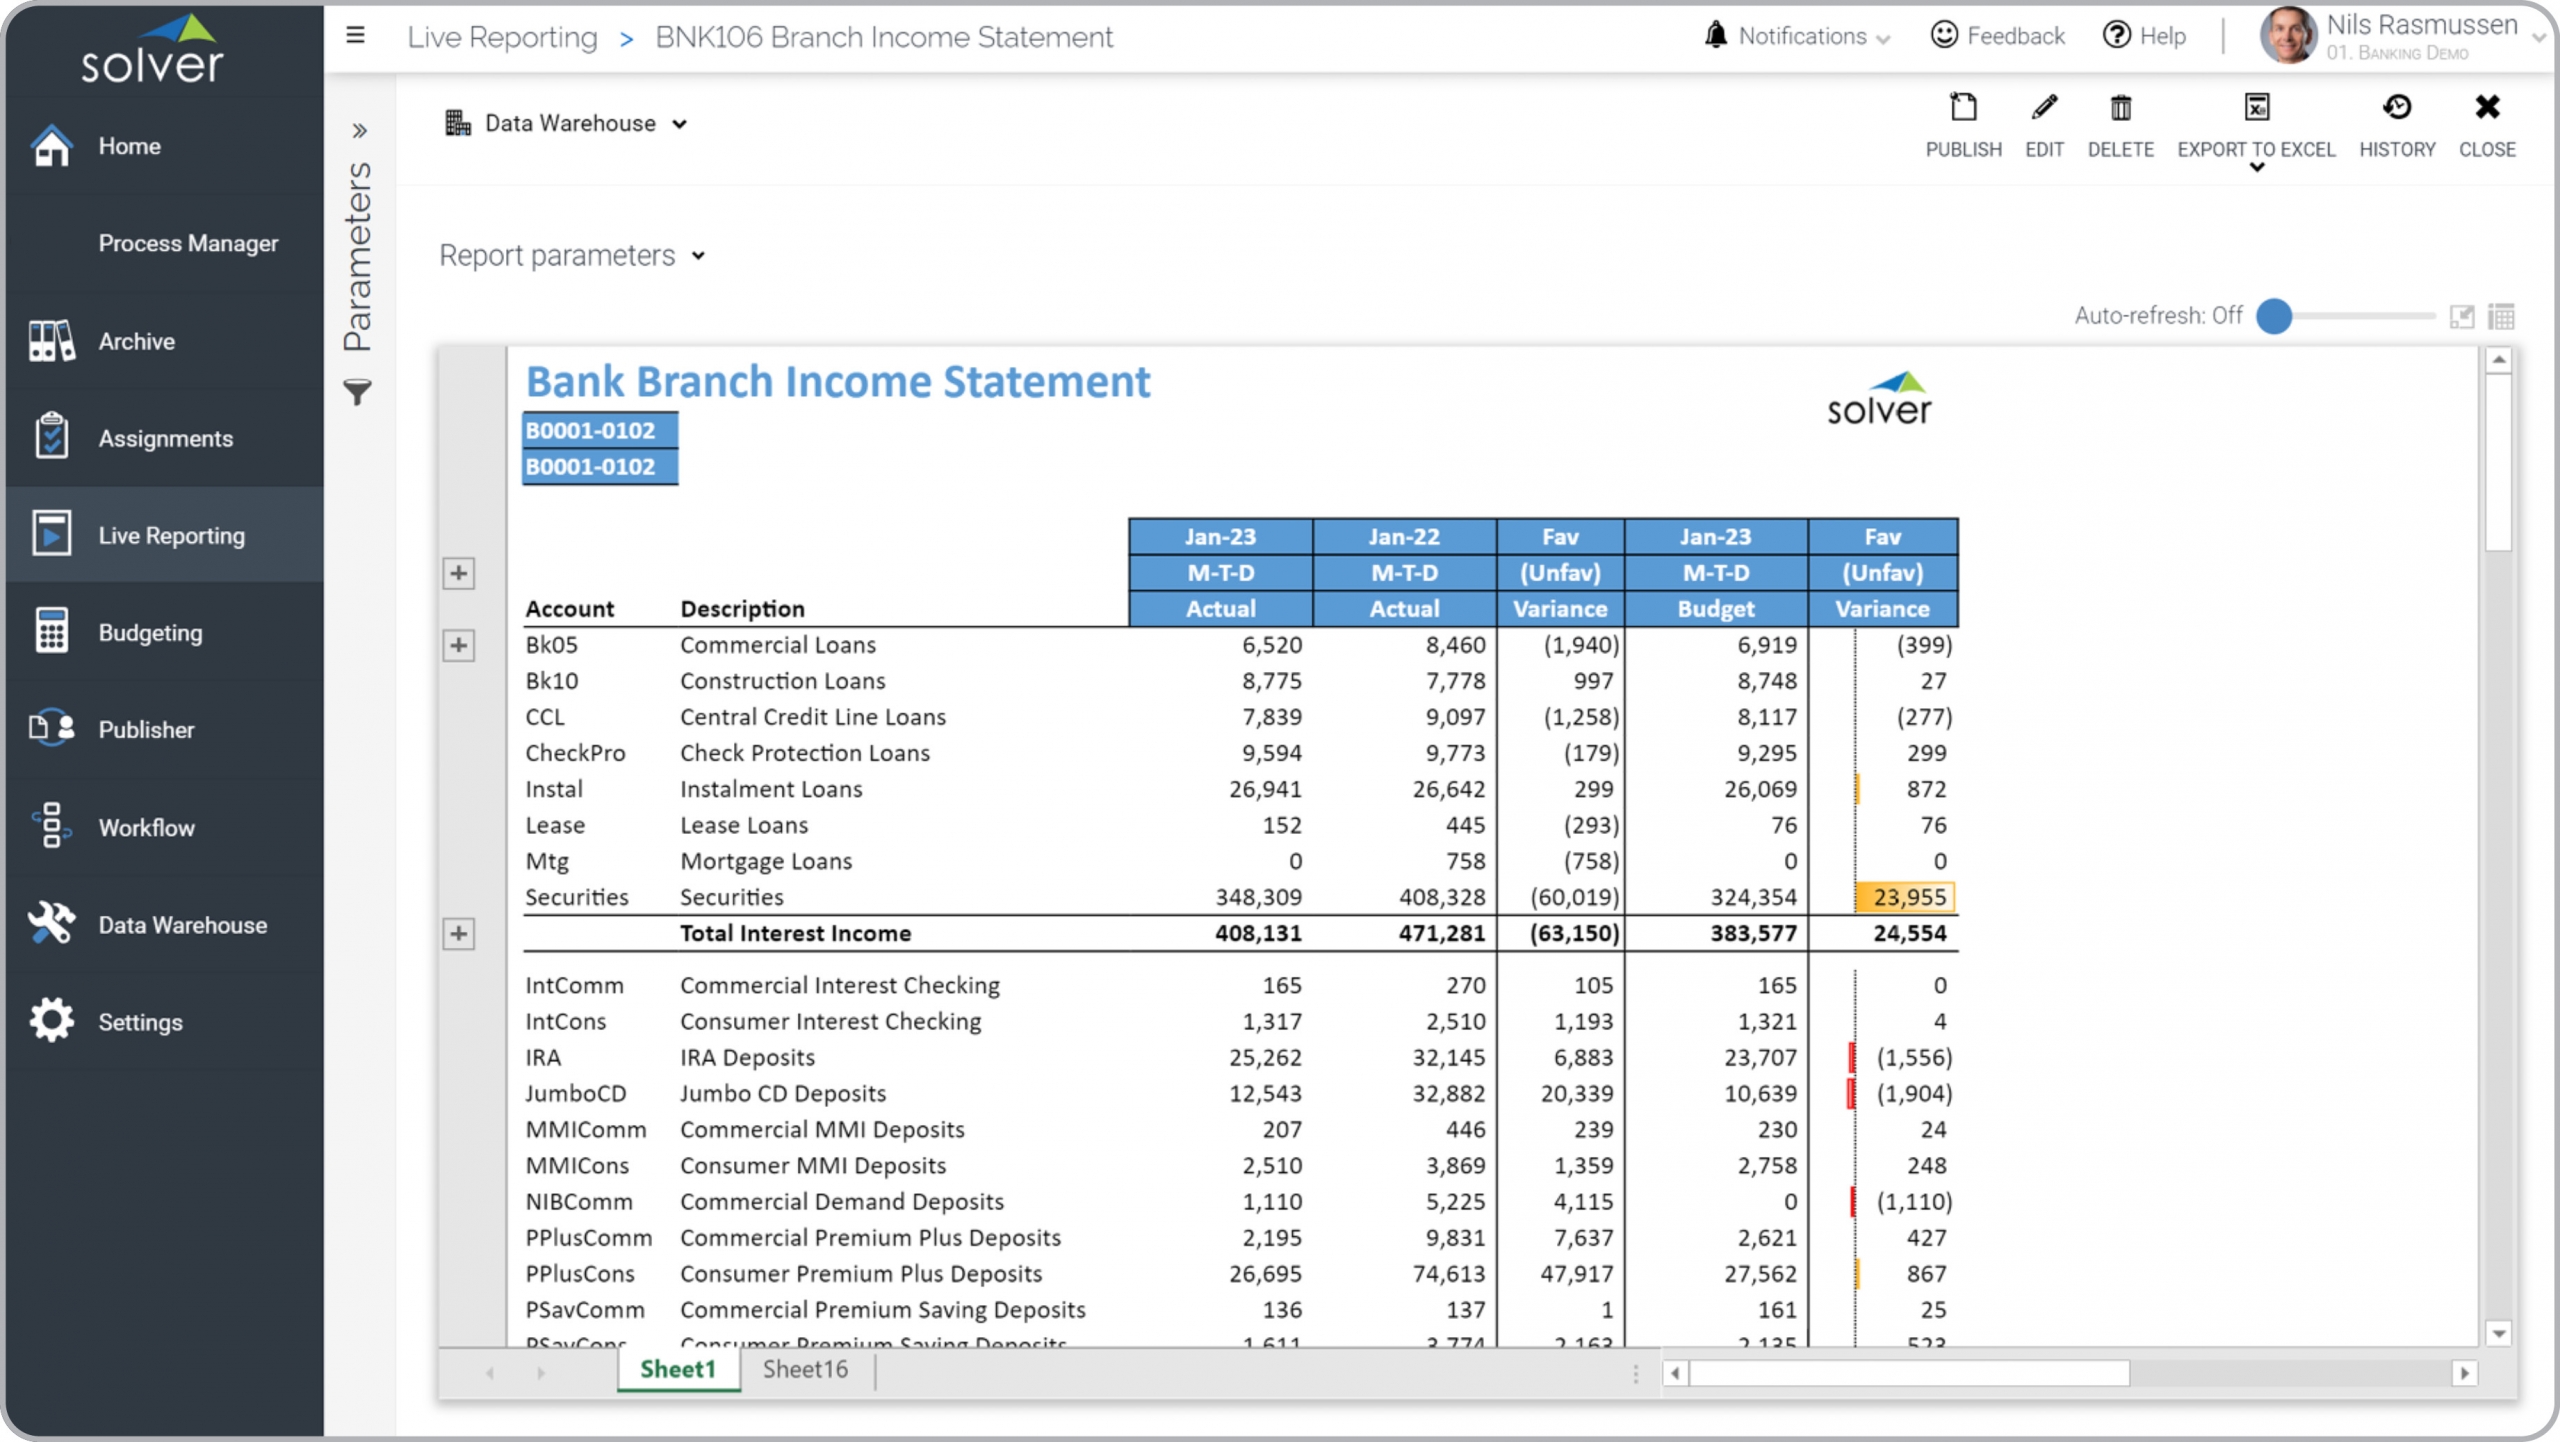
Credit Union – Branch Income Statement
Actual versus budget report with variance.
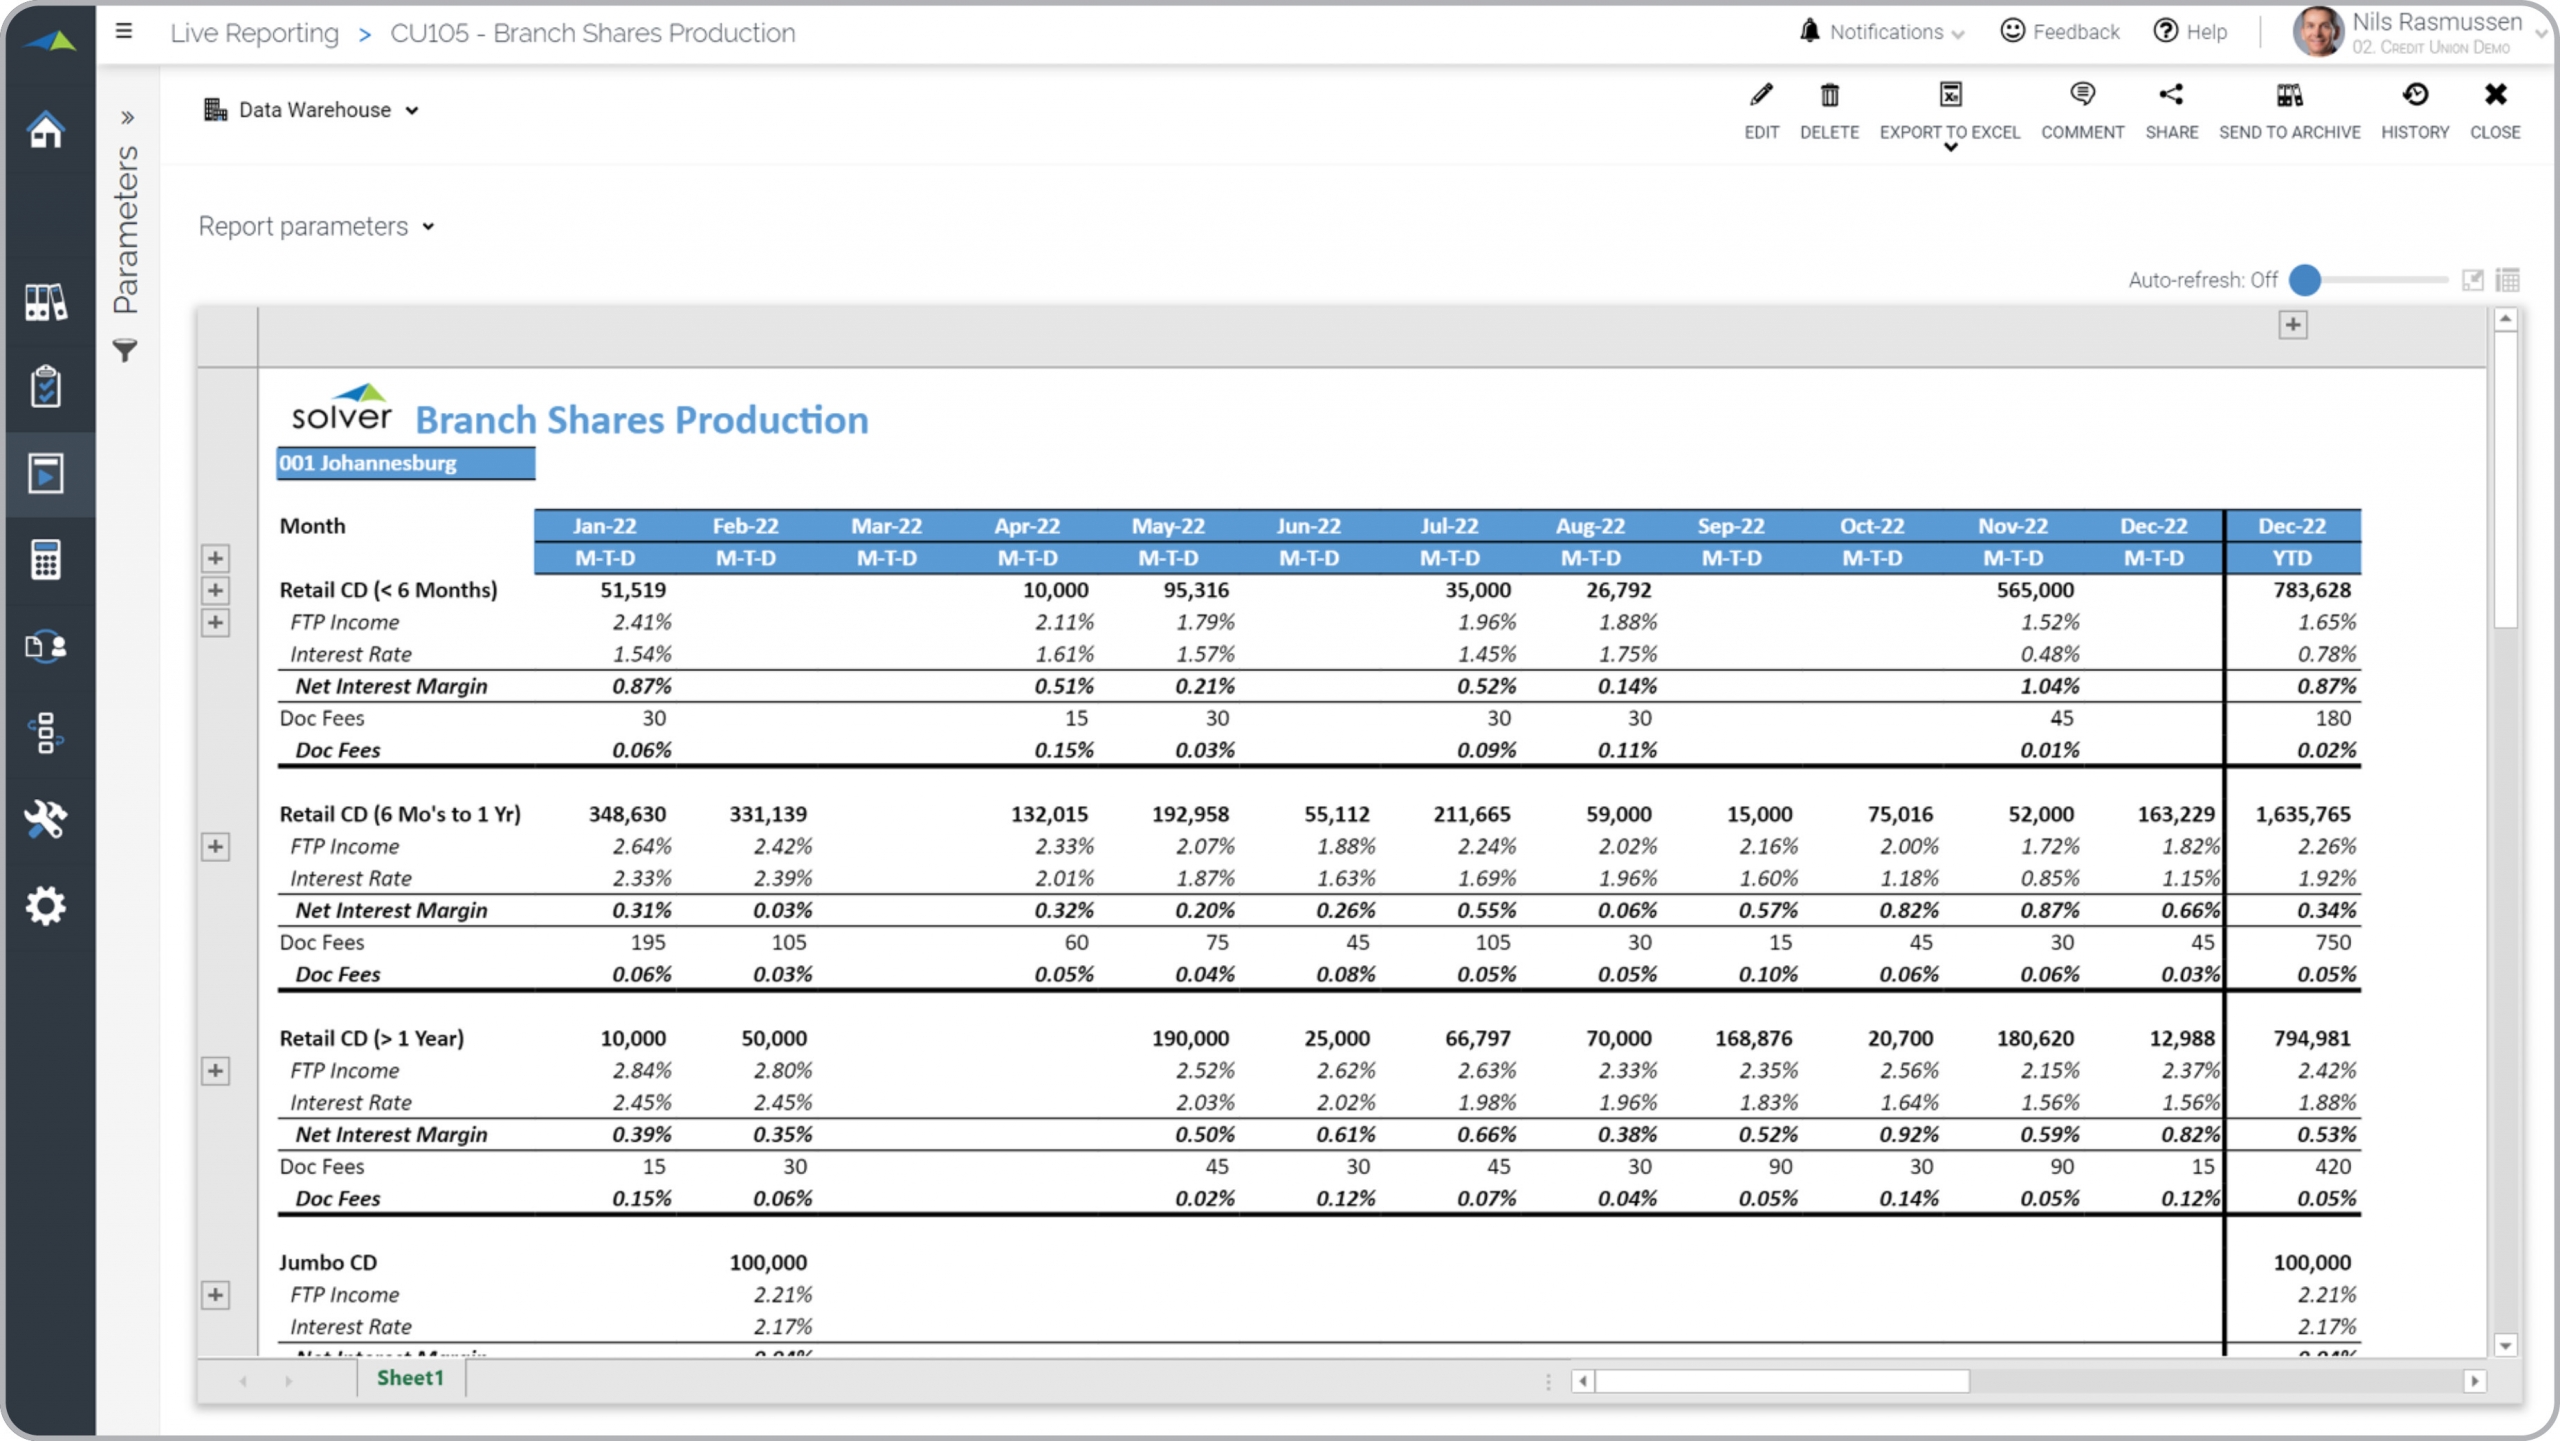
Credit Union – Branch Shares Production
Monthly trend for branch shares production (sales).
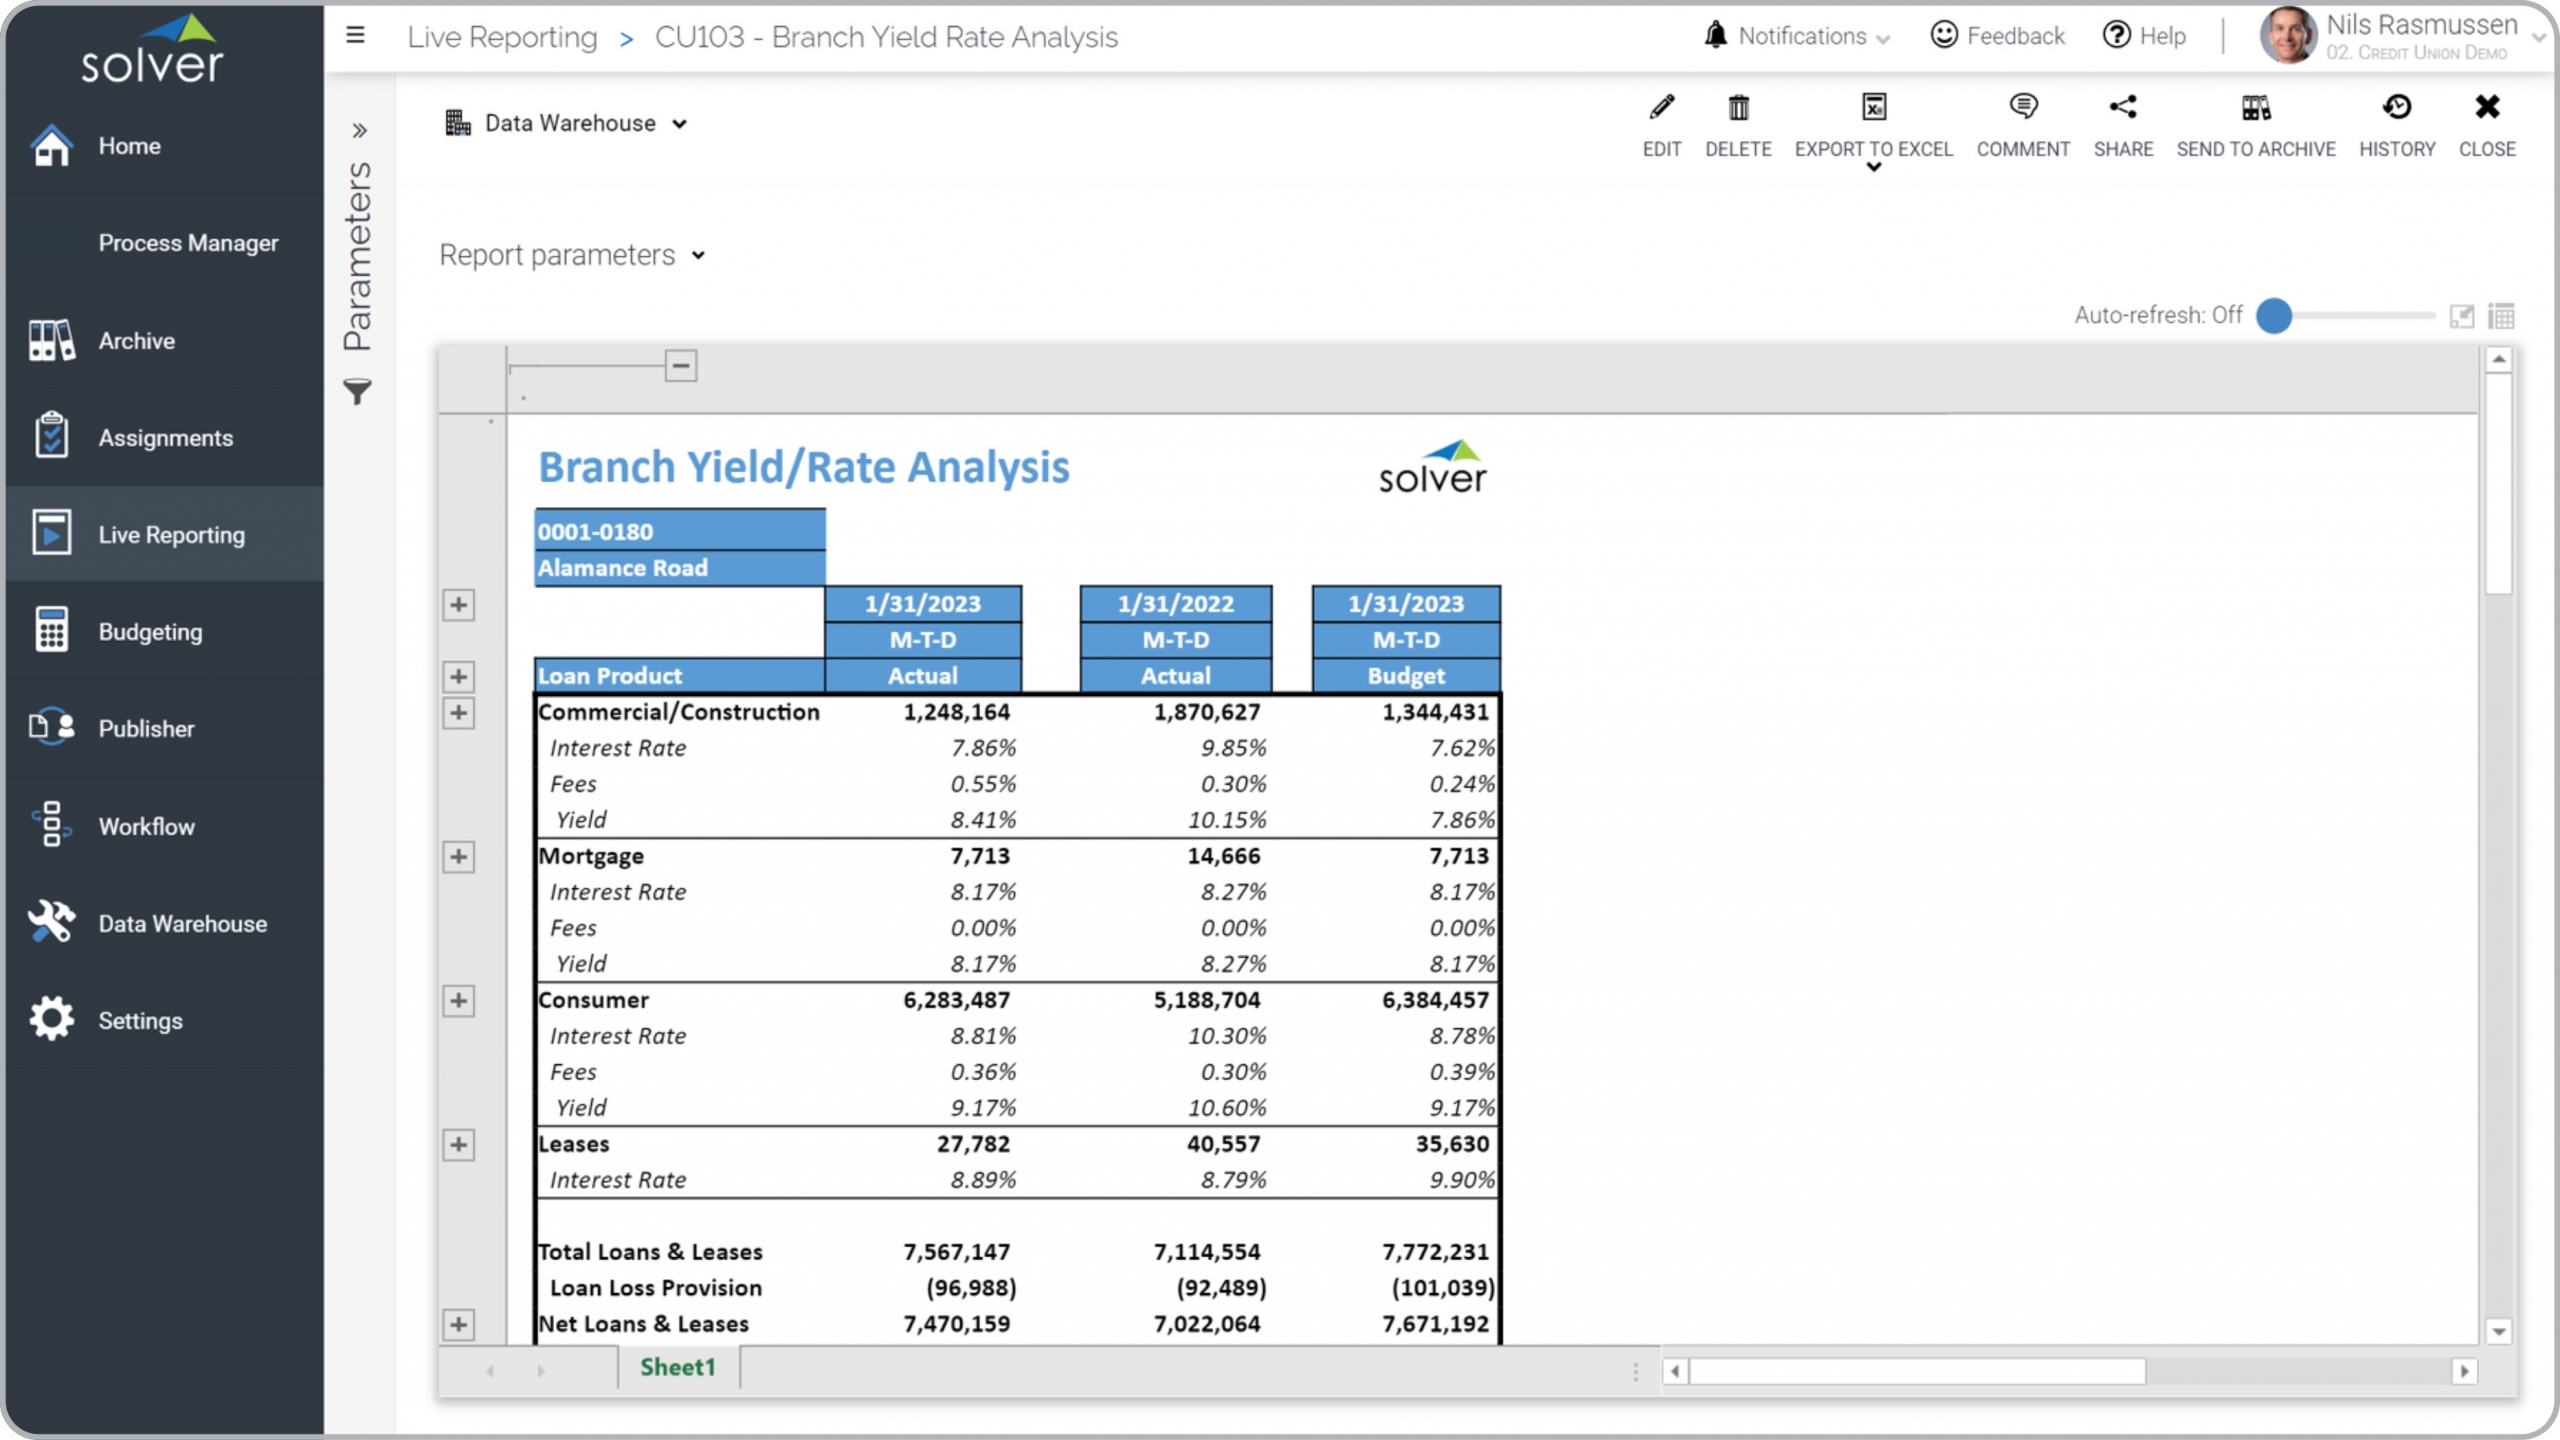
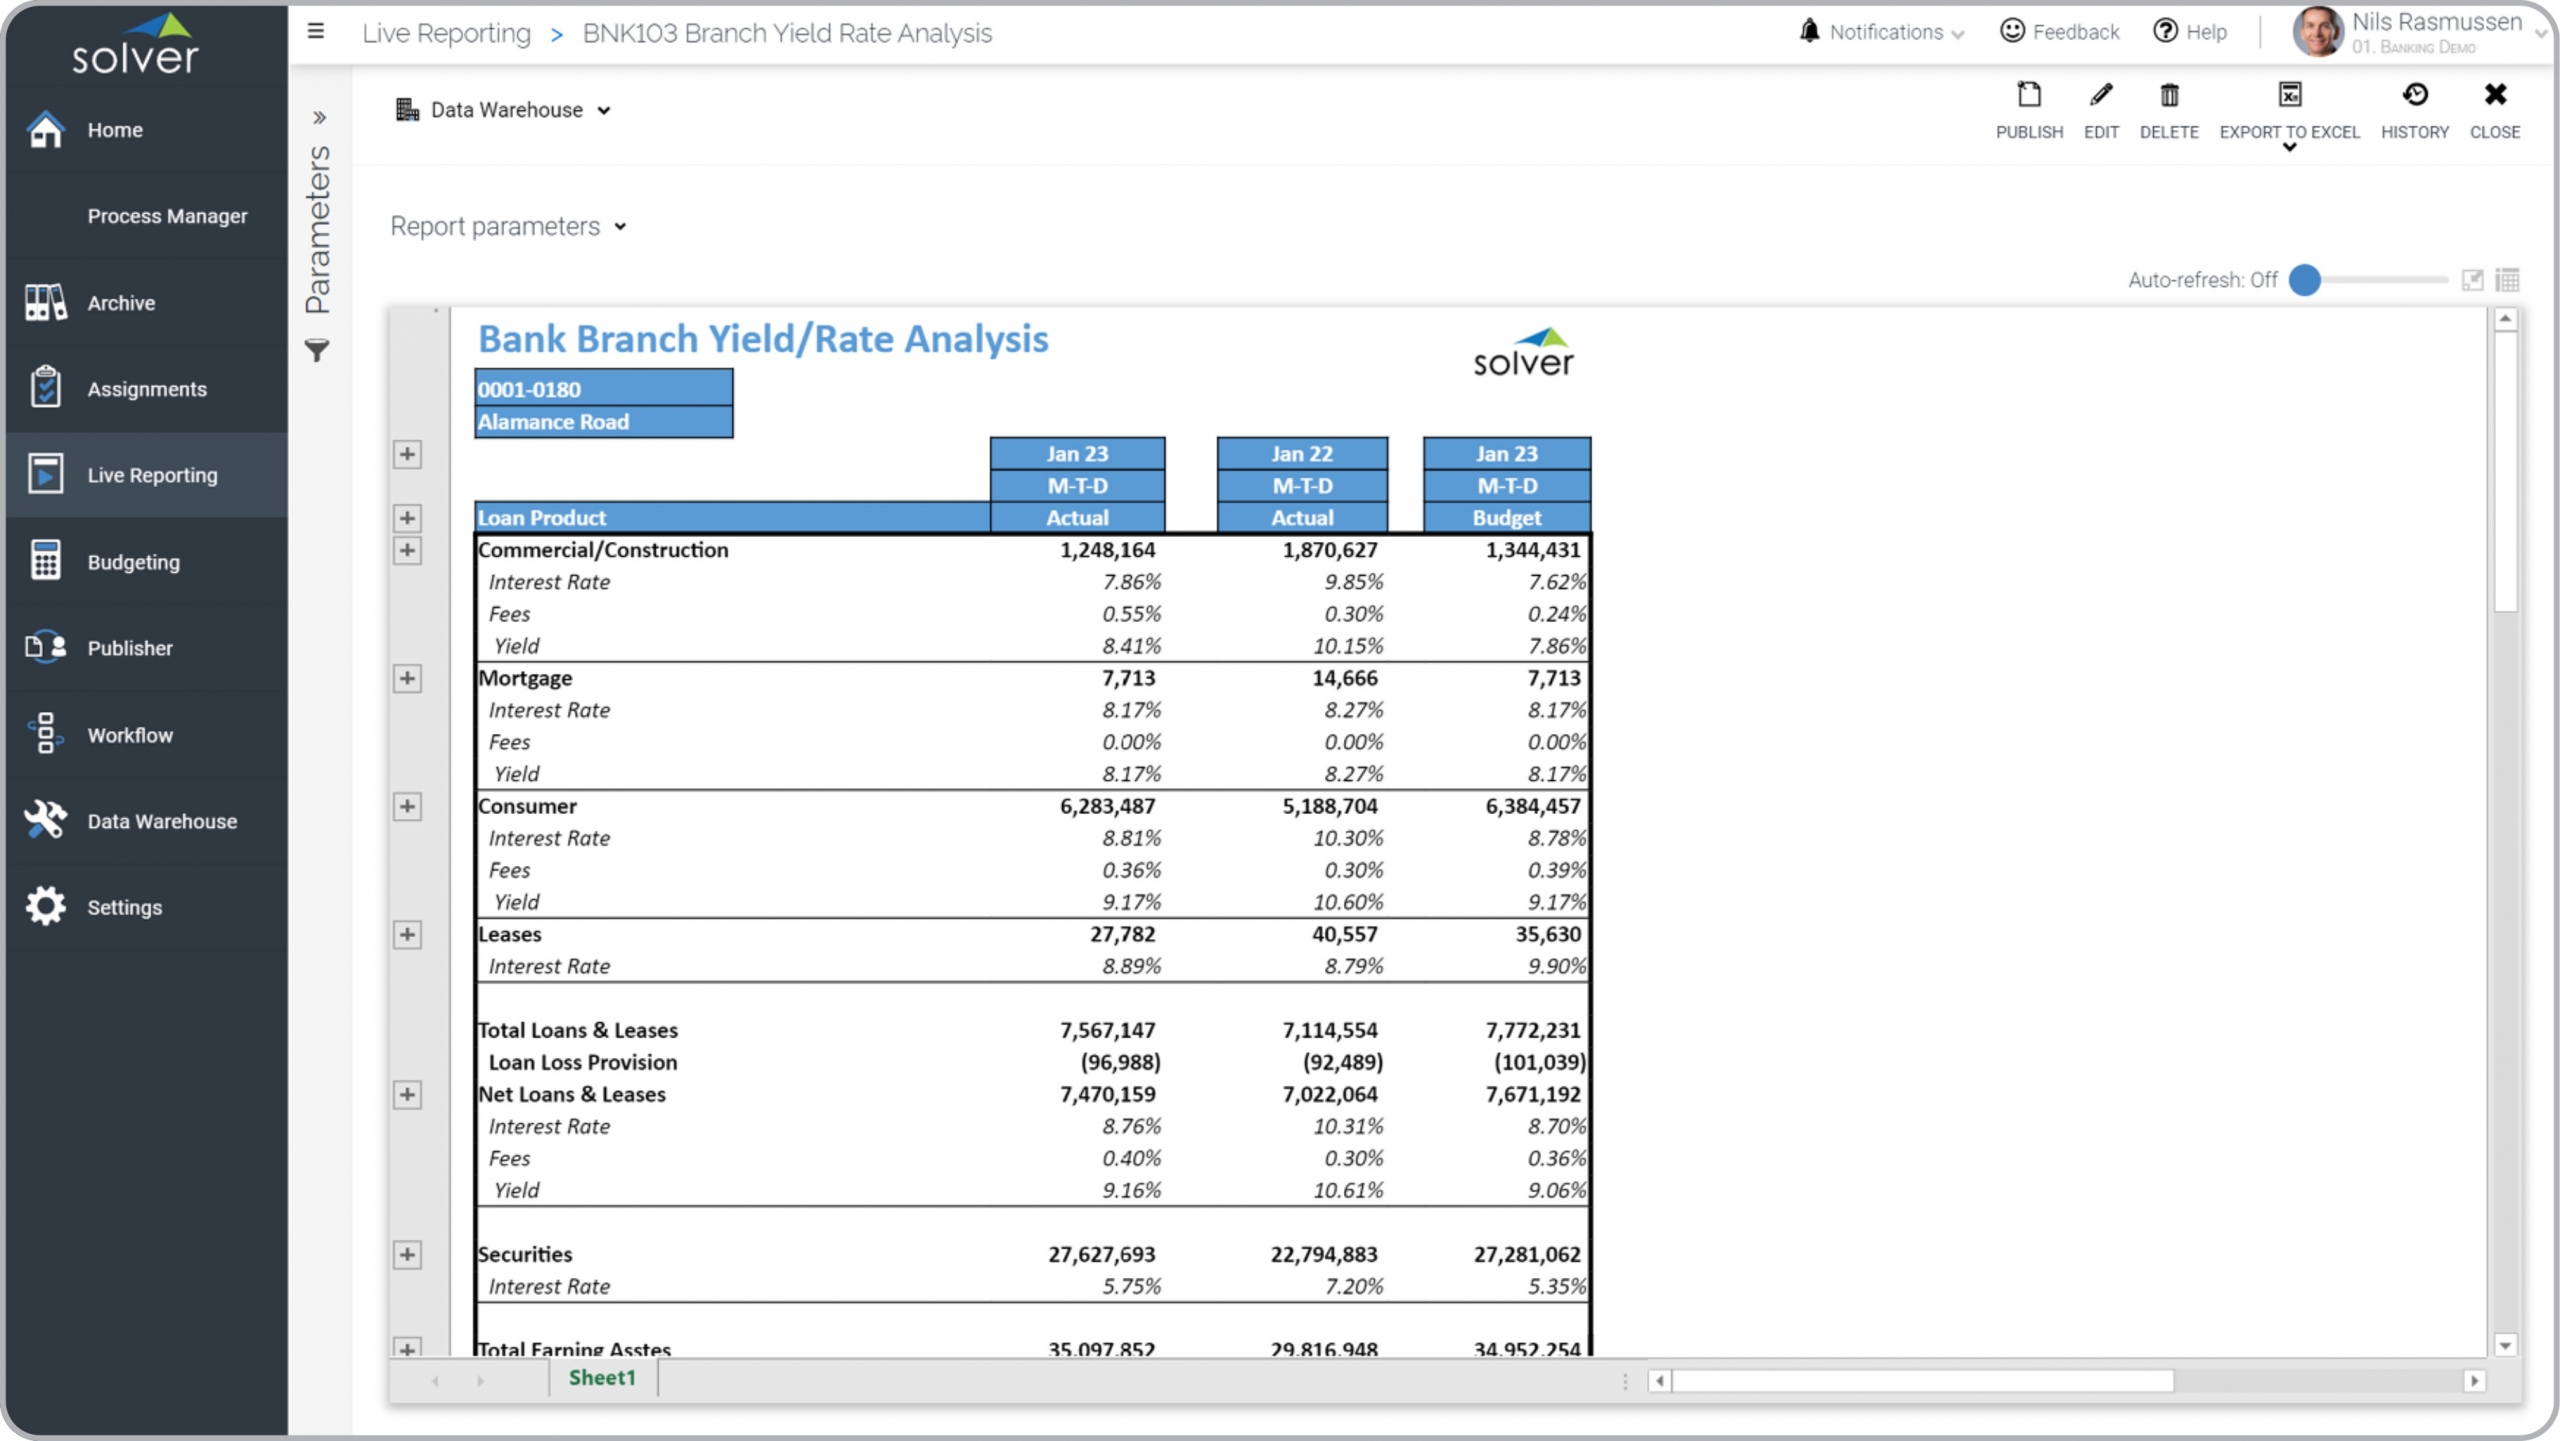
Credit Union – Branch Yield Rate Analysis
Yield rate per loan product.
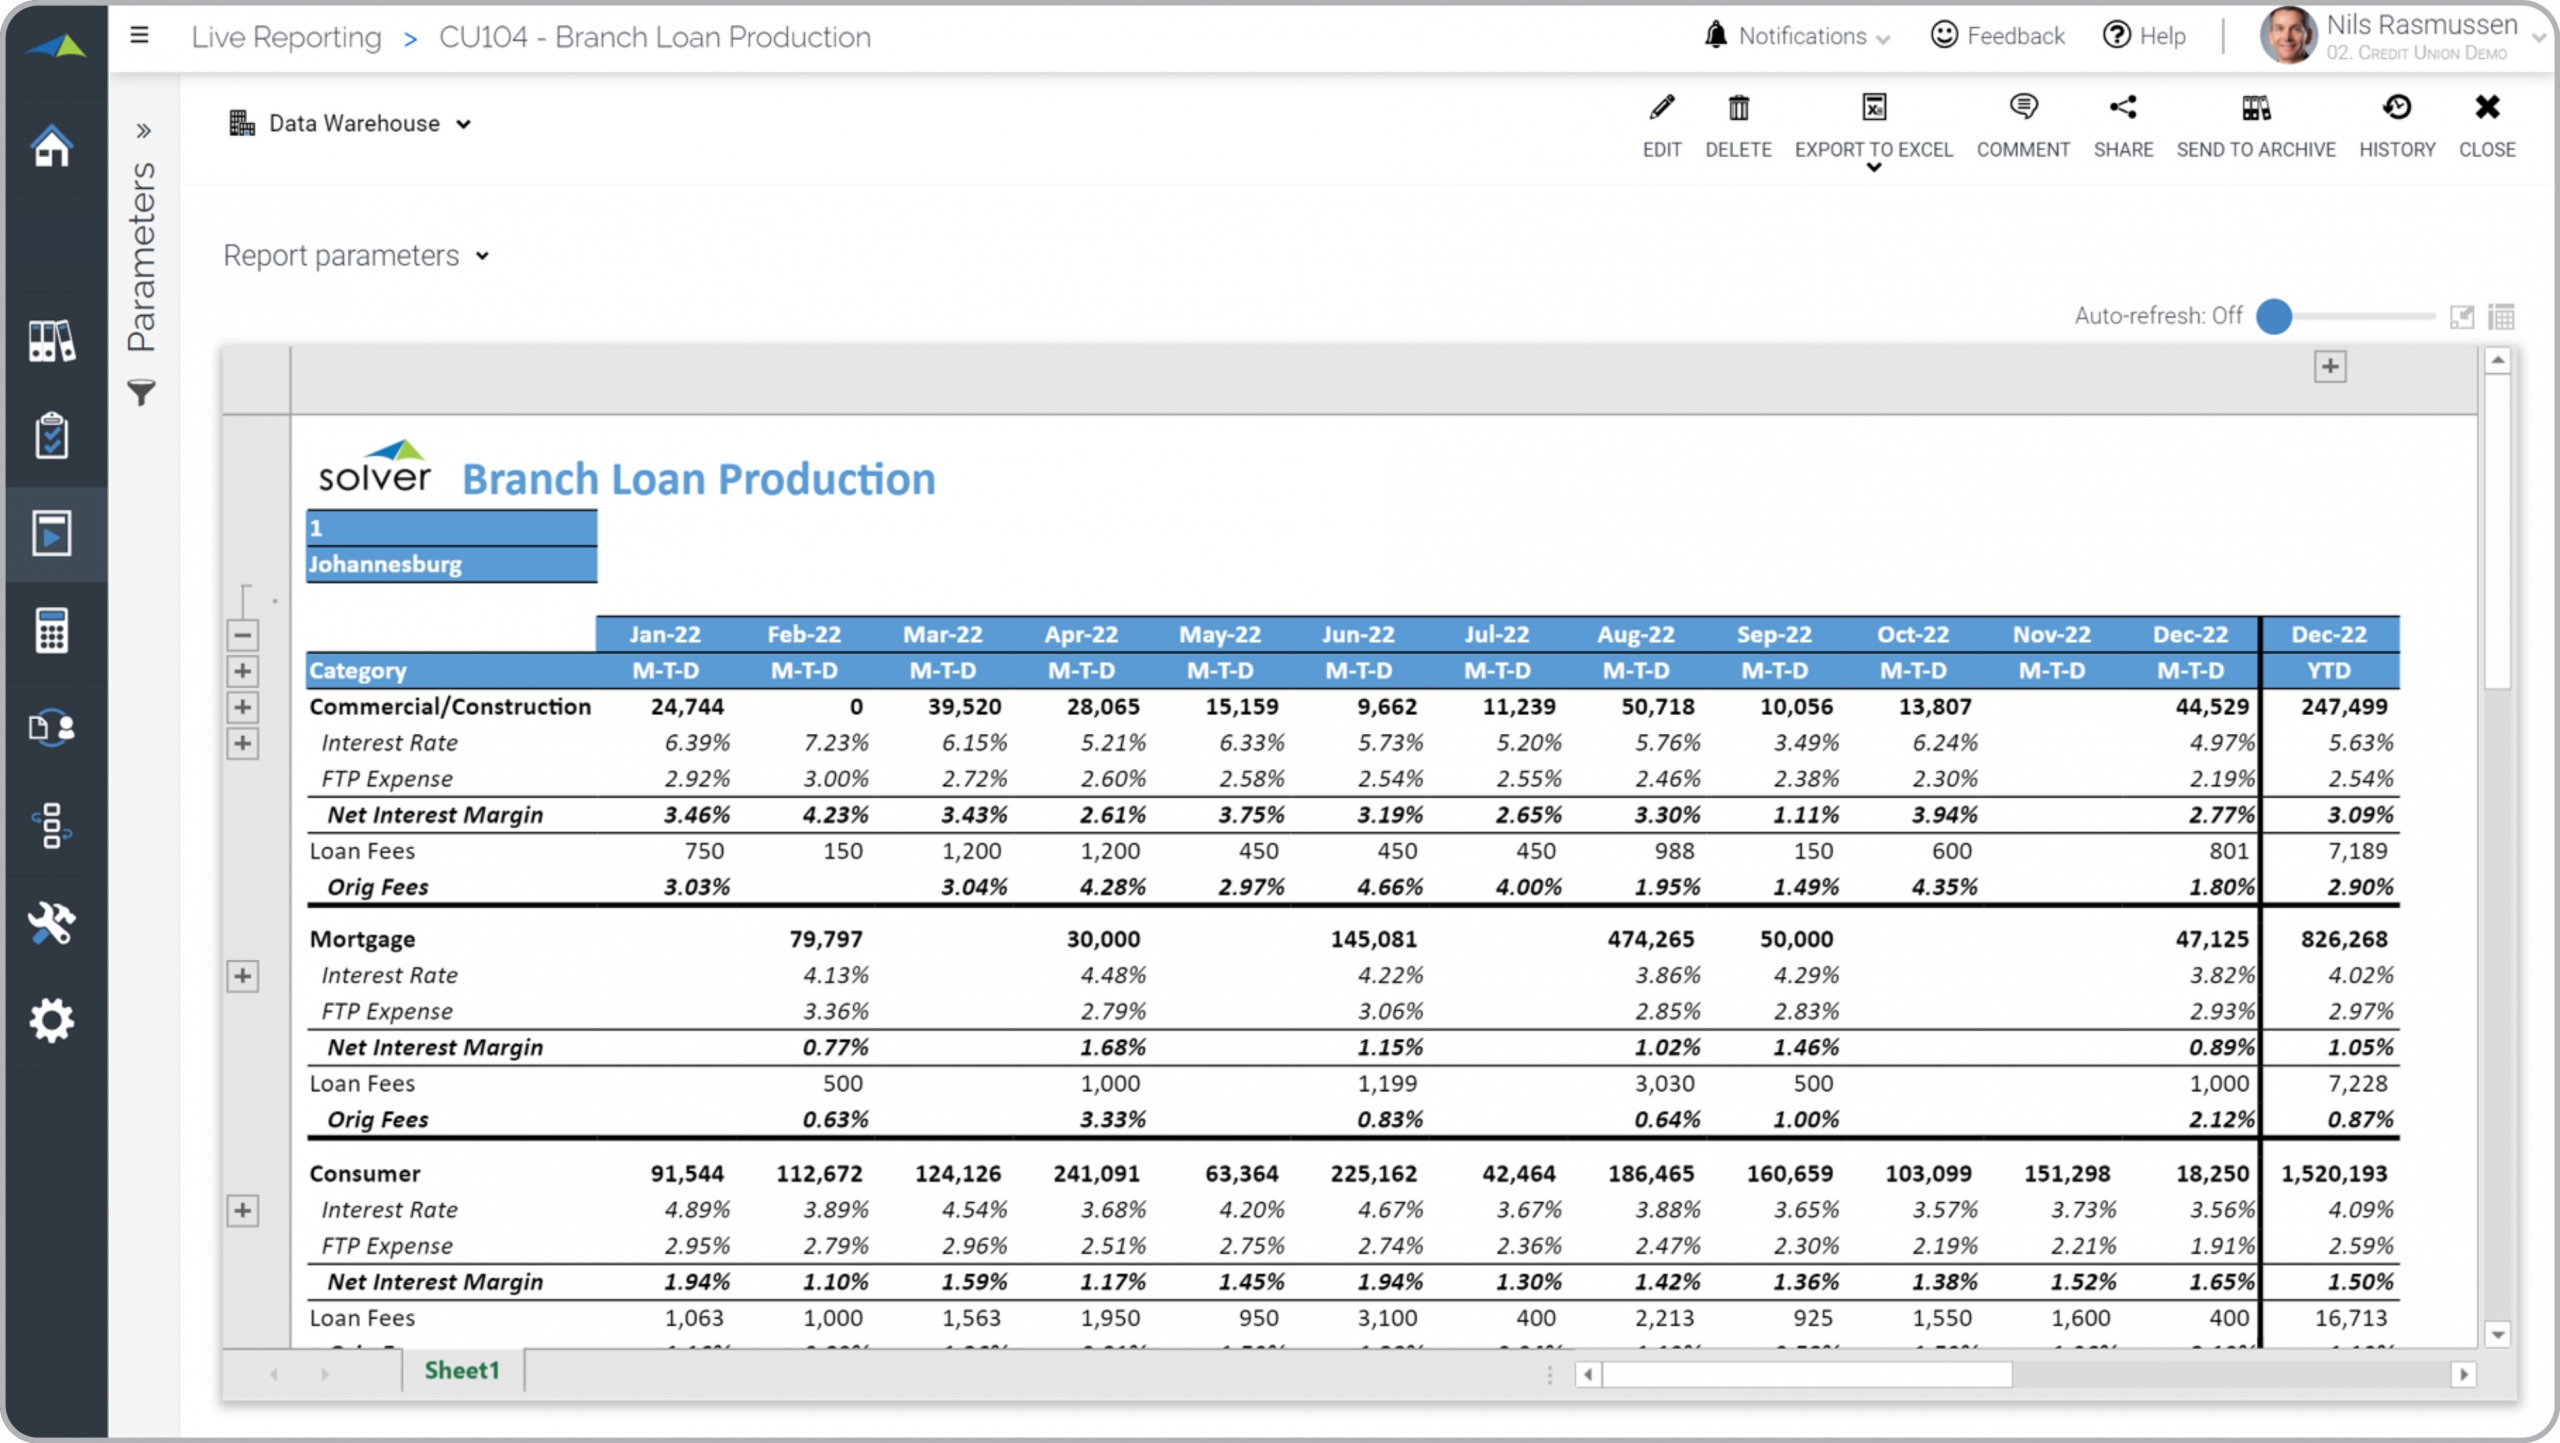
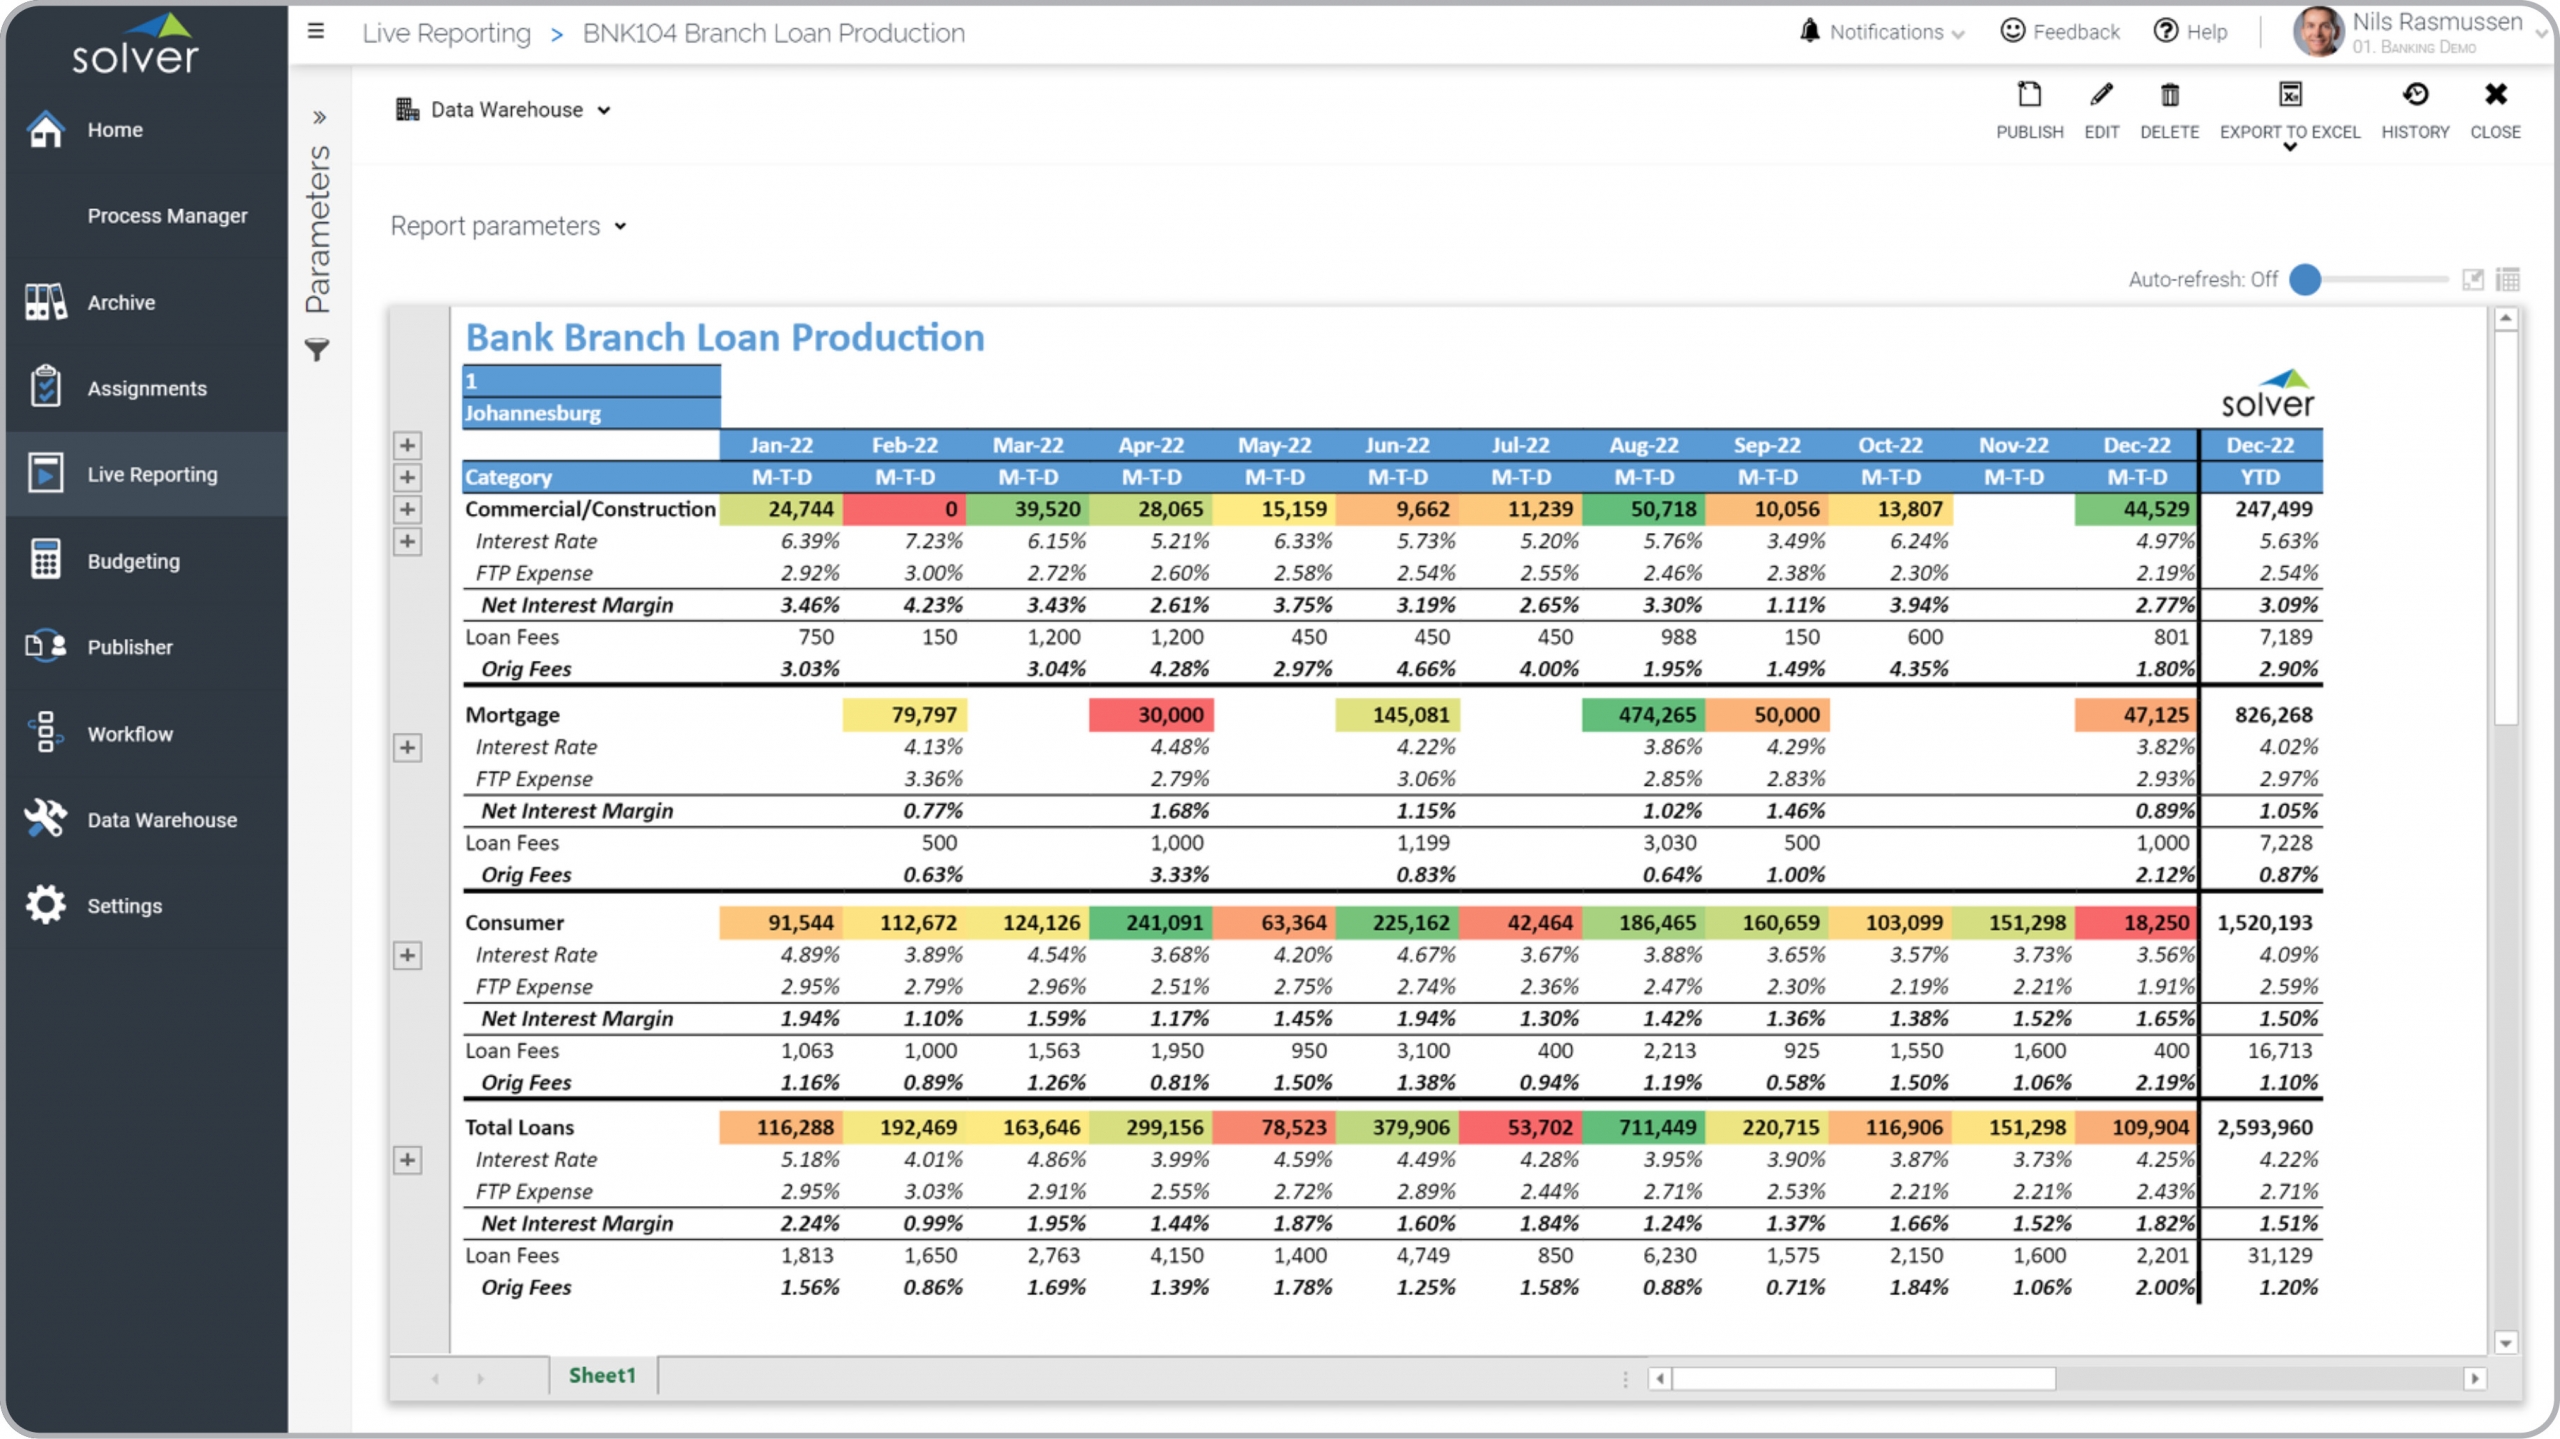
Credit Union – Branch Loan Production
Monthly trend for Loan production (sales).
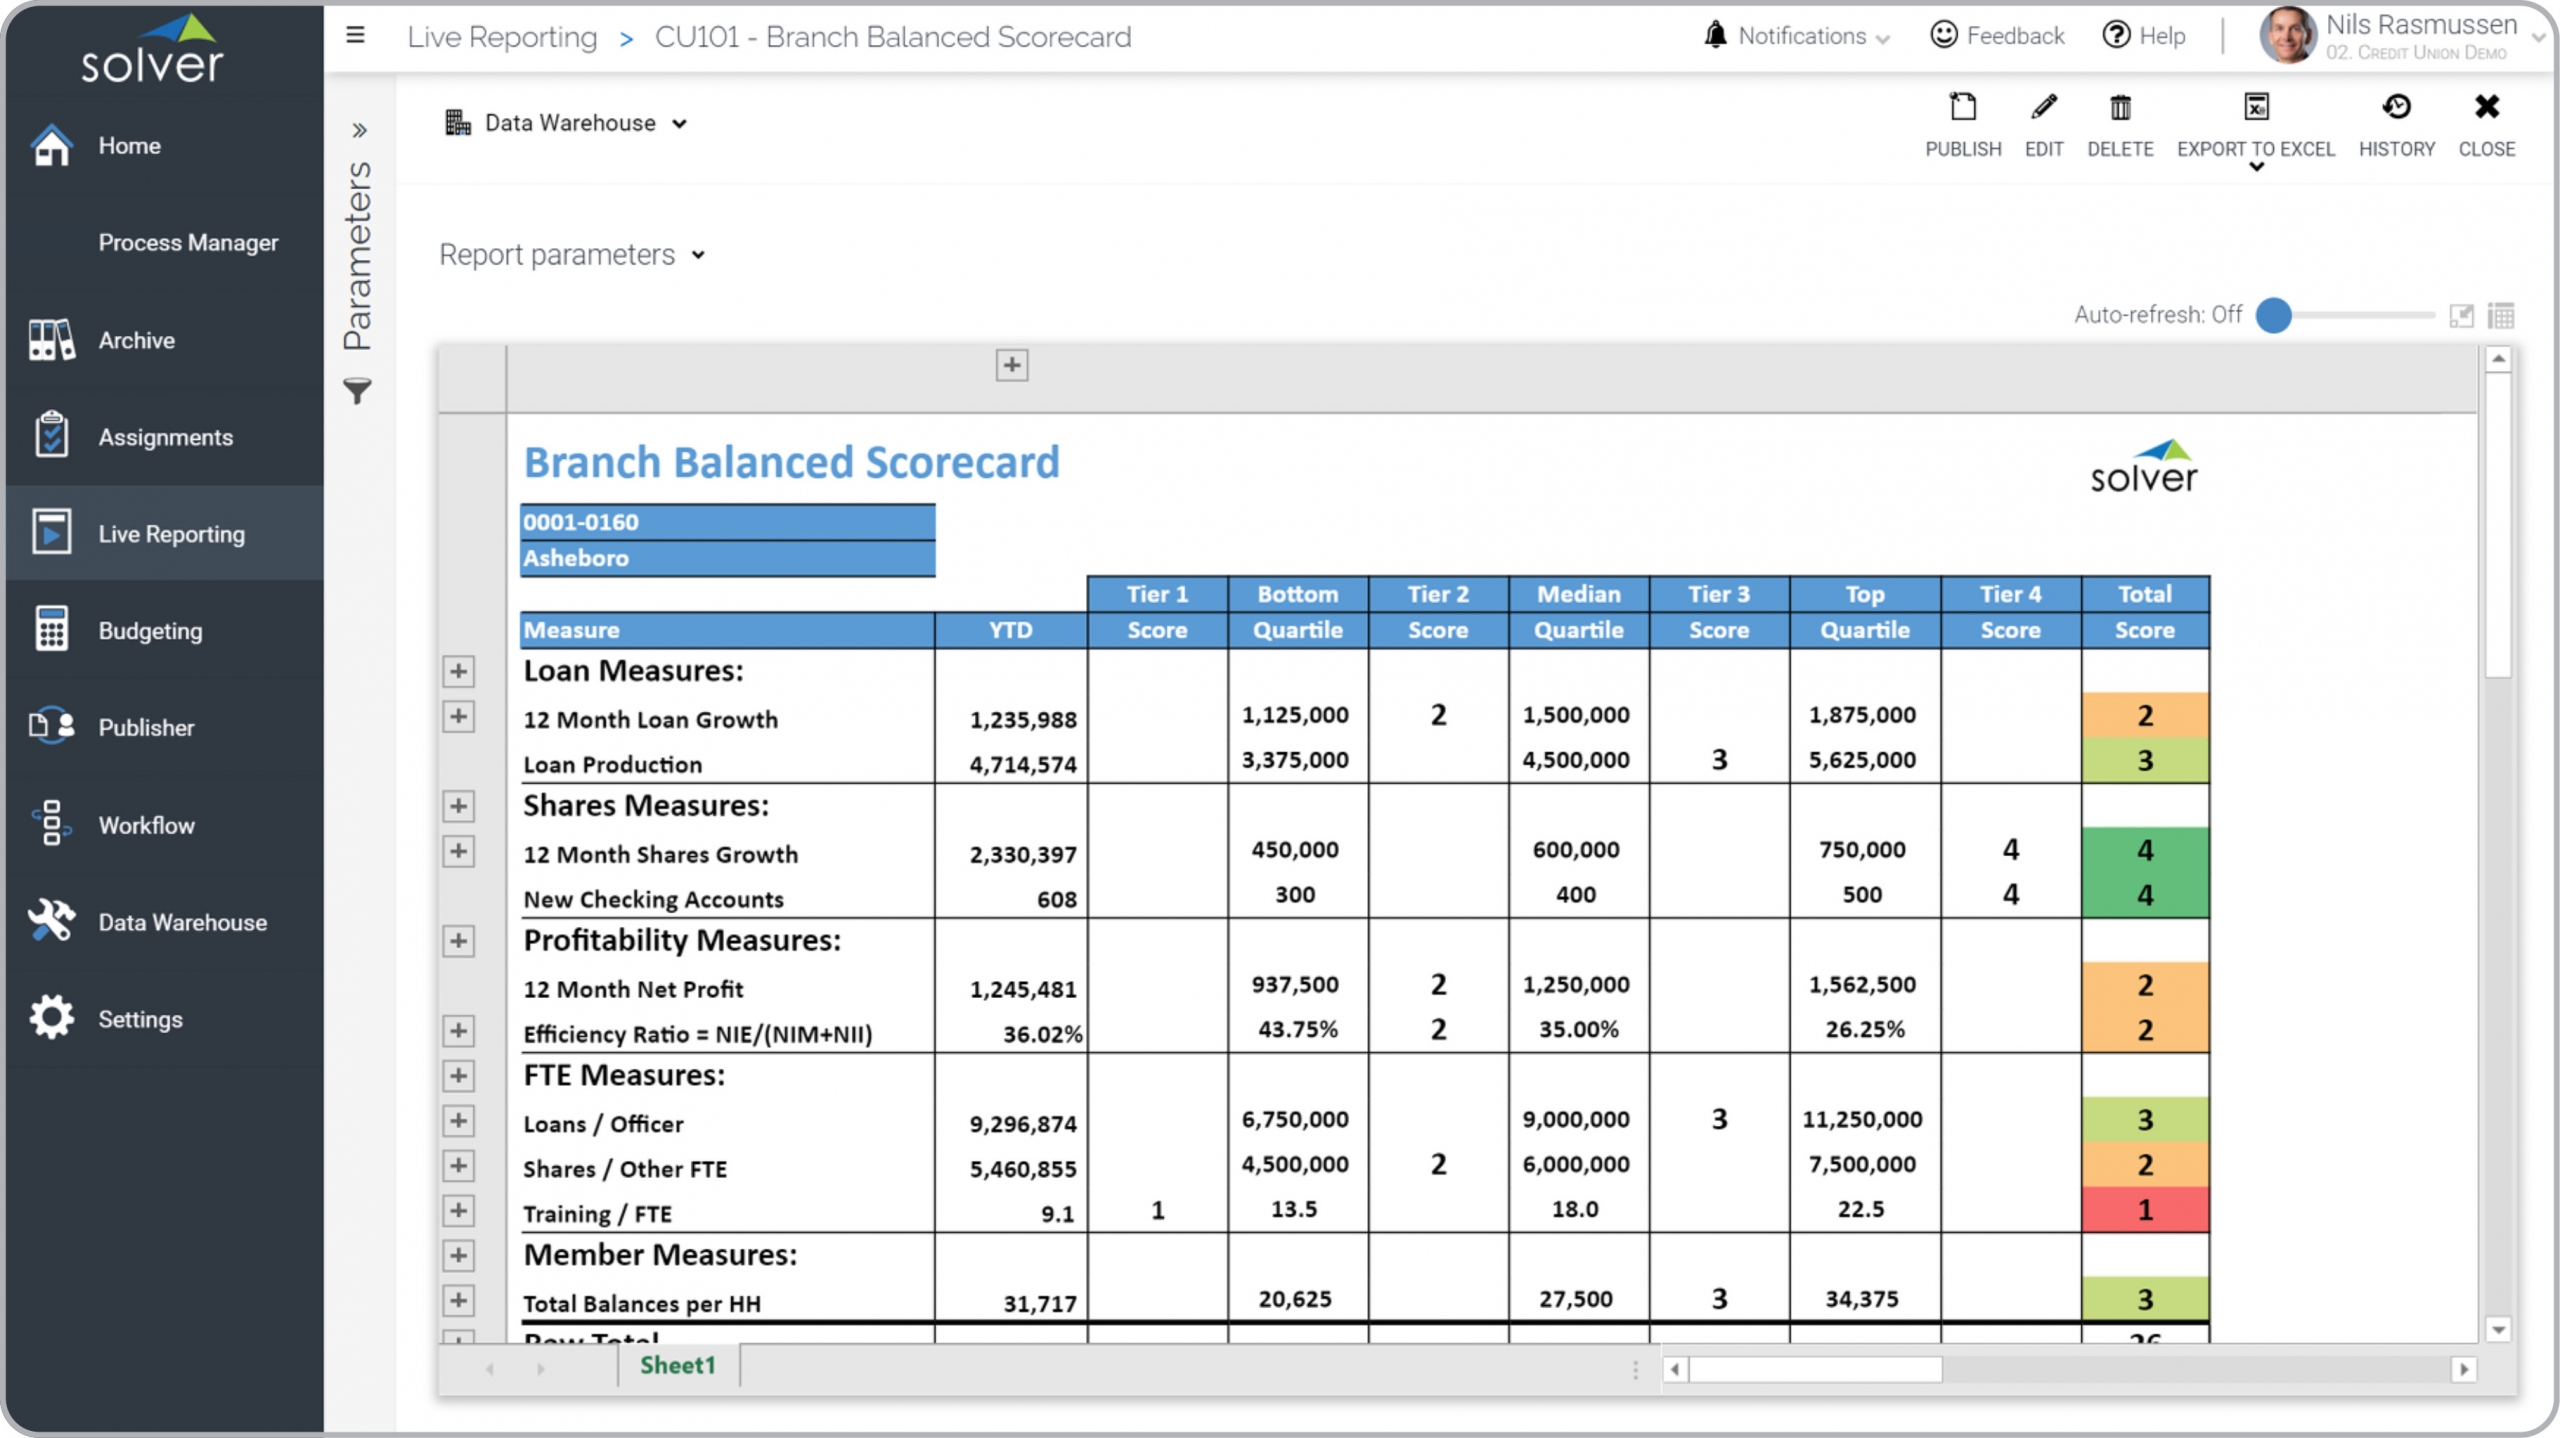
Credit Union – Branch Balanced Scorecard
Detailed KPI scorecard that is run by branch.
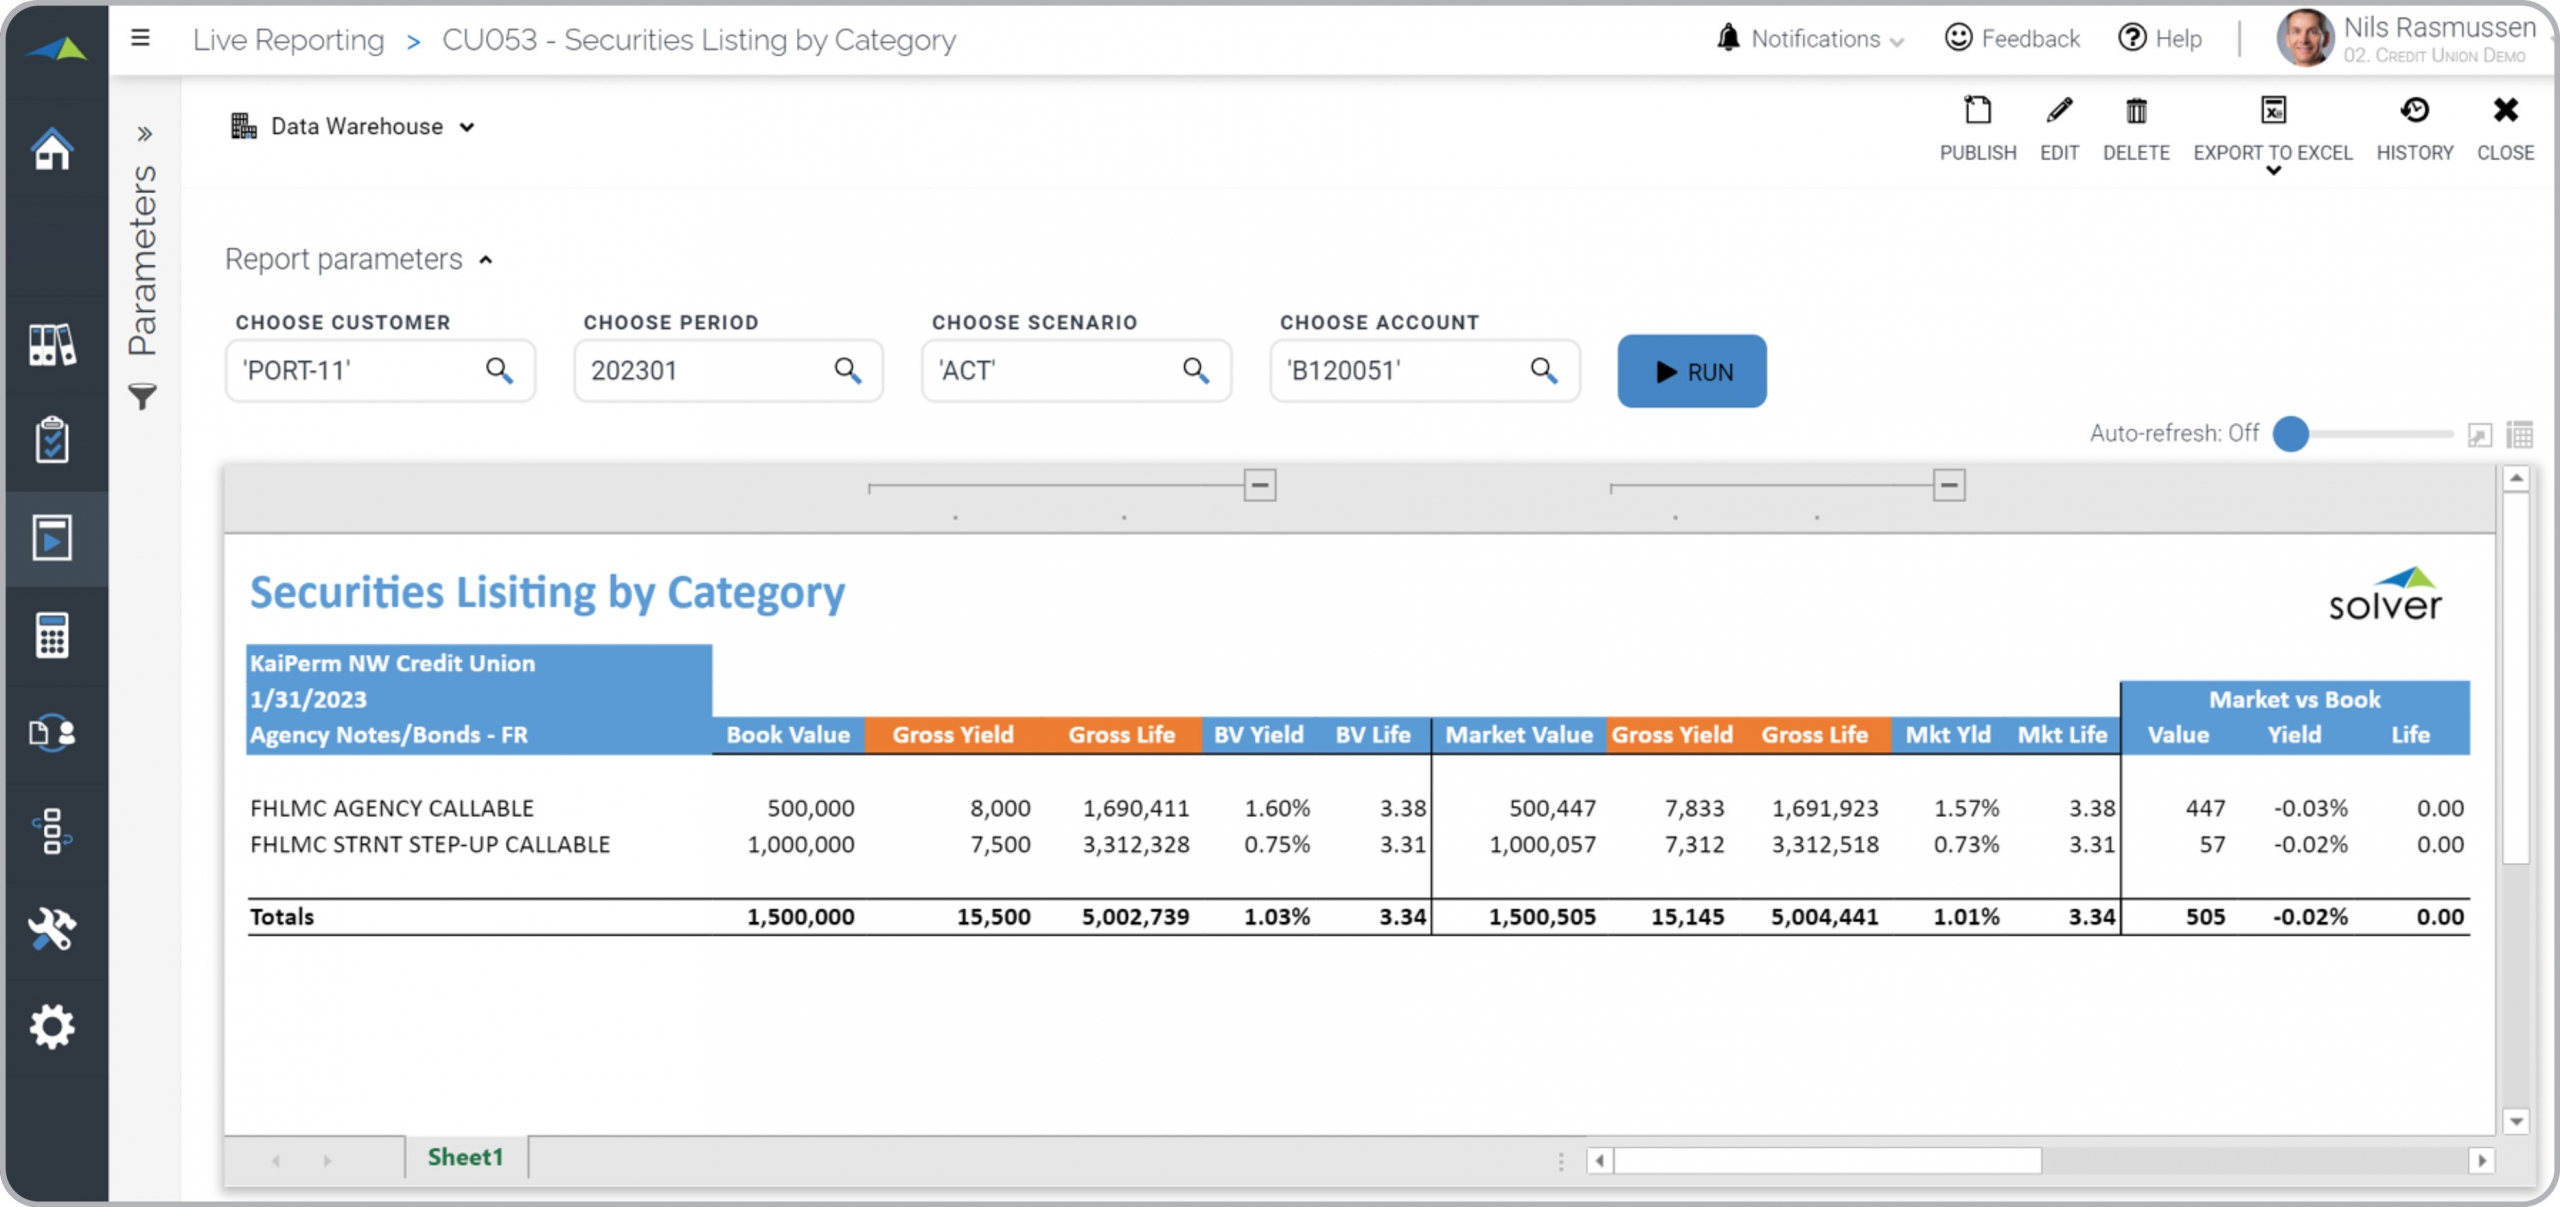
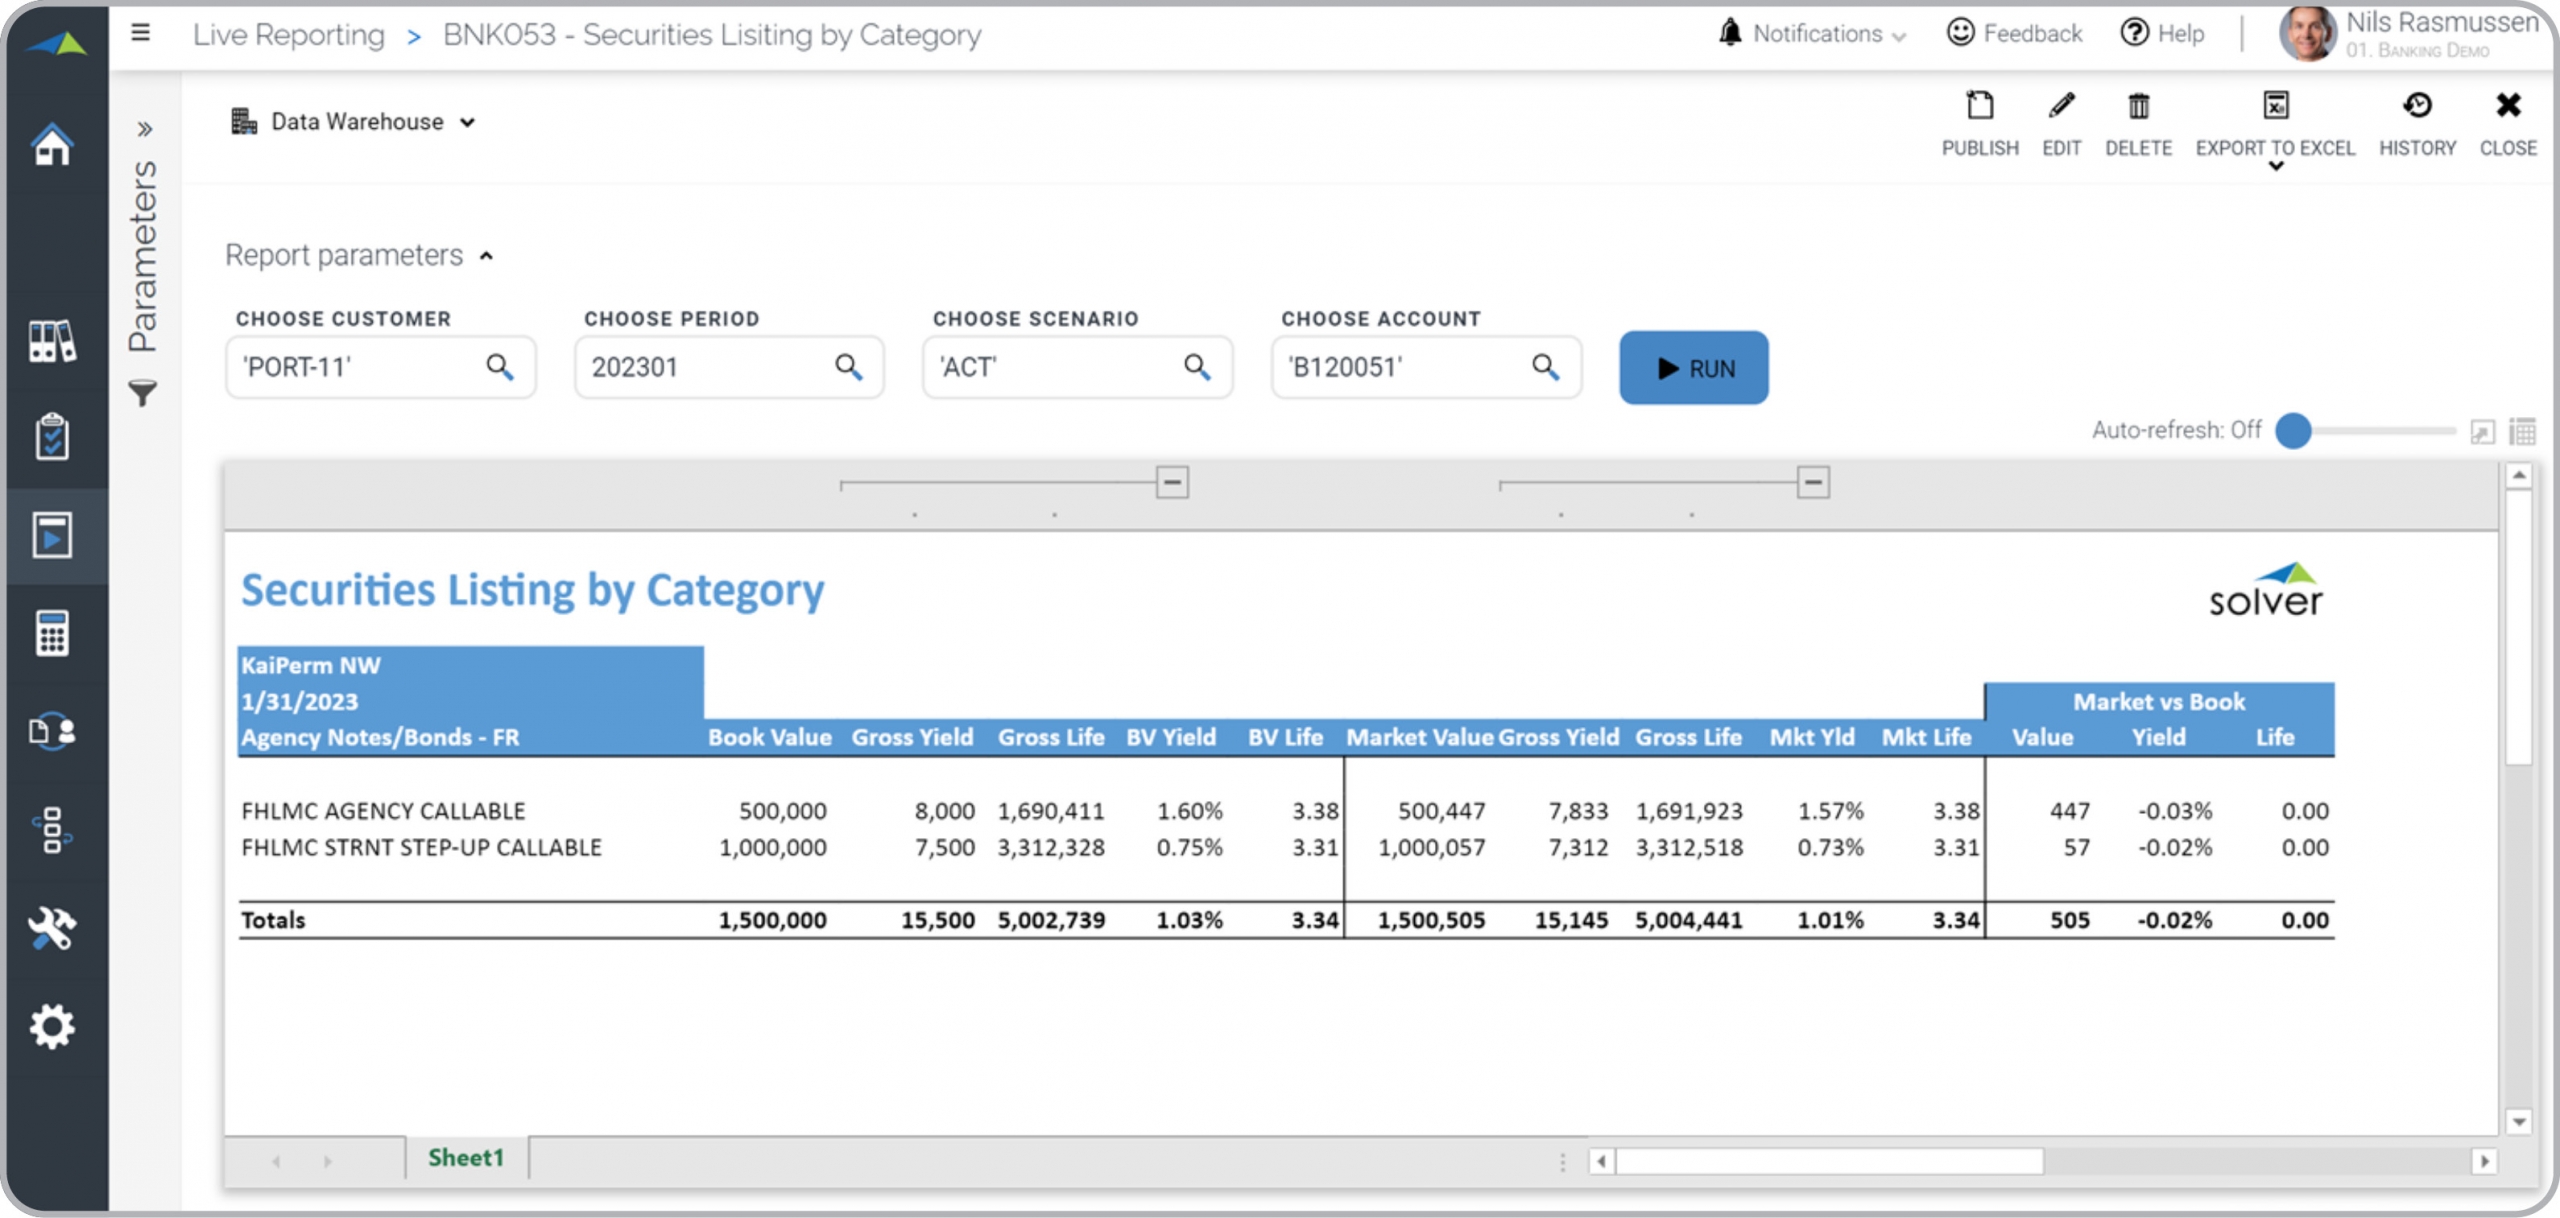
Credit Union – Securities Listing by Category
Detailed list of securities by category with metrics like book value, yield and life value.
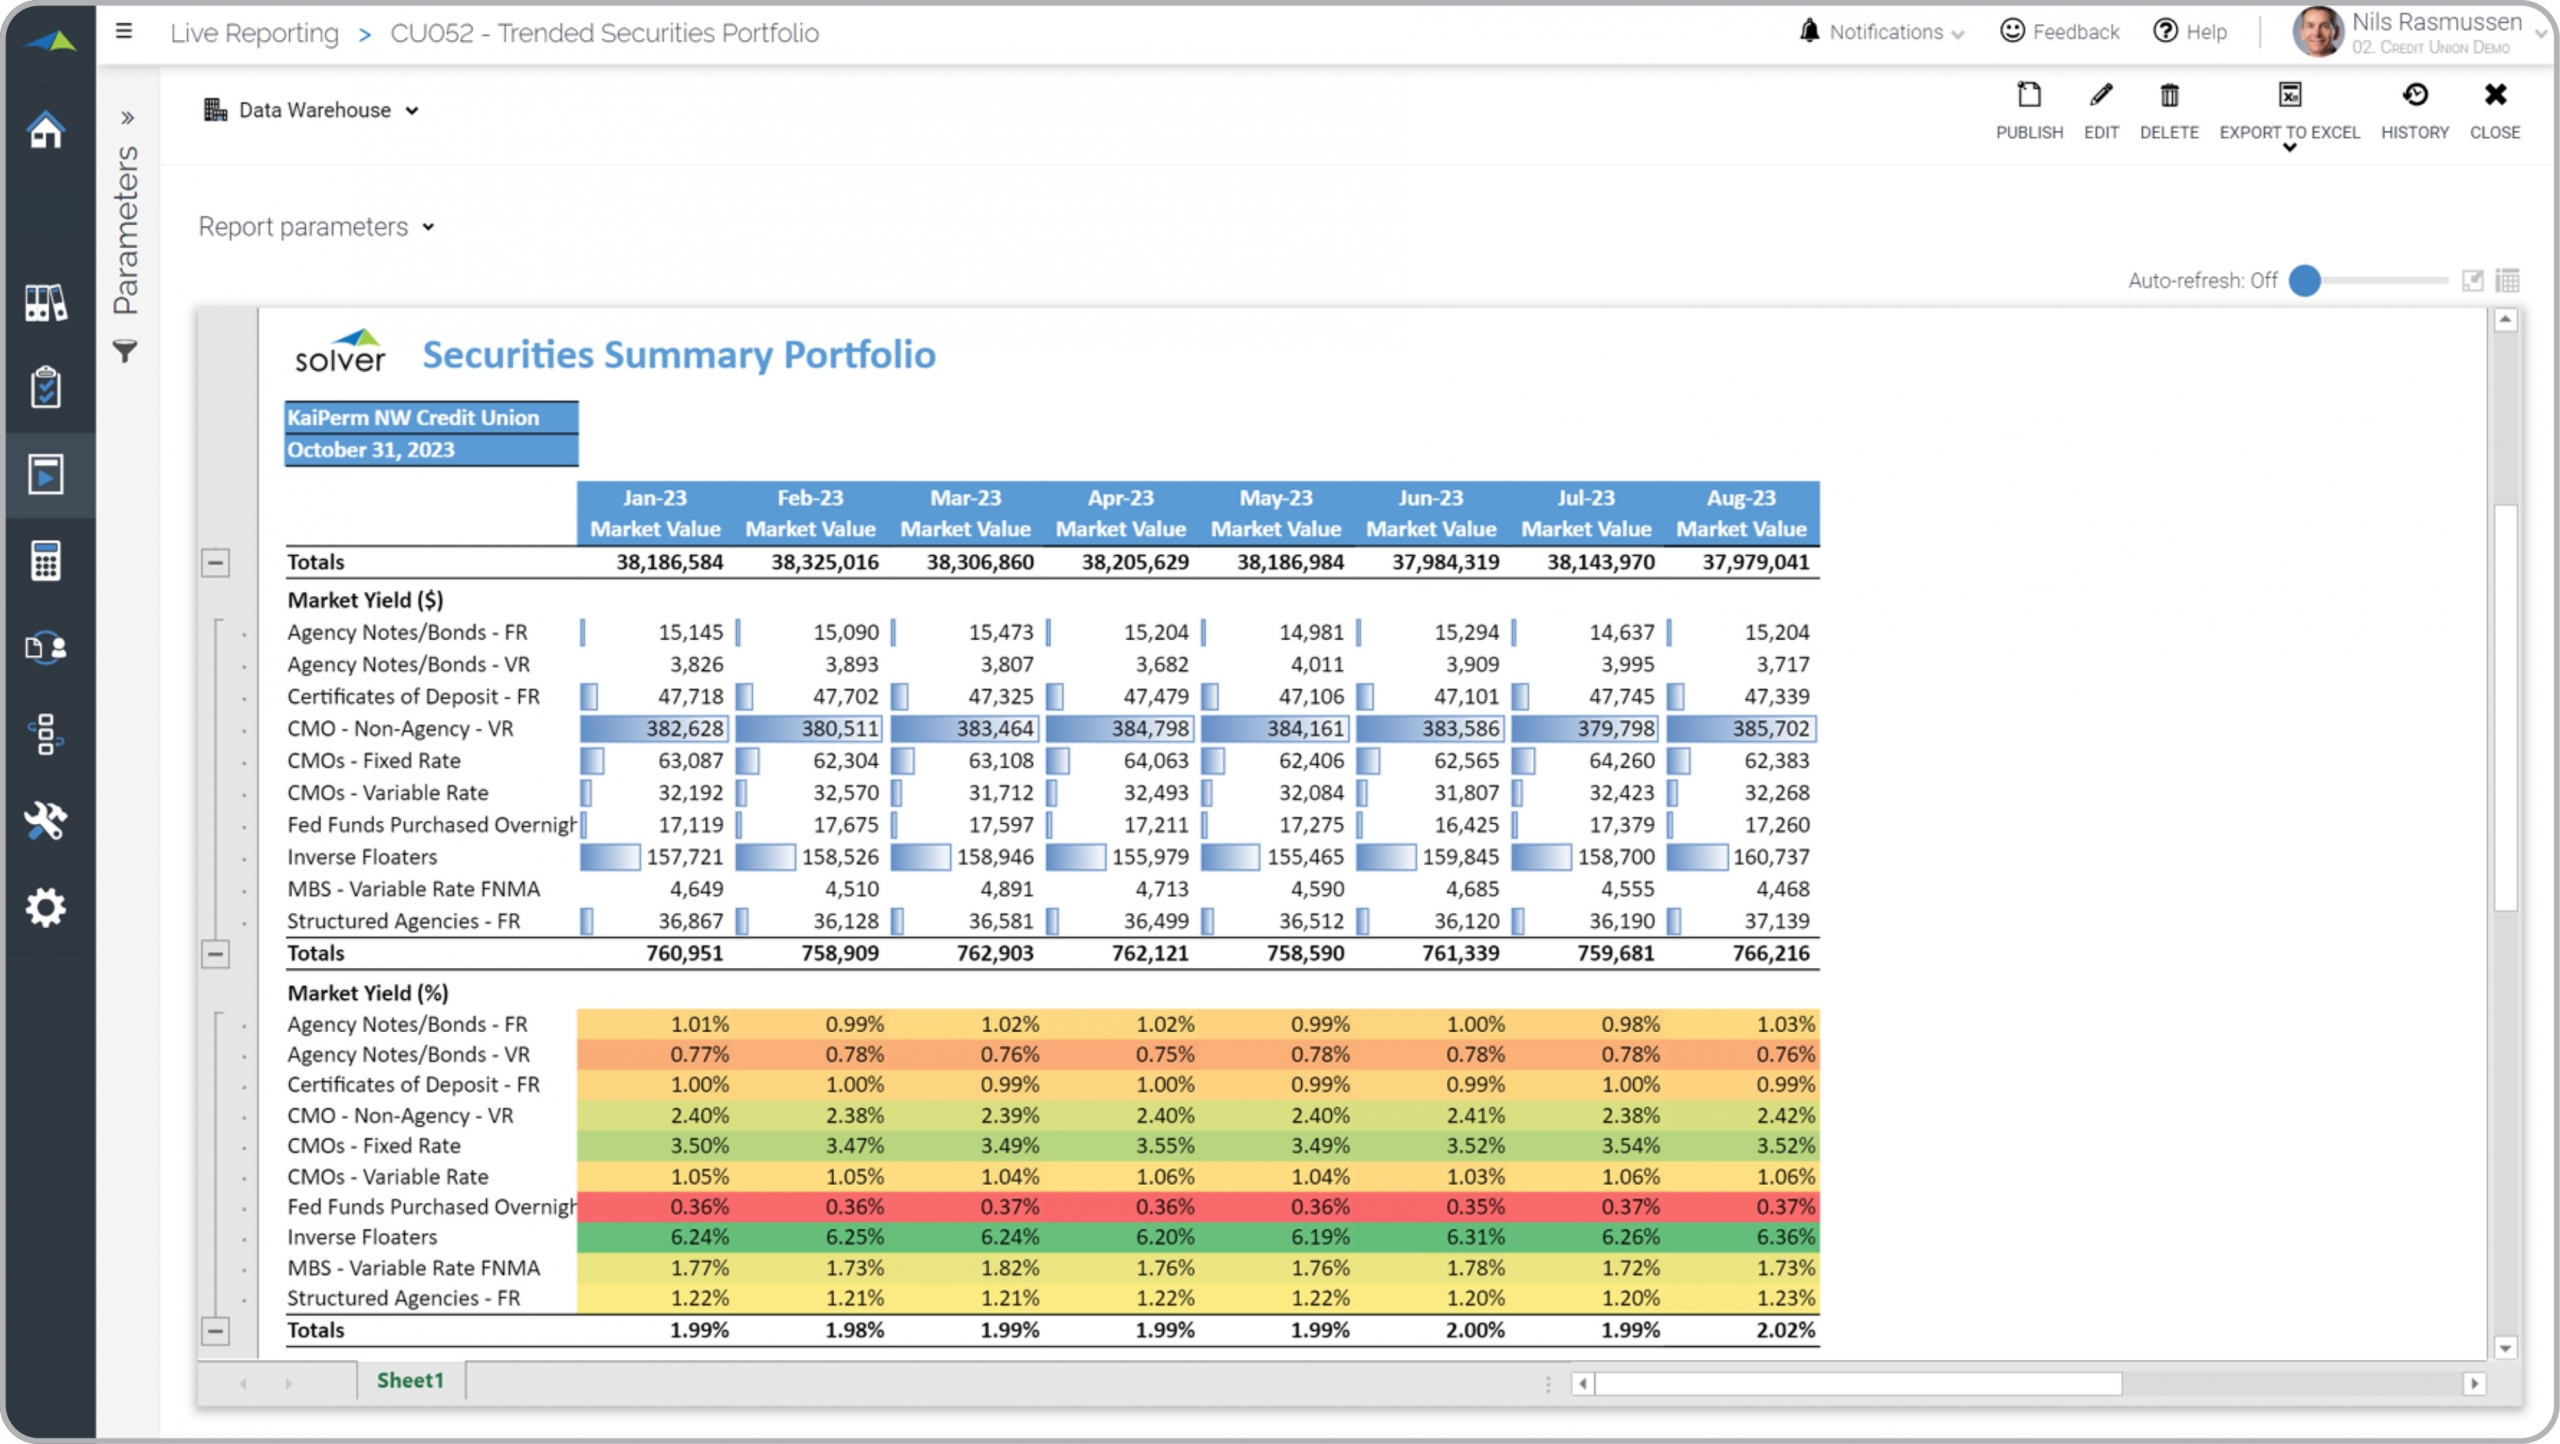
Credit Union – Trended Securities Portfolio
Trend analysis of securities portfolio with market versus book value and other metrics.
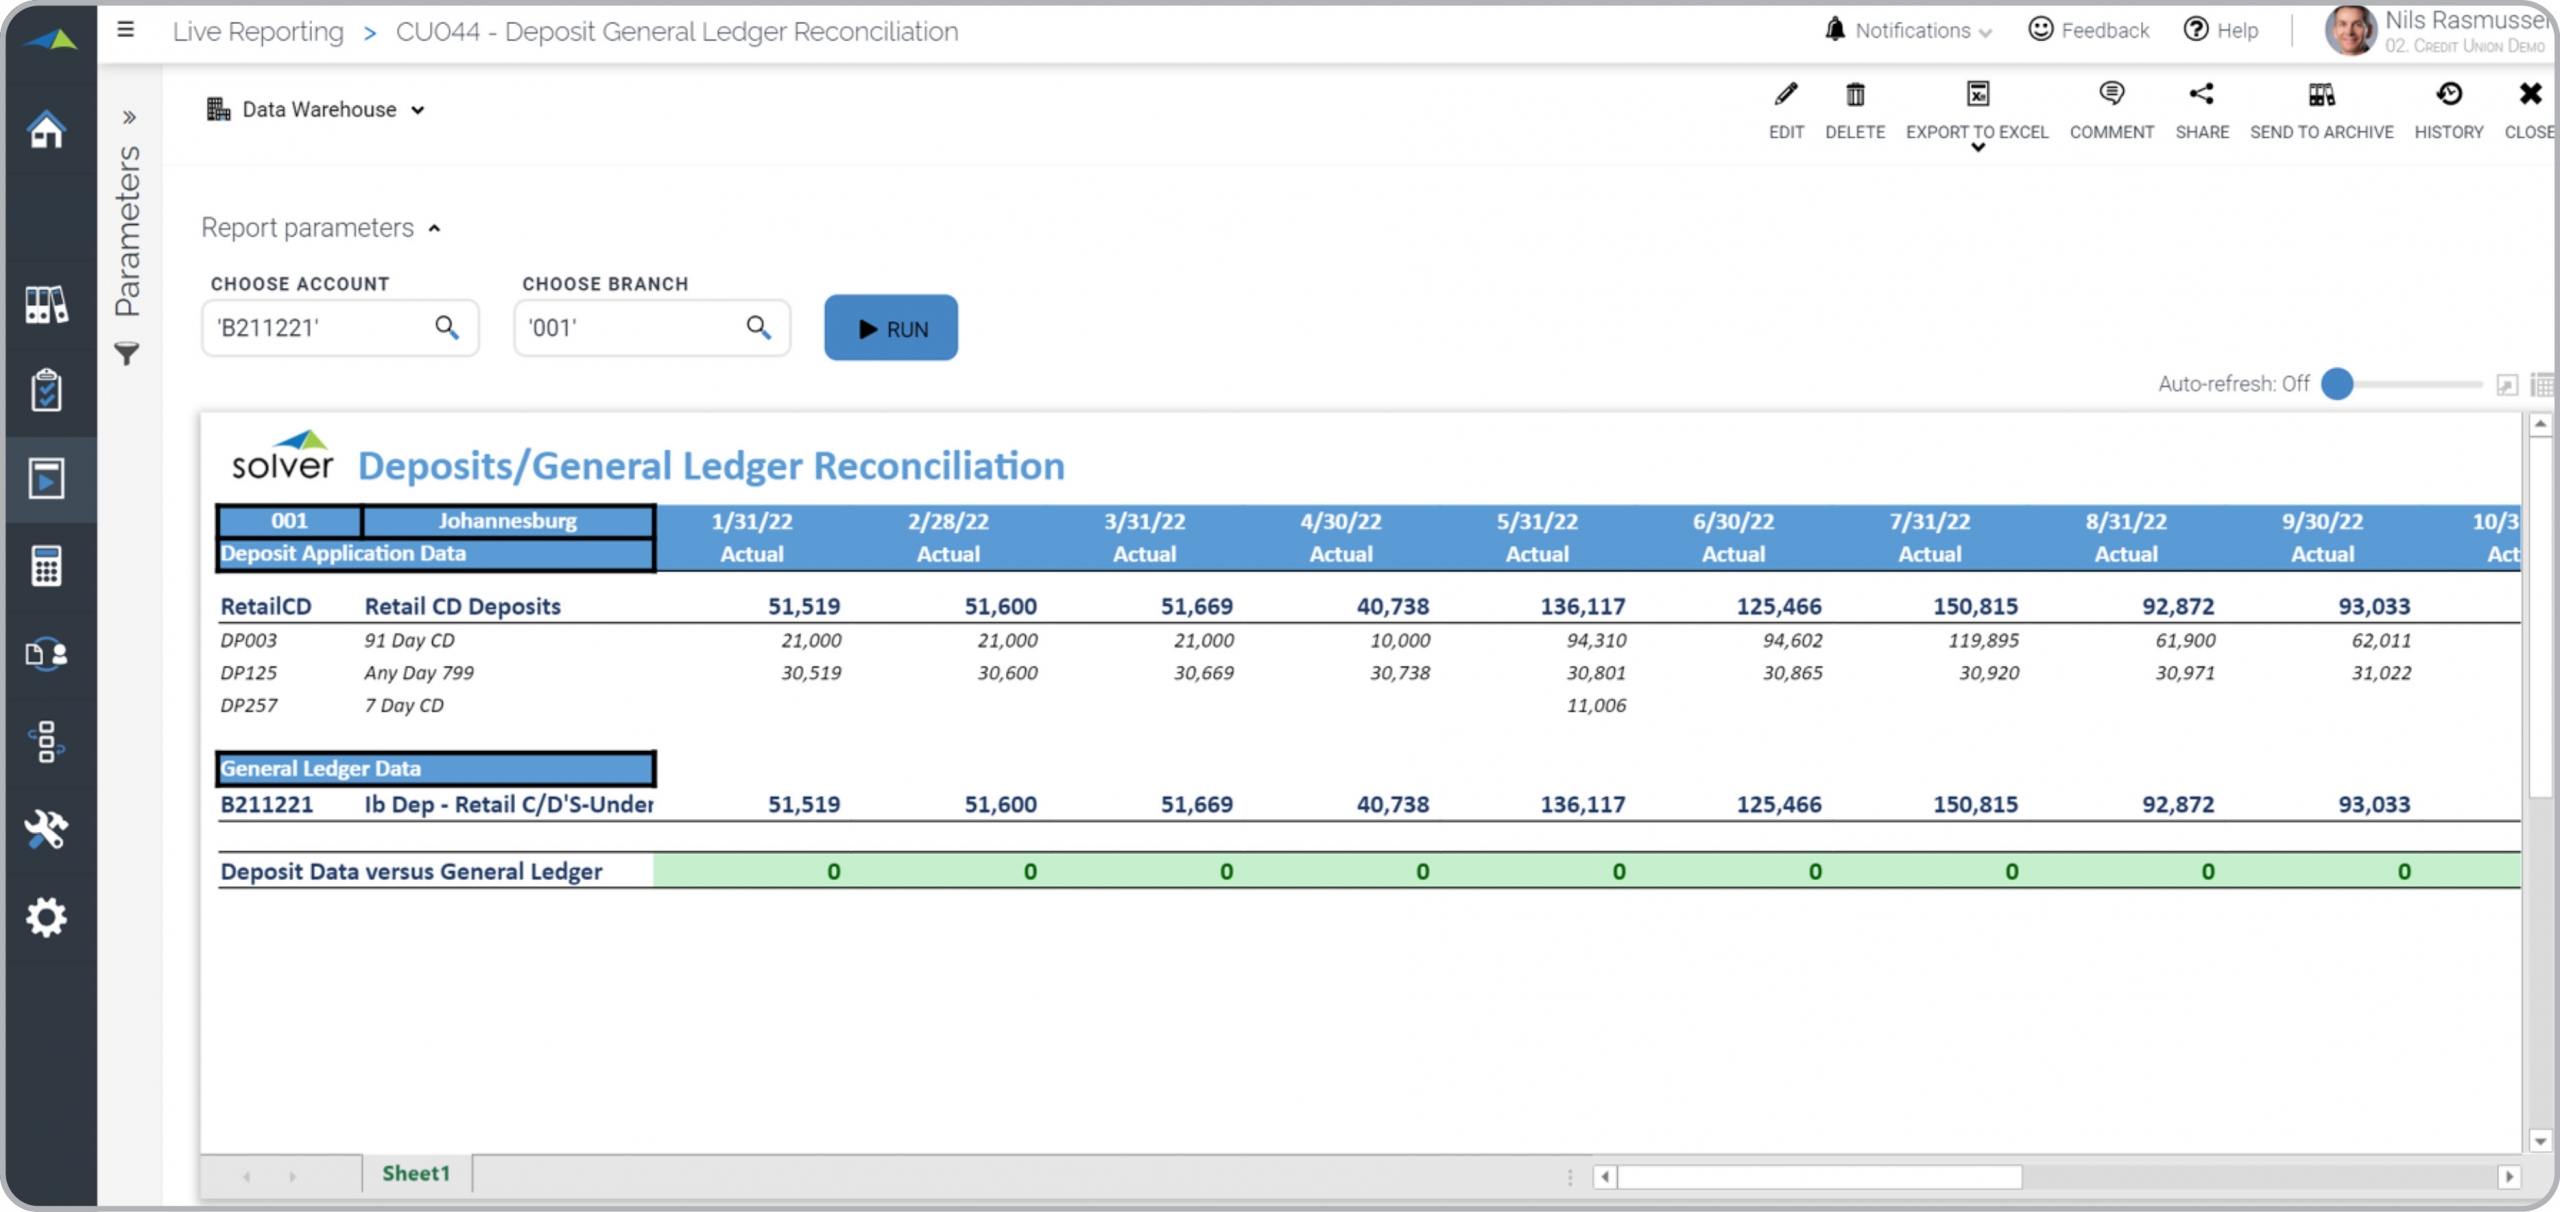
Credit Union – Deposit/GL Reconciliation
Automated reconciliation of Deposits with corresponding GL entries.
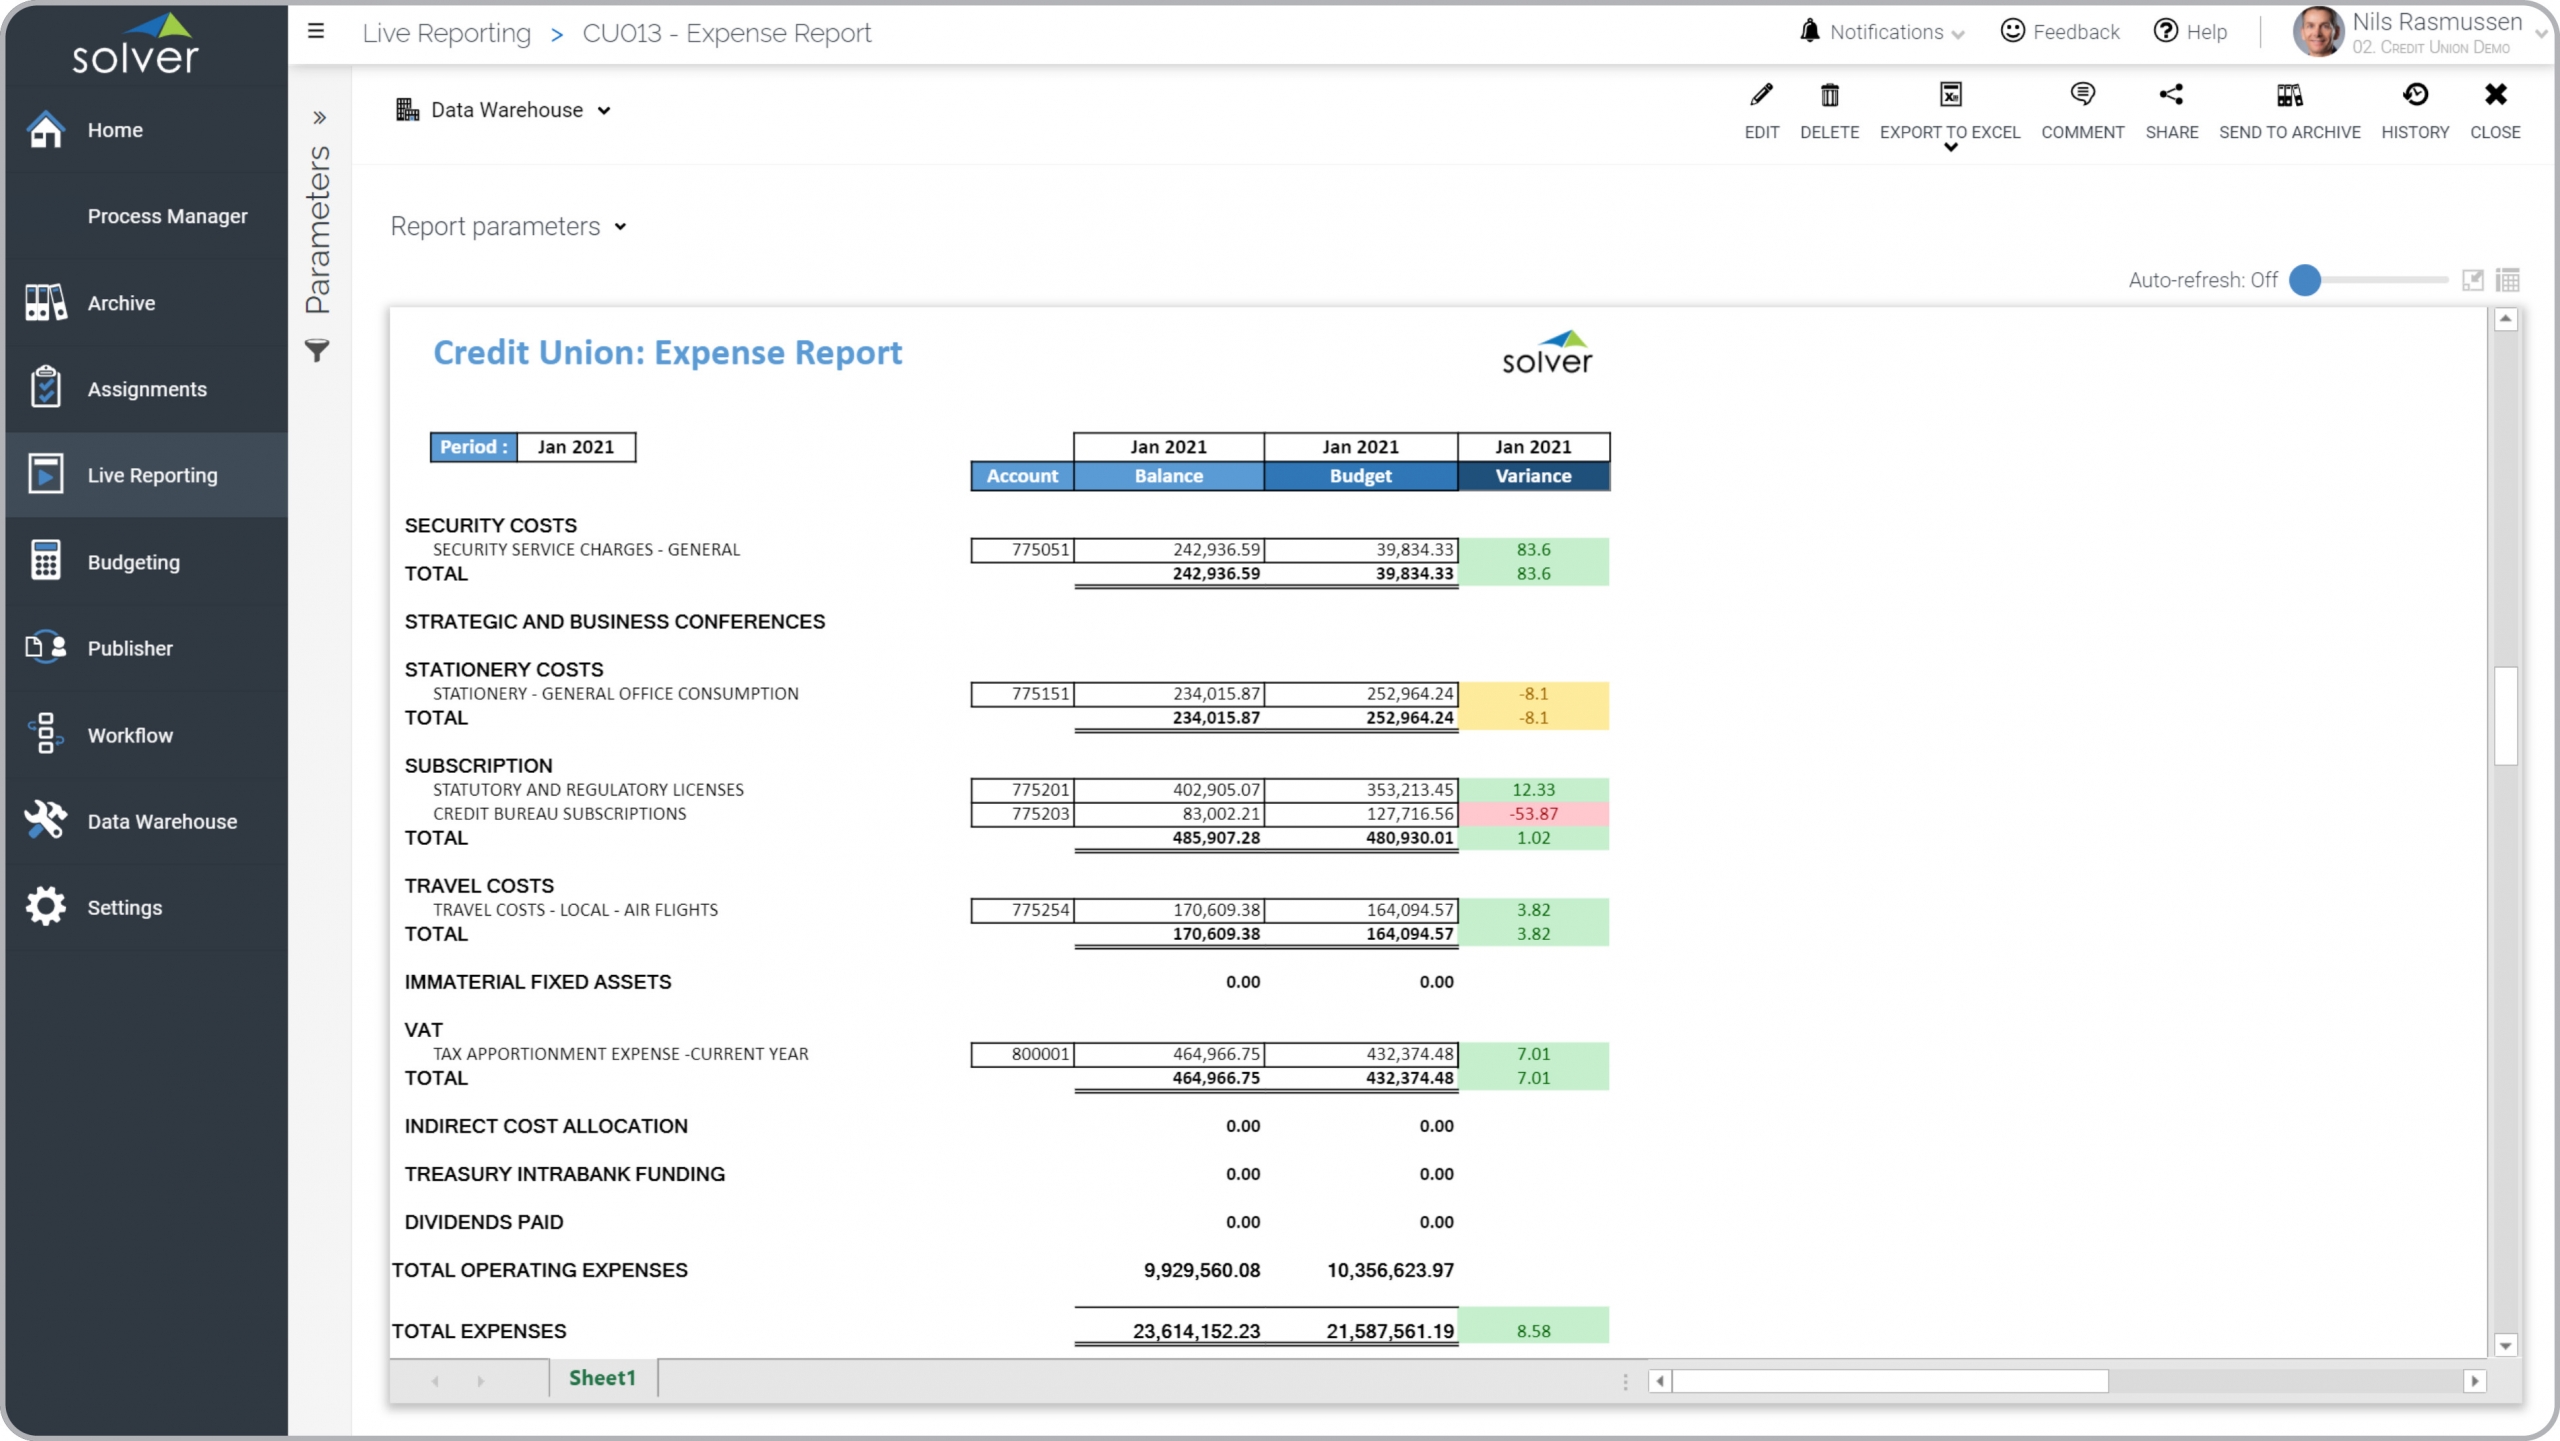
Credit Union – Expense Report
Expense analysis by account. Compares monthly actuals to budget and shows the variance.

Credit Union – Securities Summary Portfolio
Analysis of securities portfolio with market versus book value and other metrics.
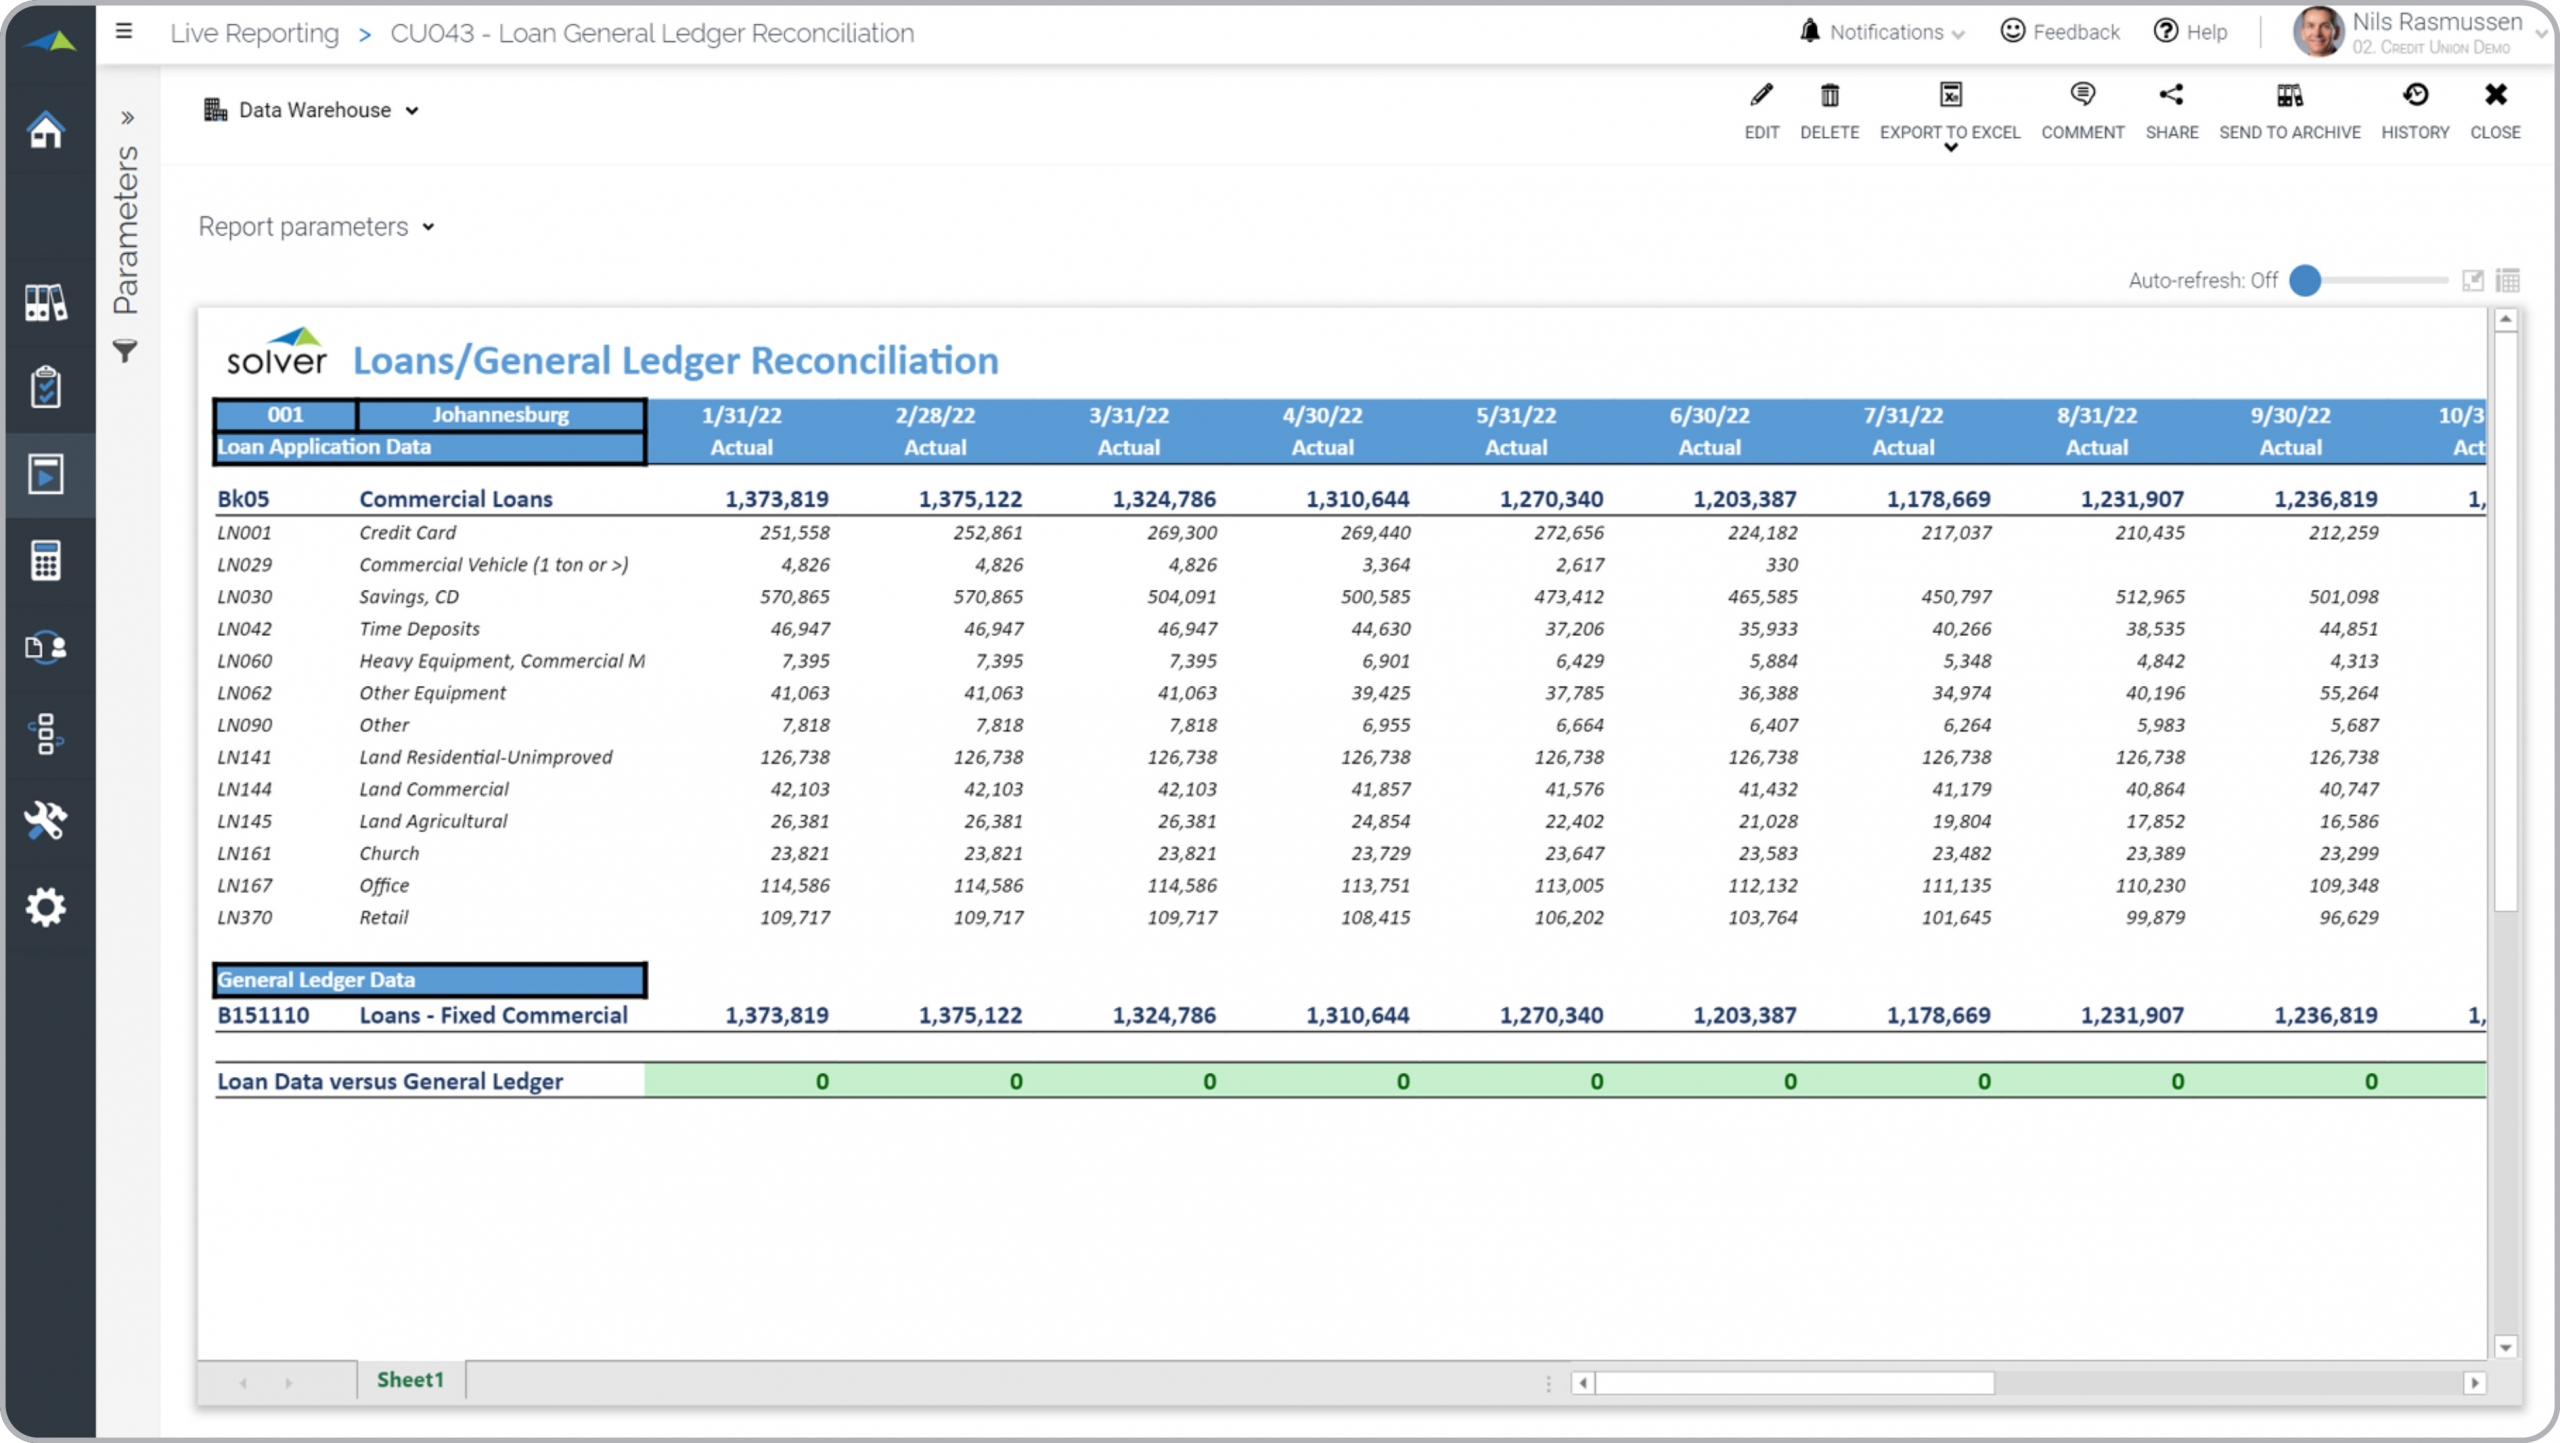
Credit Union – Loan/GL Reconciliation
Automated reconciliation of Loan transactions with corresponding GL entries.
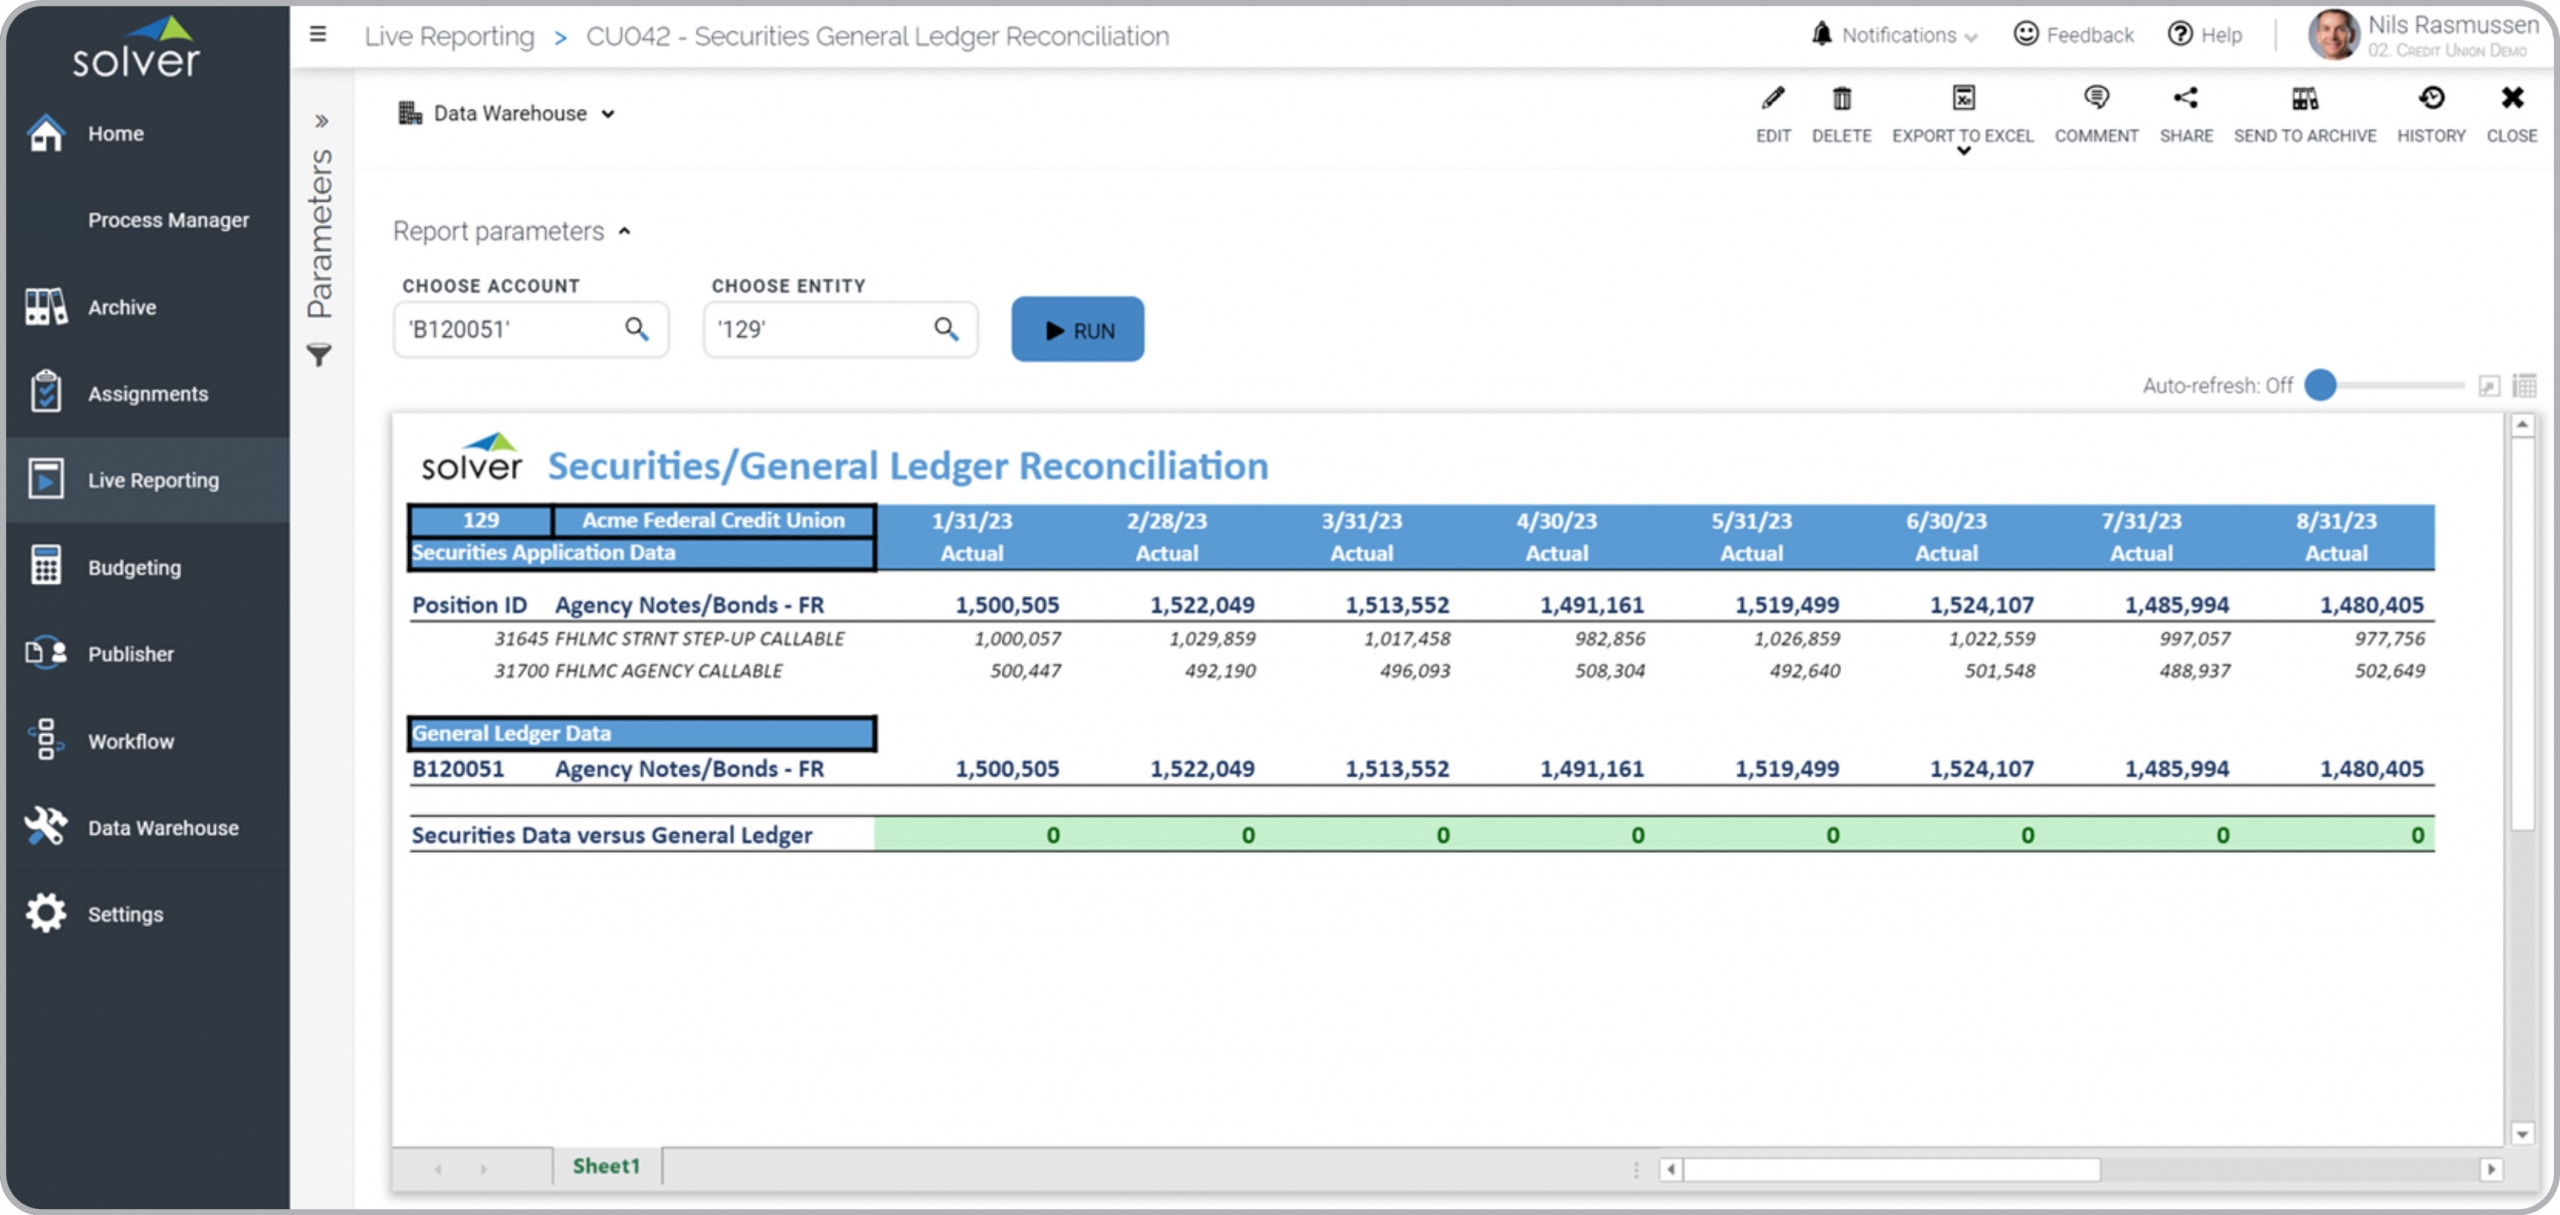
Credit Union – Securities/GL Reconciliation
Automated reconciliation of Securities transactions with corresponding GL entries.
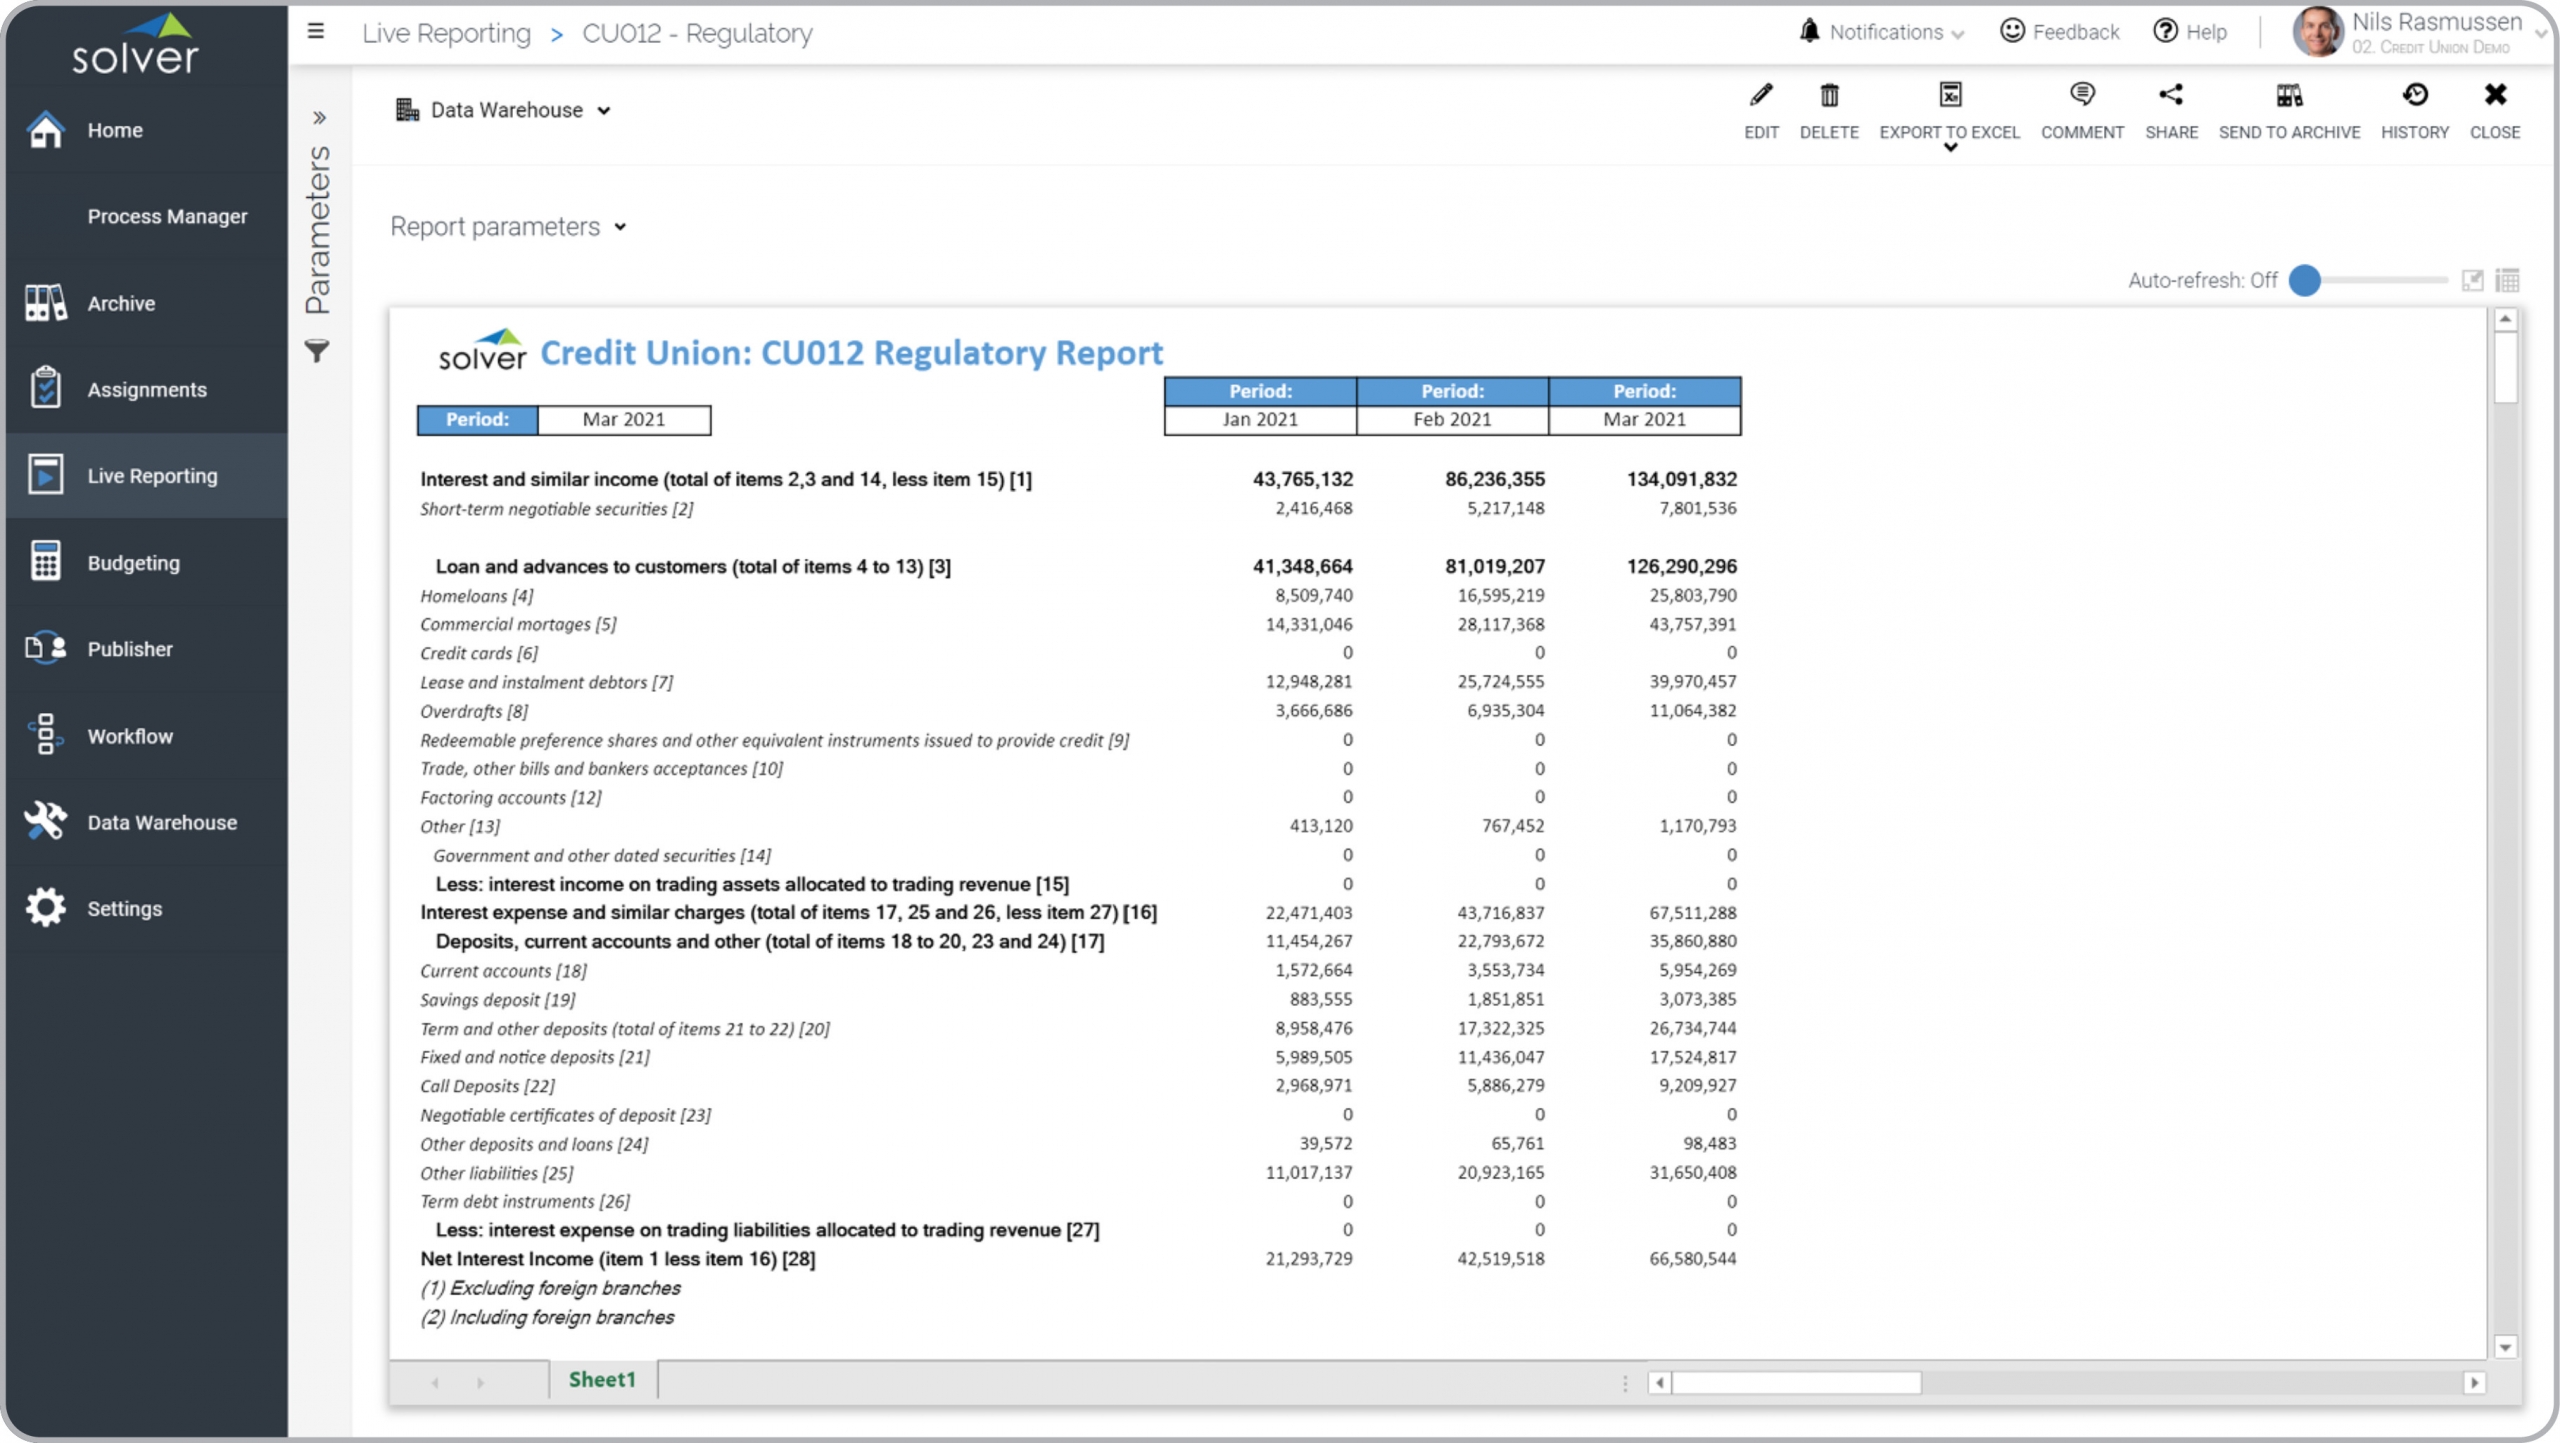
Credit Union – Regulatory Report
Regulatory report example that dynamically lists months up to the current period.
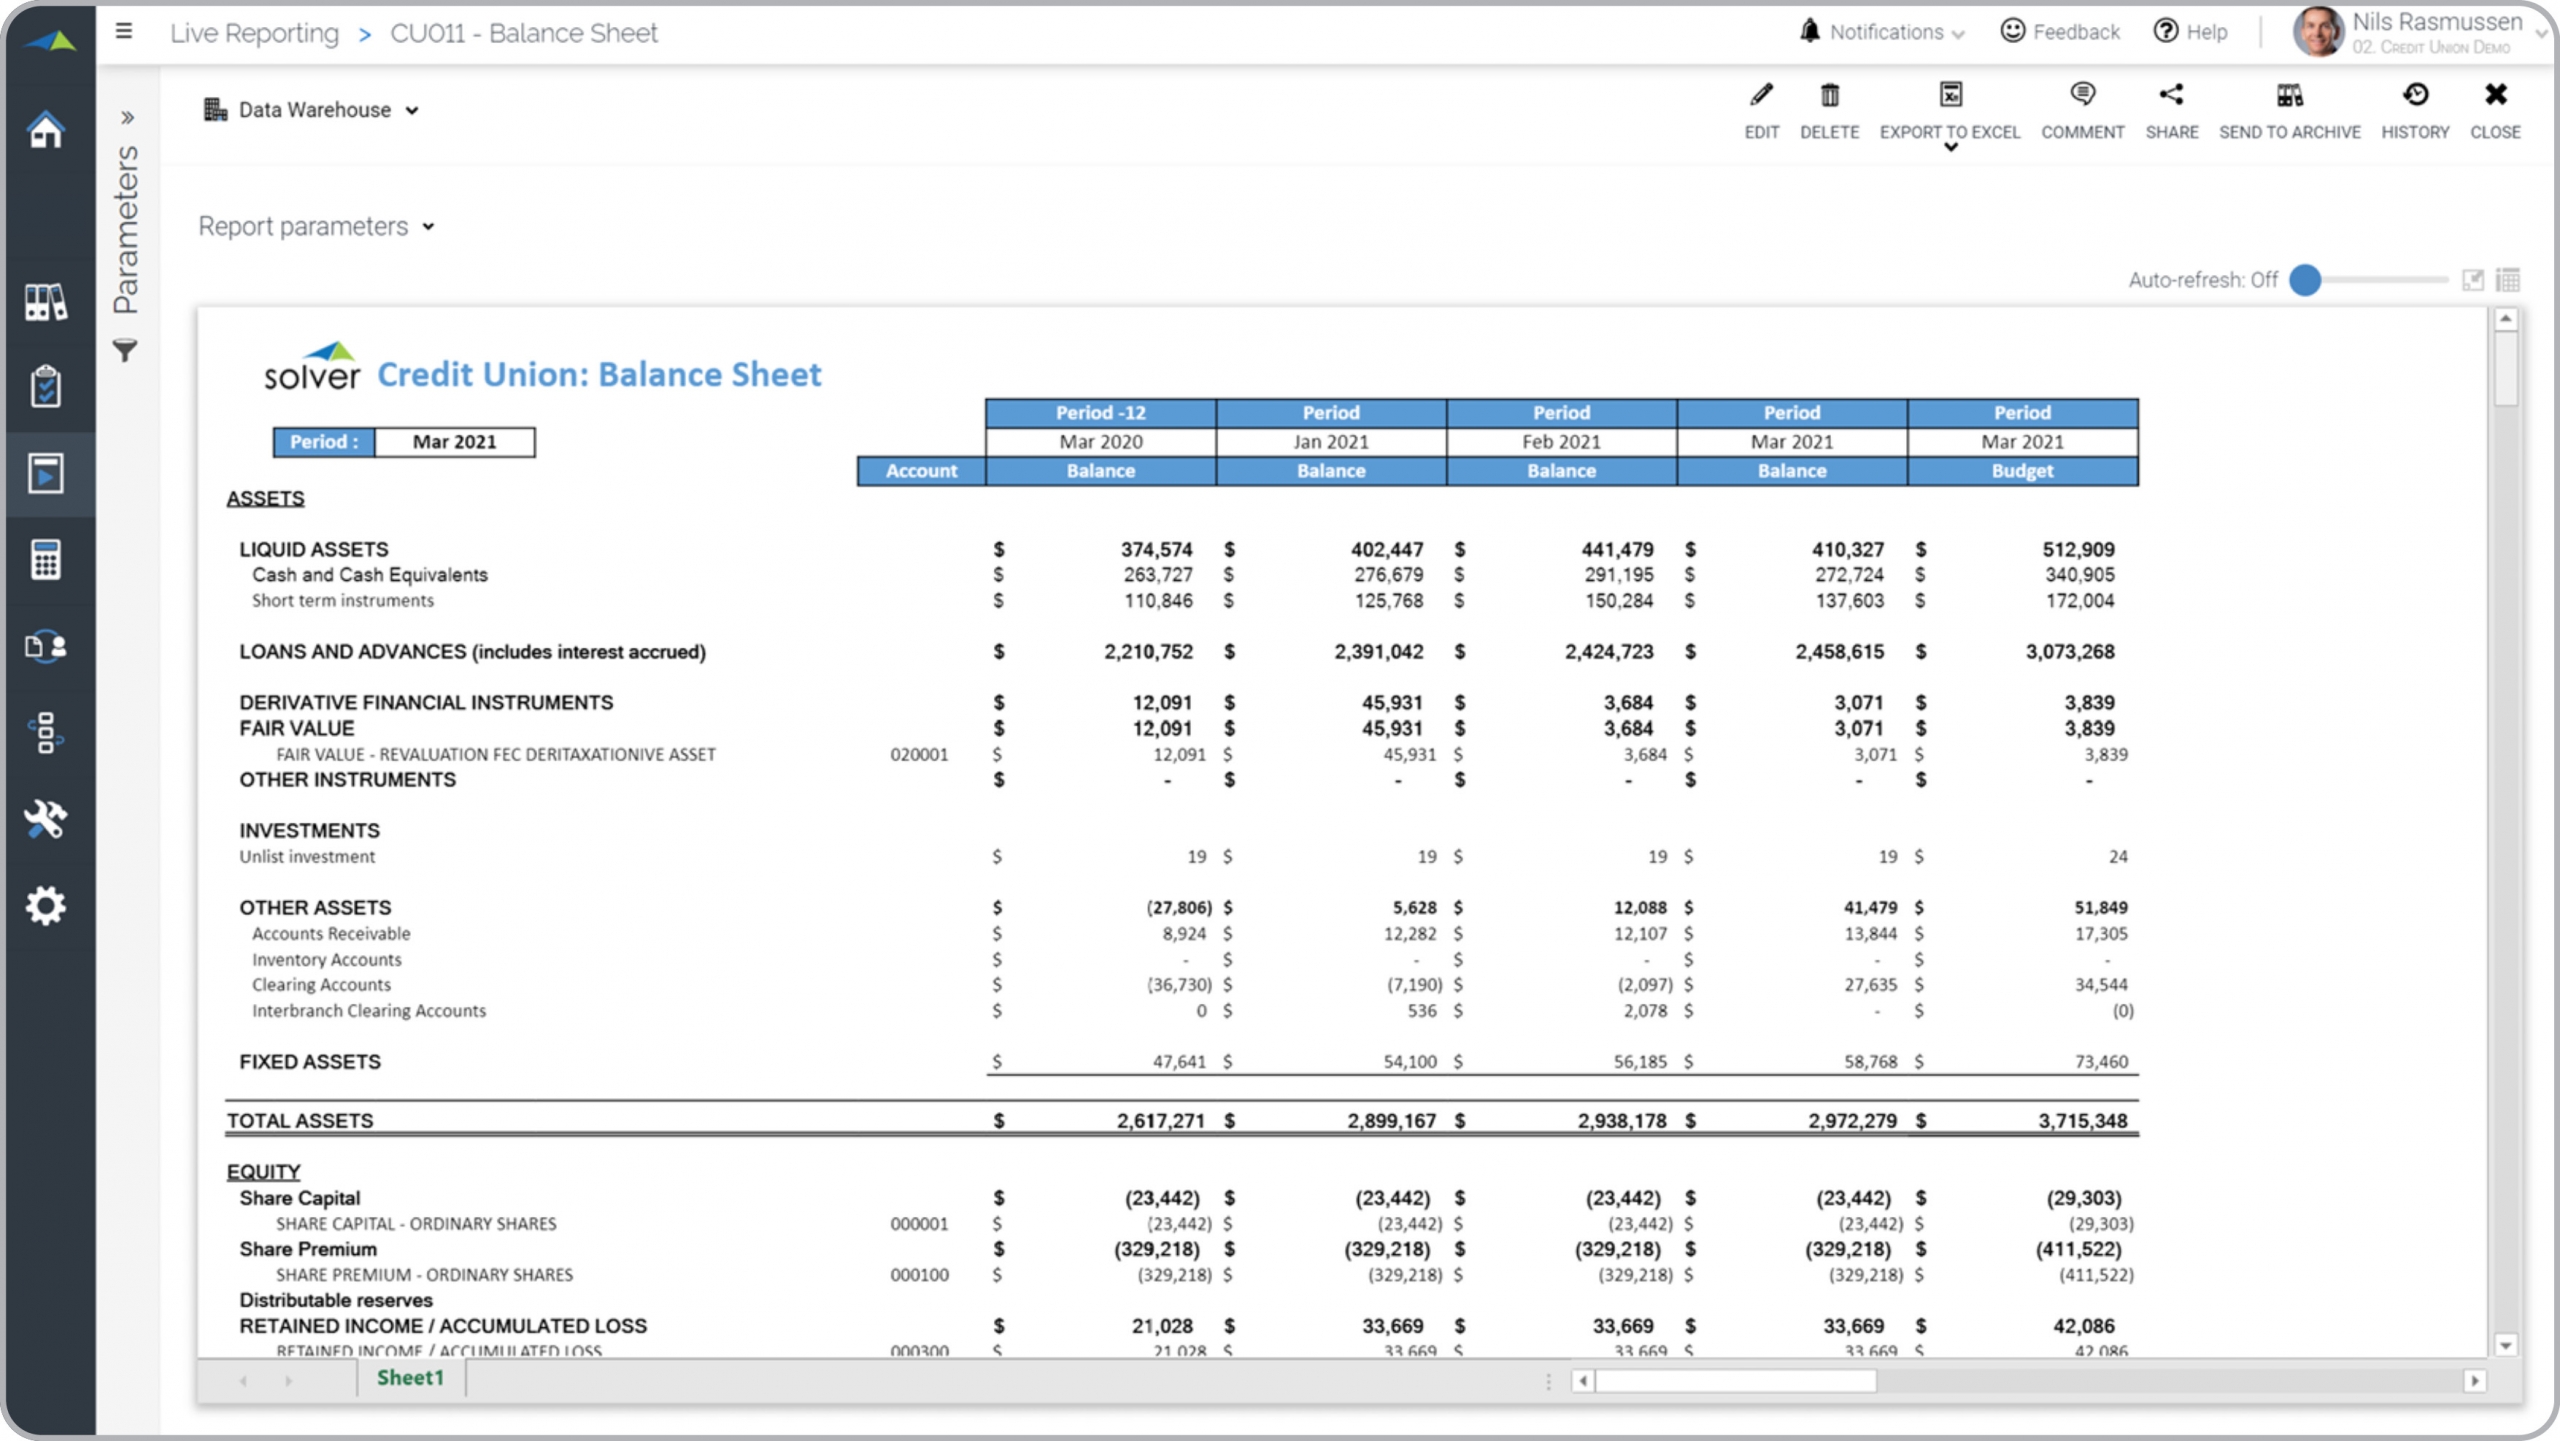
Credit Union – Balance Sheet
Financial statement that dynamically lists months up to the current period.
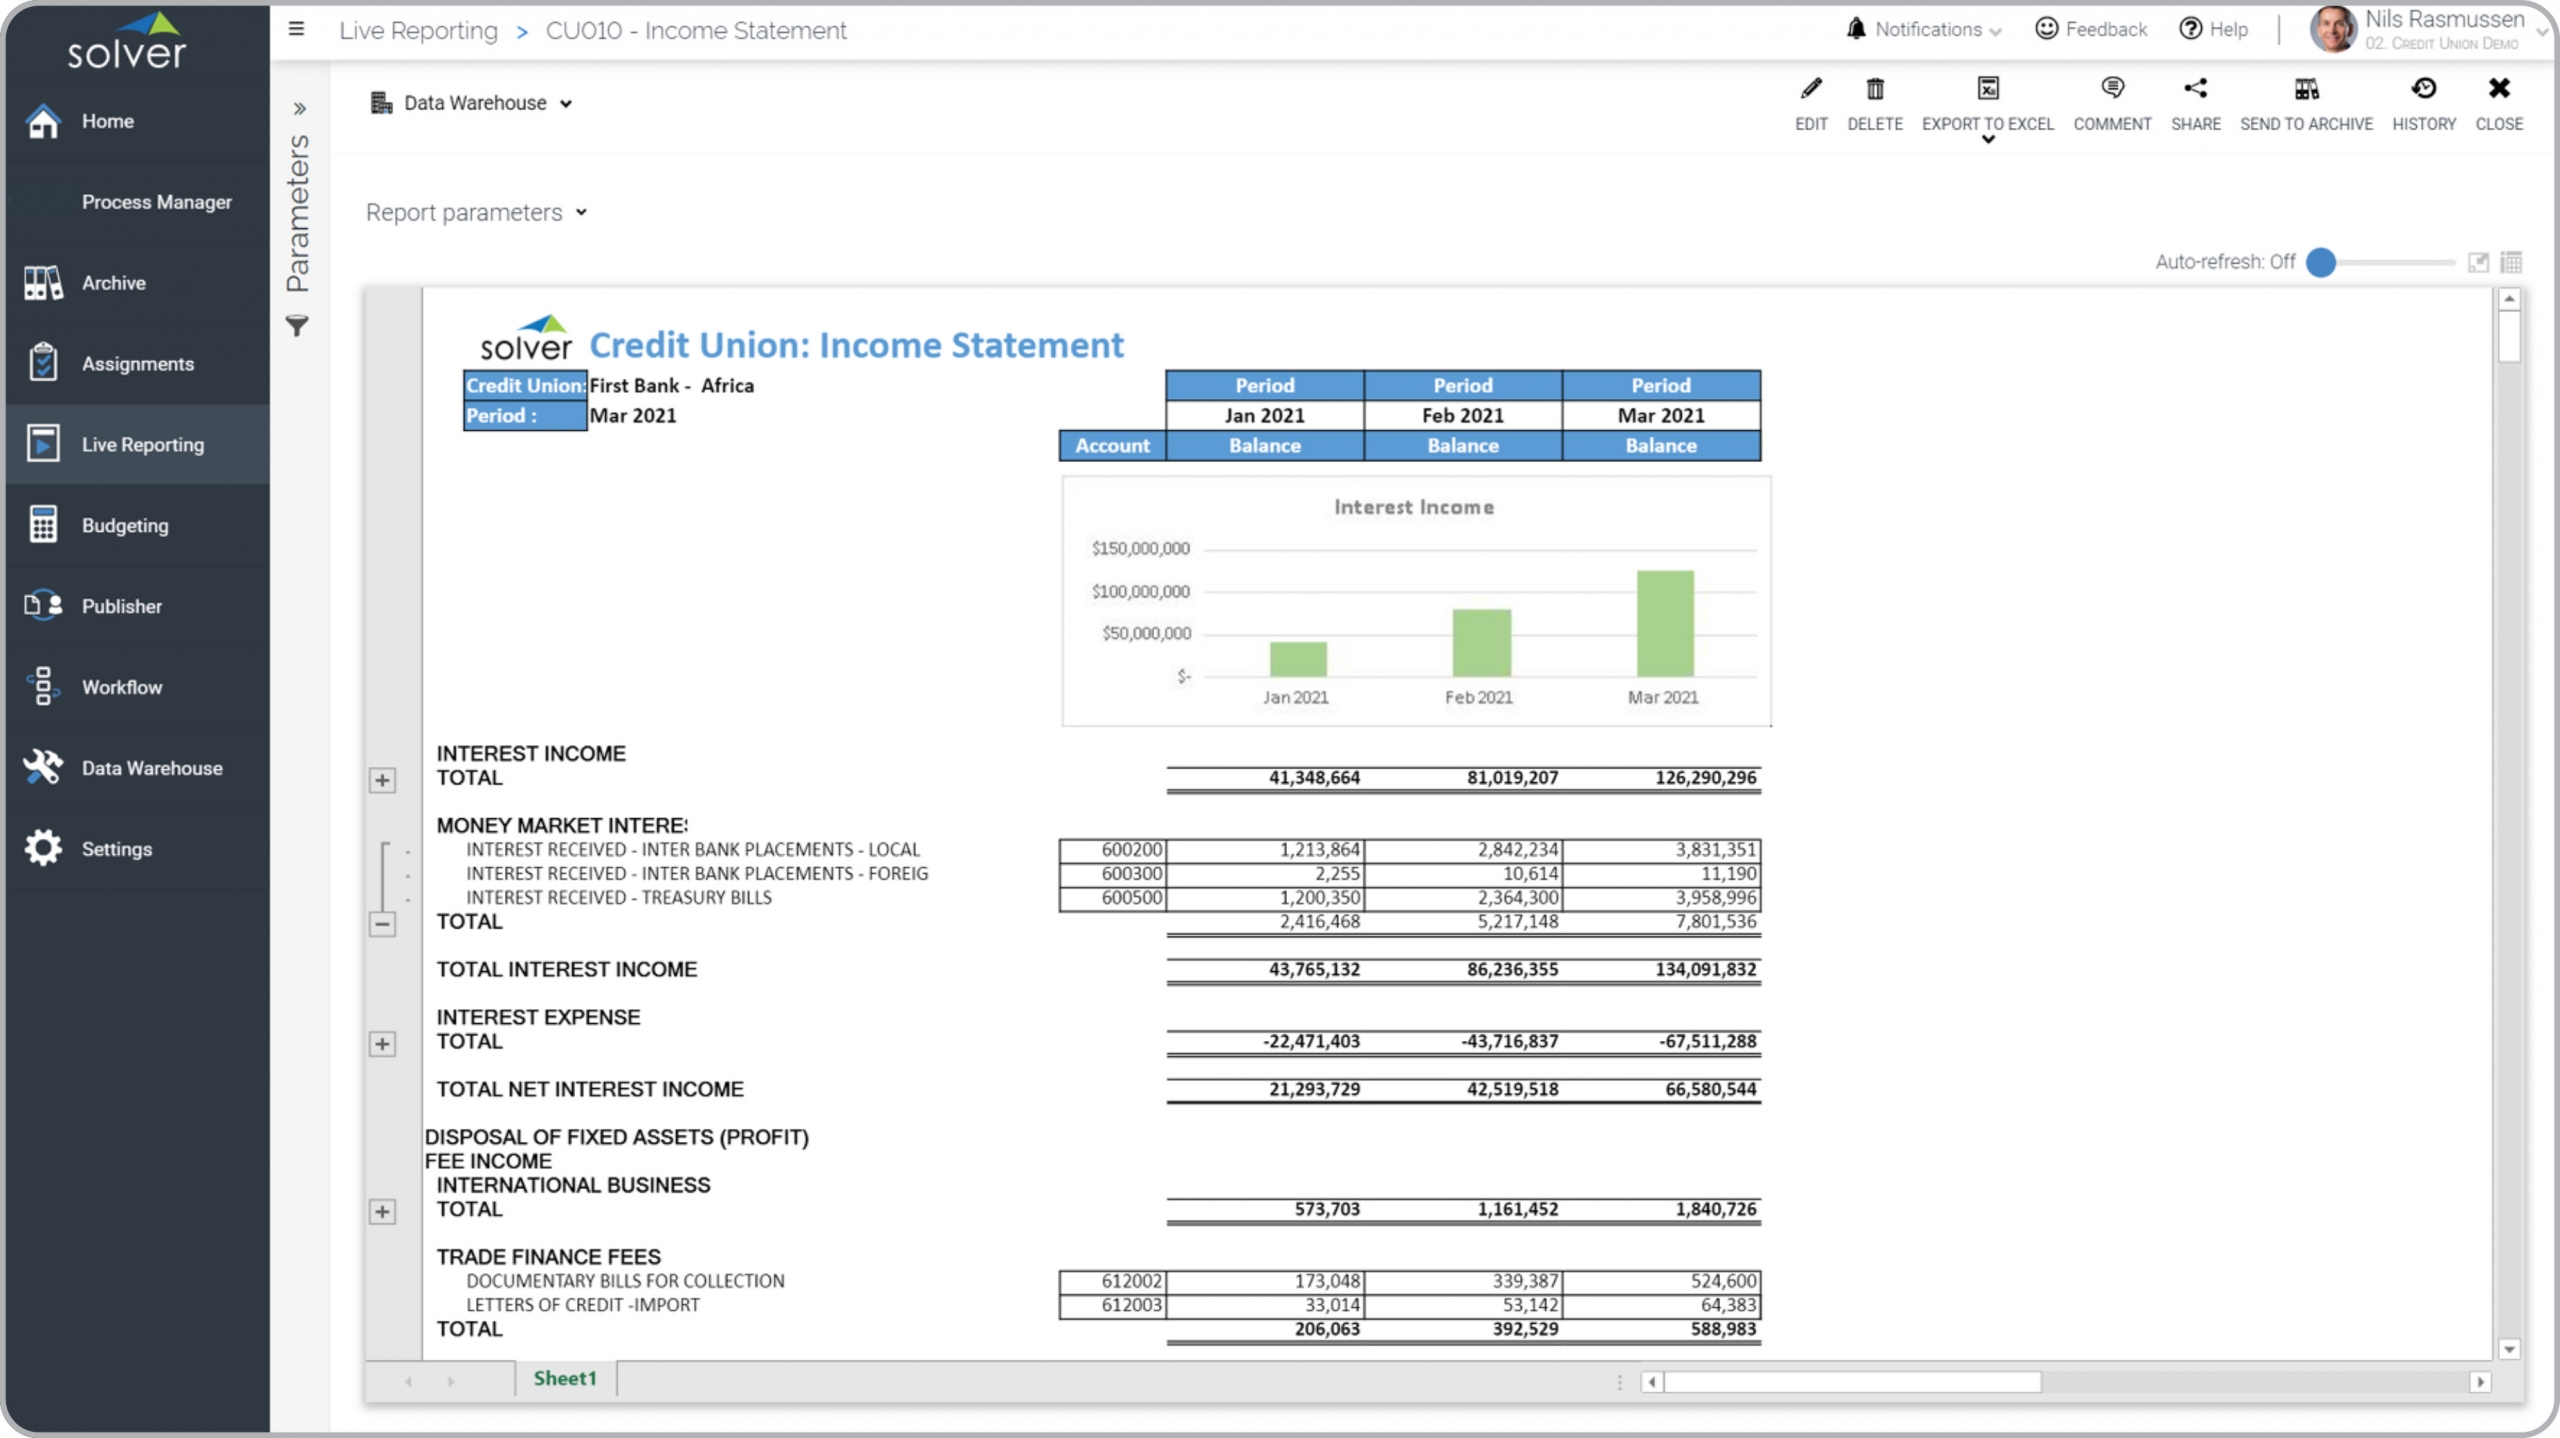
Credit Union – Income Statement
Financial statement that dynamically lists months up to the current period.
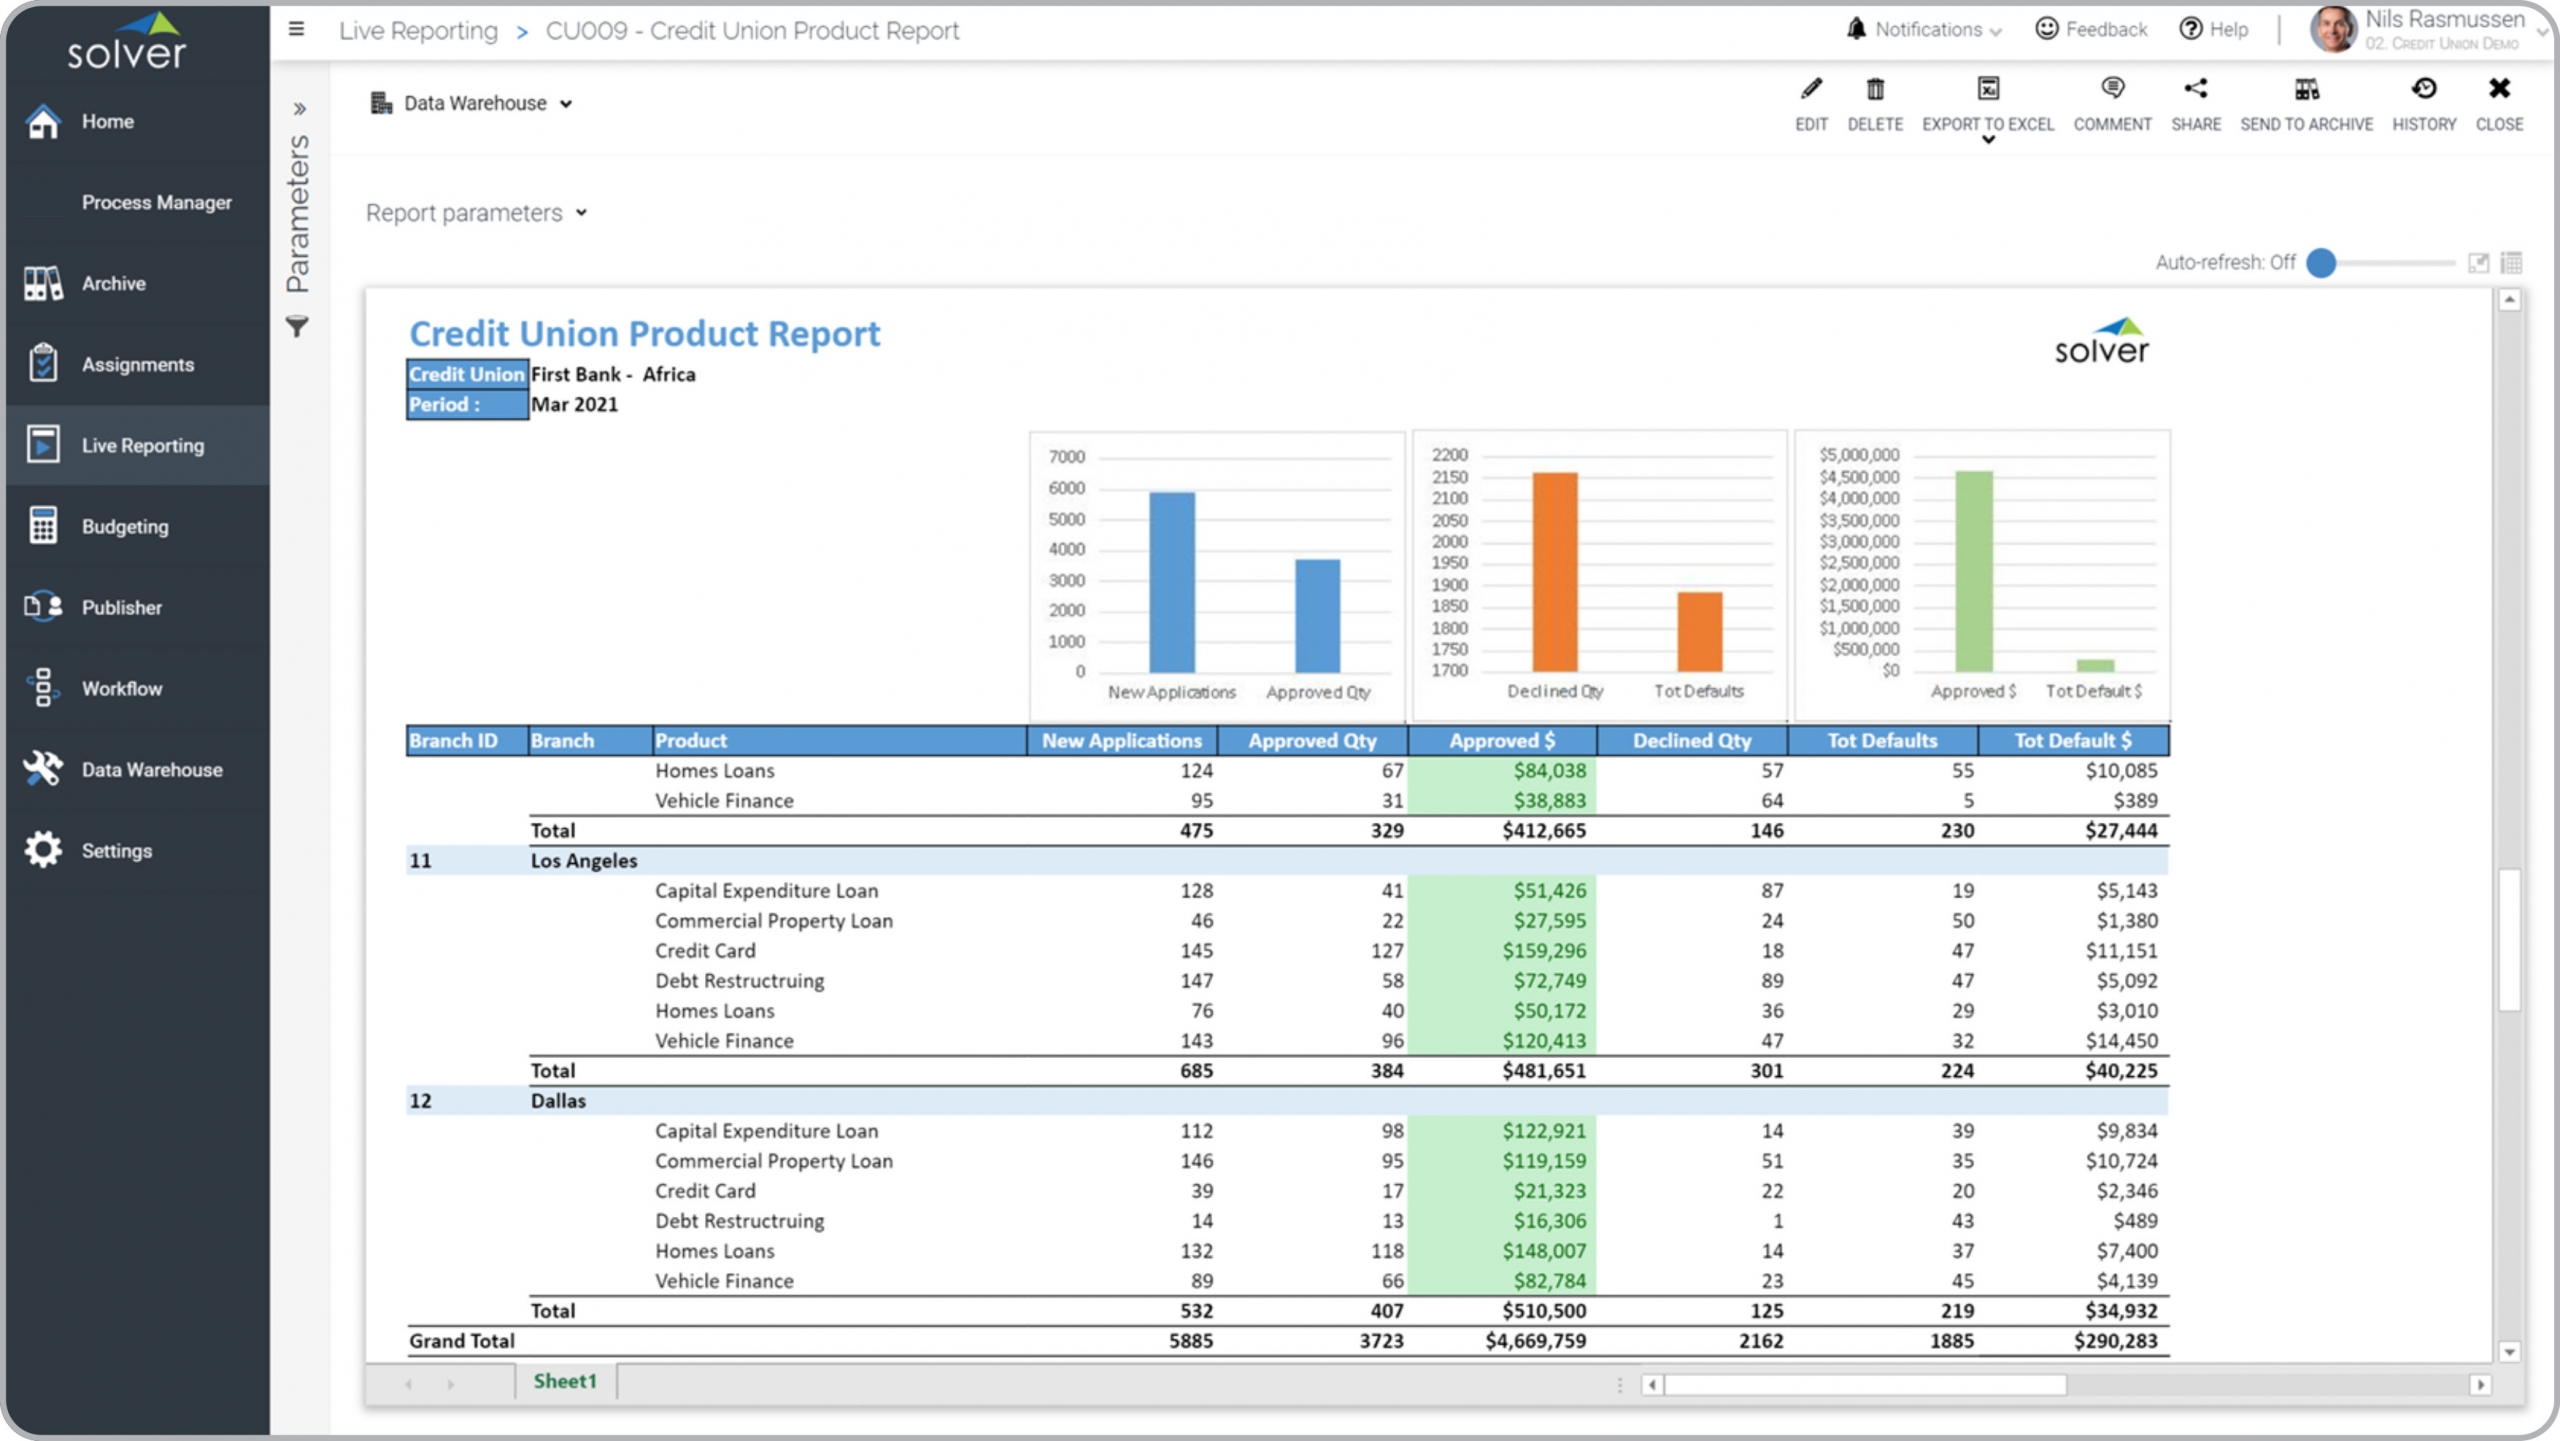
Credit Union – Product Report
Detailed metrics by product and branch, including # of applications, approvals, defaults, etc.
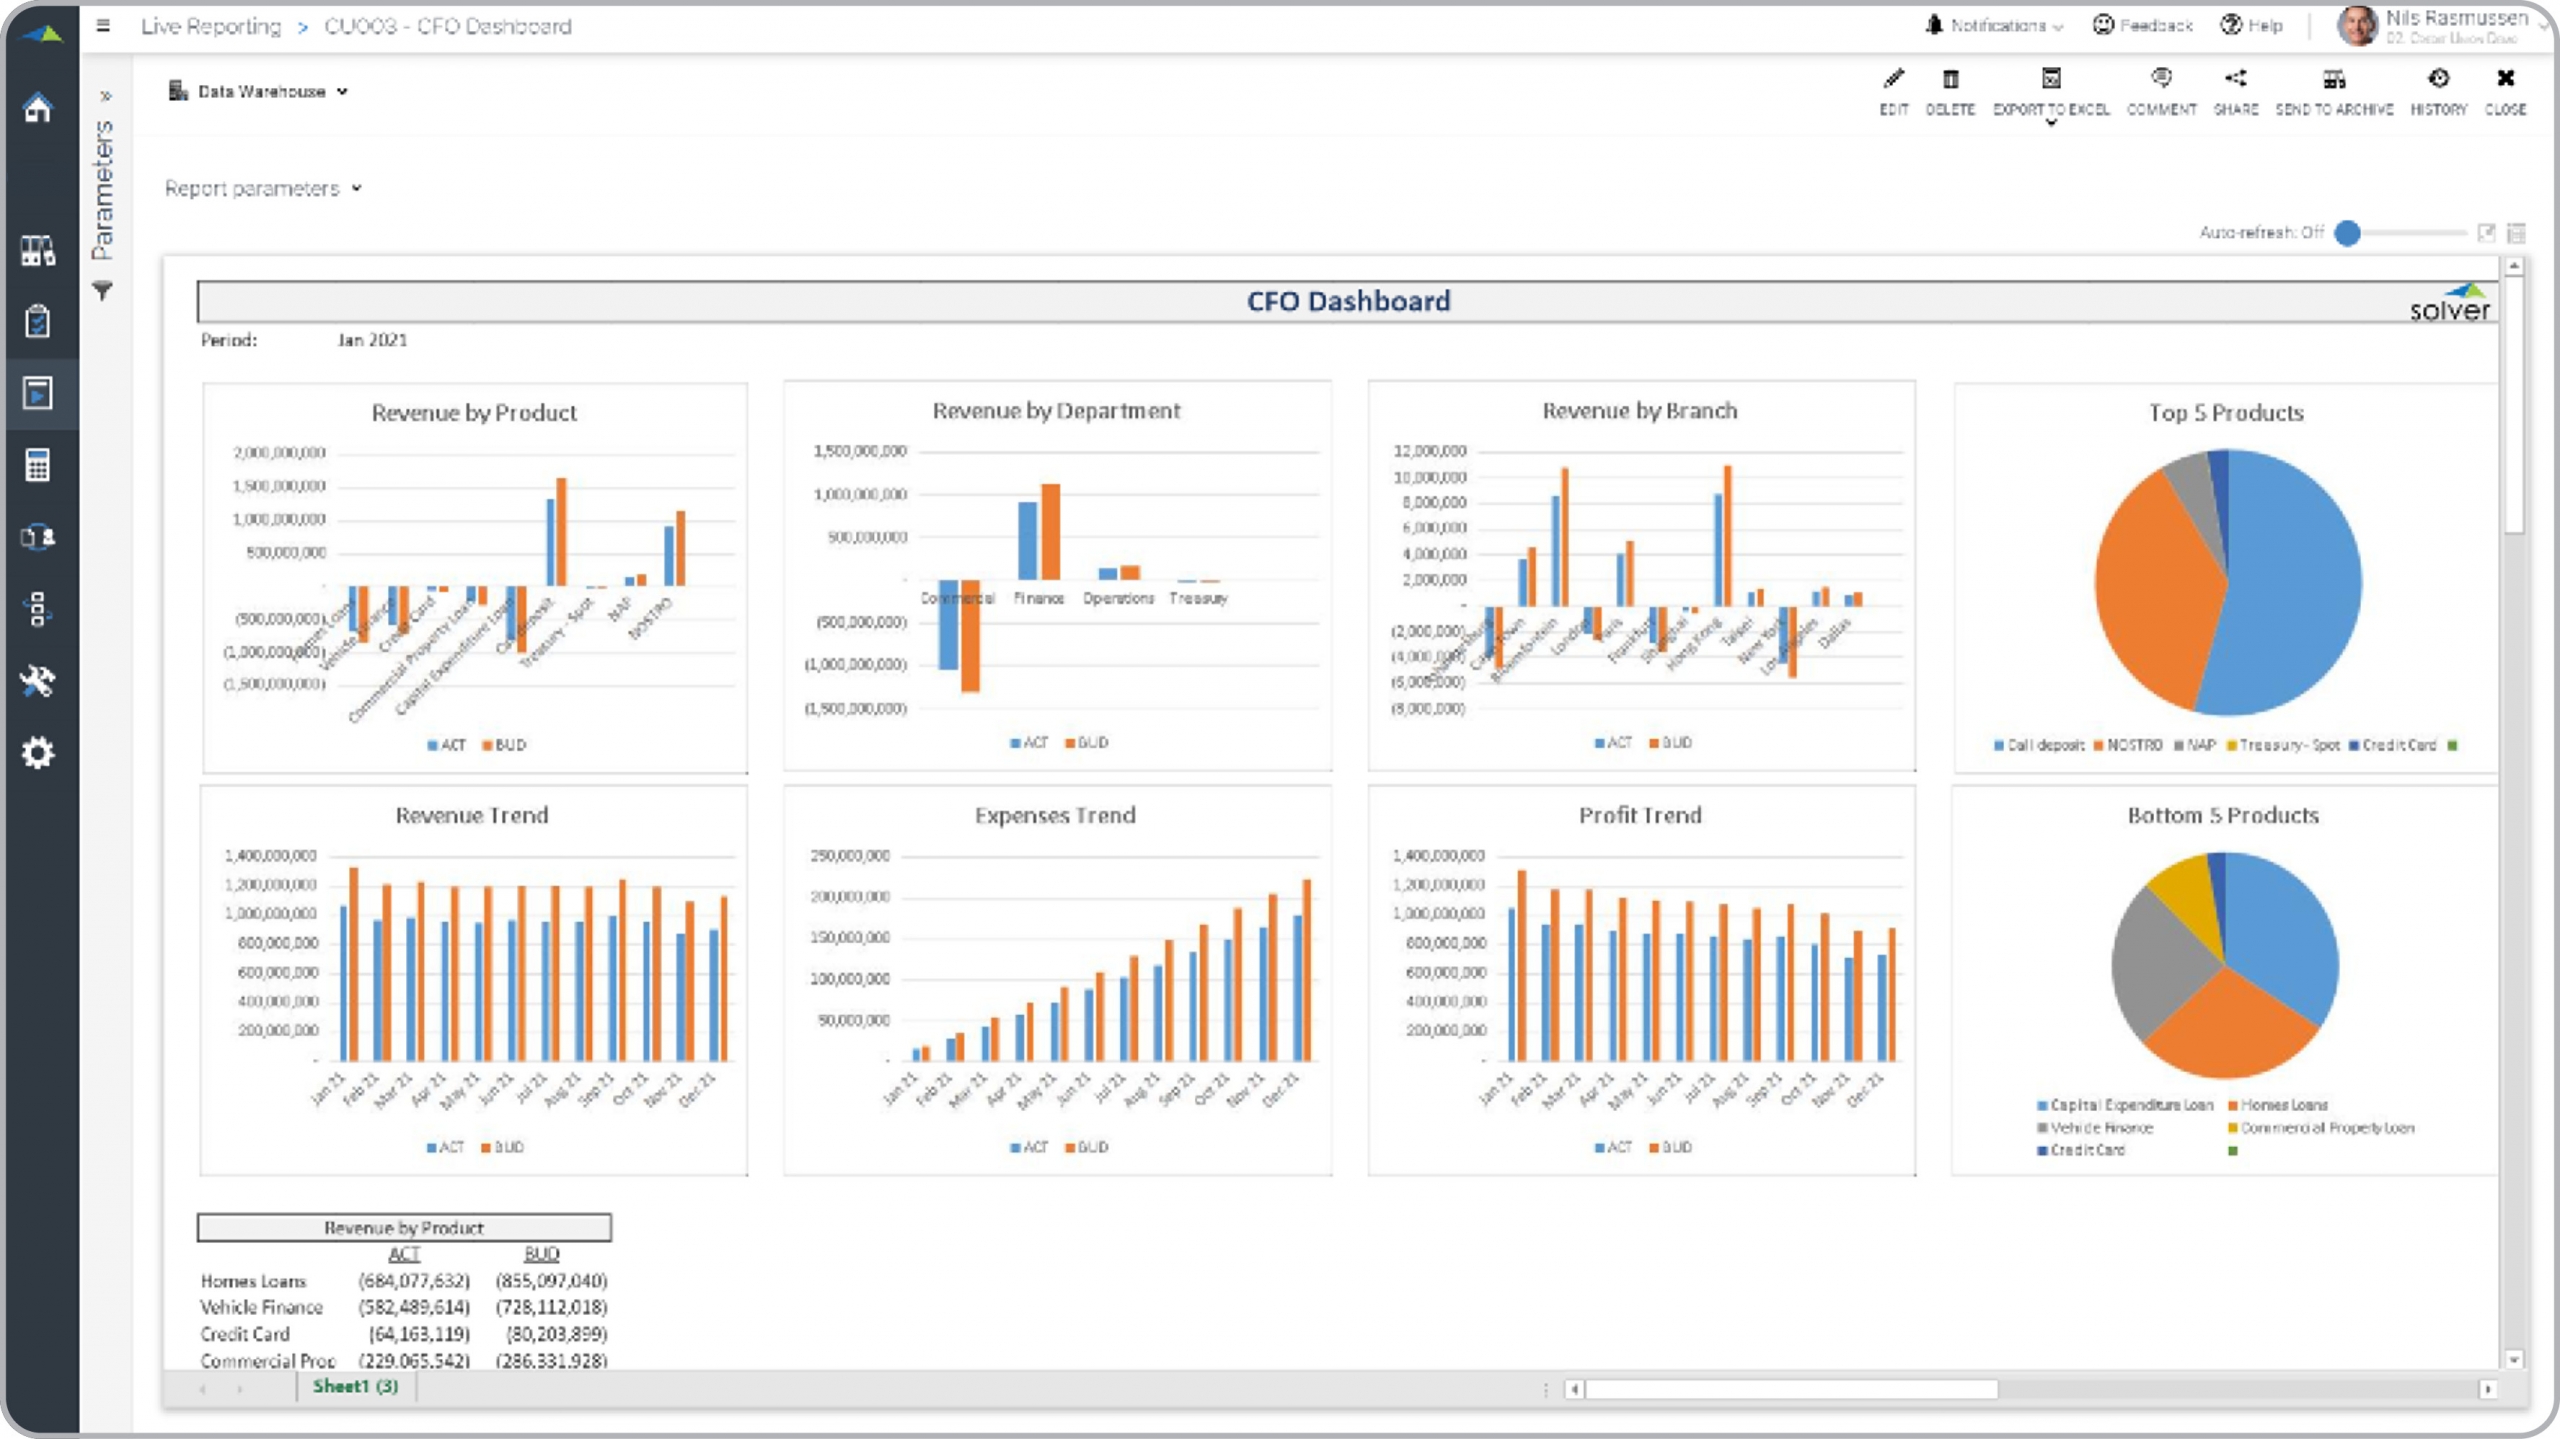
Credit Union – CFO Dashboard
Revenue by product, department and branch, and monthly trends.
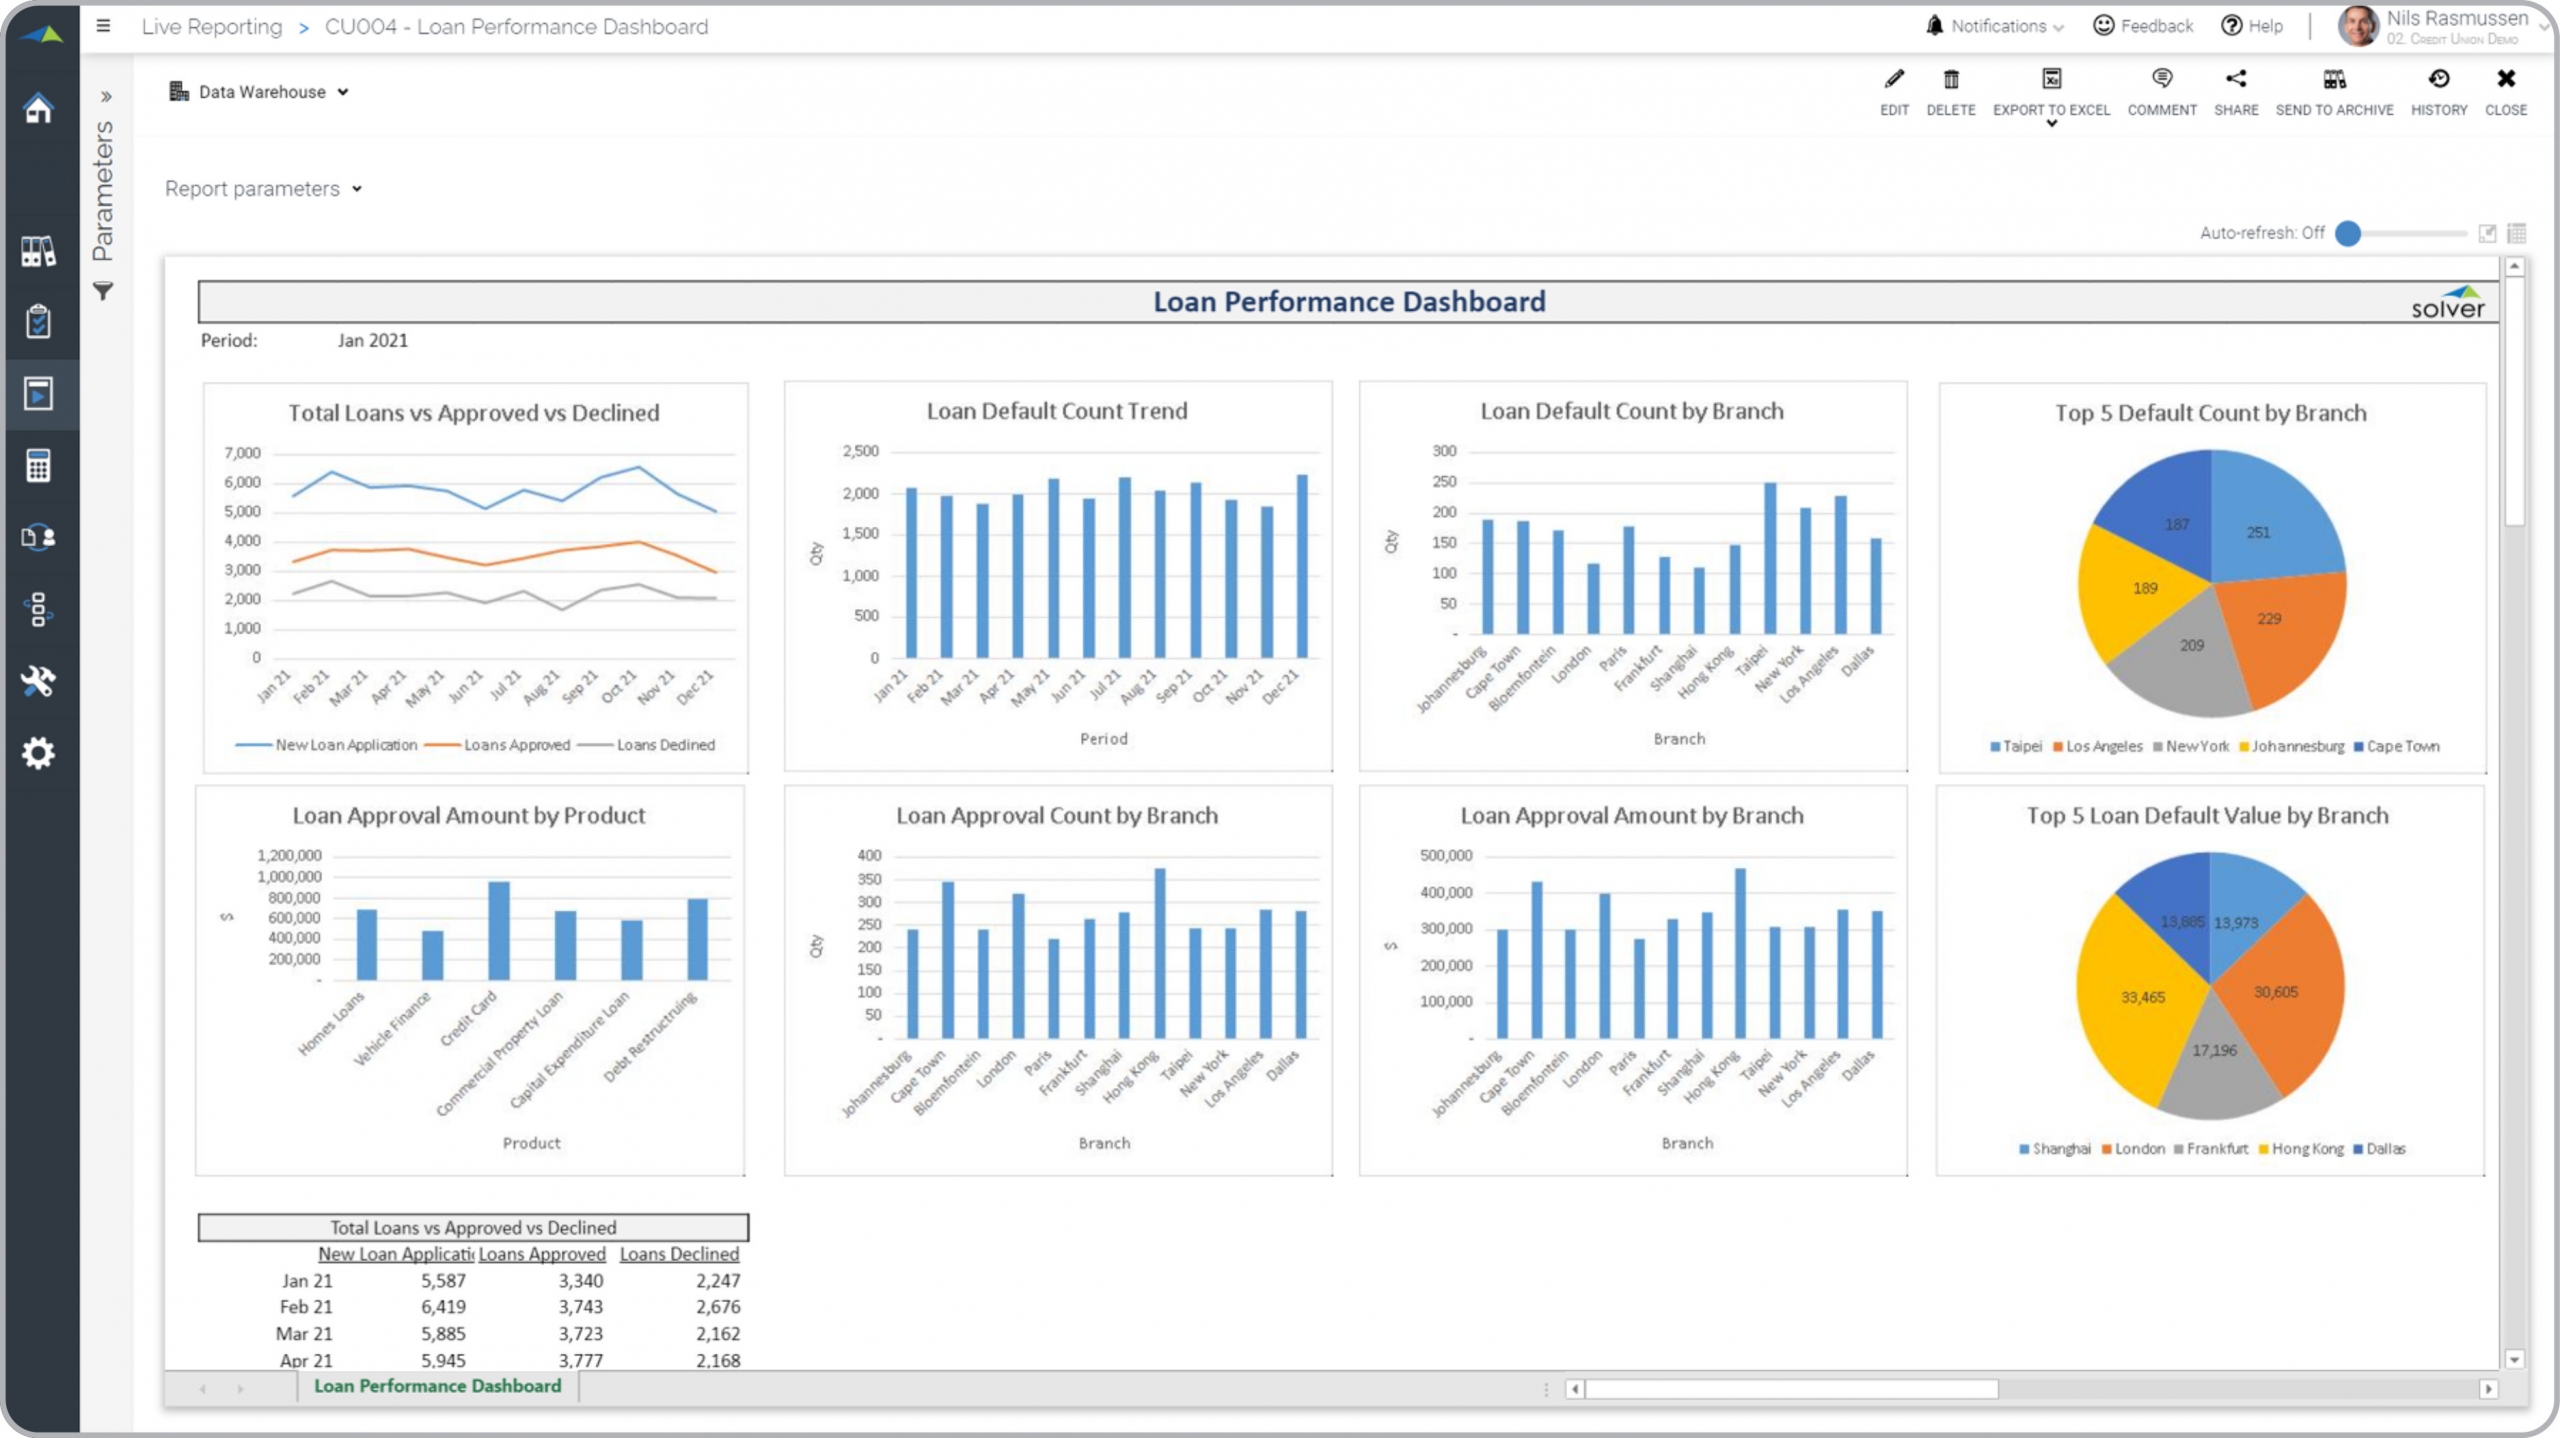
Credit Union – Loan Performance Dashboard
Analysis of loan metrics such as approved/declined and defaults with trends and comparisons.
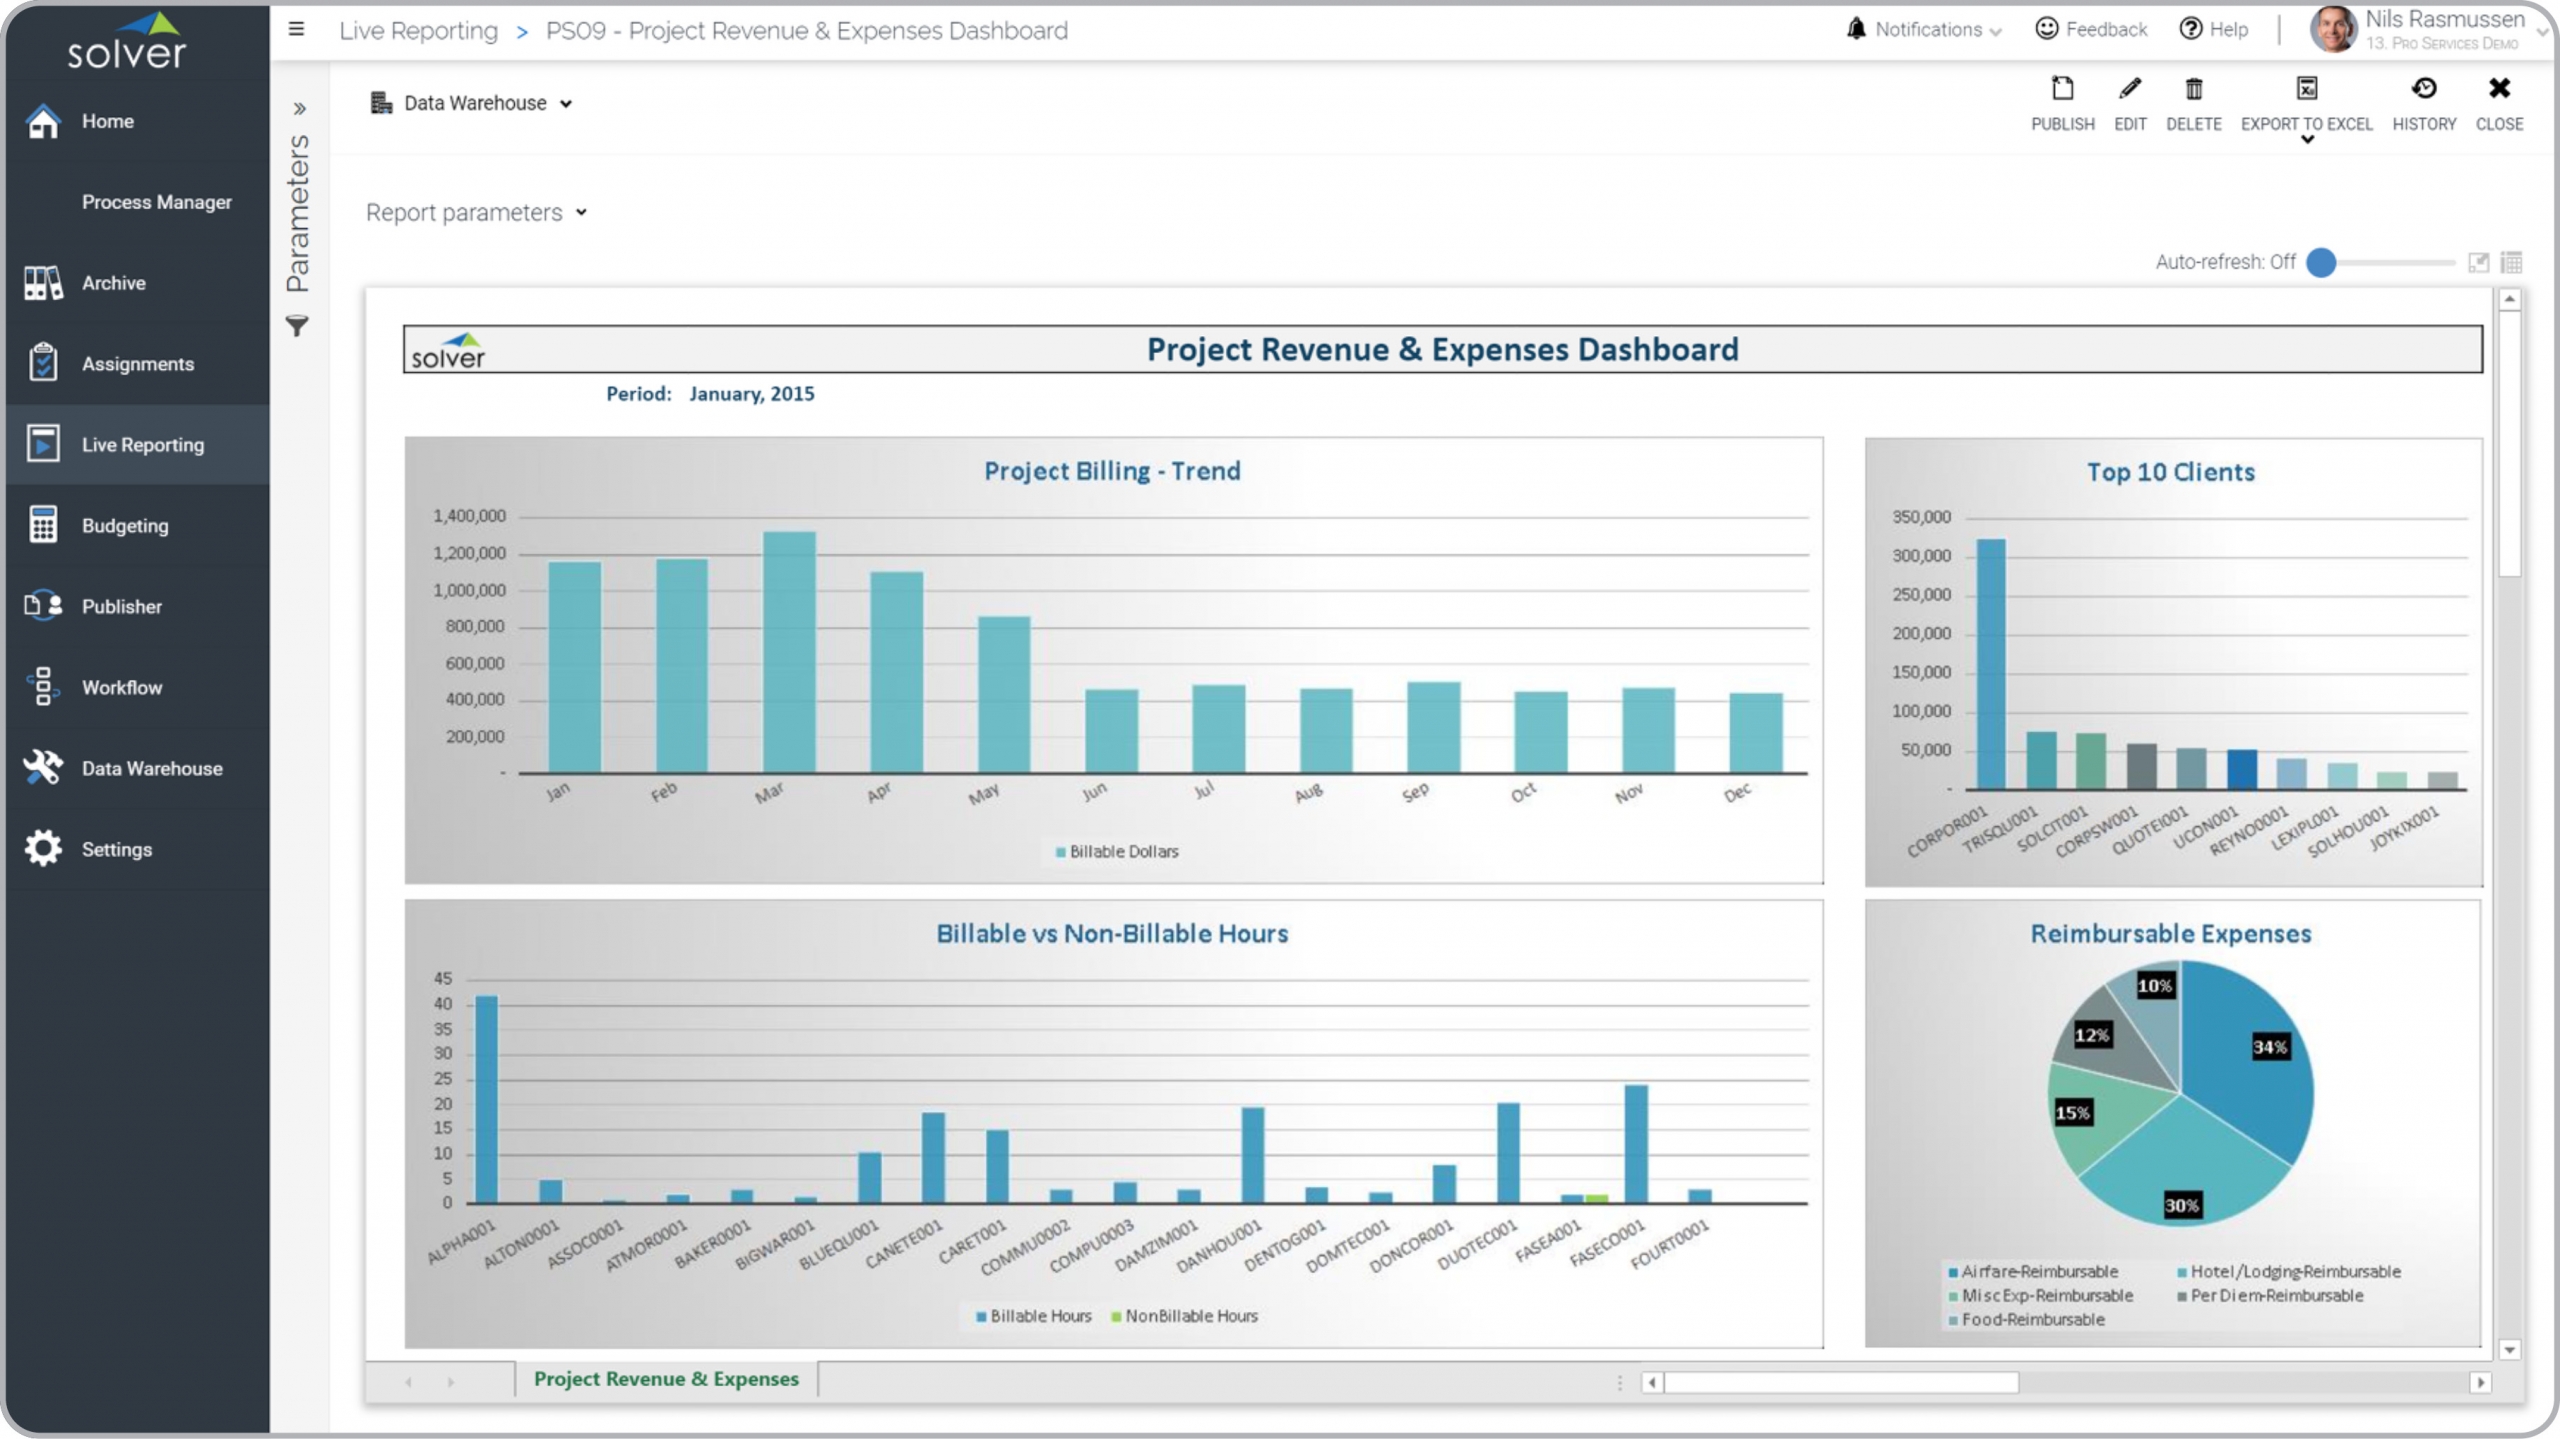
Professional Services – Project Revenue and Expenses
Analysis of revenues and expenses with KPIs like project billing, non-billable vs billable, and top clients.
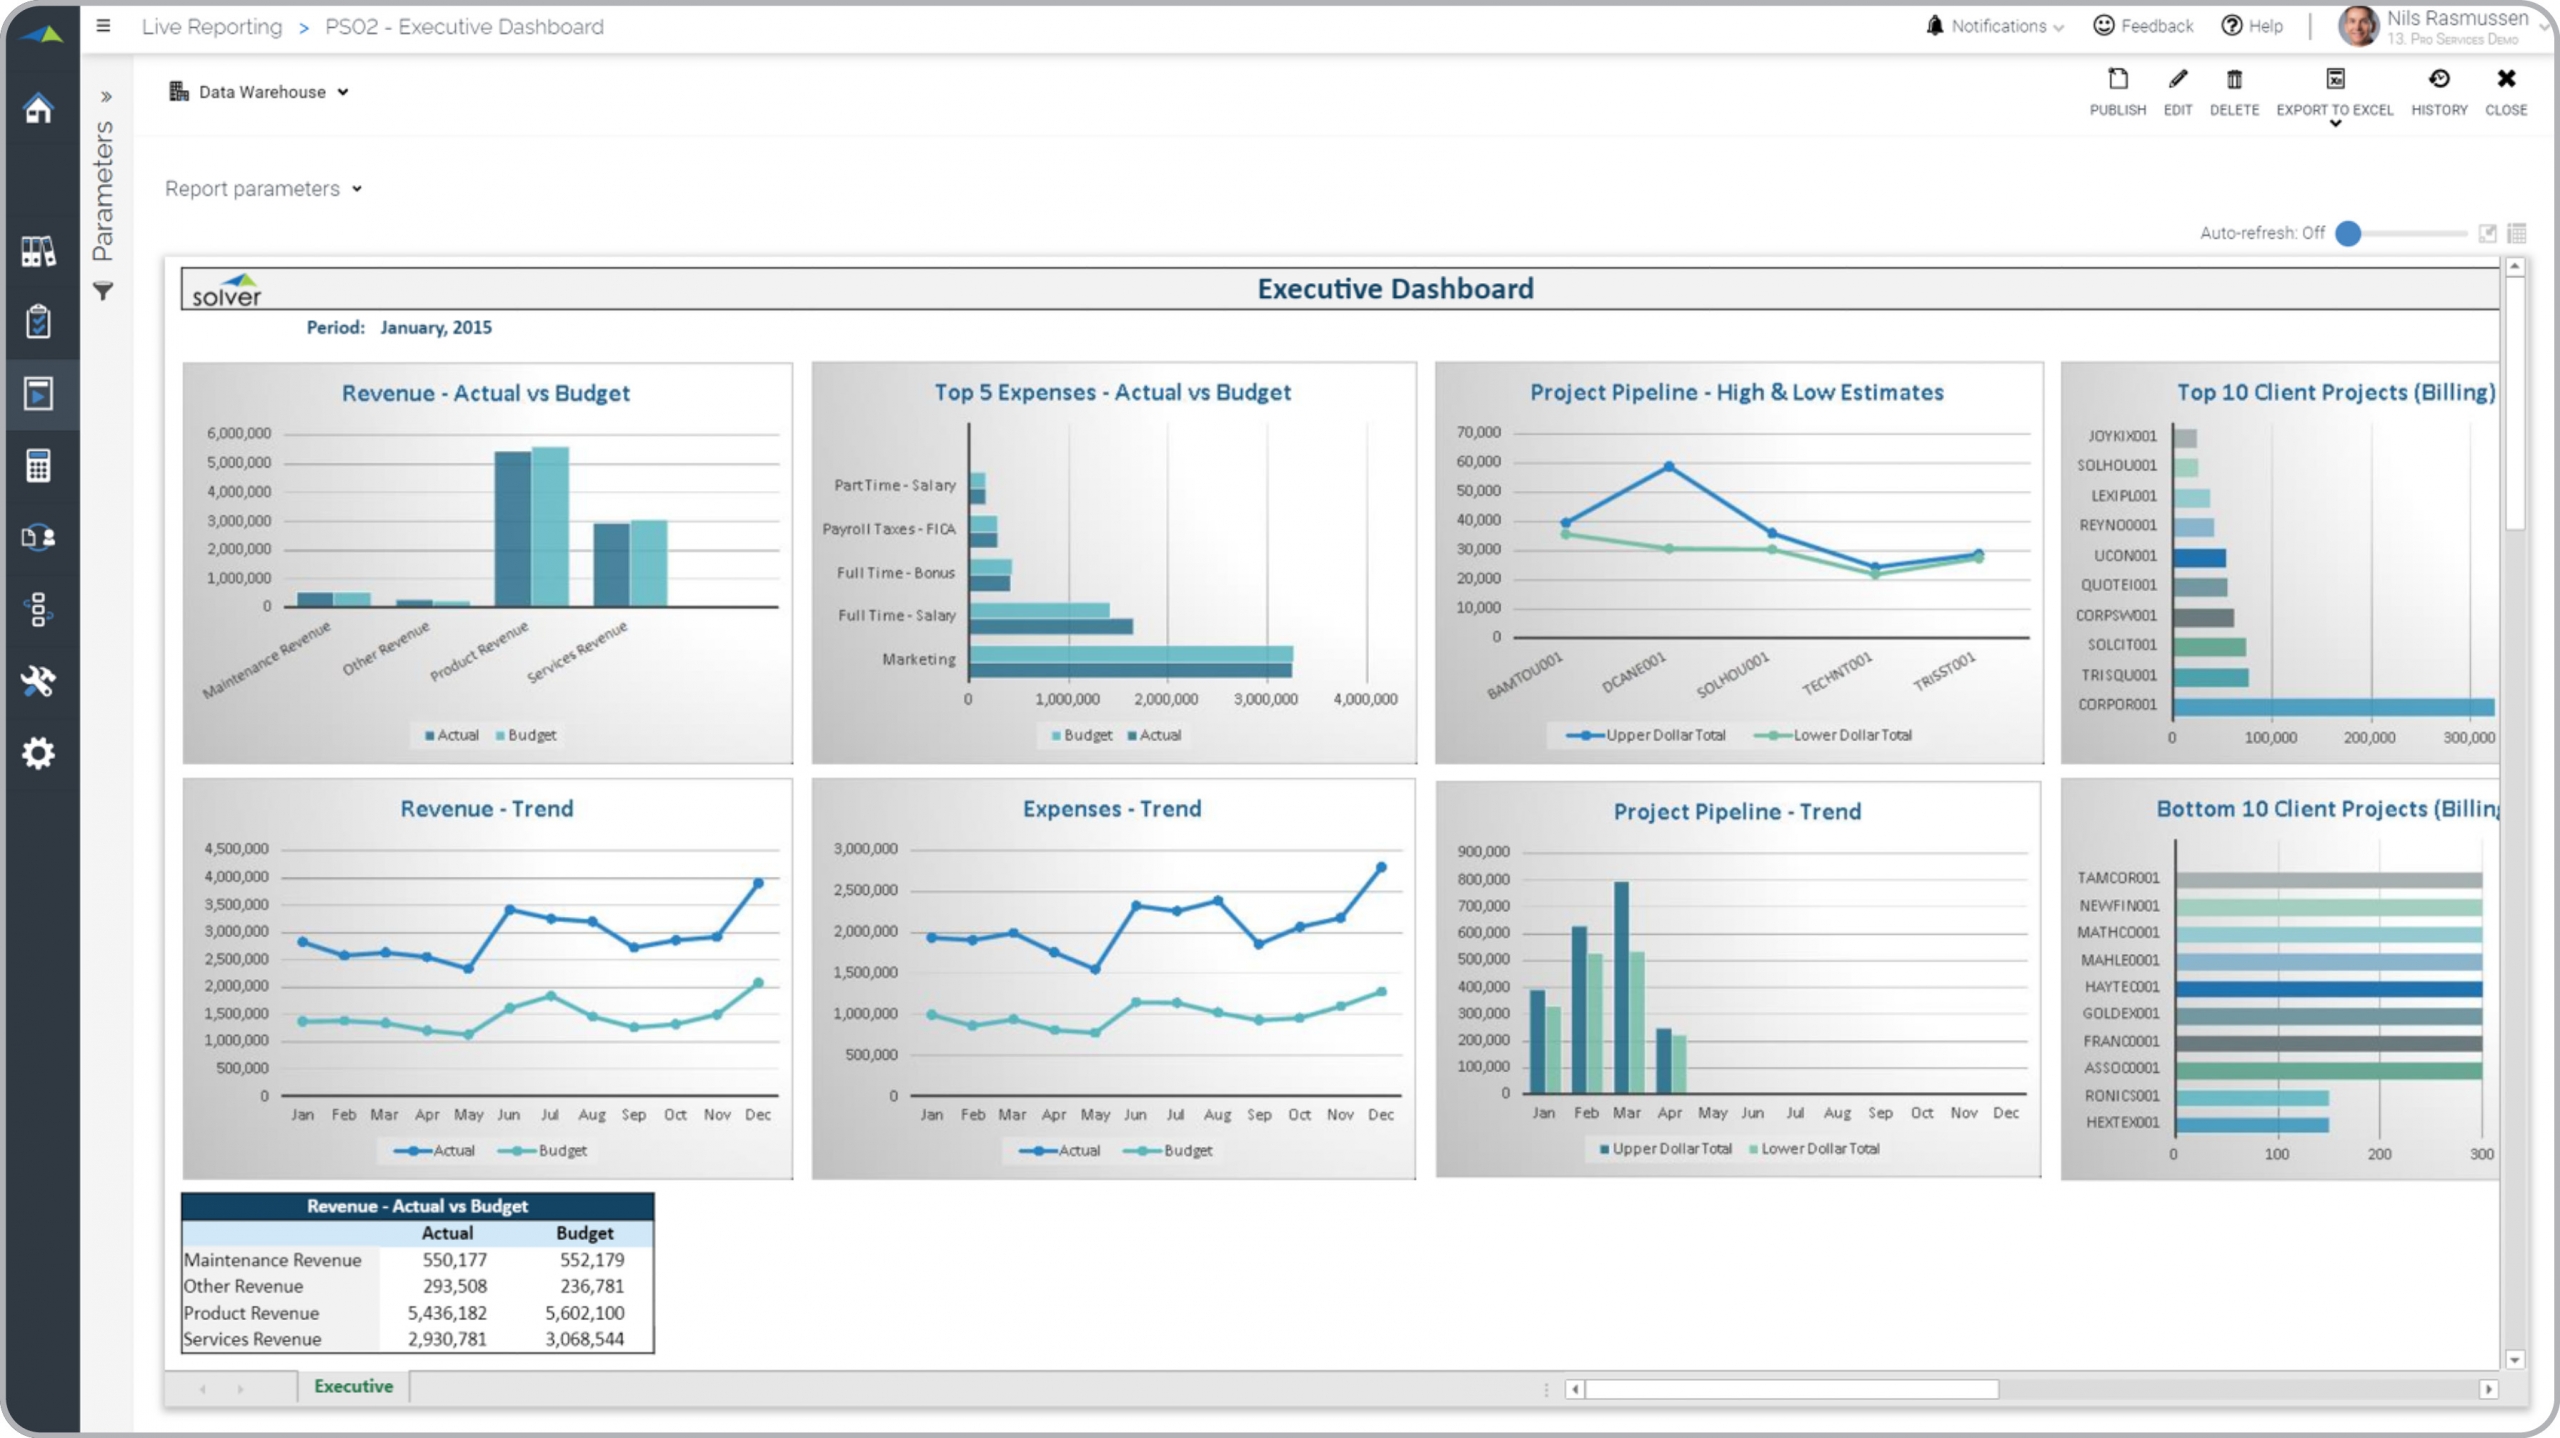
Professional Services – Executive Dashboard
Overview of revenues, expenses and project metrics with variances and trends.
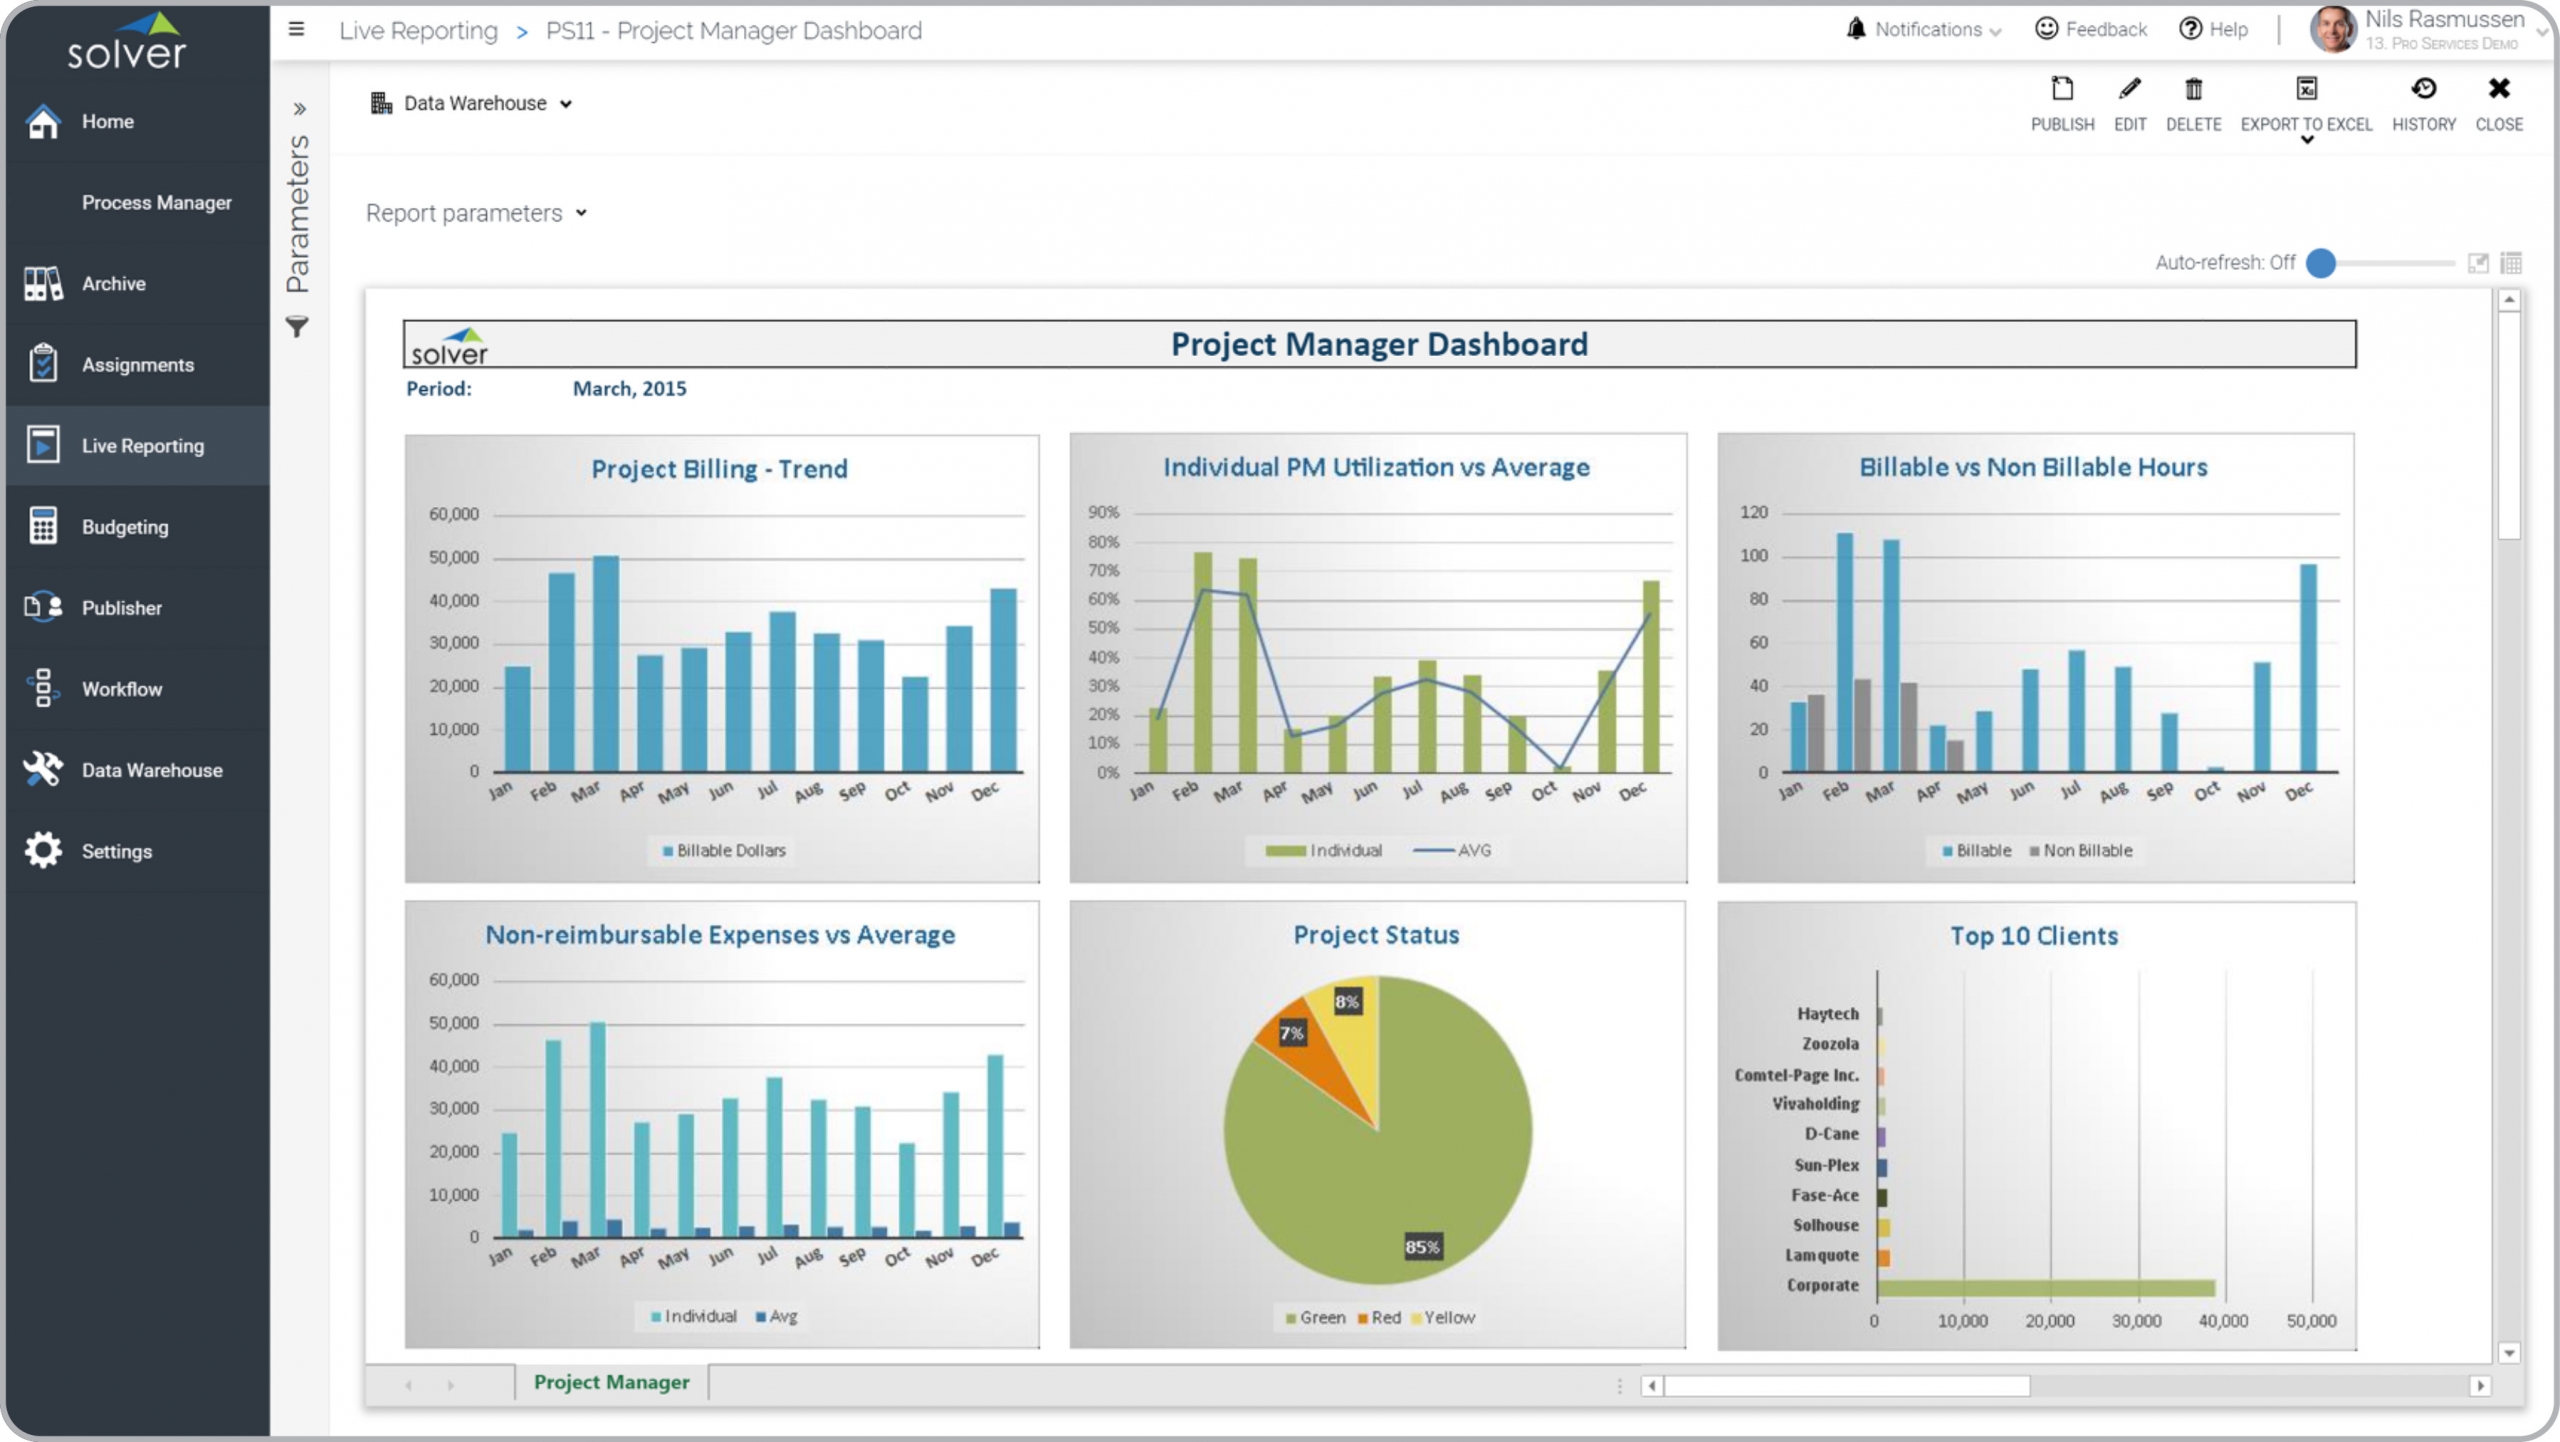
Professional Services – Project Manager Dashboard
Key metrics for a PM, such as billing trend, utilization, project statuses and top clients.
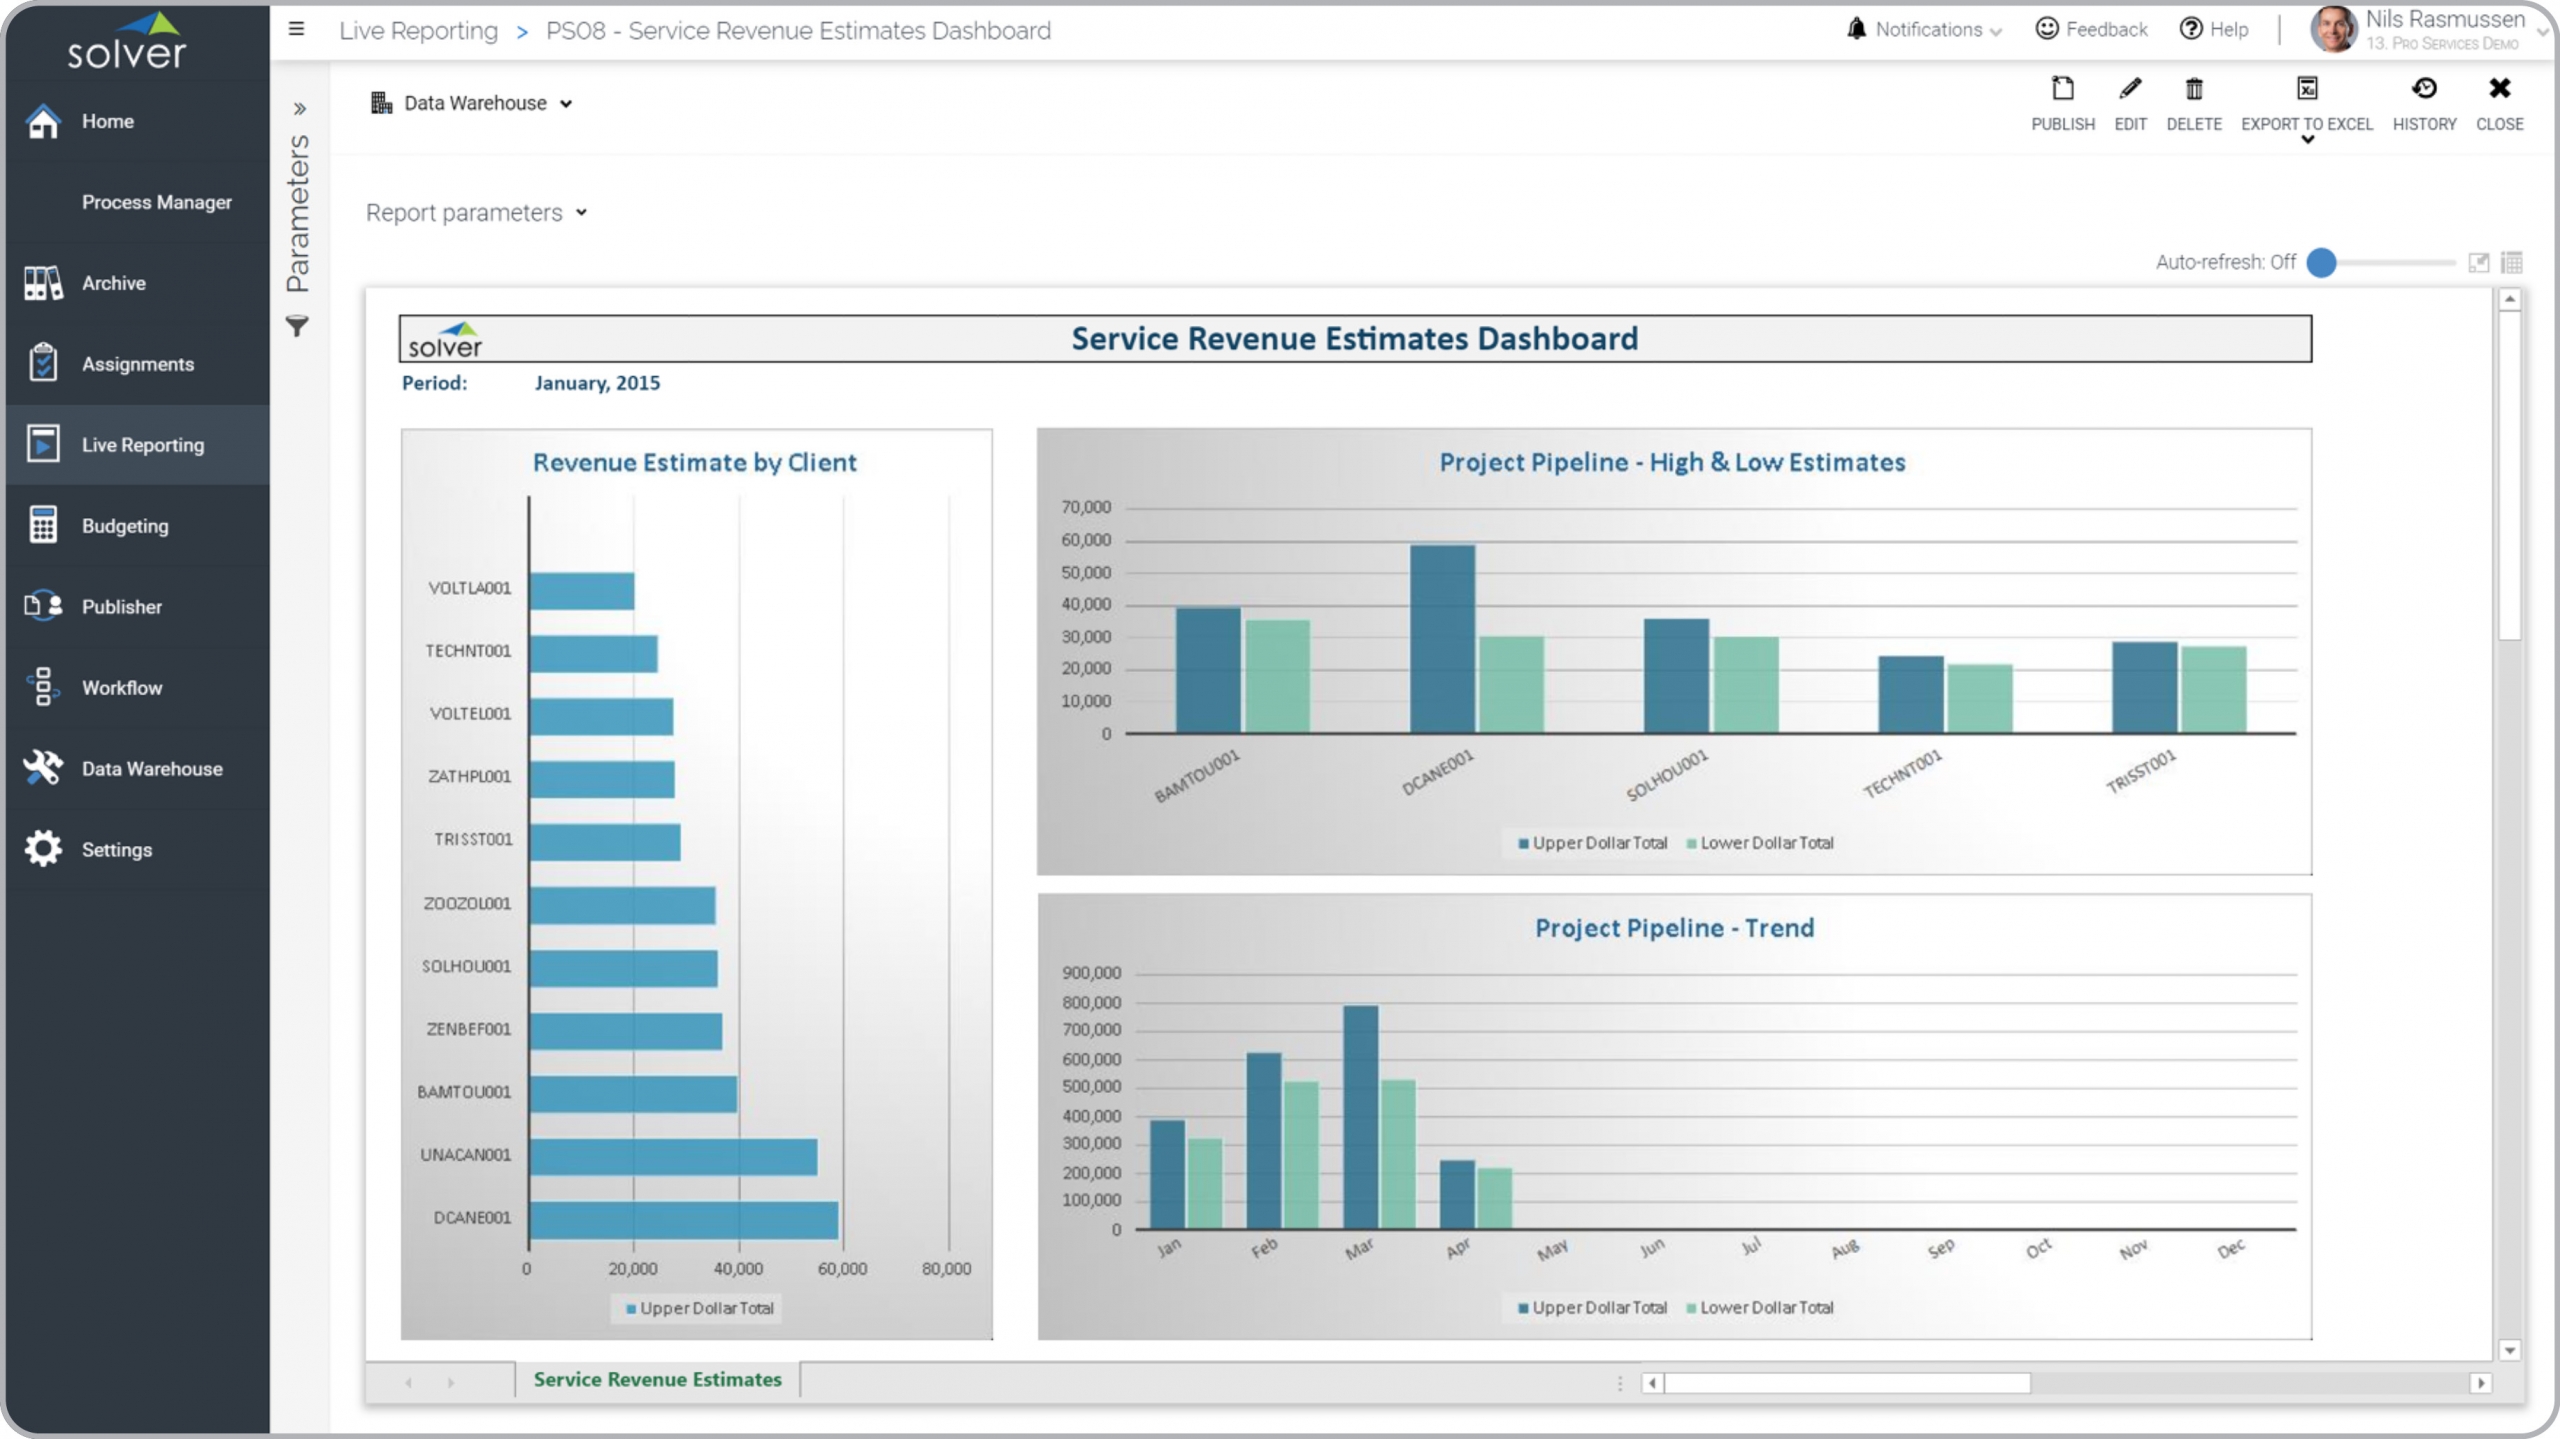
Professional Services – Revenue Estimate Dashboard
Analysis of service estimates for revenue and pipeline metrics.
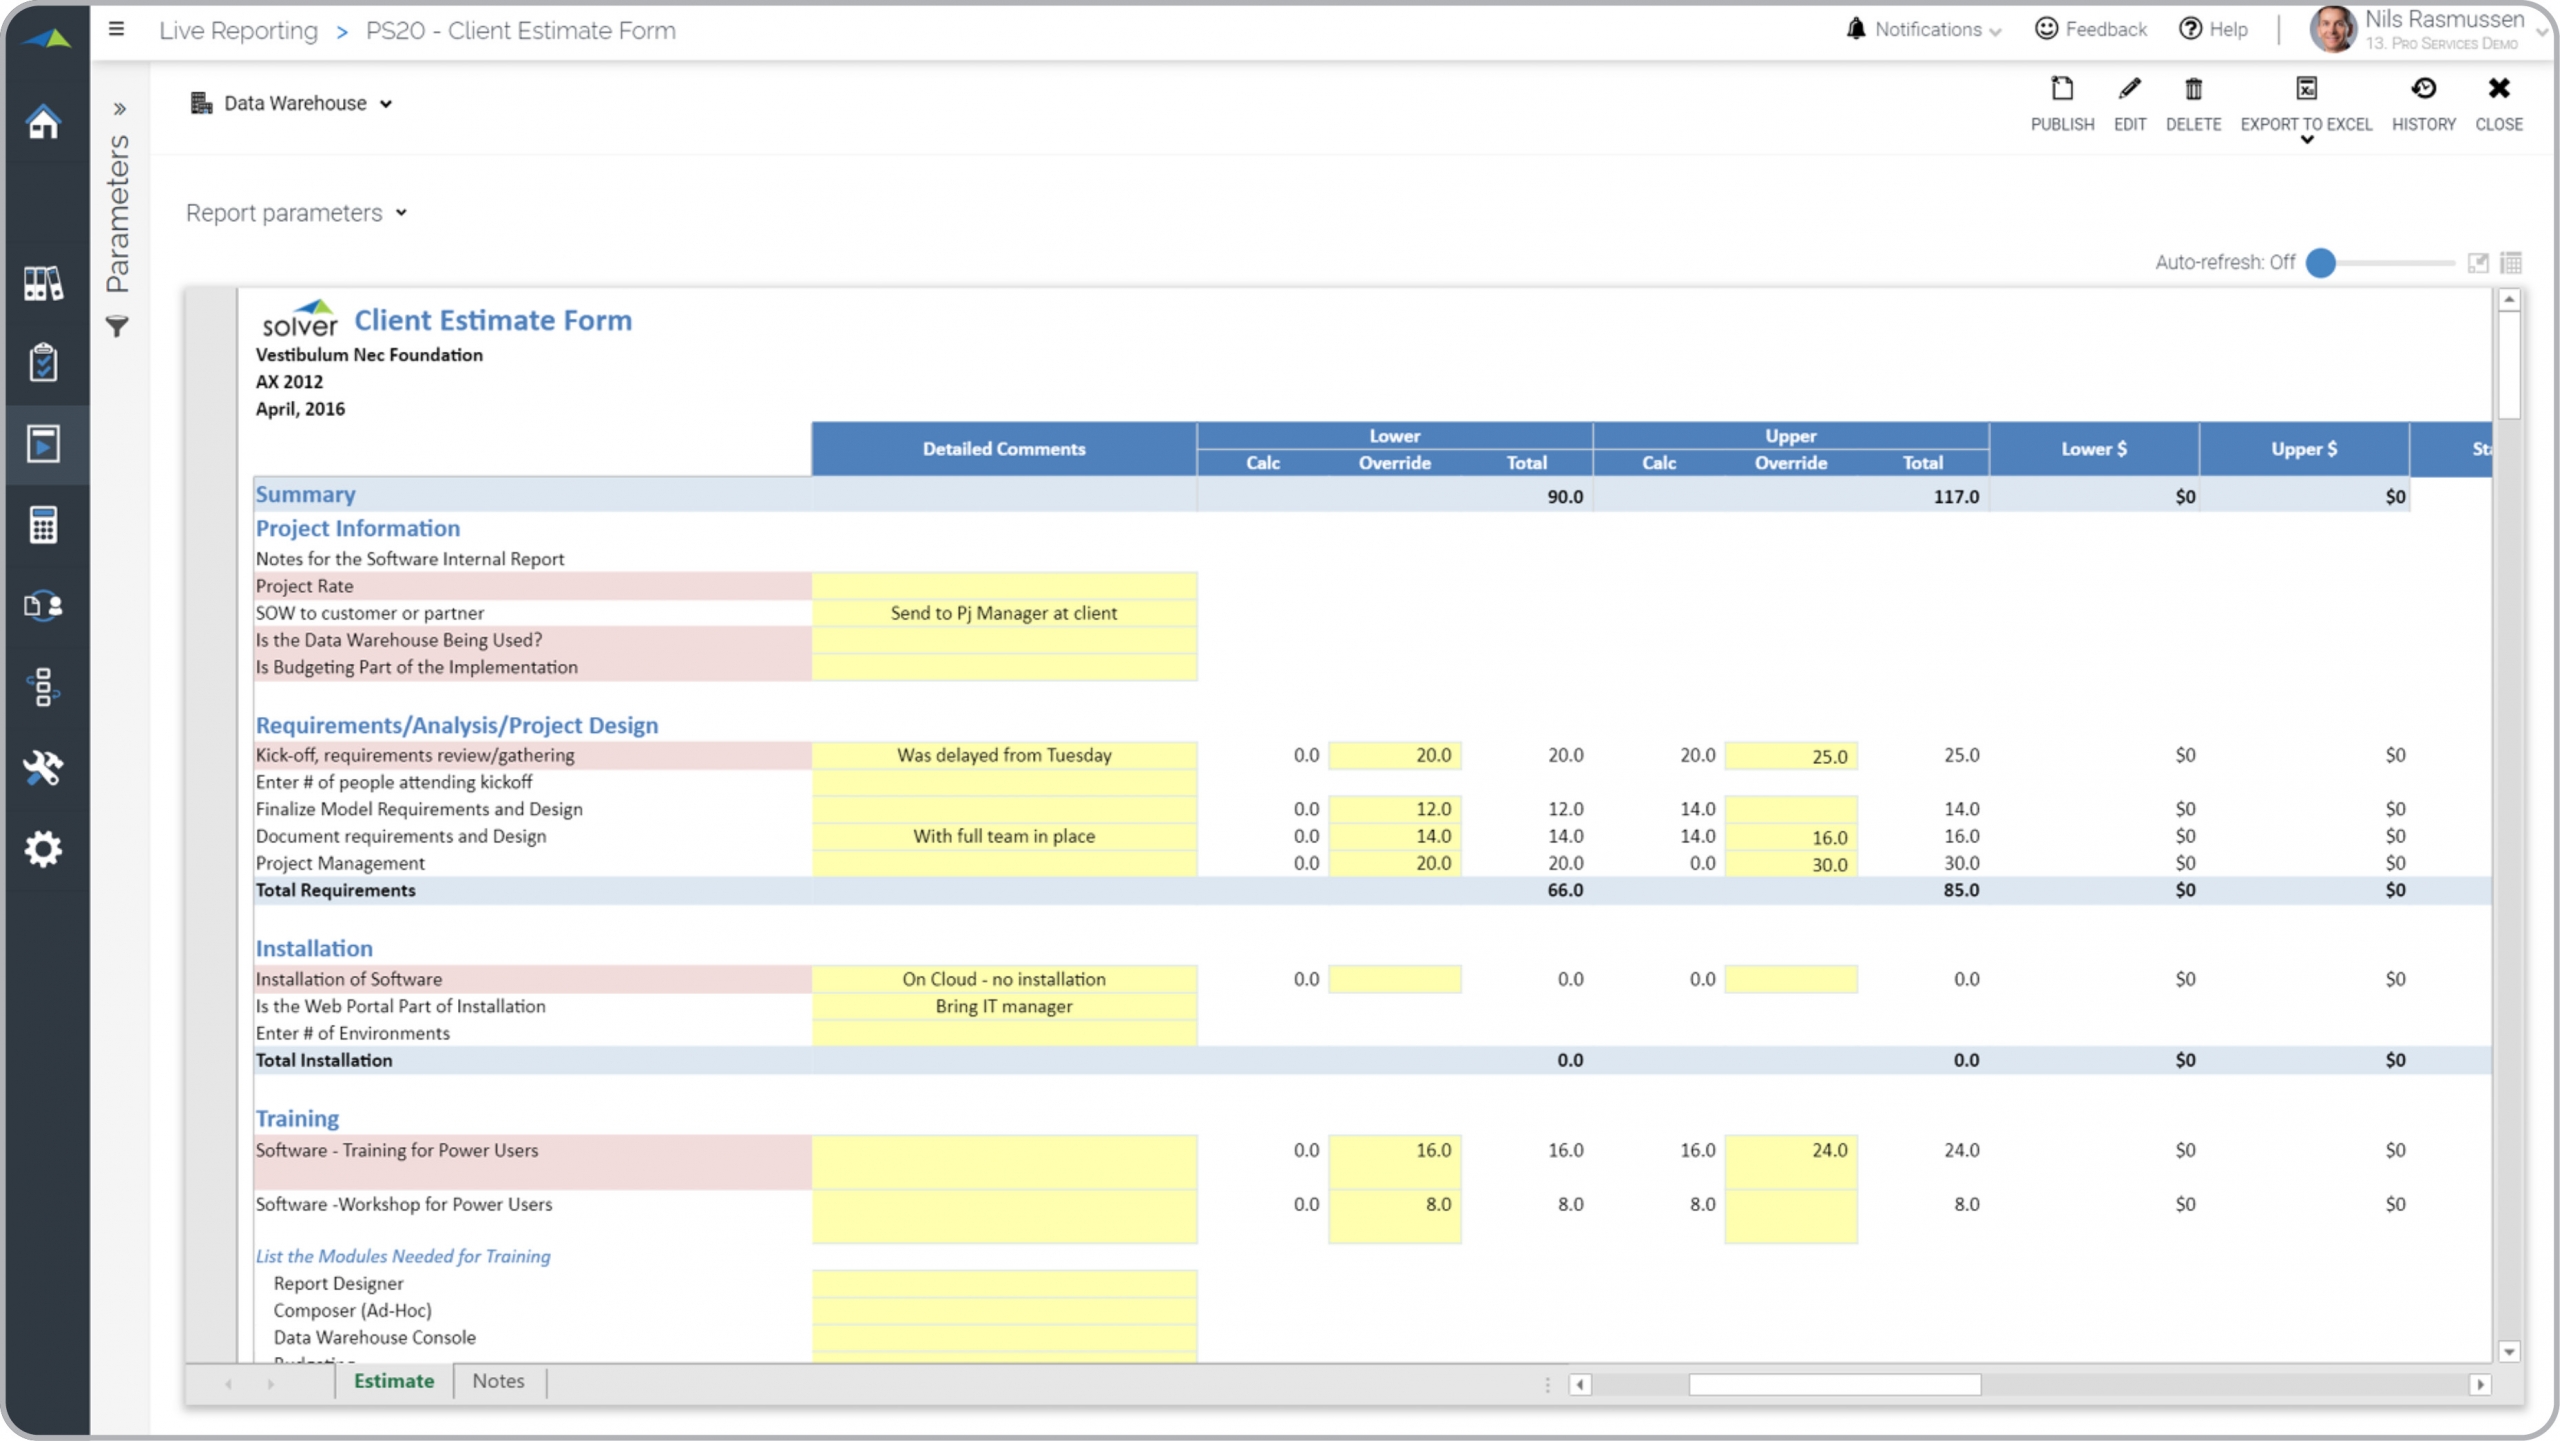
Professional Services – Client Estimate
Data input of high and low estimates of hours and cost for a project.
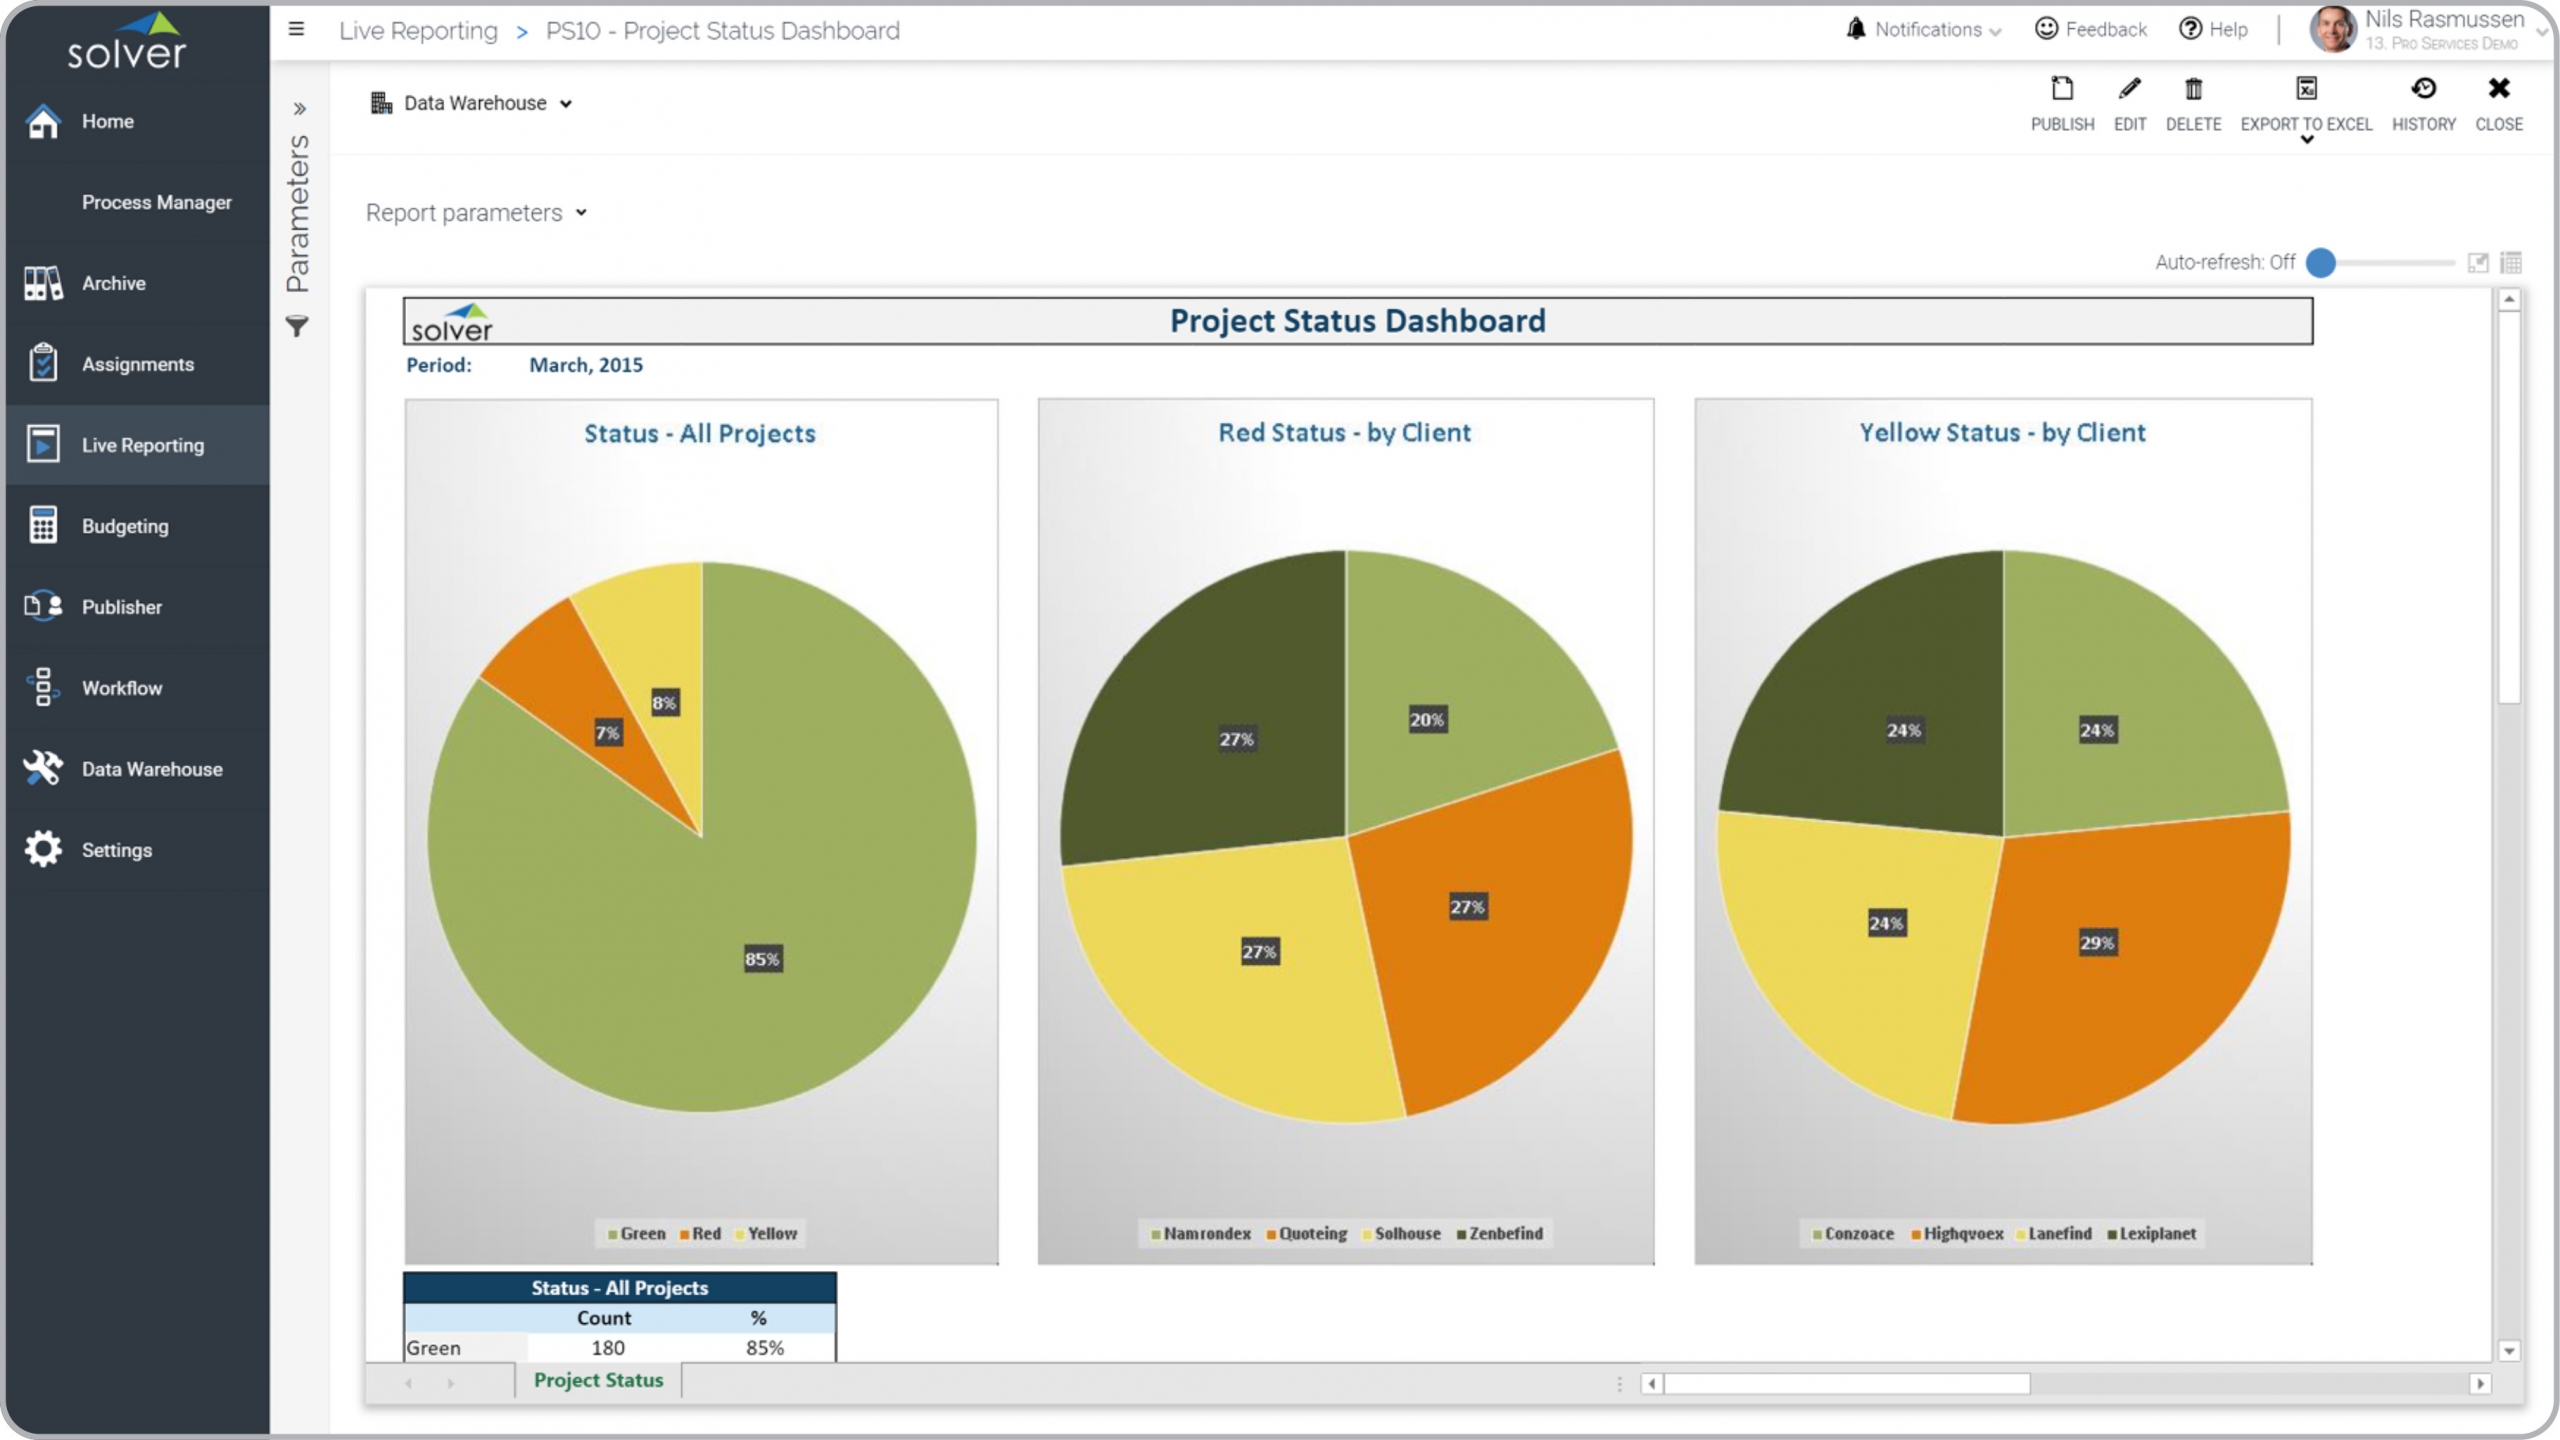
Professional Services – Project Status Dashboard
Shows project status for all clients and specific to clients with Red and Yellow status.
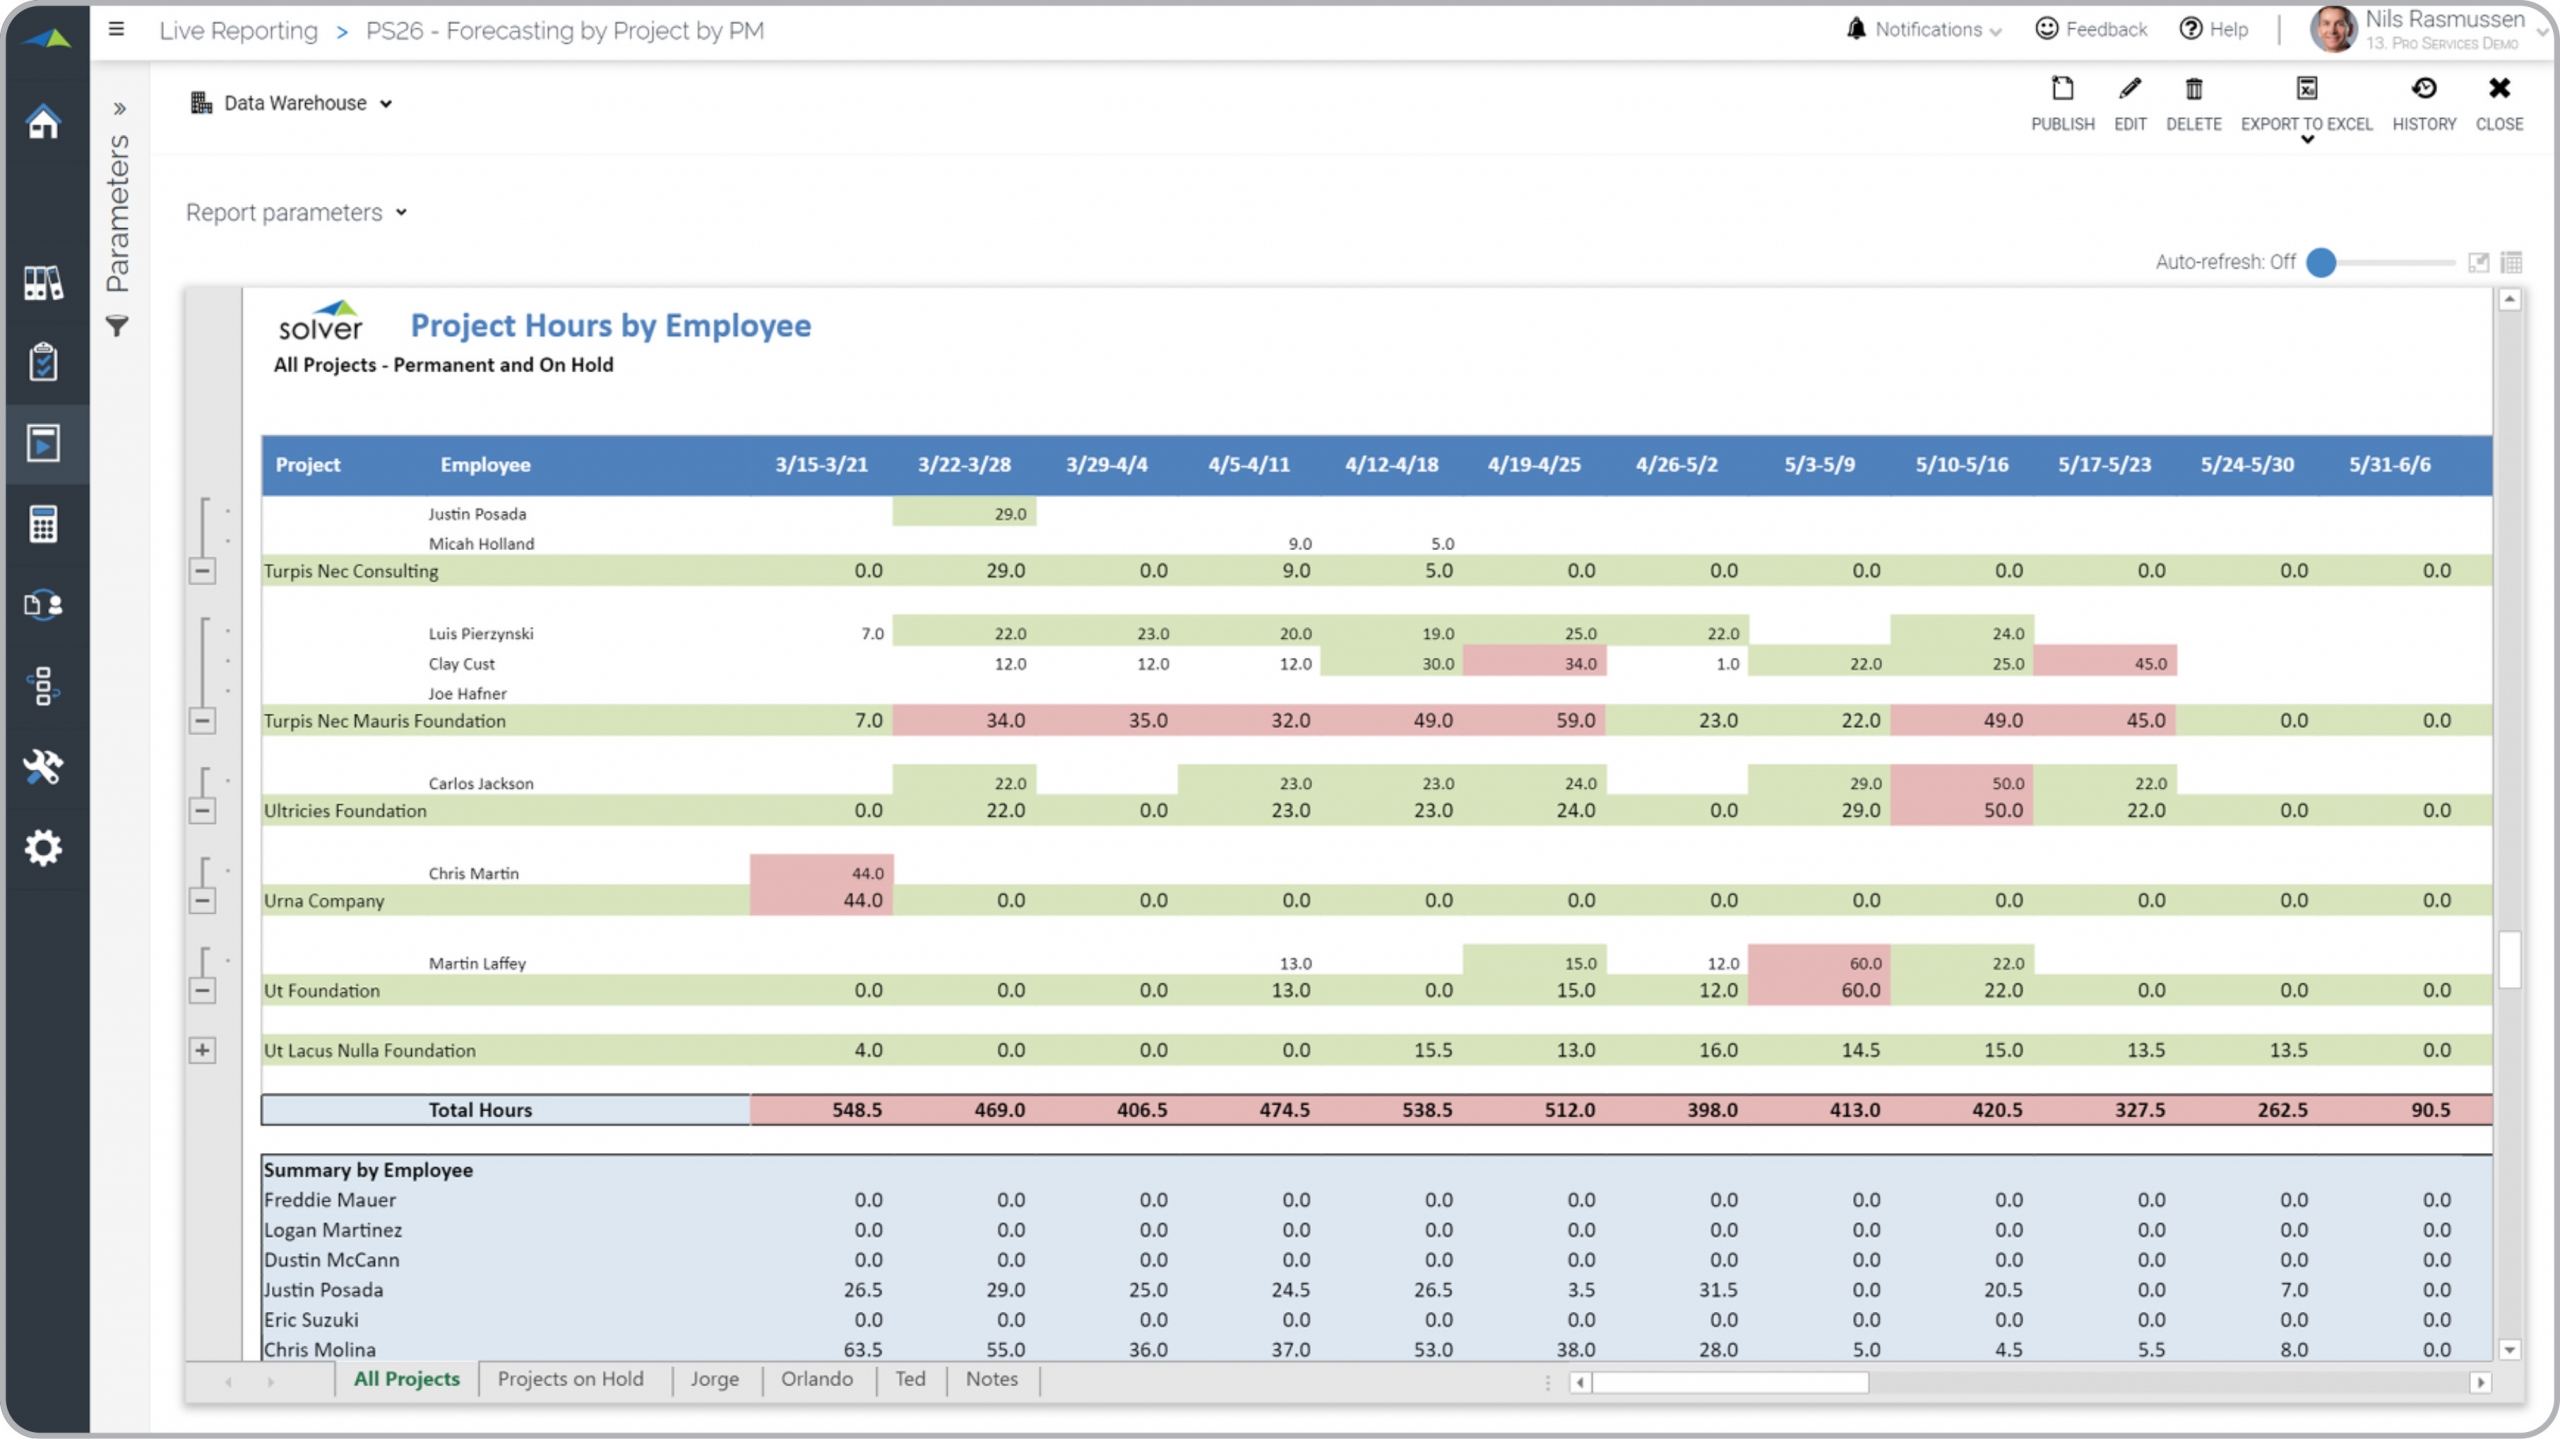
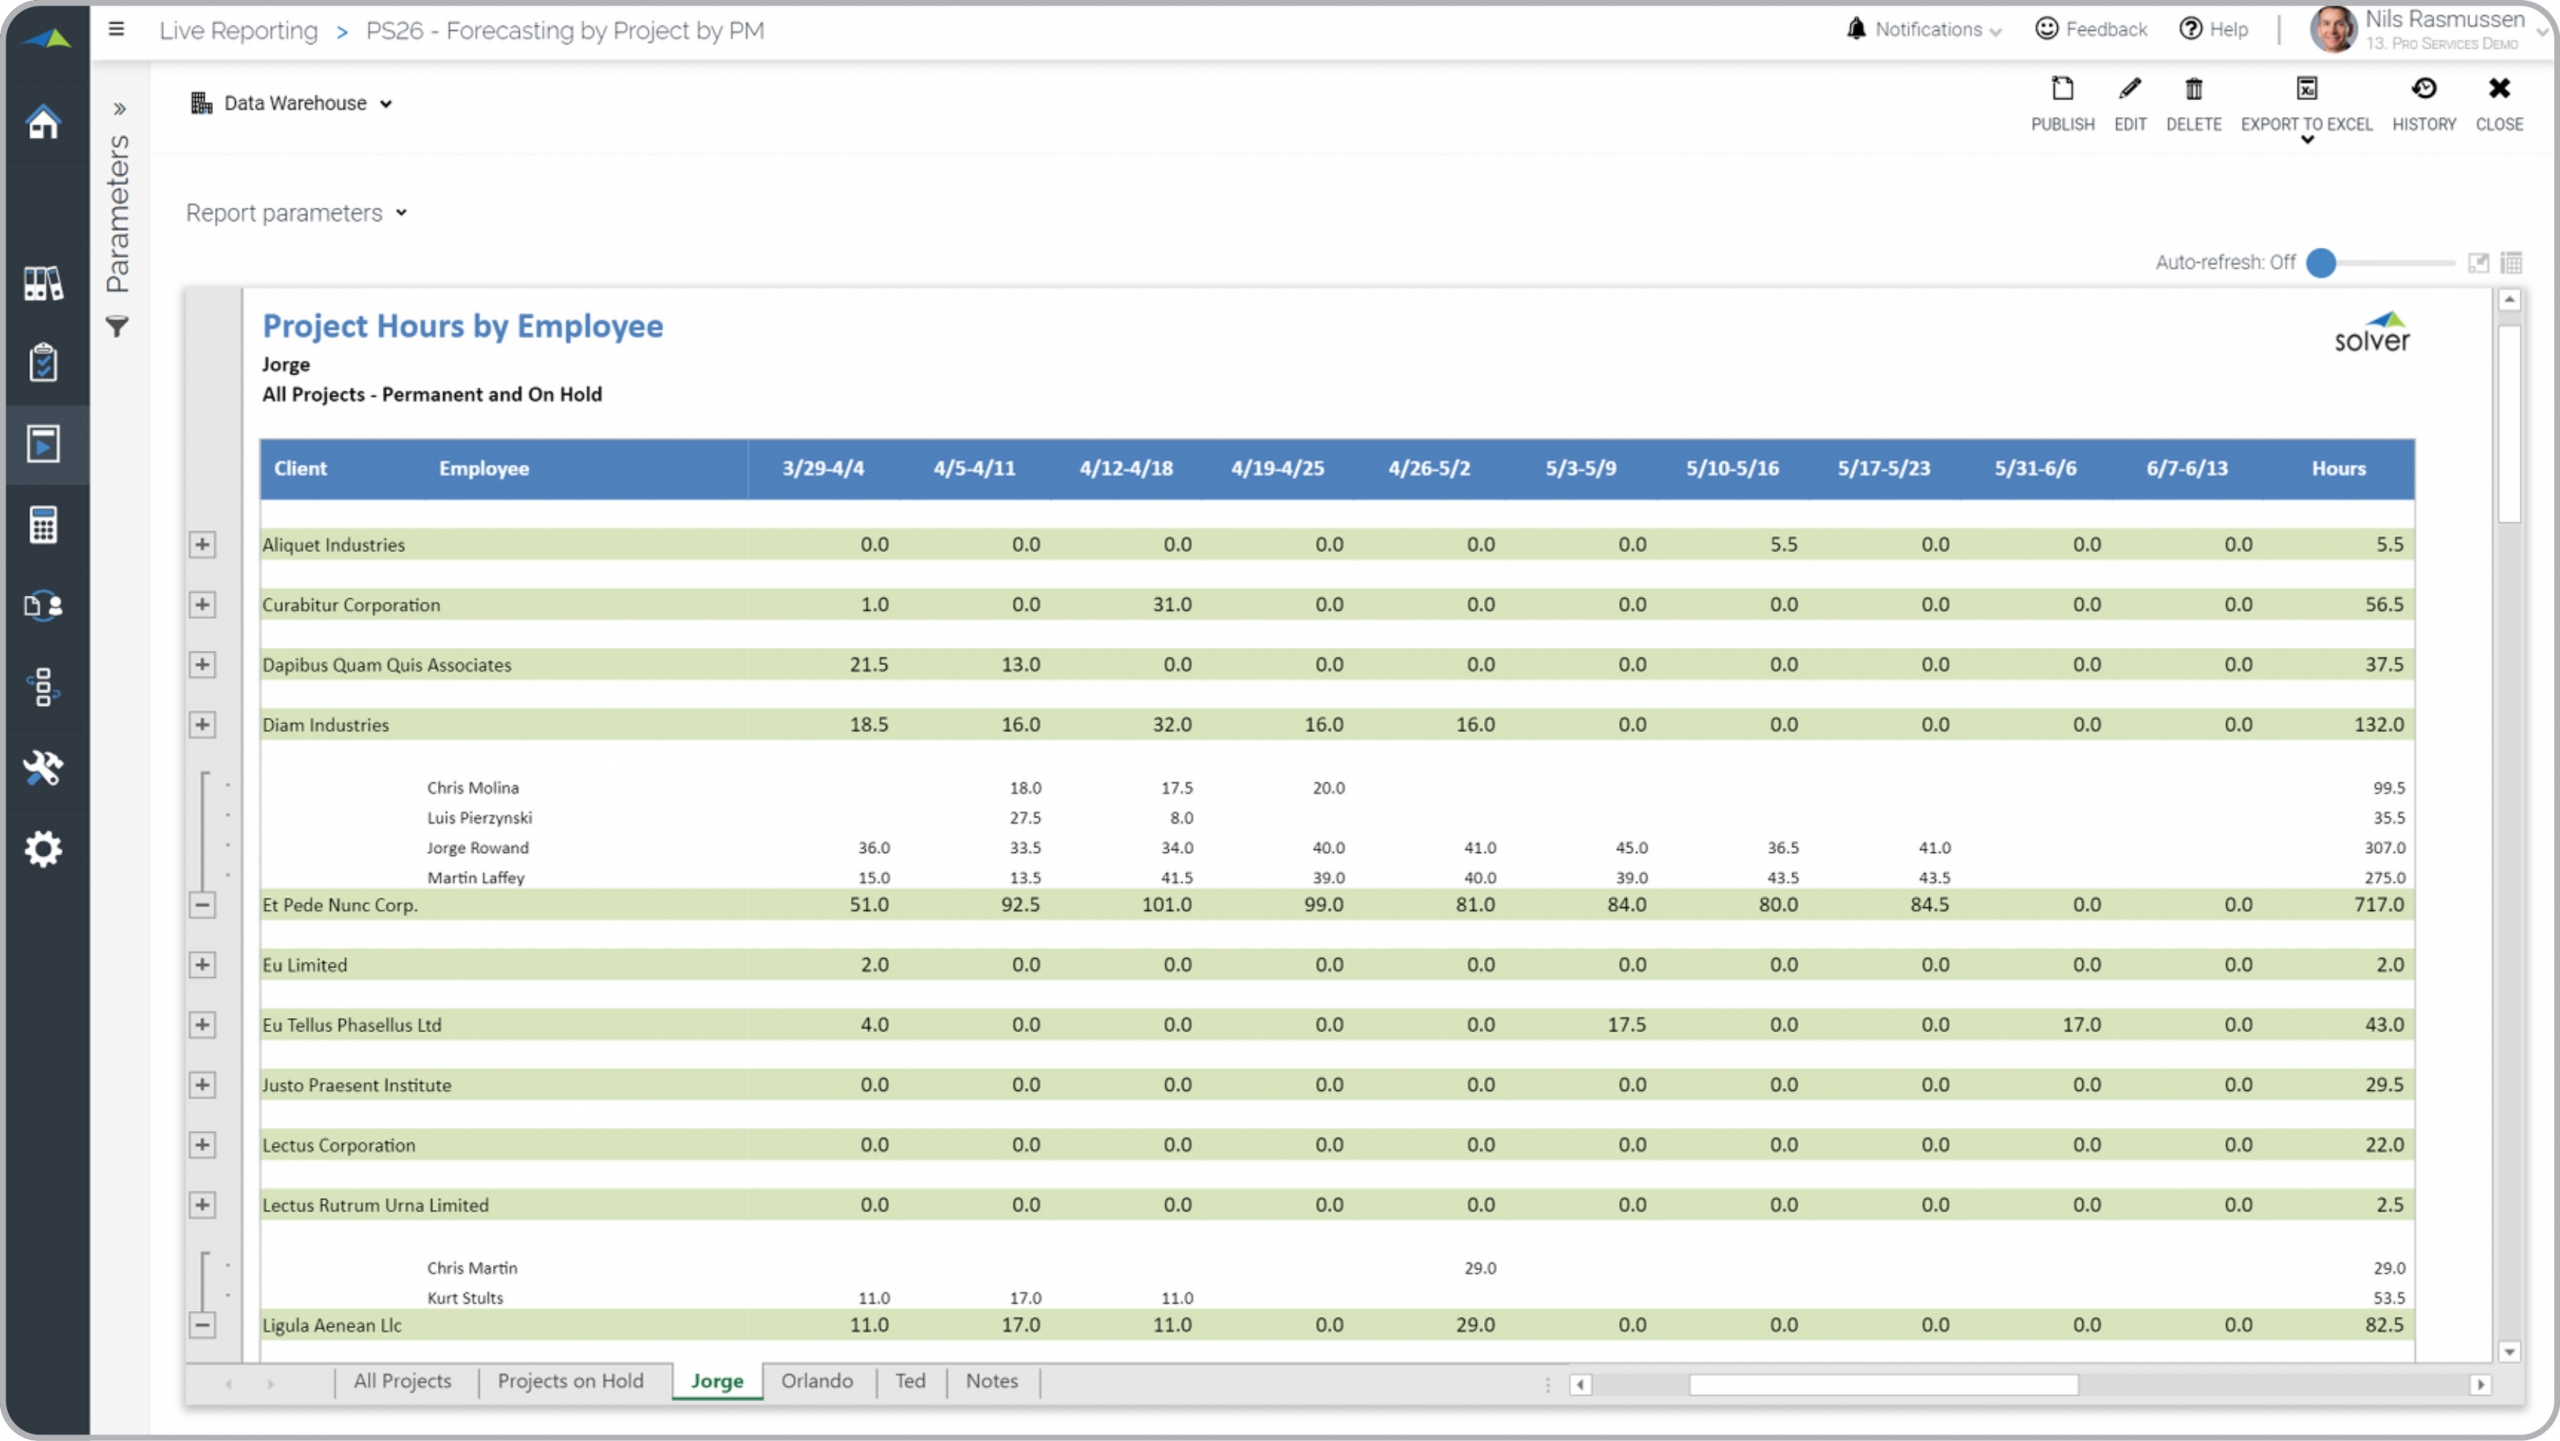
Professional Services – Project Forecast by PM
Summary of hourly forecast, with each project manager and their team on separate tabs.
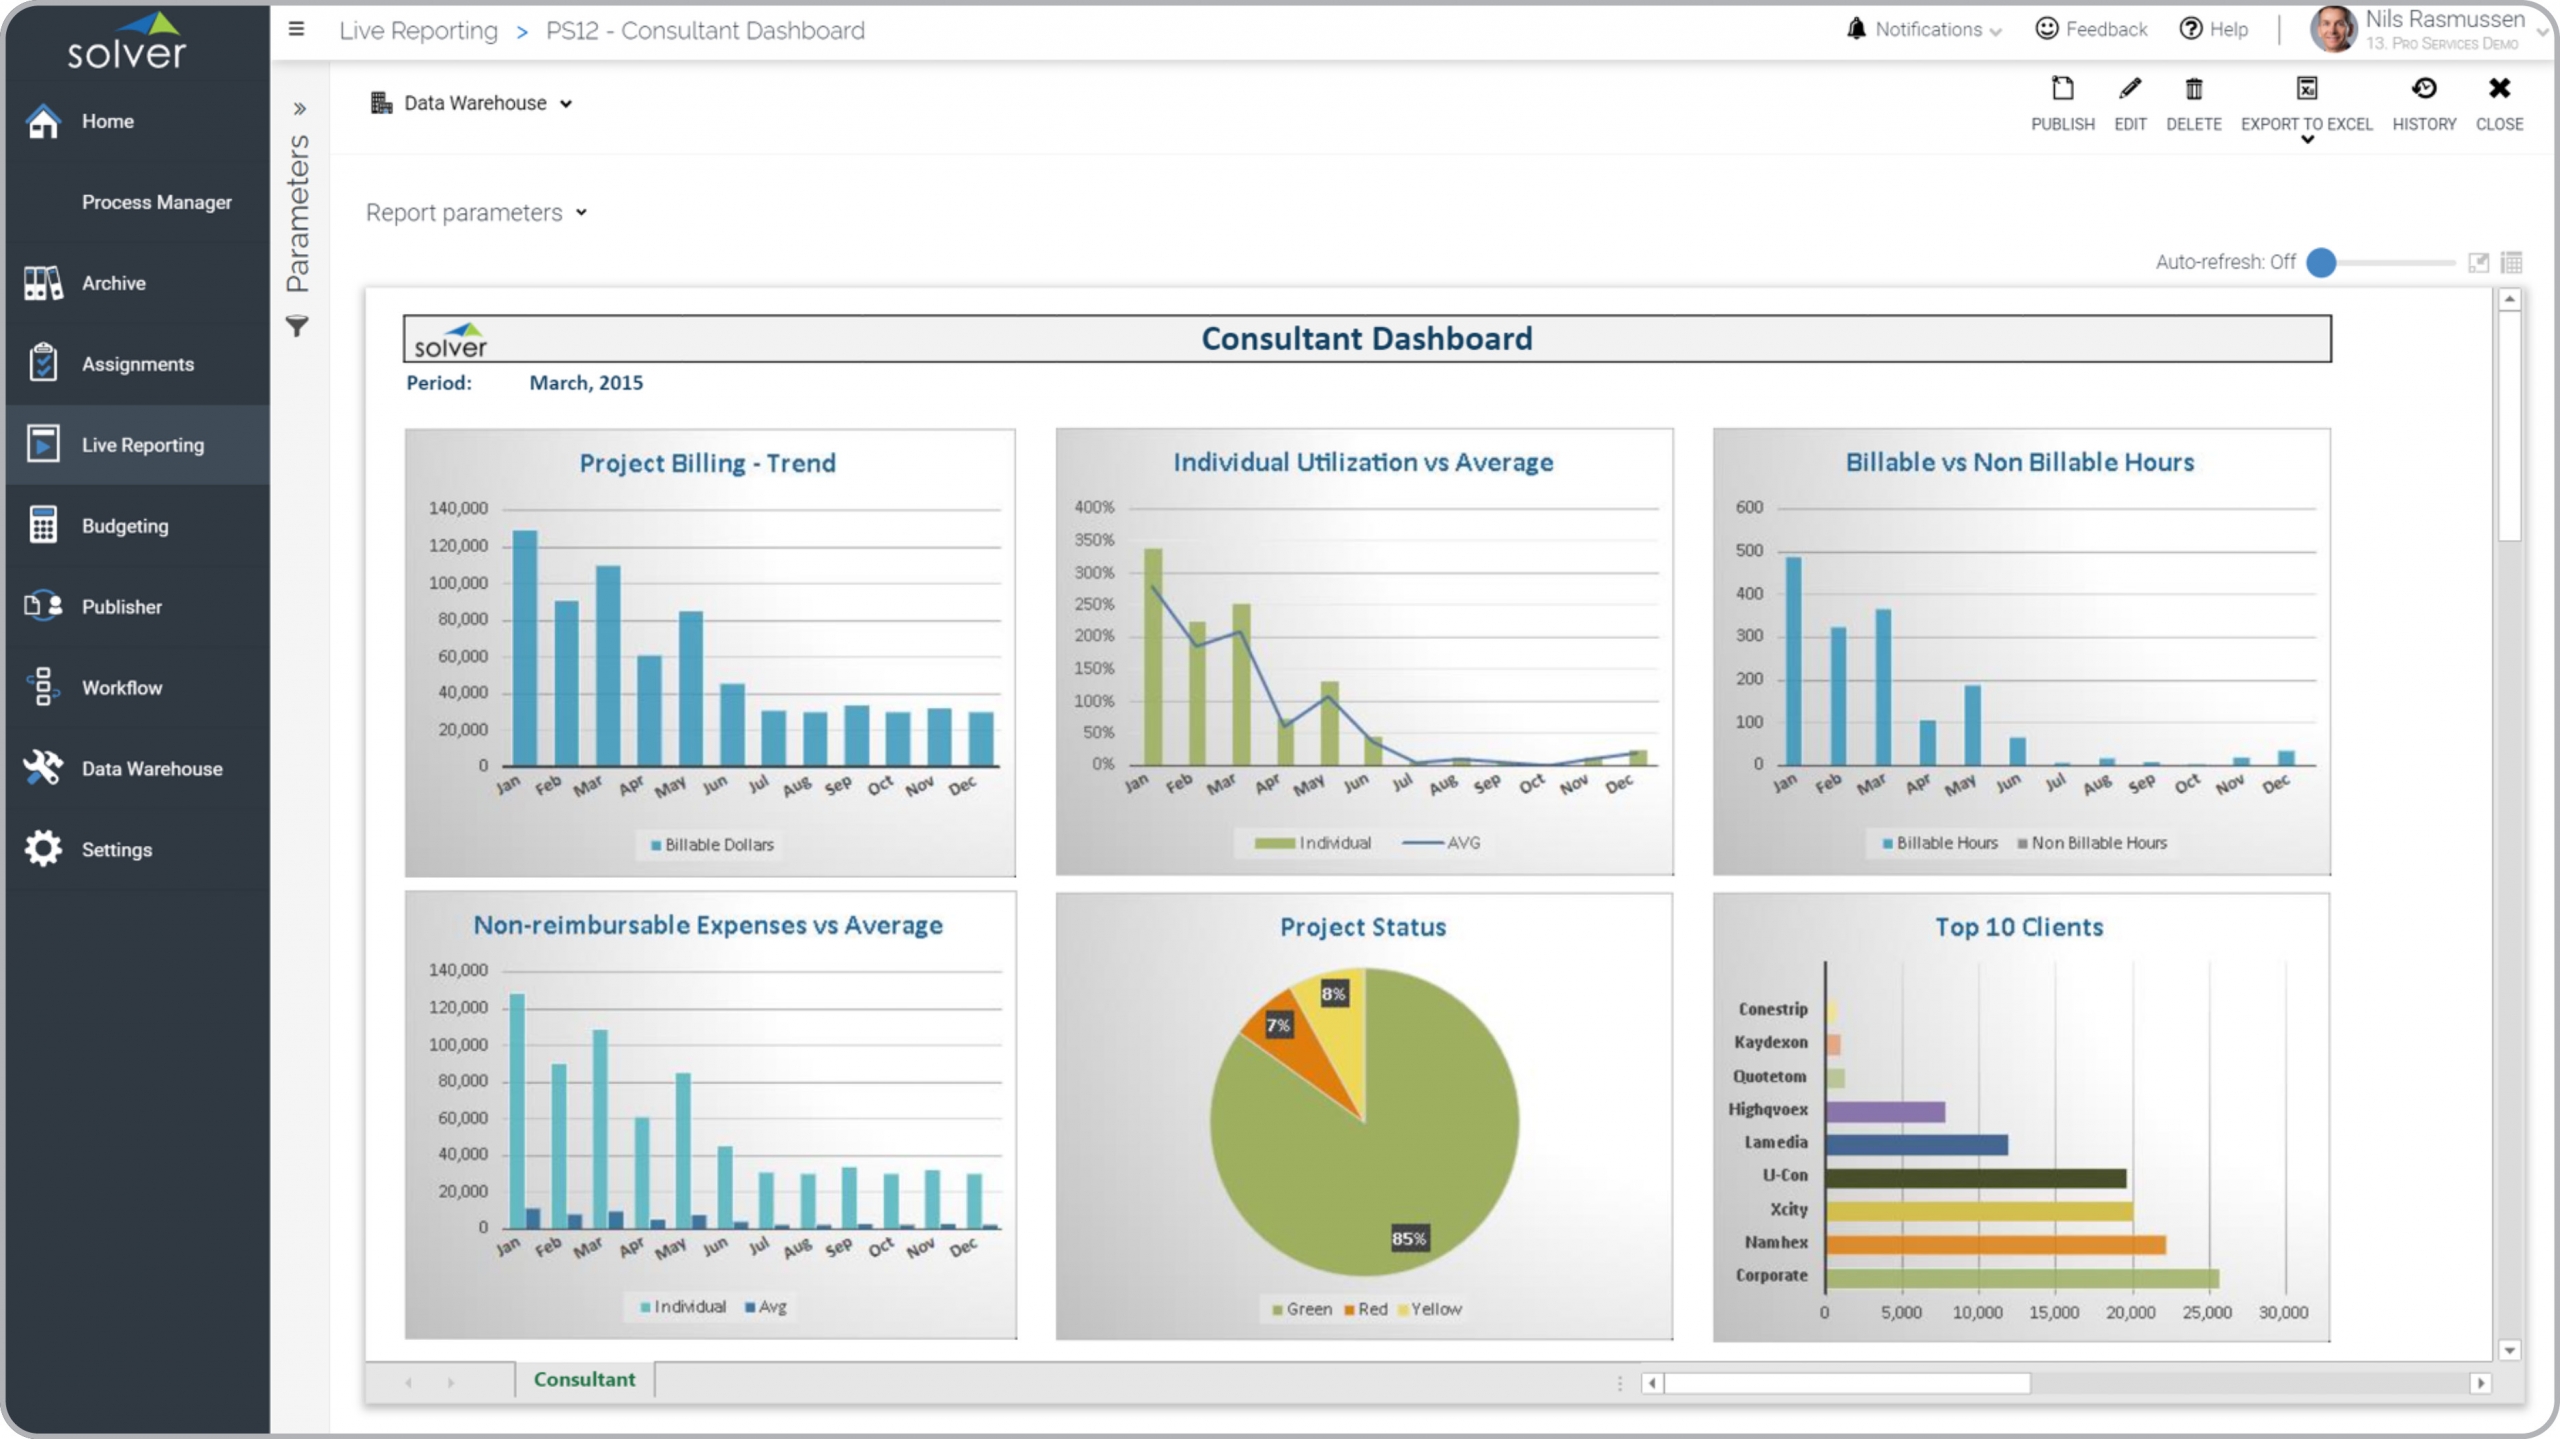
Professional Services – Consultant Dashboard
Analysis of KPIs important to a consultant, including billing, utilization and project statuses.
Professional Services – Project Forecast by Employee
Input of forecasted hours by PM/consultant, and roll up to a summary tab with all PMs.
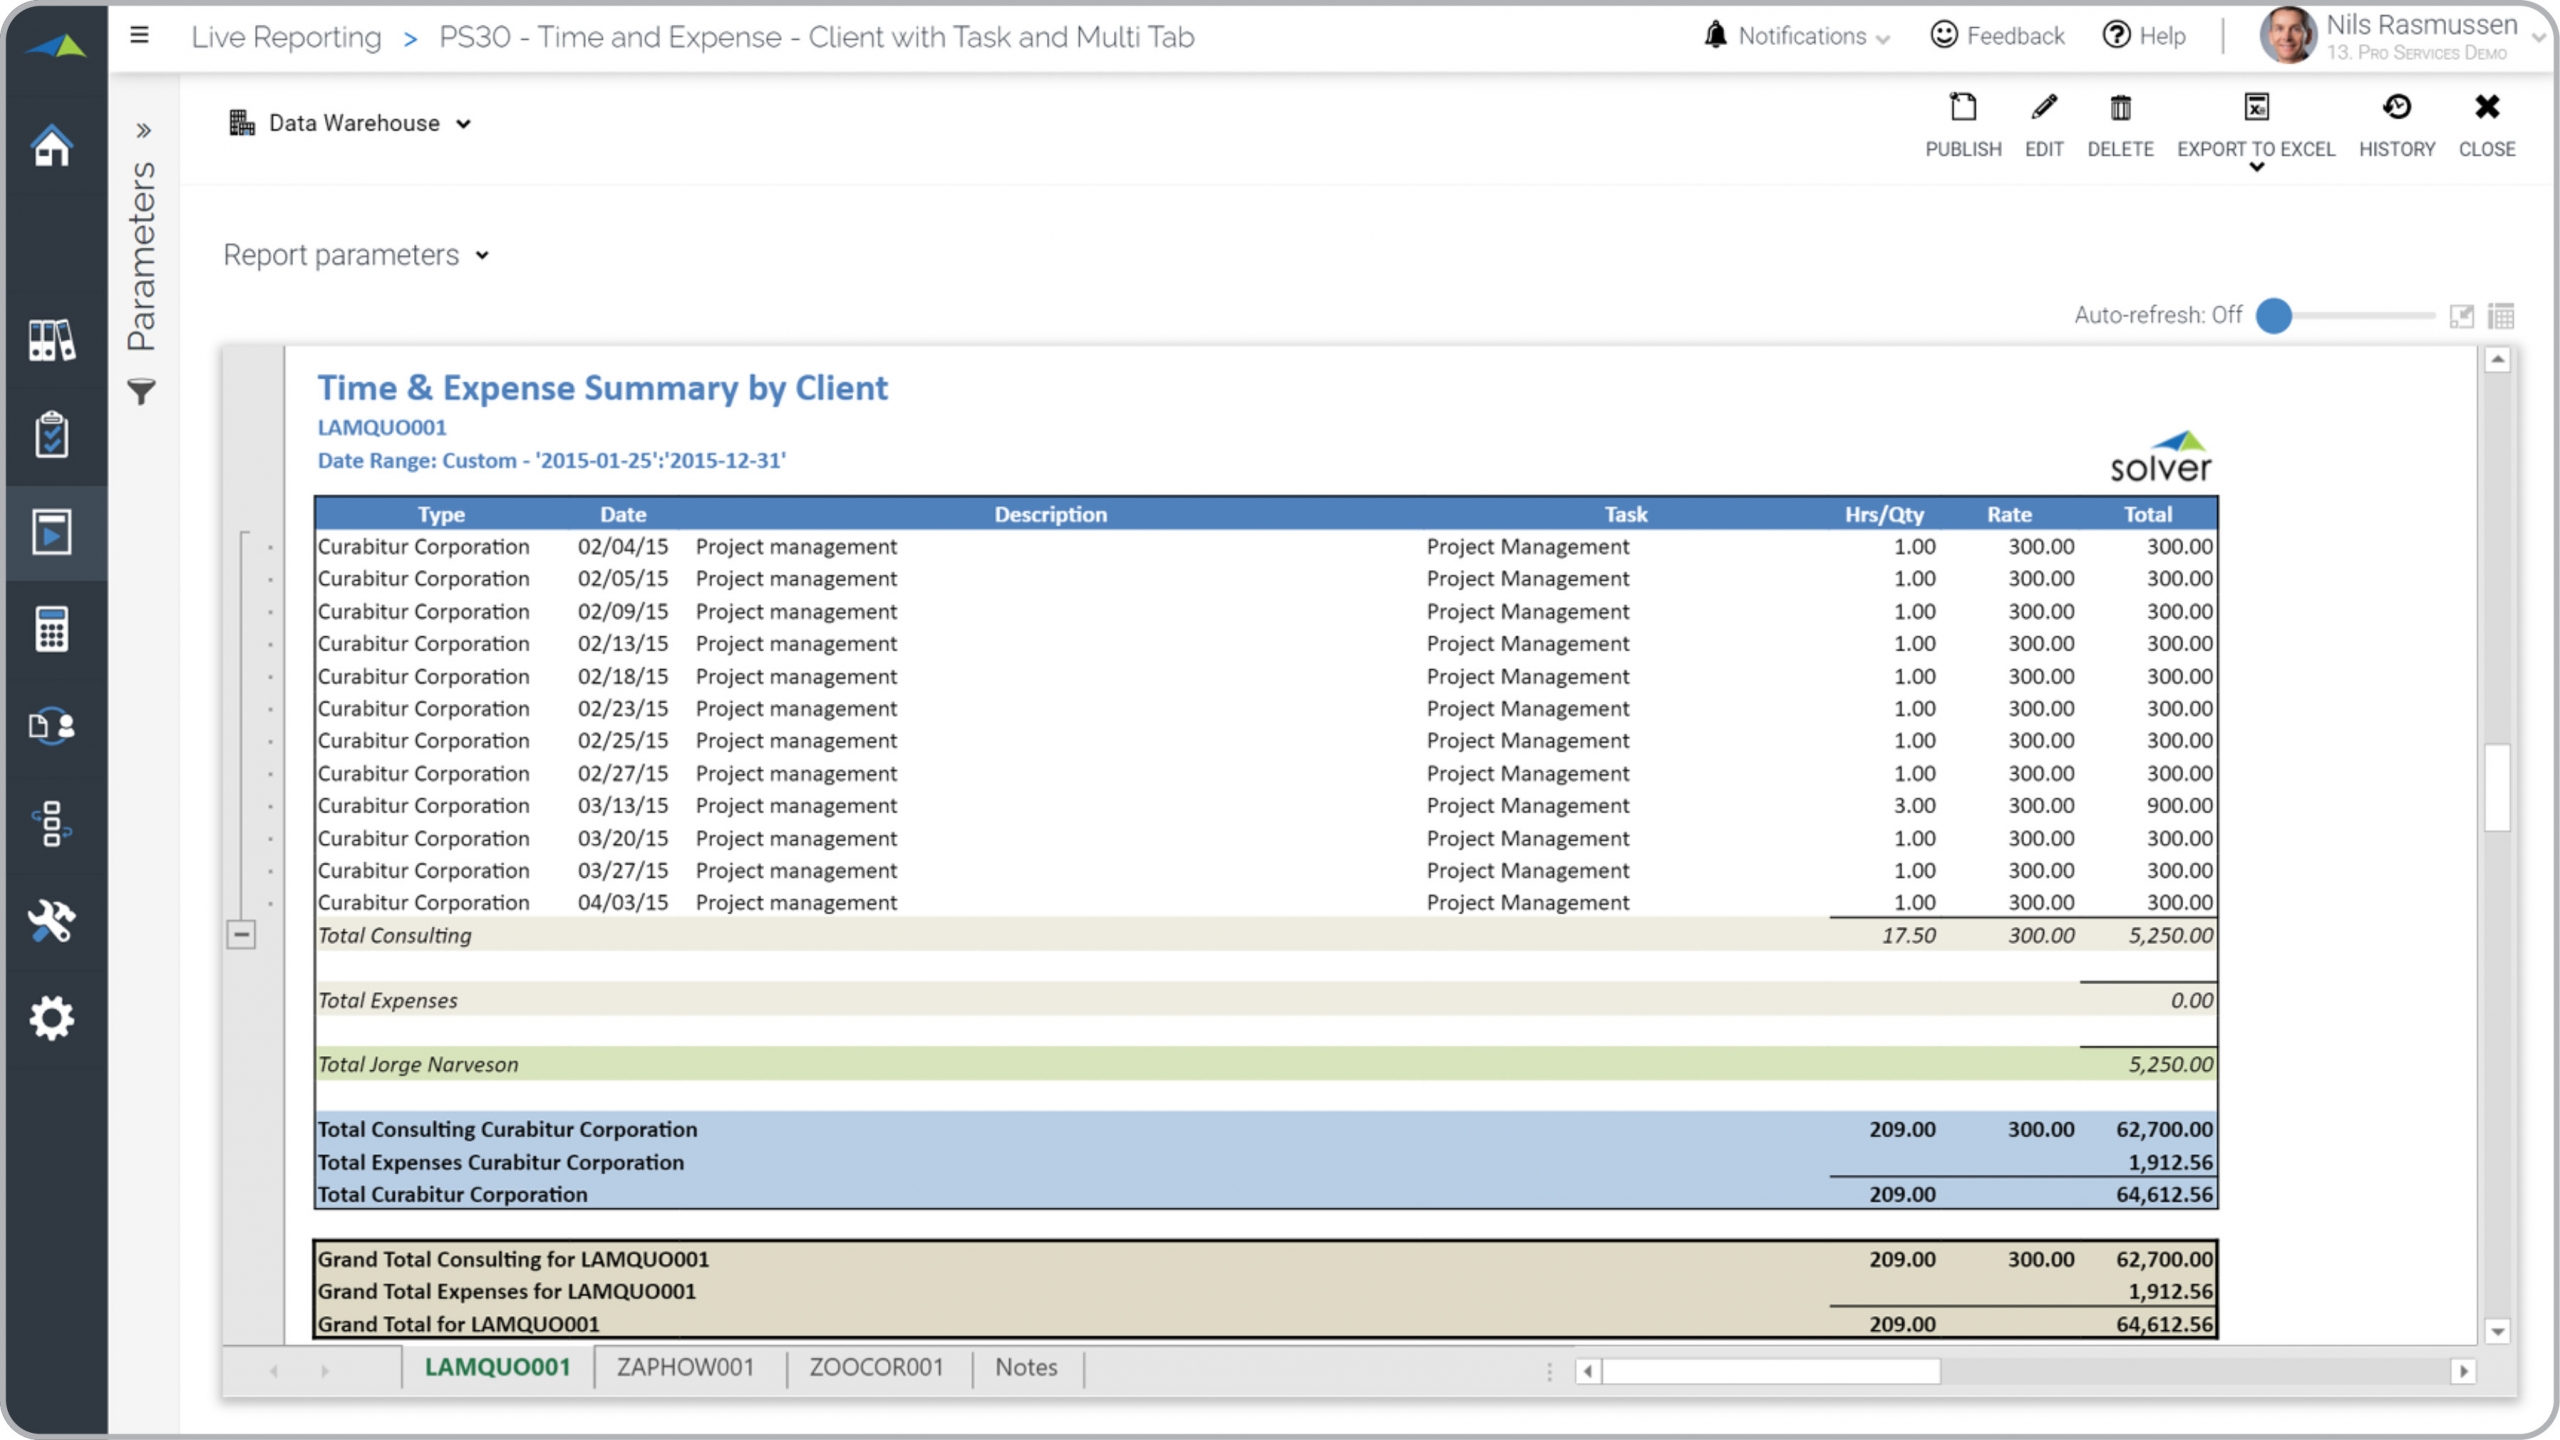
Professional Services – Time & Expense Summary by Client
Report with billable amounts and expenses for a client.
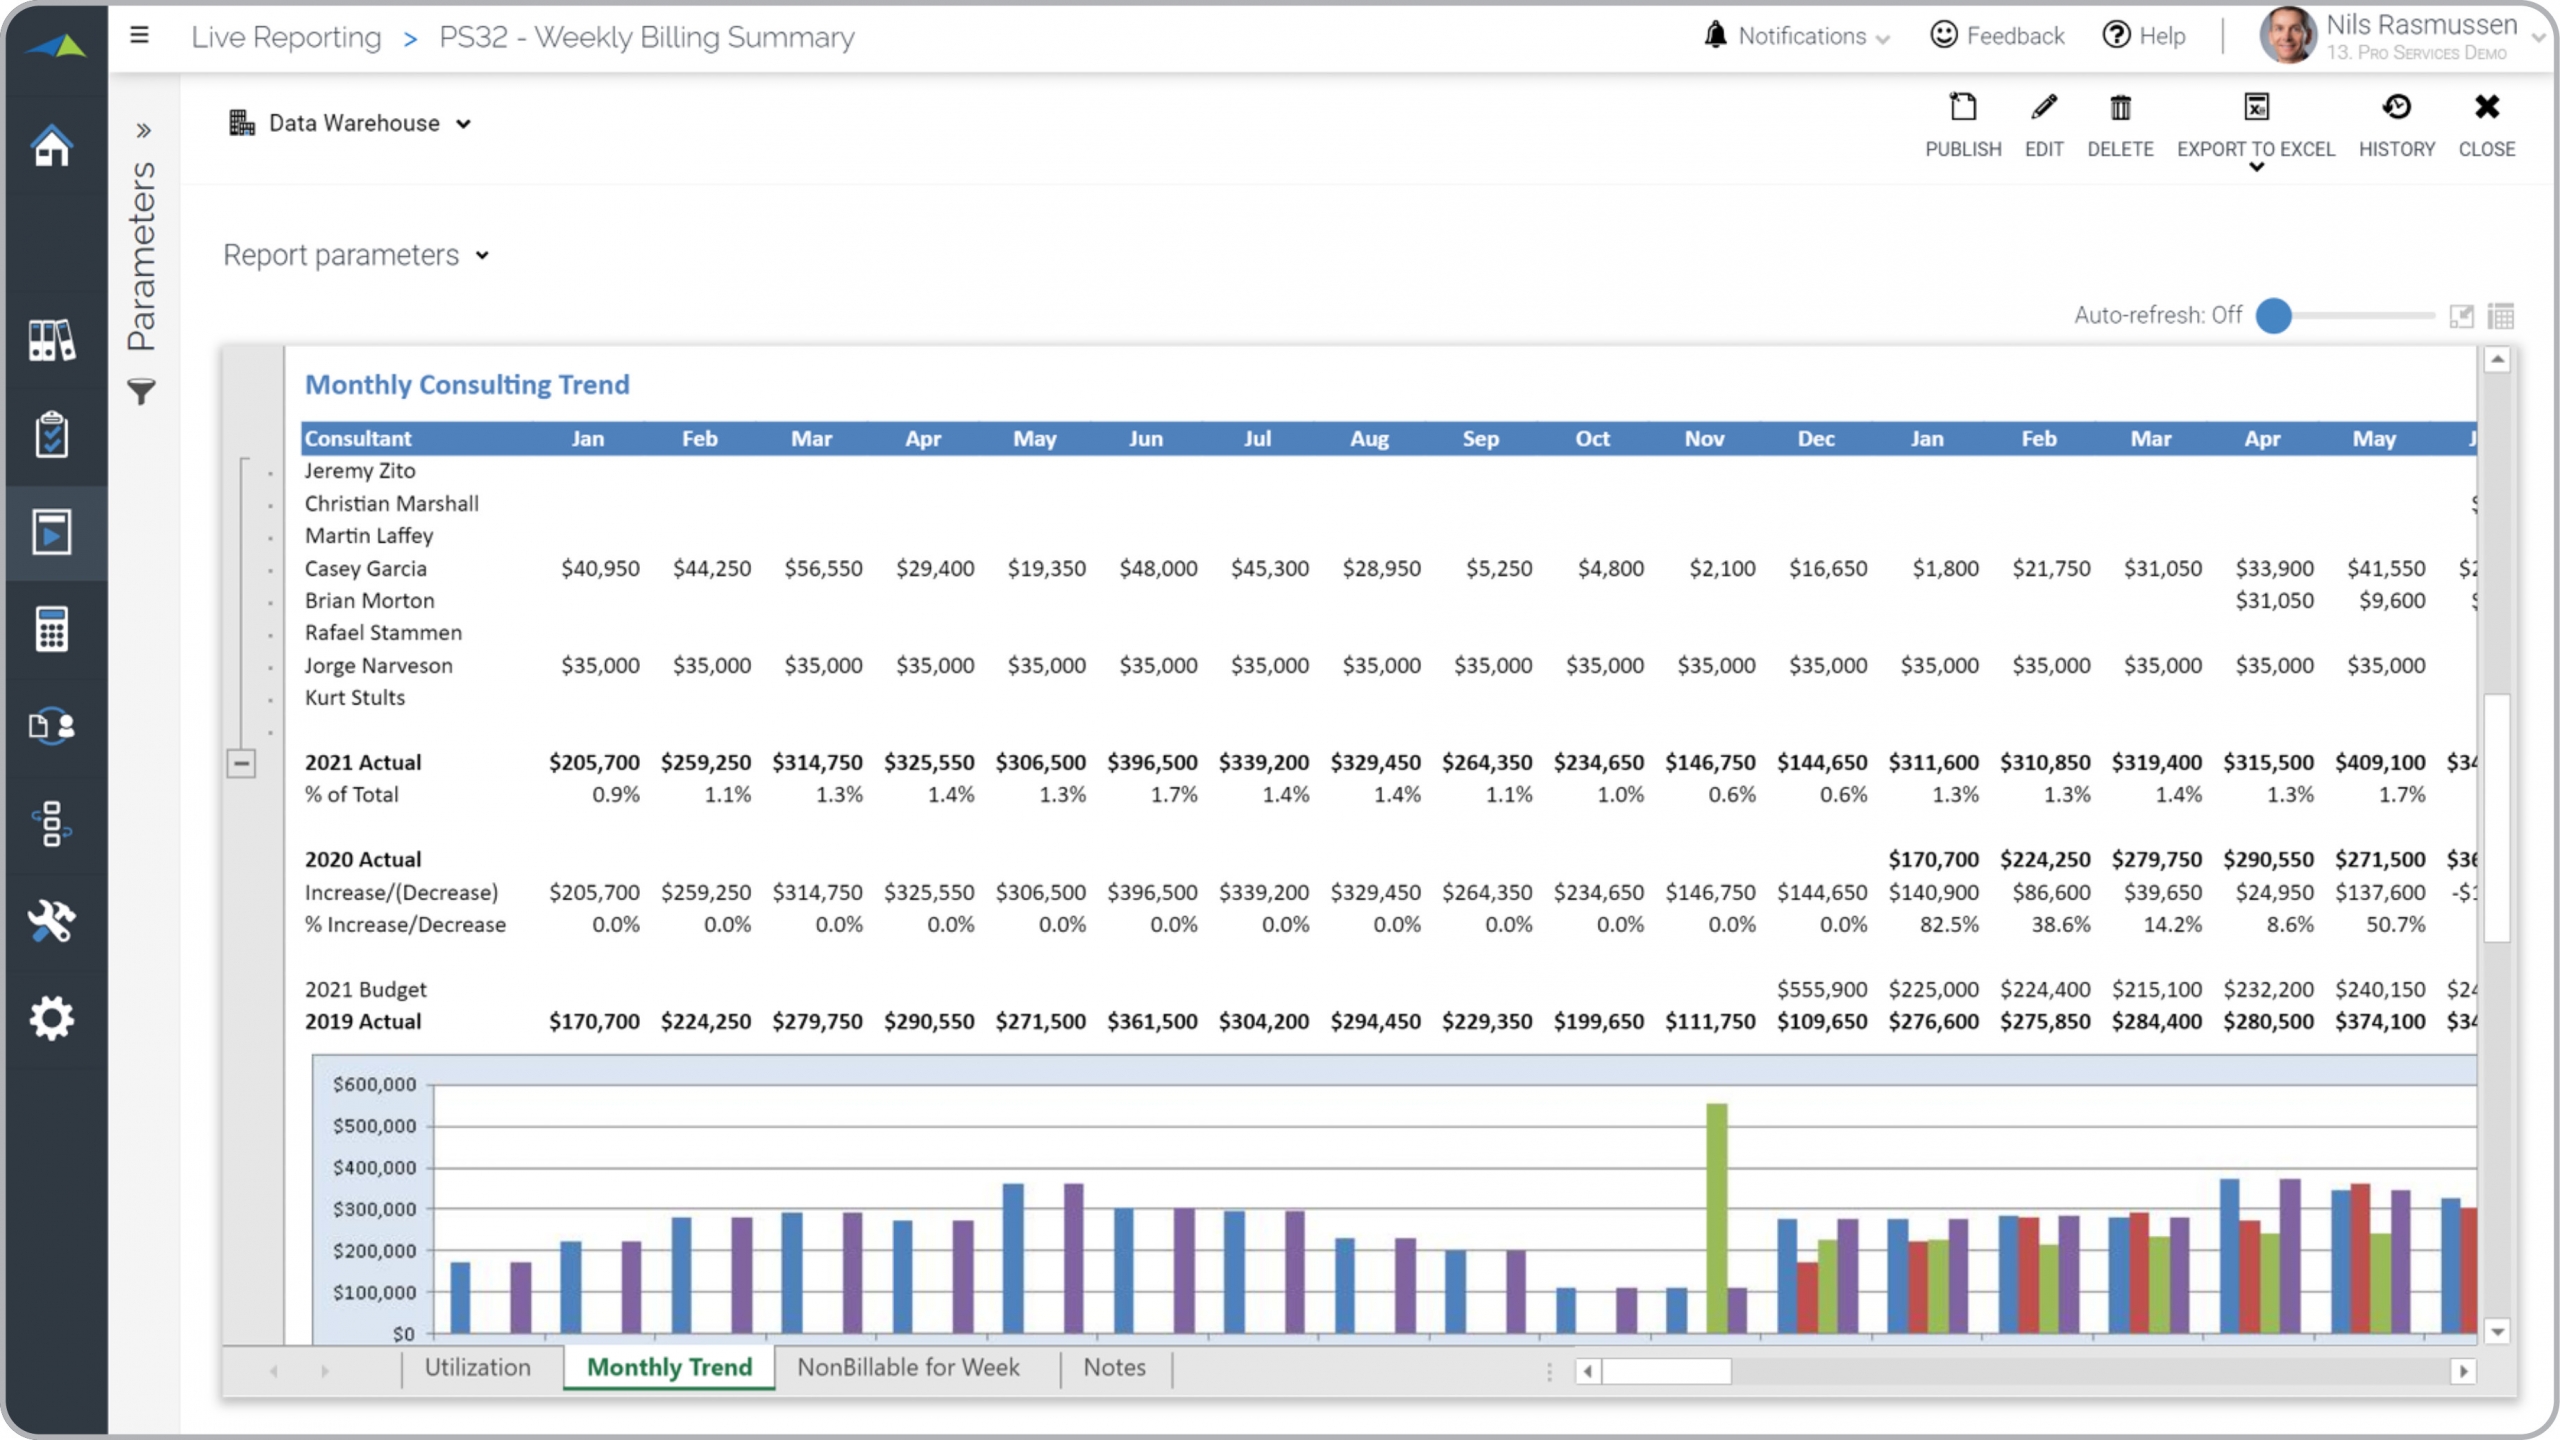
Professional Services – Monthly Billing Trend
Rolling, multi-year billing trend per consultant and with totals and budgets.
Professional Services – Weekly Project Status
Weekly status report with comments and updates to hours and priorities.
Professional Services – Consulting Forecast by Project
Input of forecasted hours by week by client, PM and consultant.
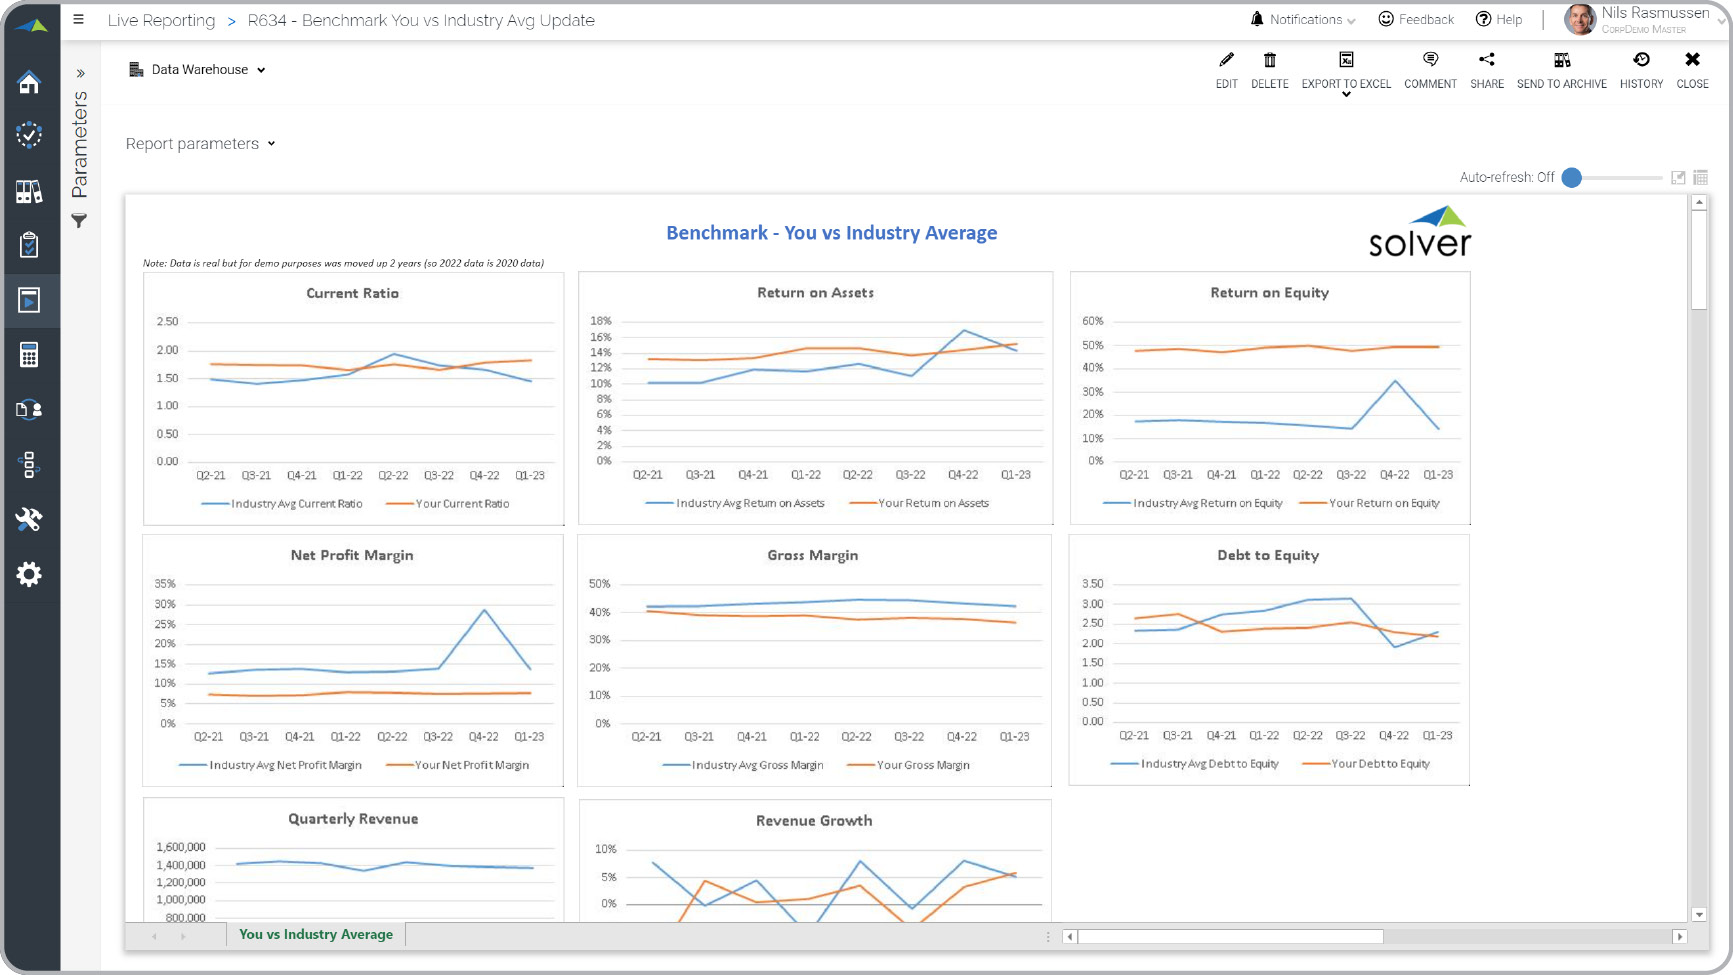
Benchmark with Industry Average
Benchmark own metrics versus the average of pool of similar companies.
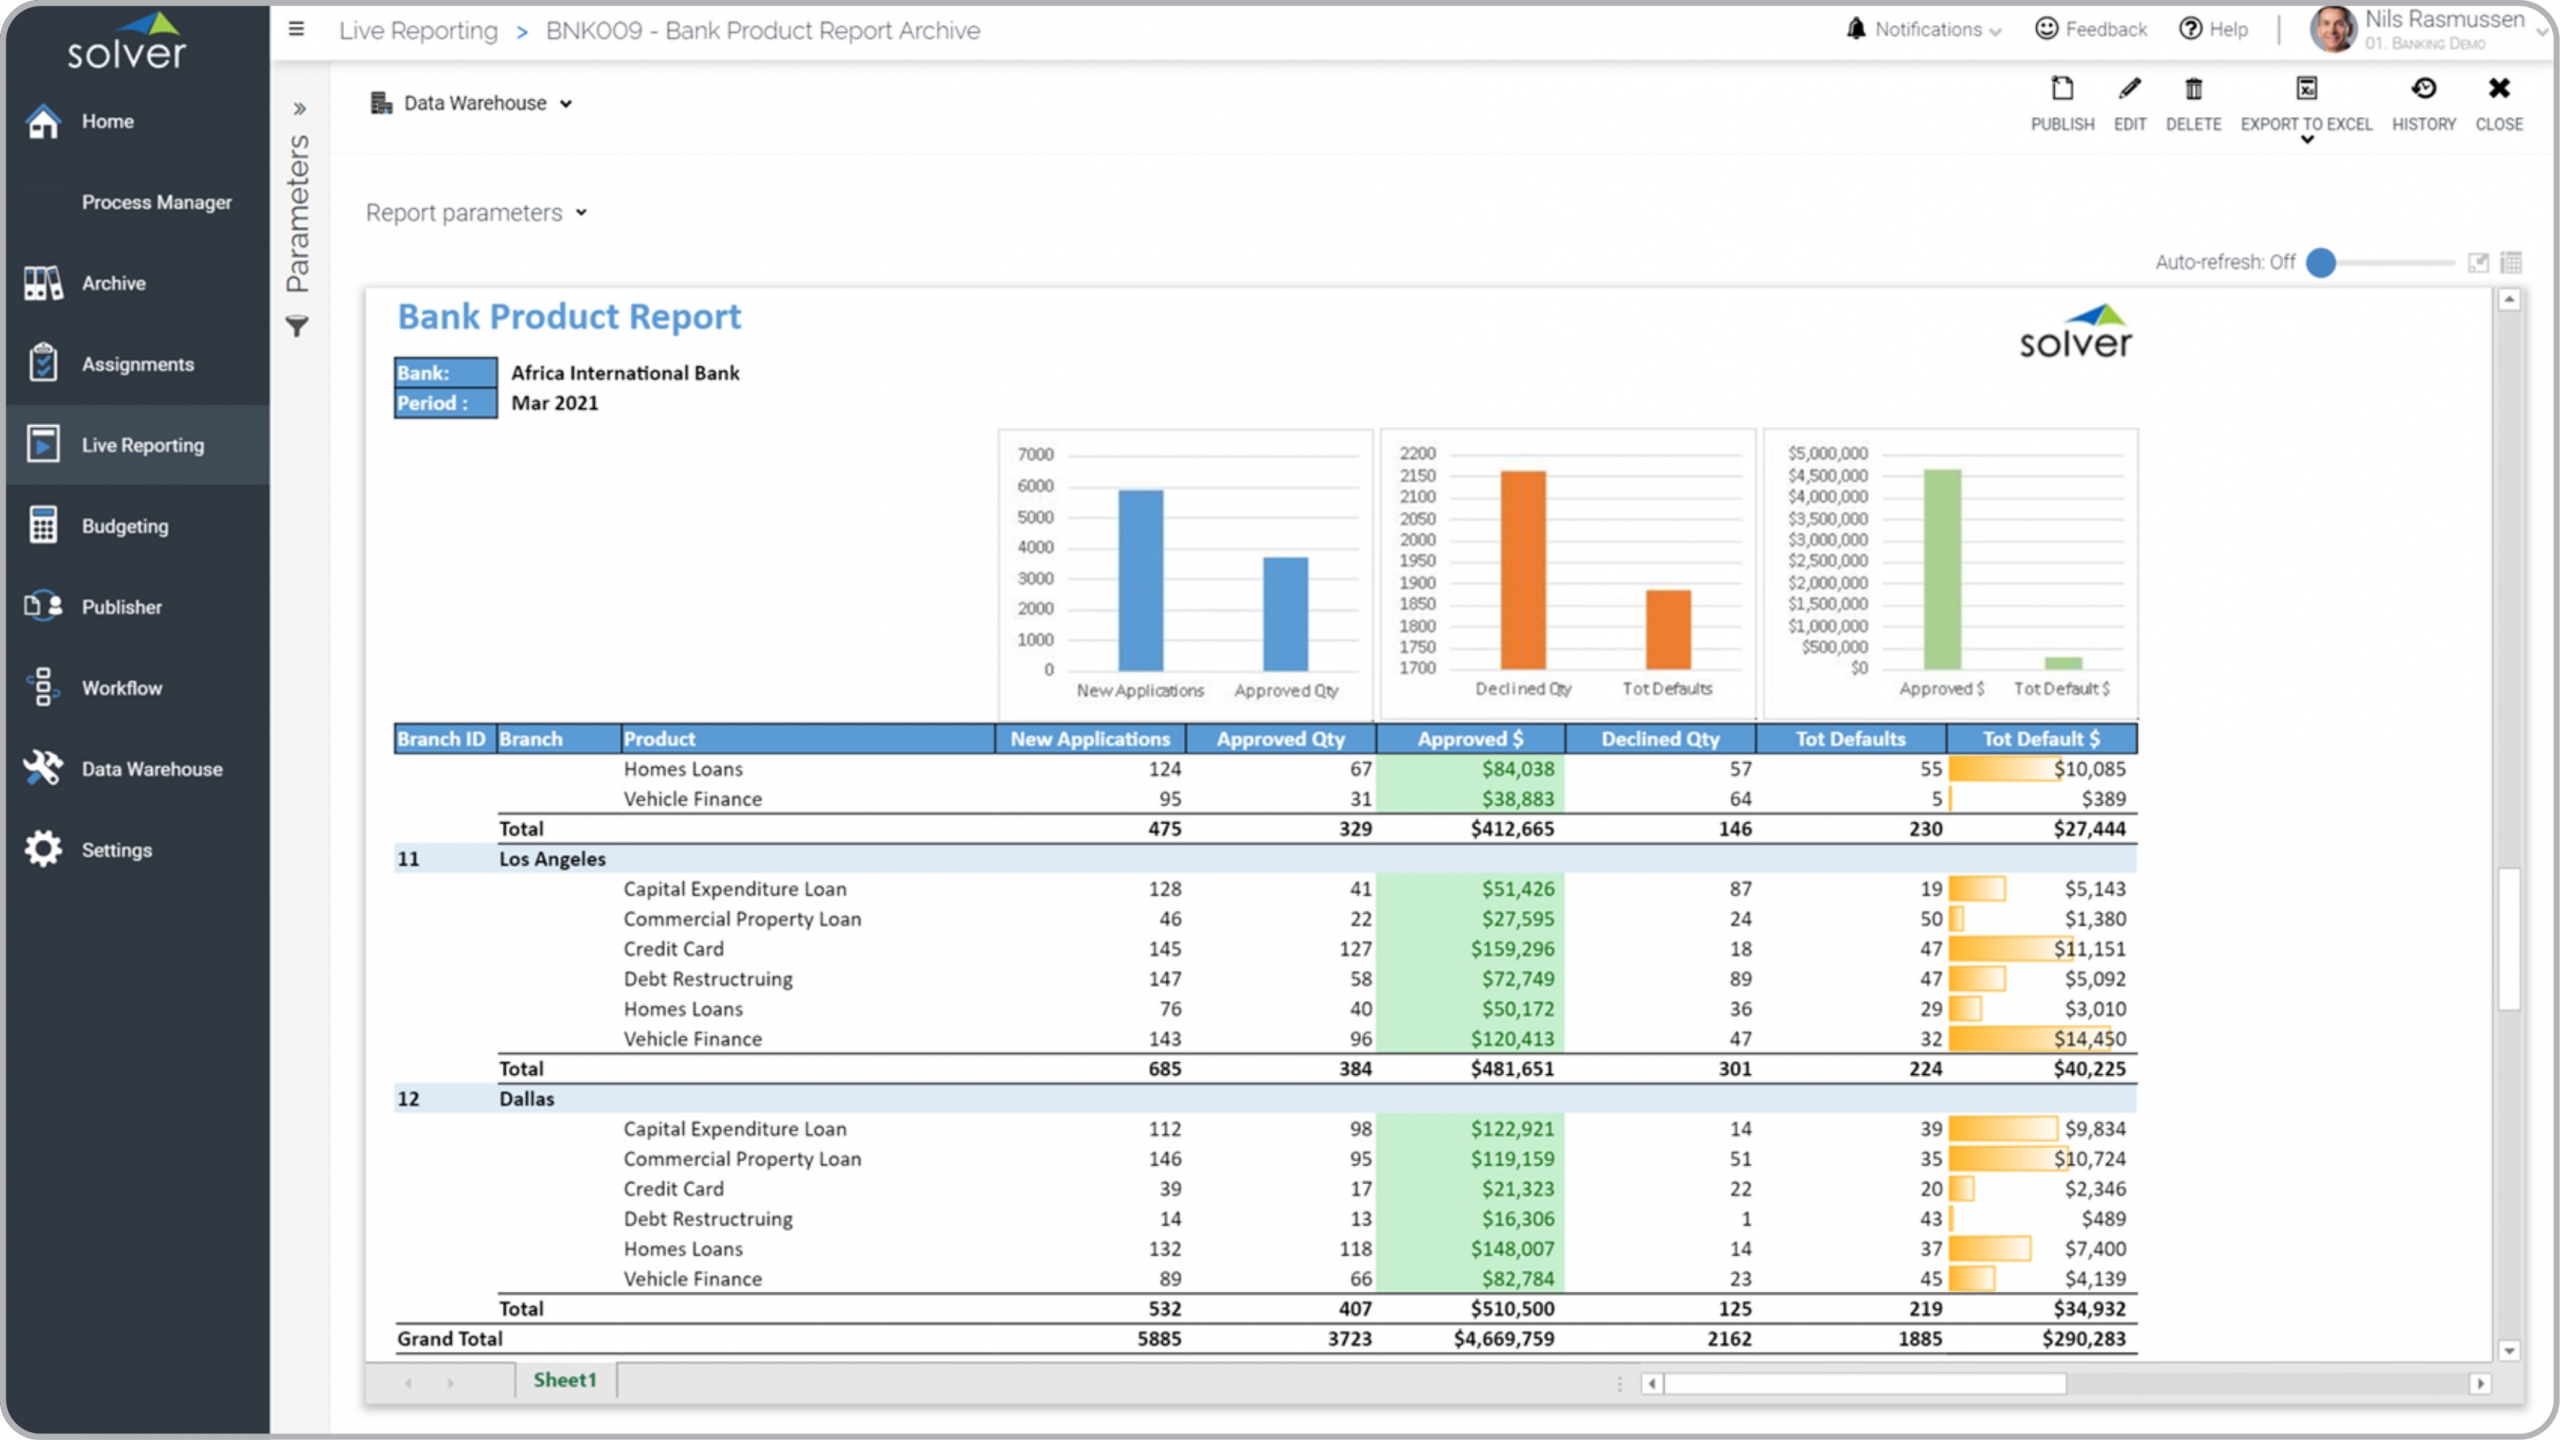
Bank – Product Report
Detailed analysis by branch of new/approved/declined applications for loans, credit cards, etc.
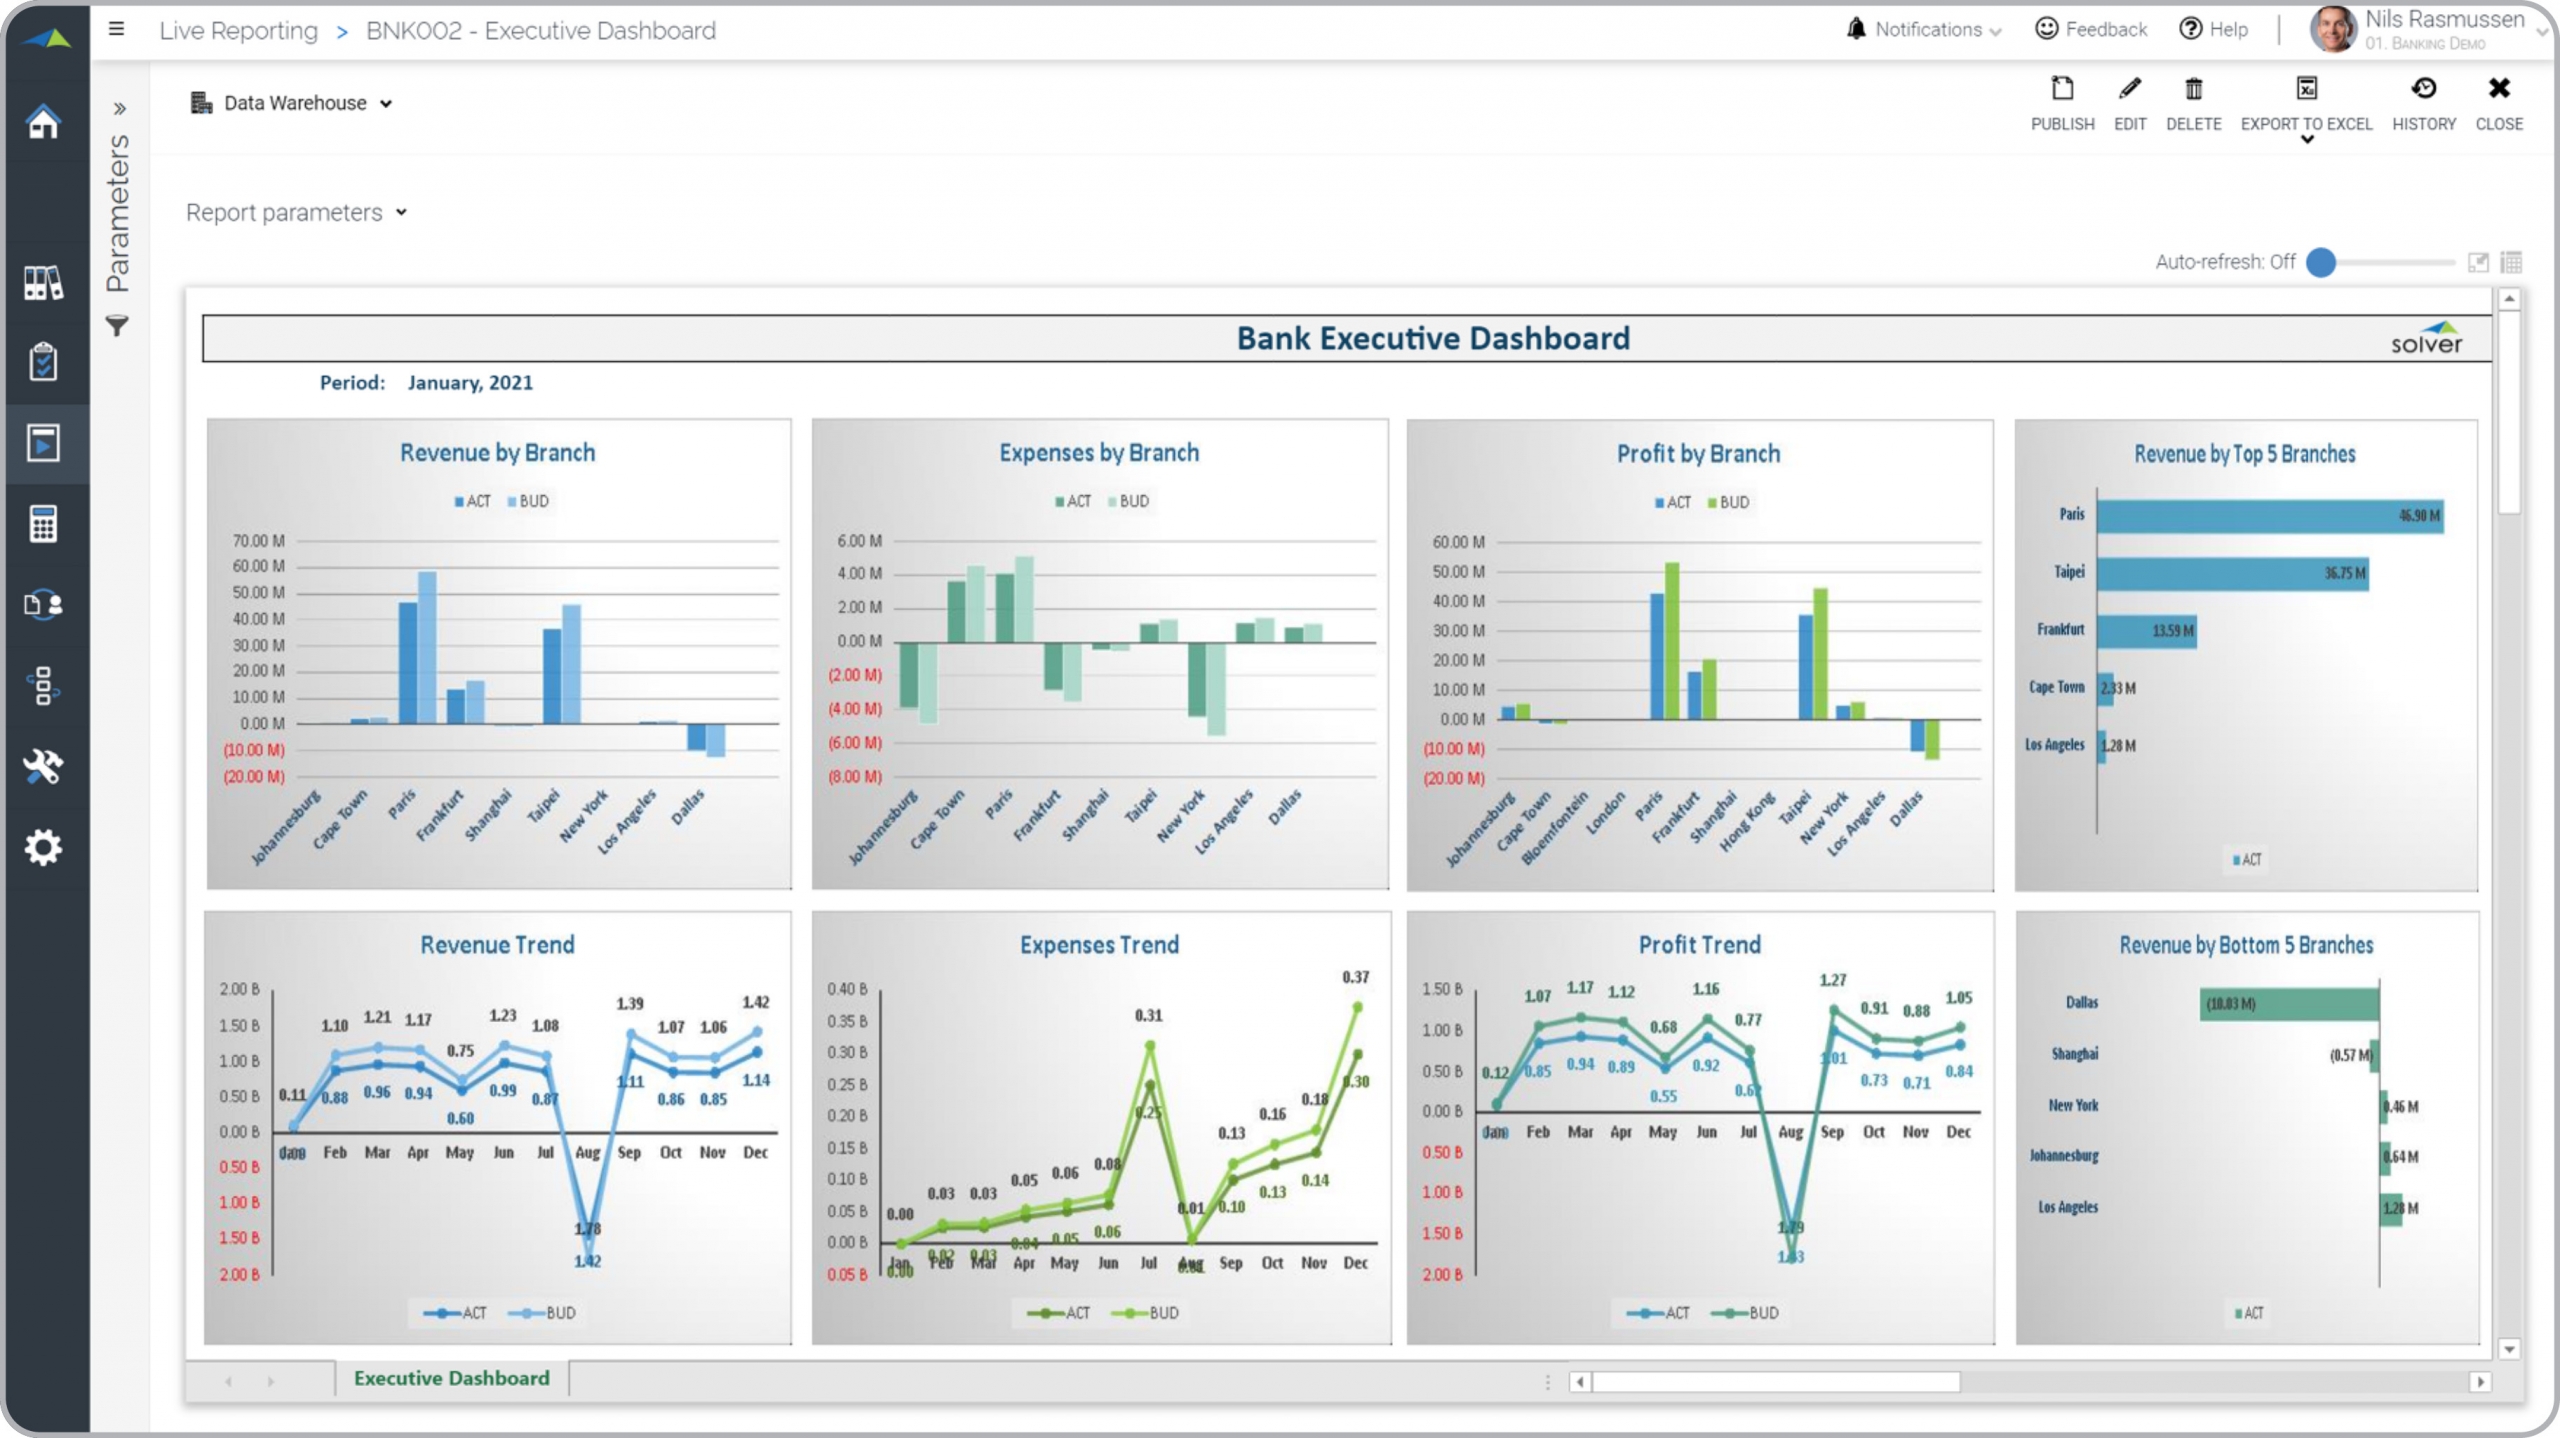
Bank – Executive Dashboard
Essential KPIs for executives with trends and budget variances for revenues, expenses and profit.
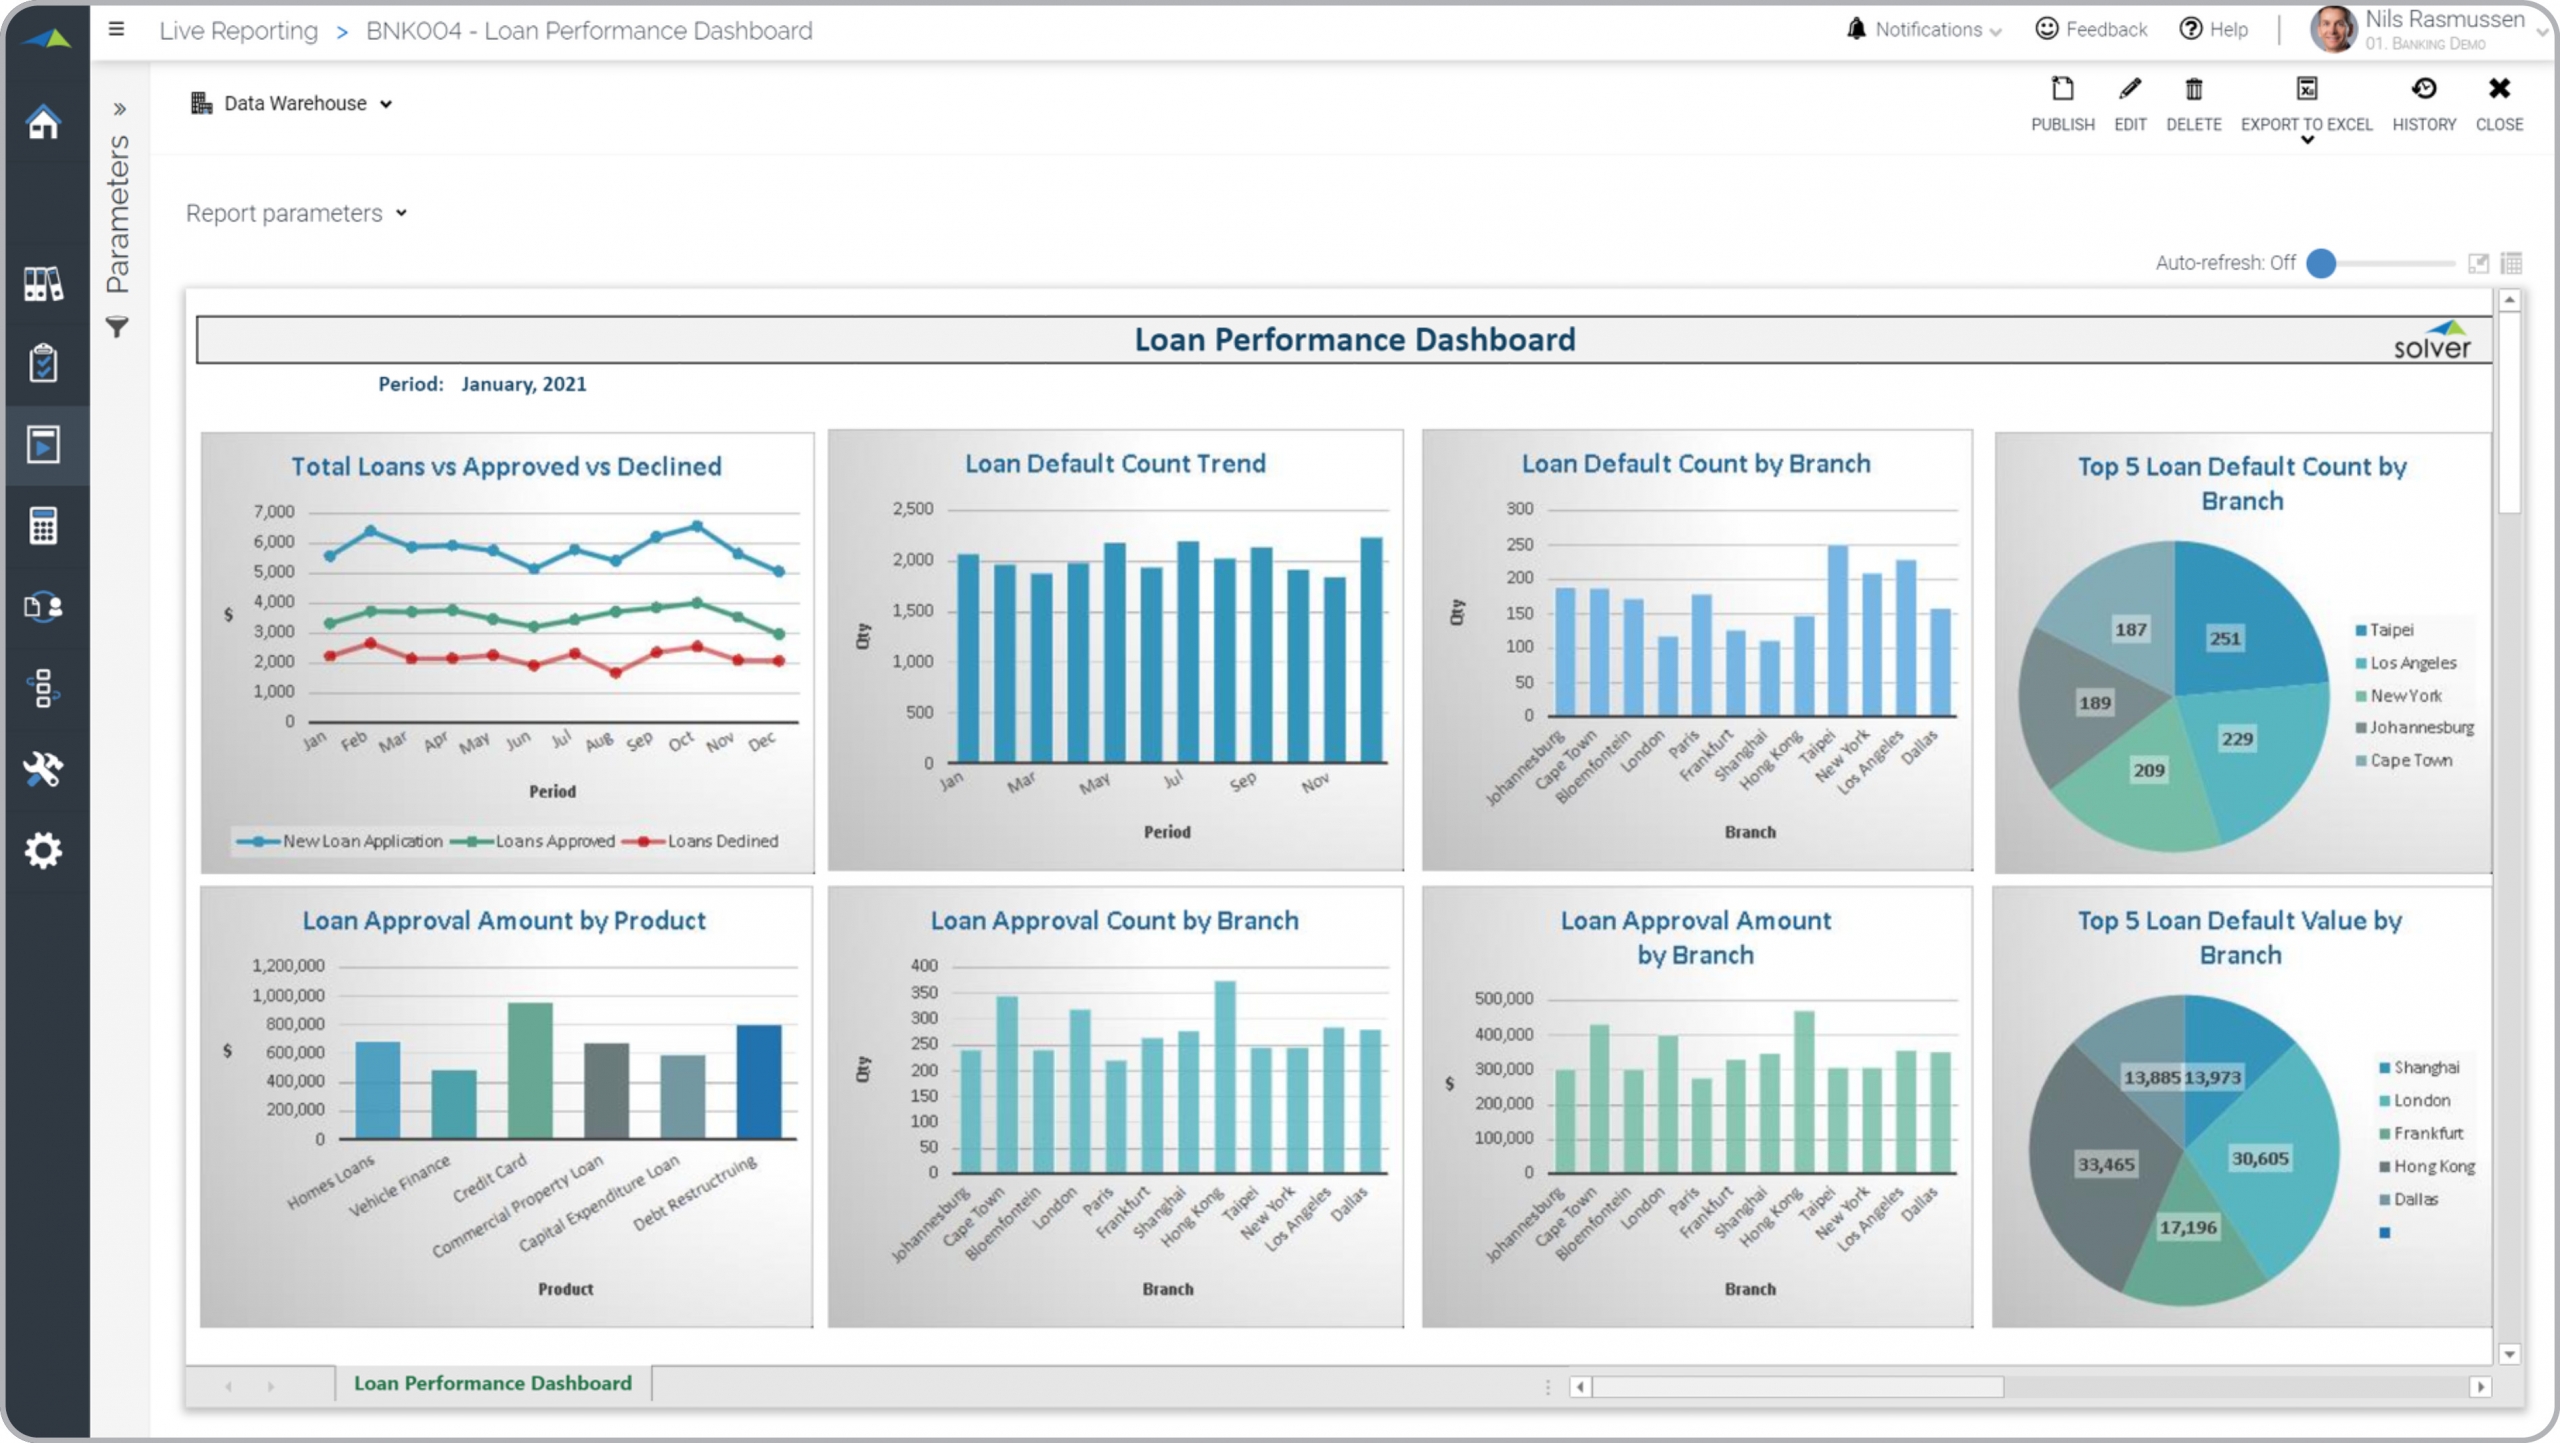
Bank – Loan Performance Dashboard
Loan focused analysis with KPIs for approved/declined loans and defaults.
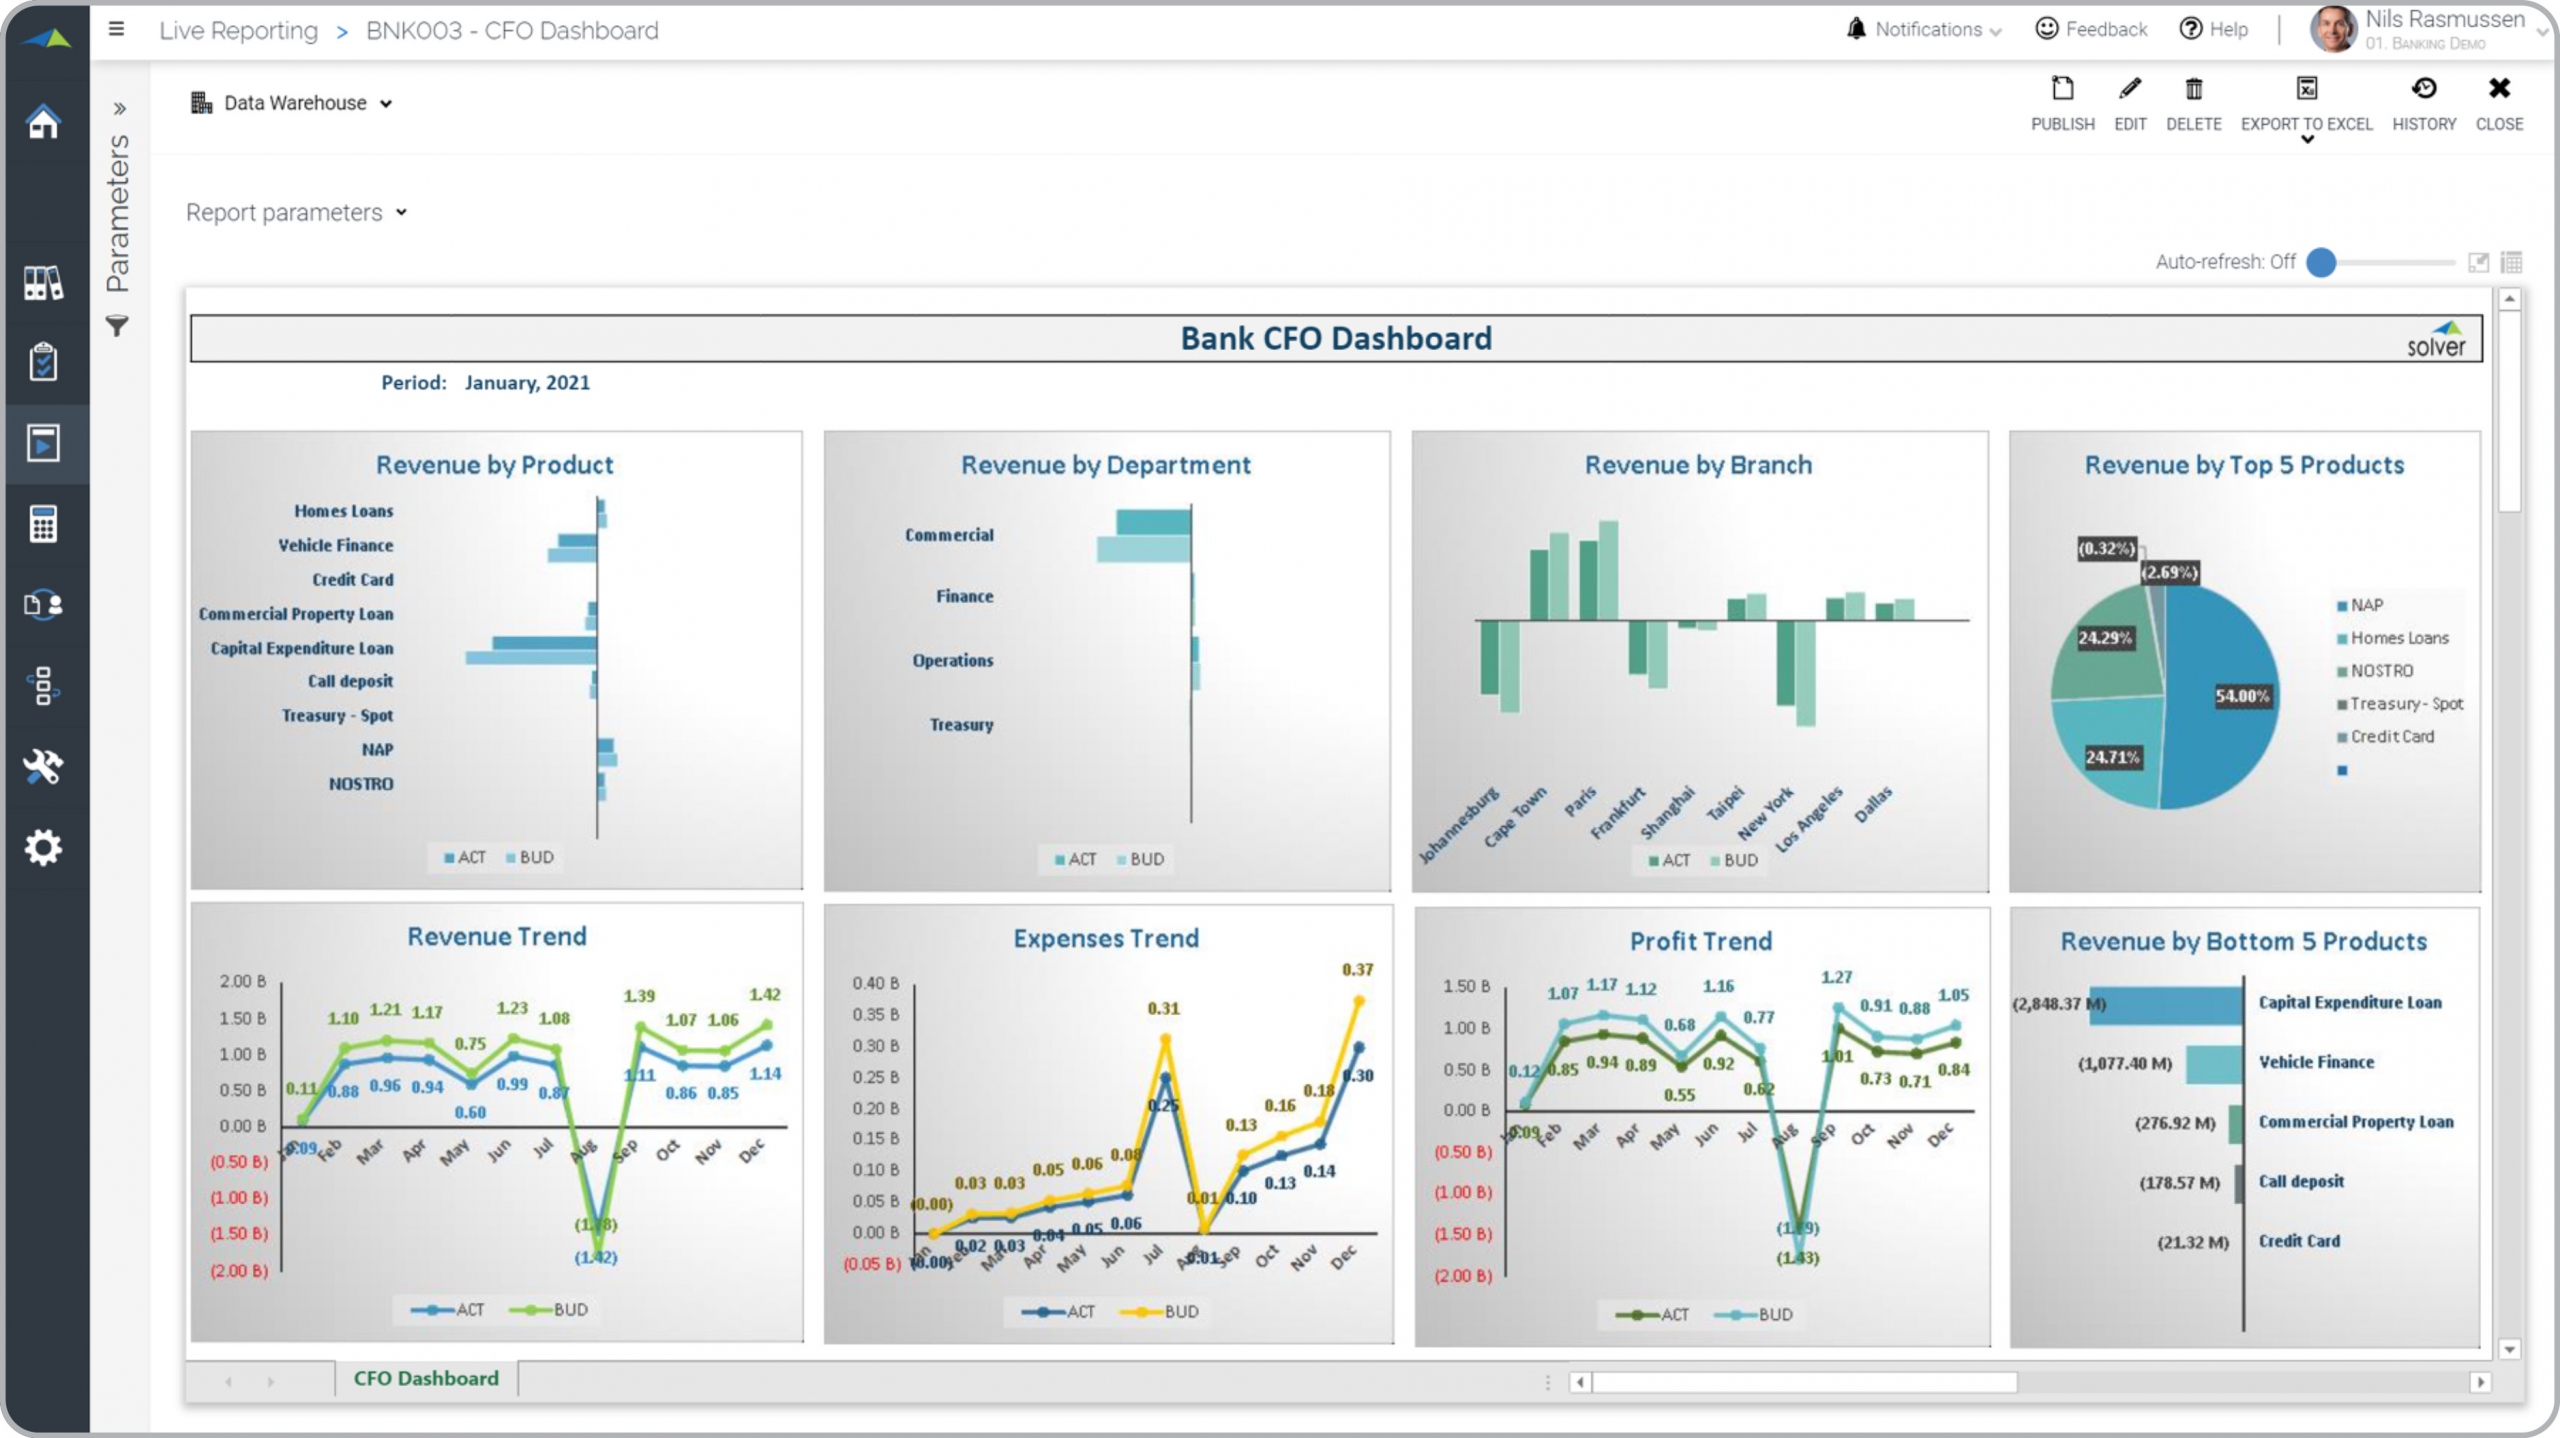
Bank – CFO Dashboard
Actual vs budget analysis of revenue, expenses and profit by branch, product and department.
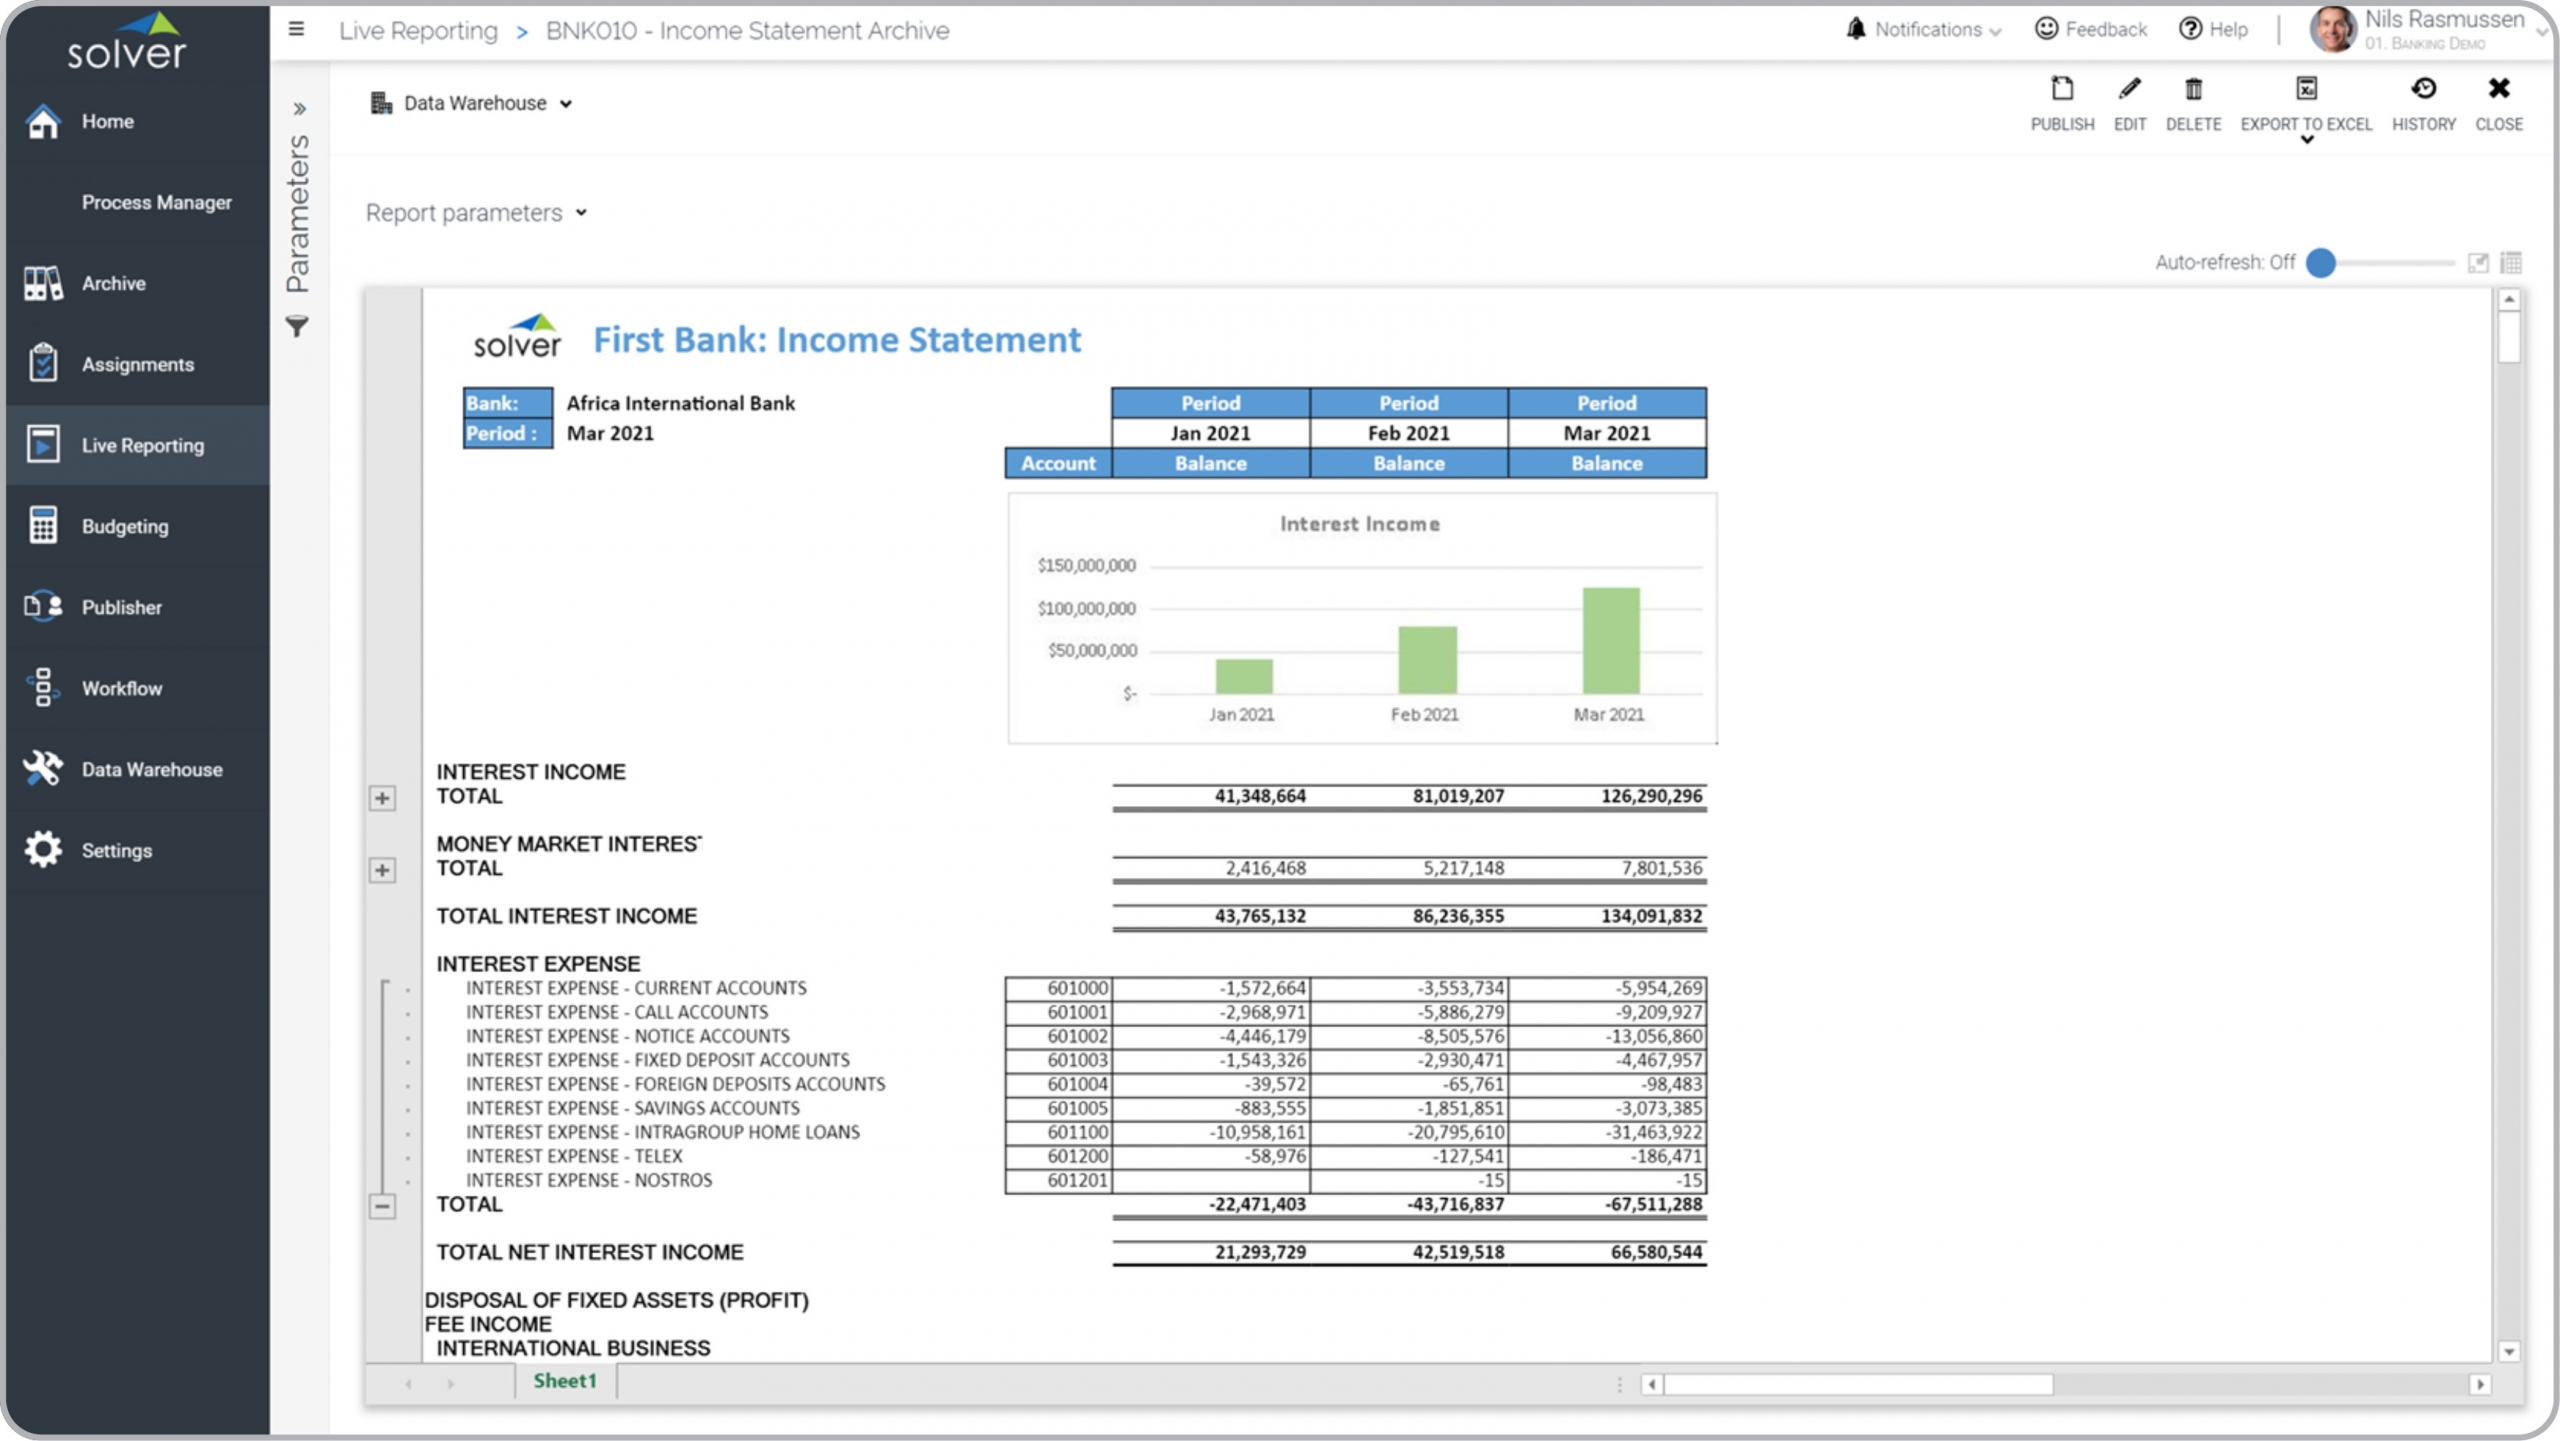
Bank – Income Statement – Monthly Trend
Income statement that dynamically displays periods up to the current month.
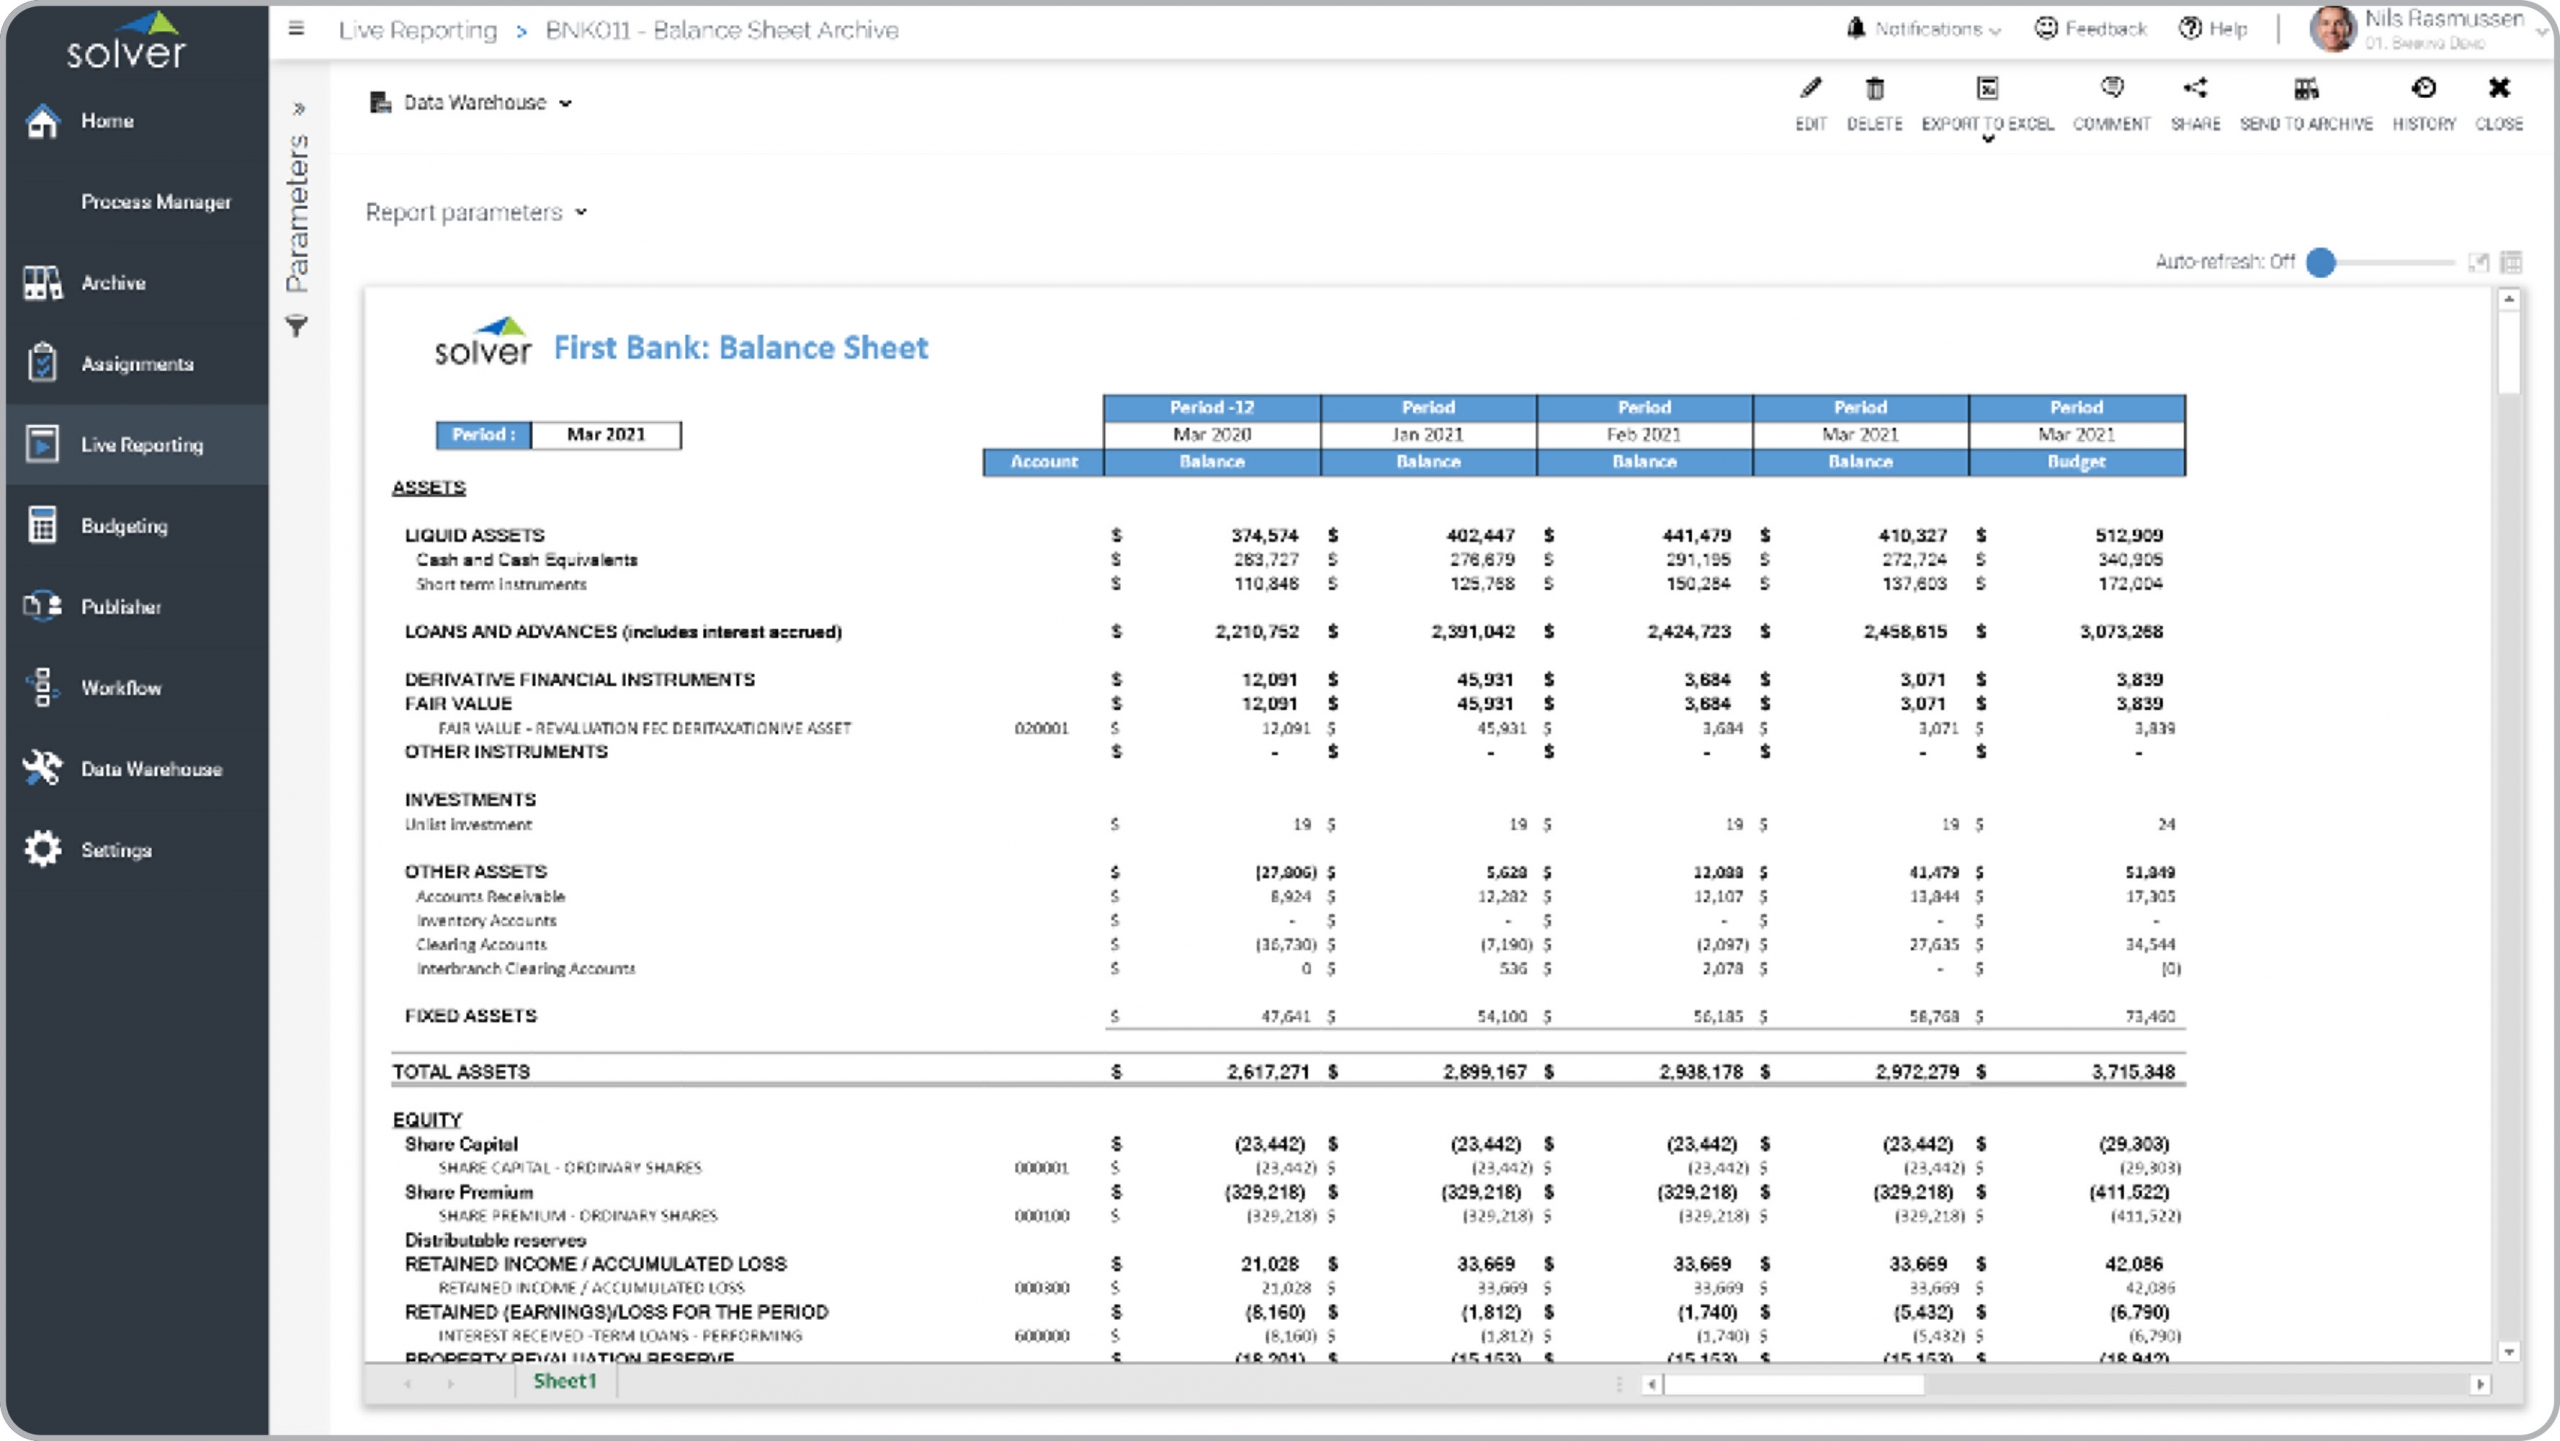
Bank – Balance Sheet – Monthly Trend
Balance sheet that dynamically displays periods up to the current month.
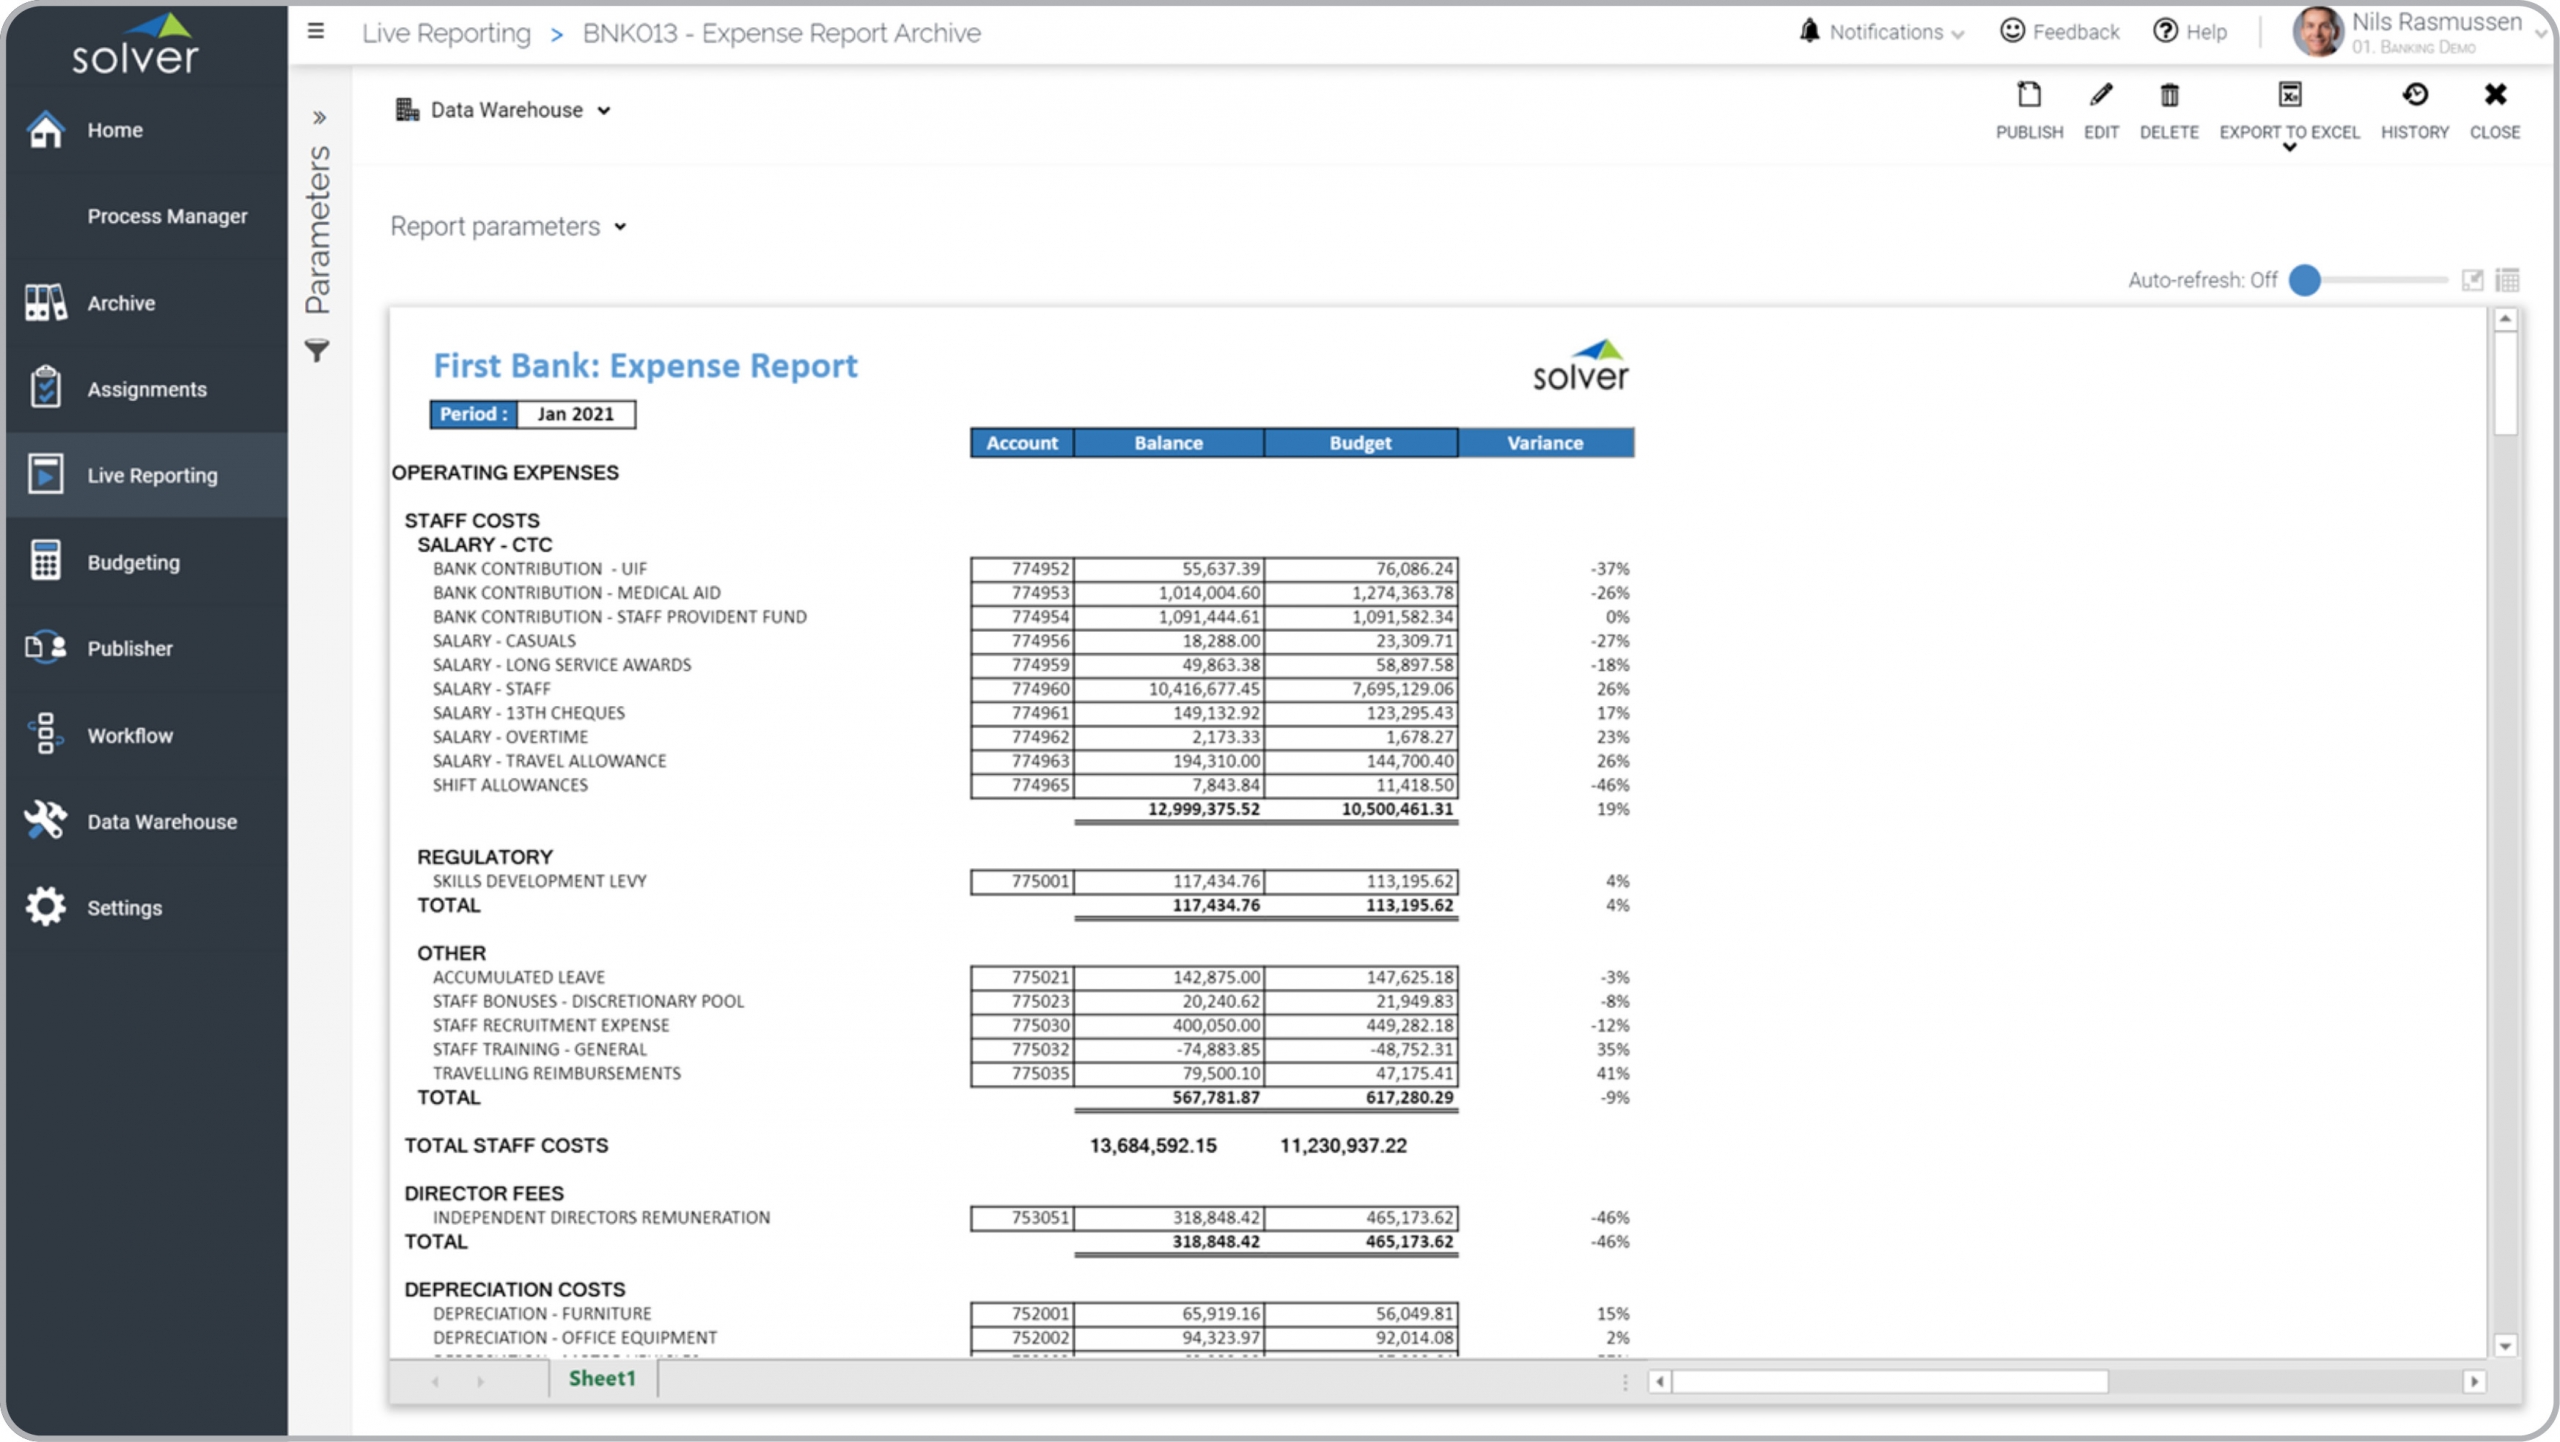
Bank – Expense Report
Analysis of operating expenses with actual vs budget variance by GL account.
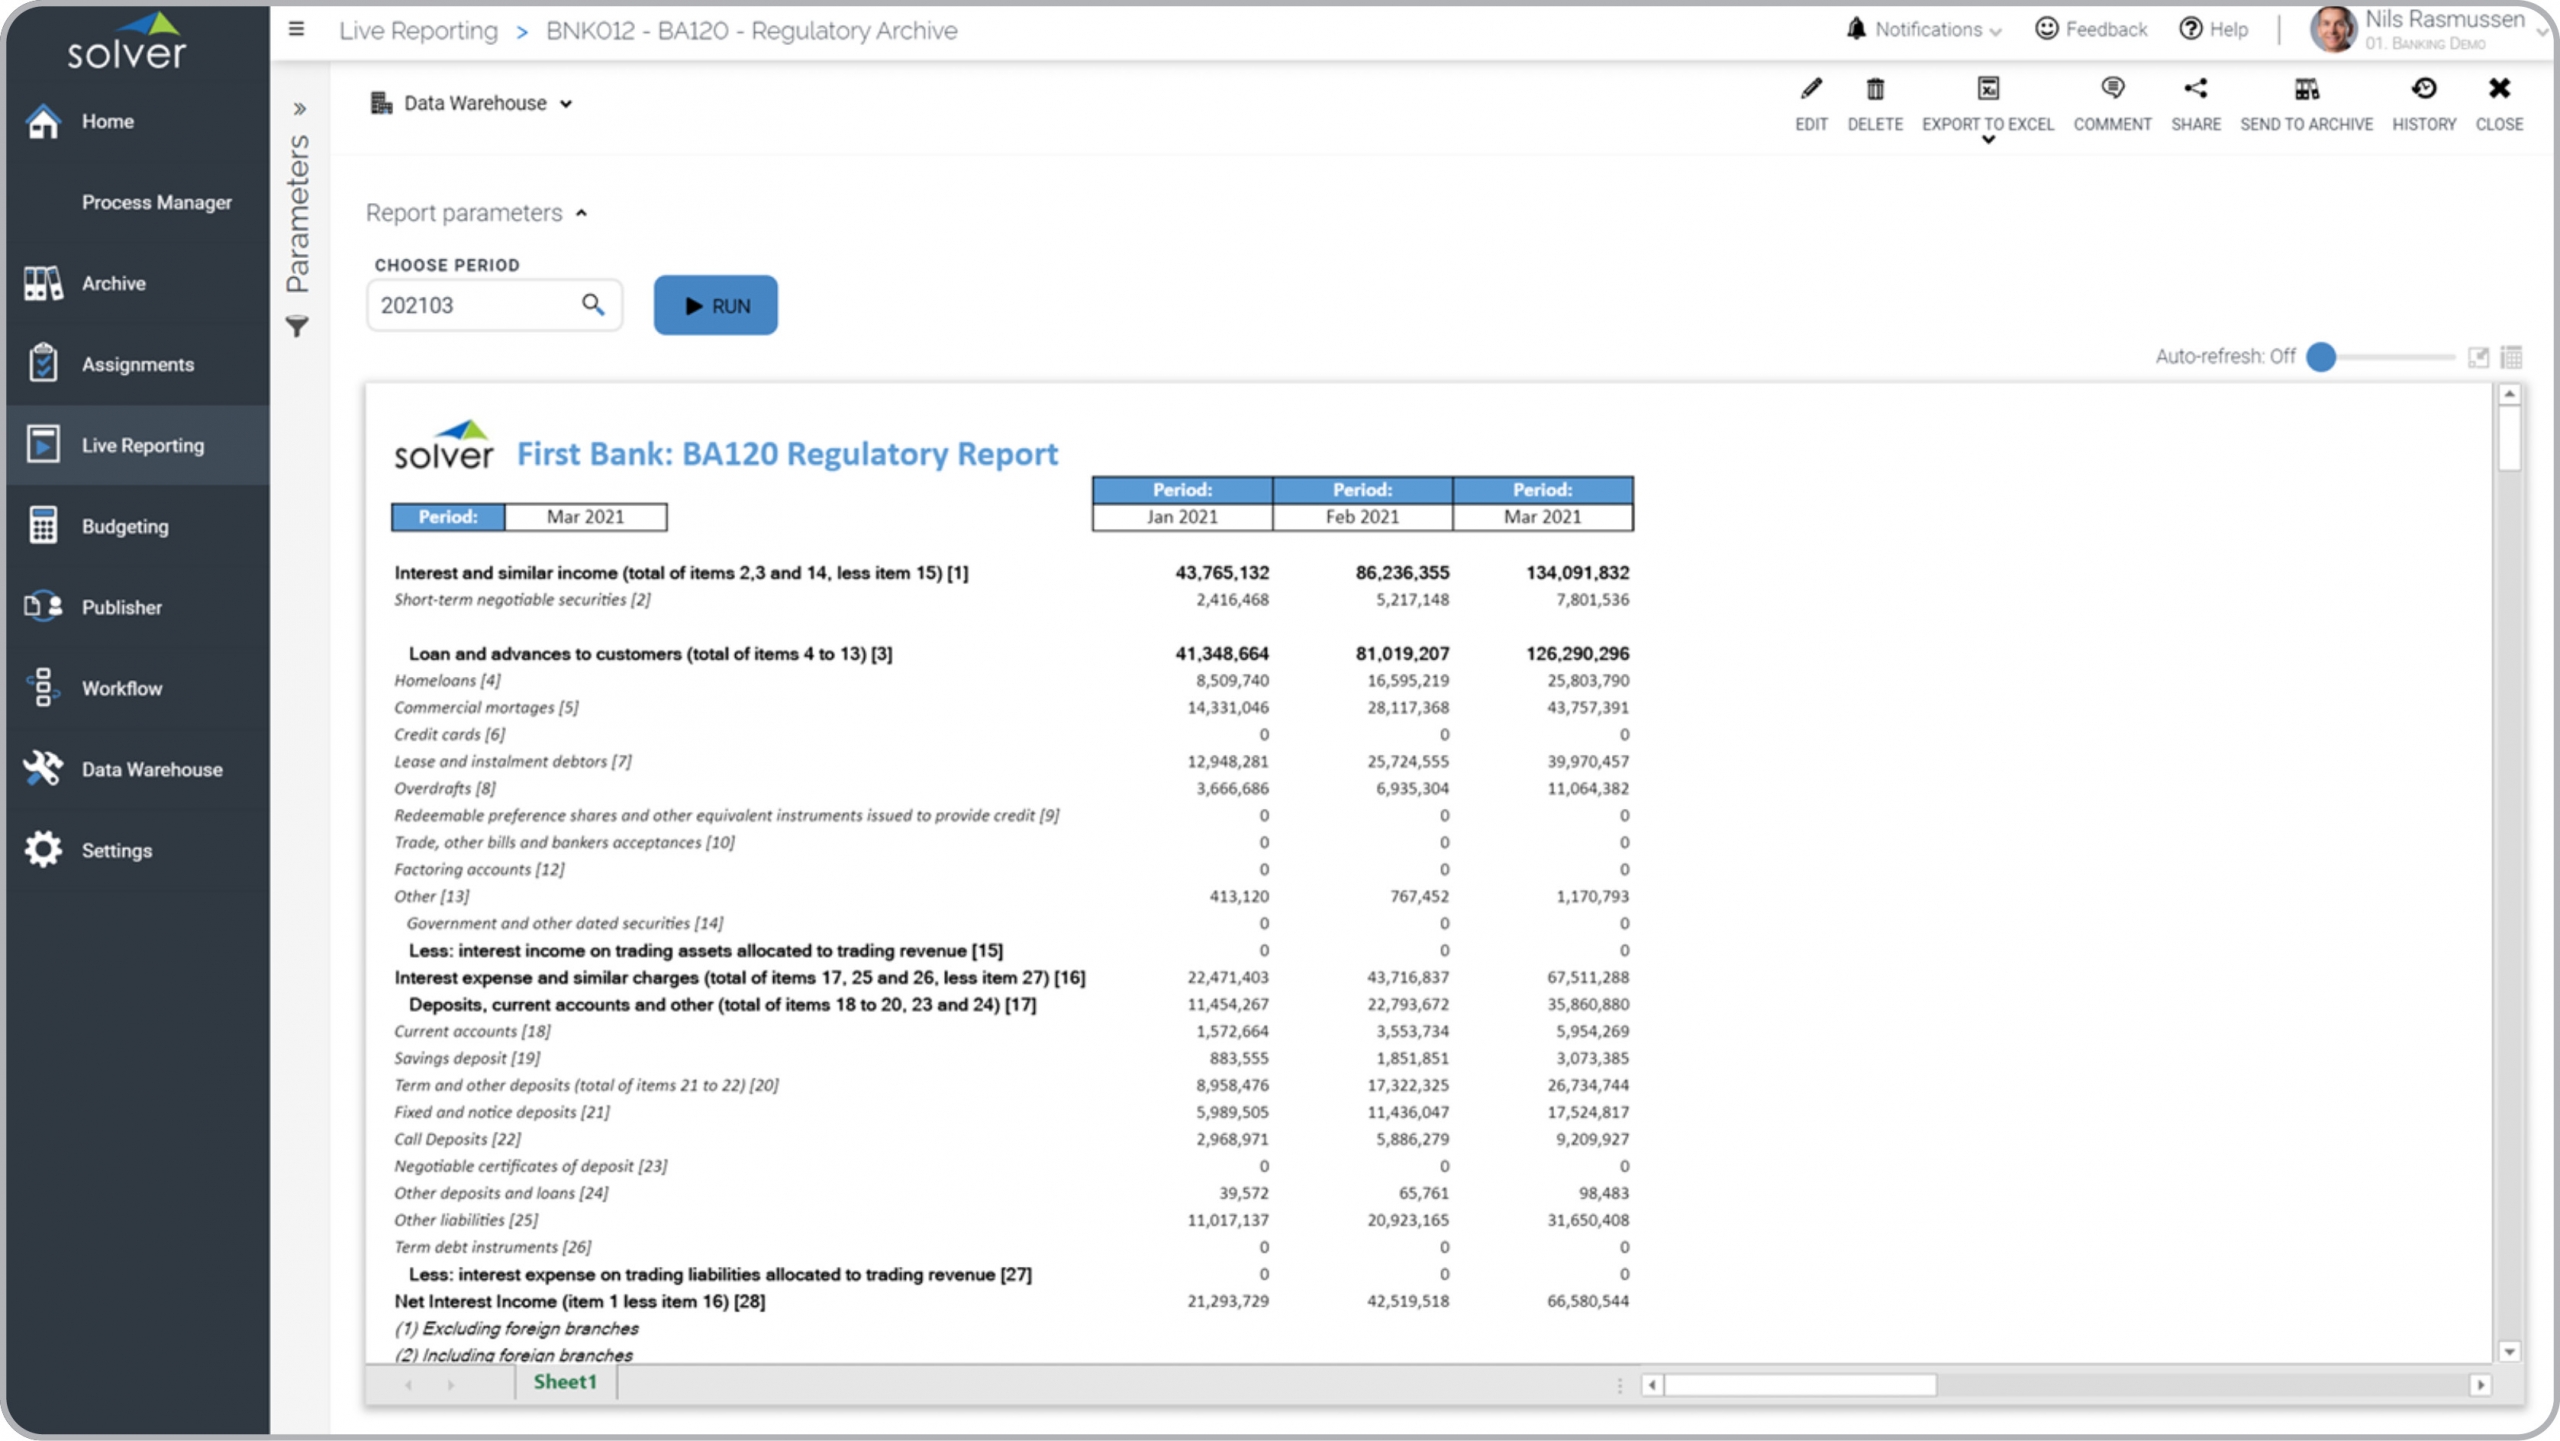
Bank – Regulatory Report
Example of a regulatory bank report (BA120).
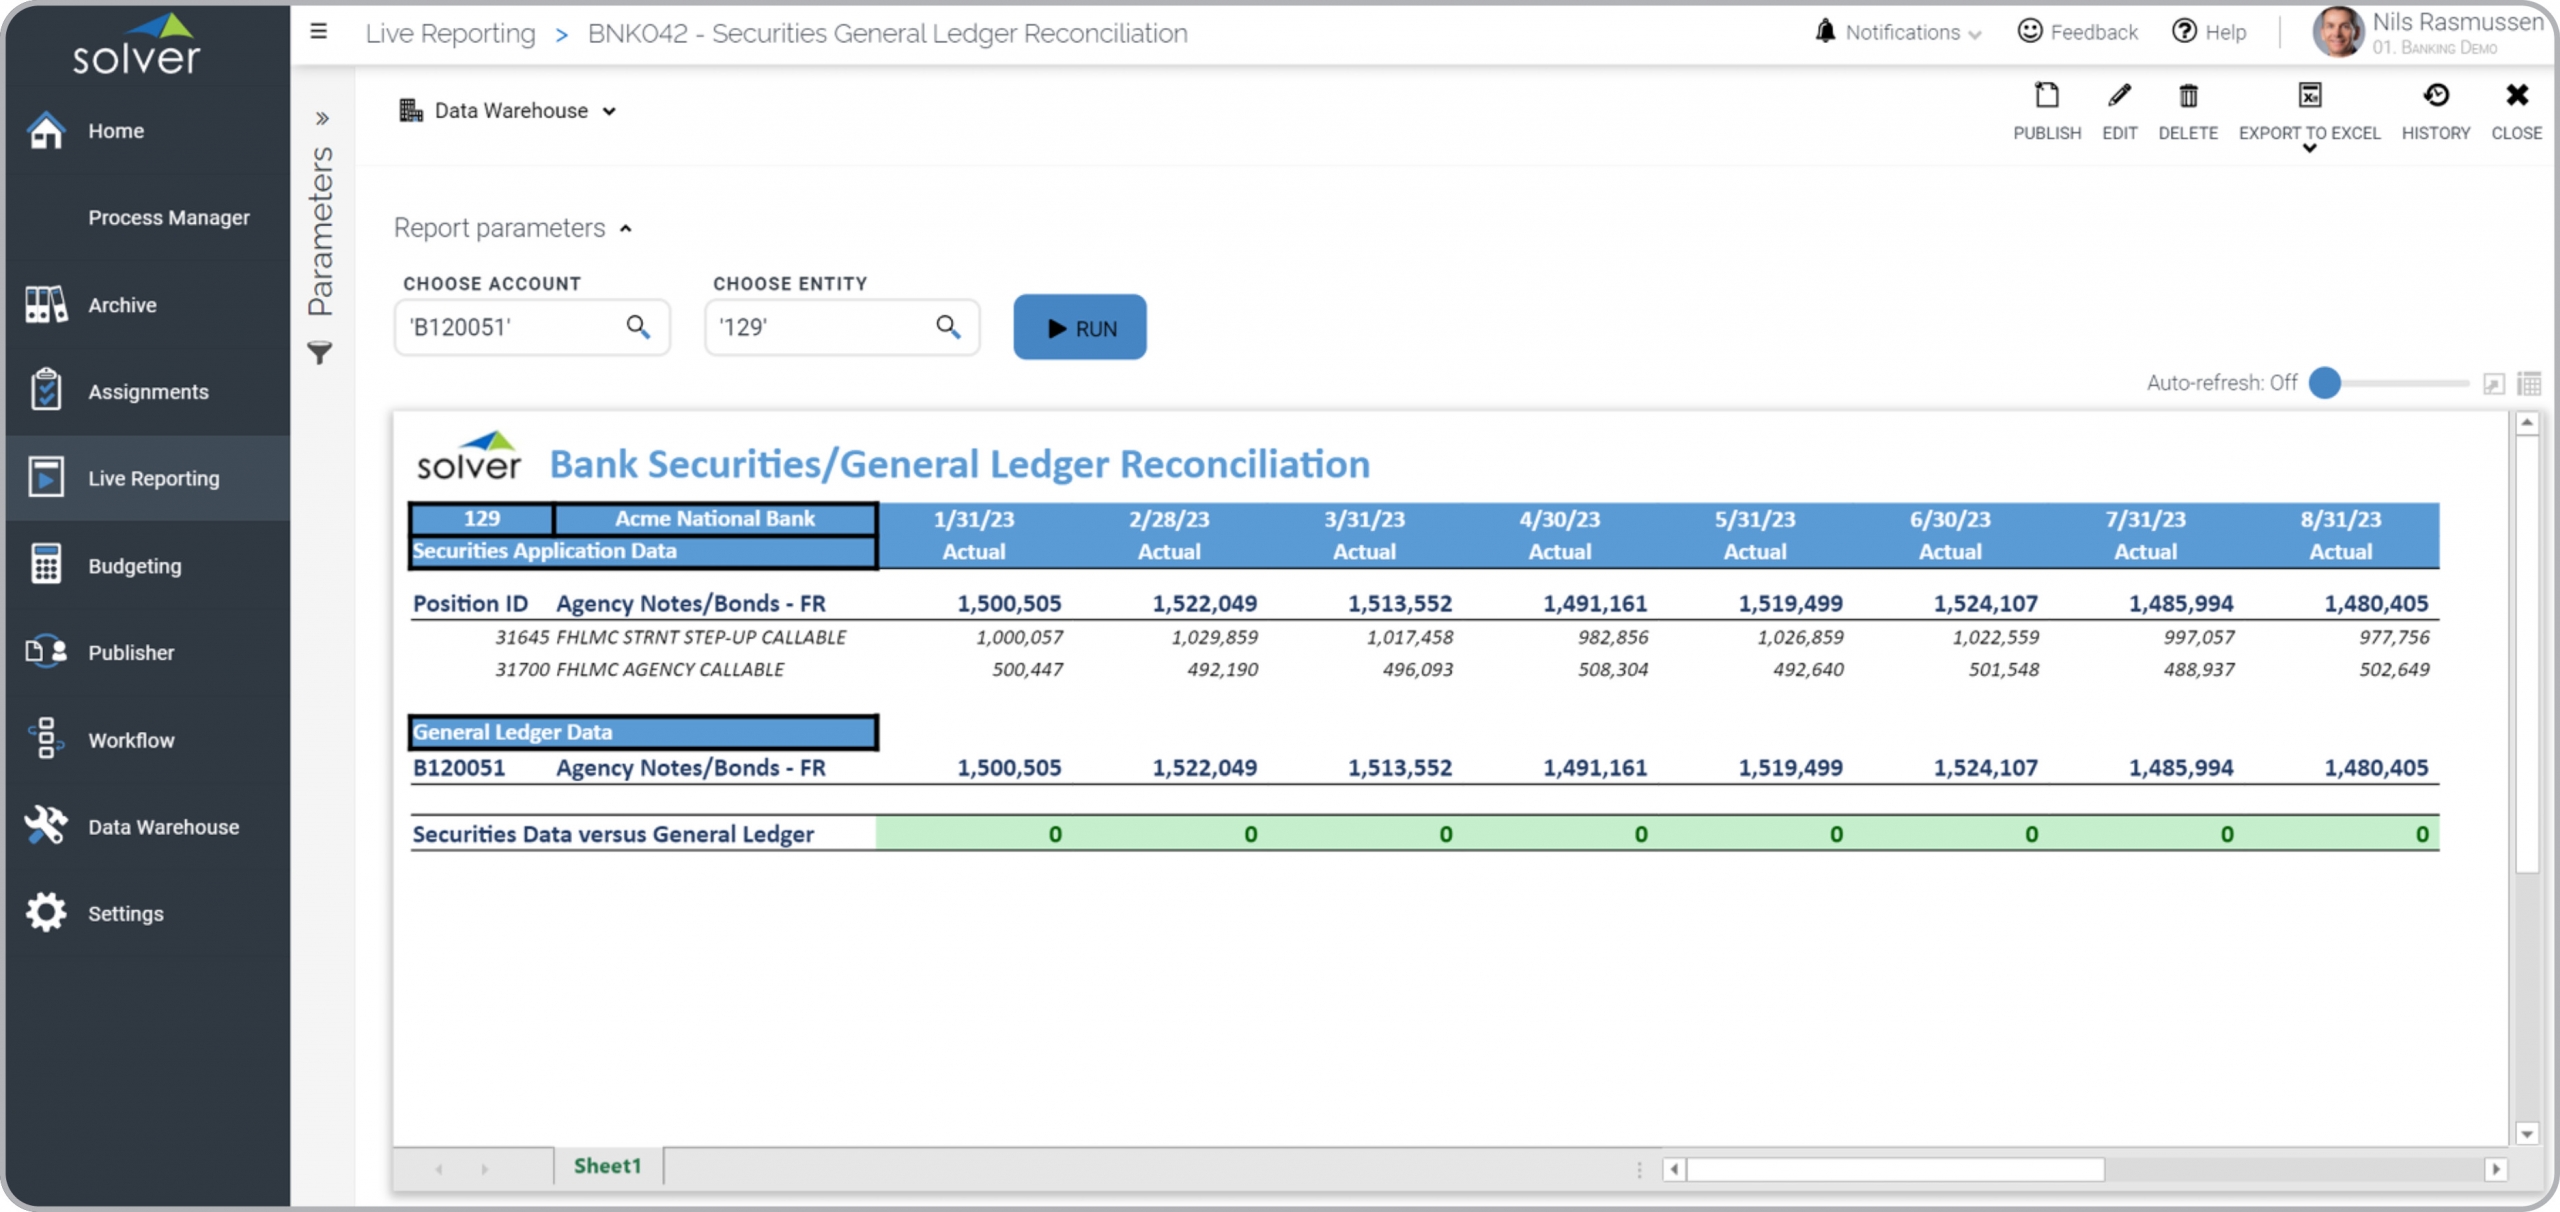
Bank – Securities/General Ledger Reconciliation
This report automatically reconciles securities with the related GL account.
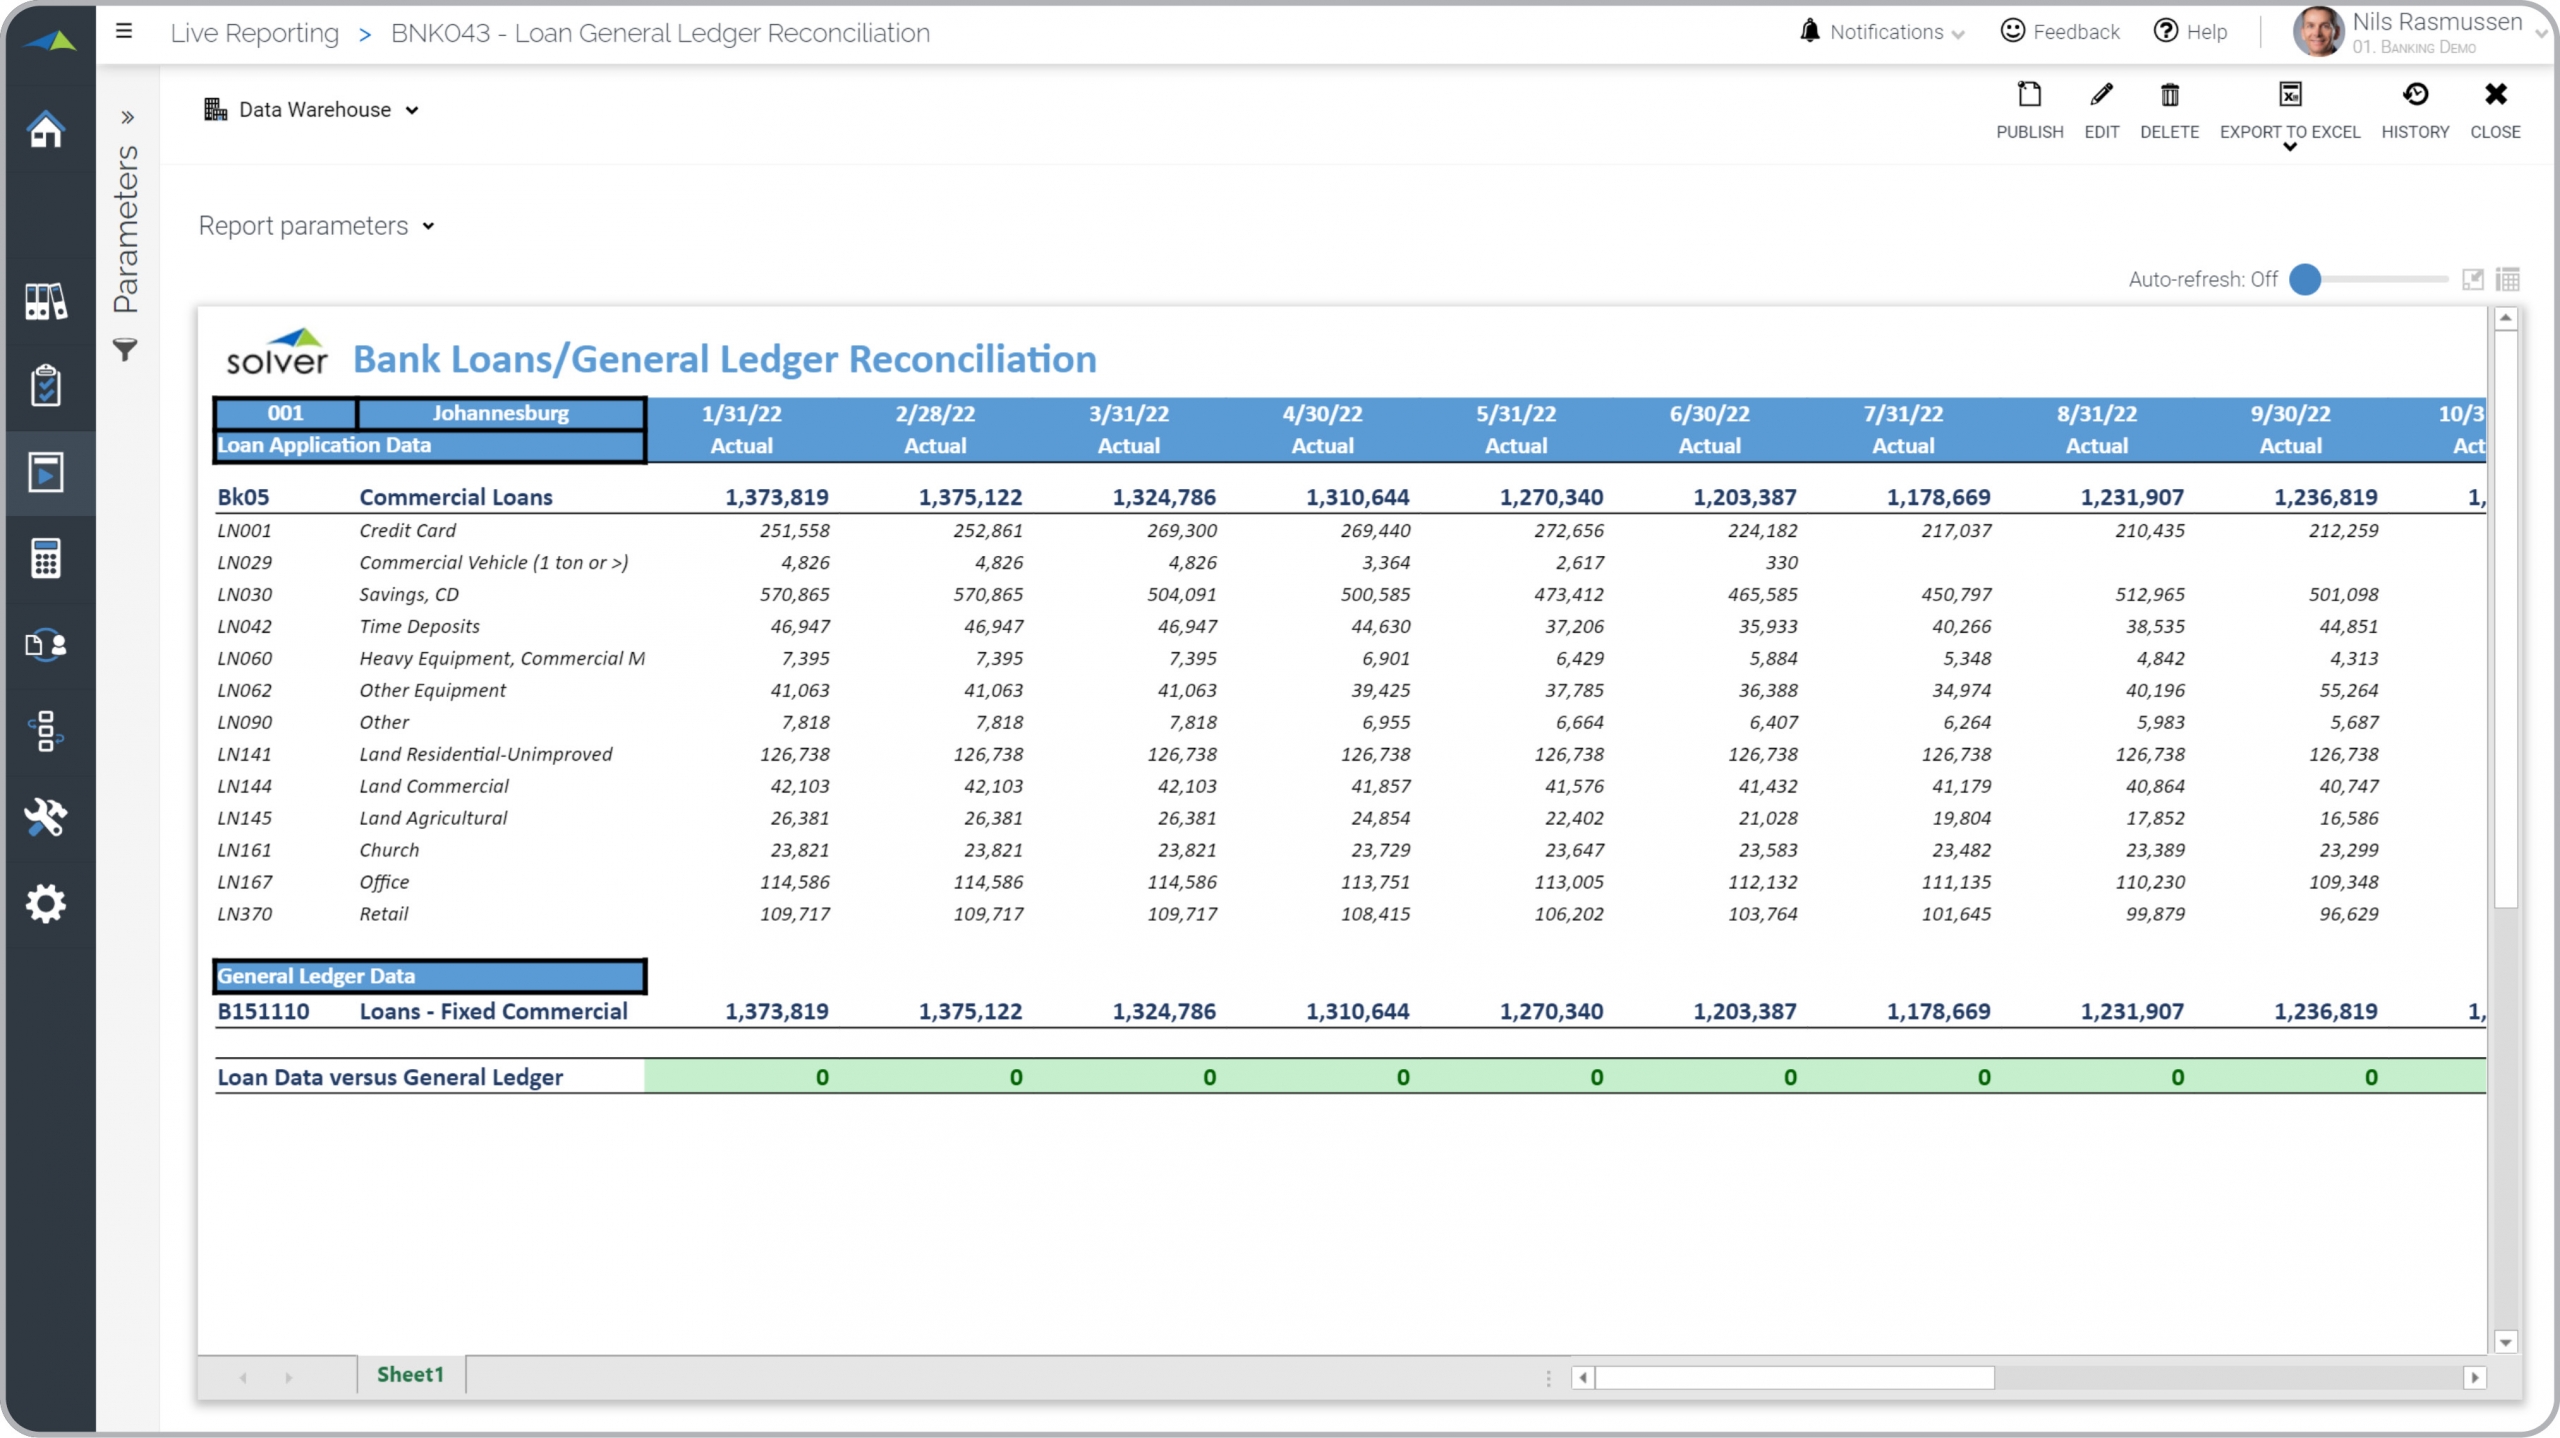
Bank – Loans/General Ledger Reconciliation
This report automatically reconciles loans with the related GL account.
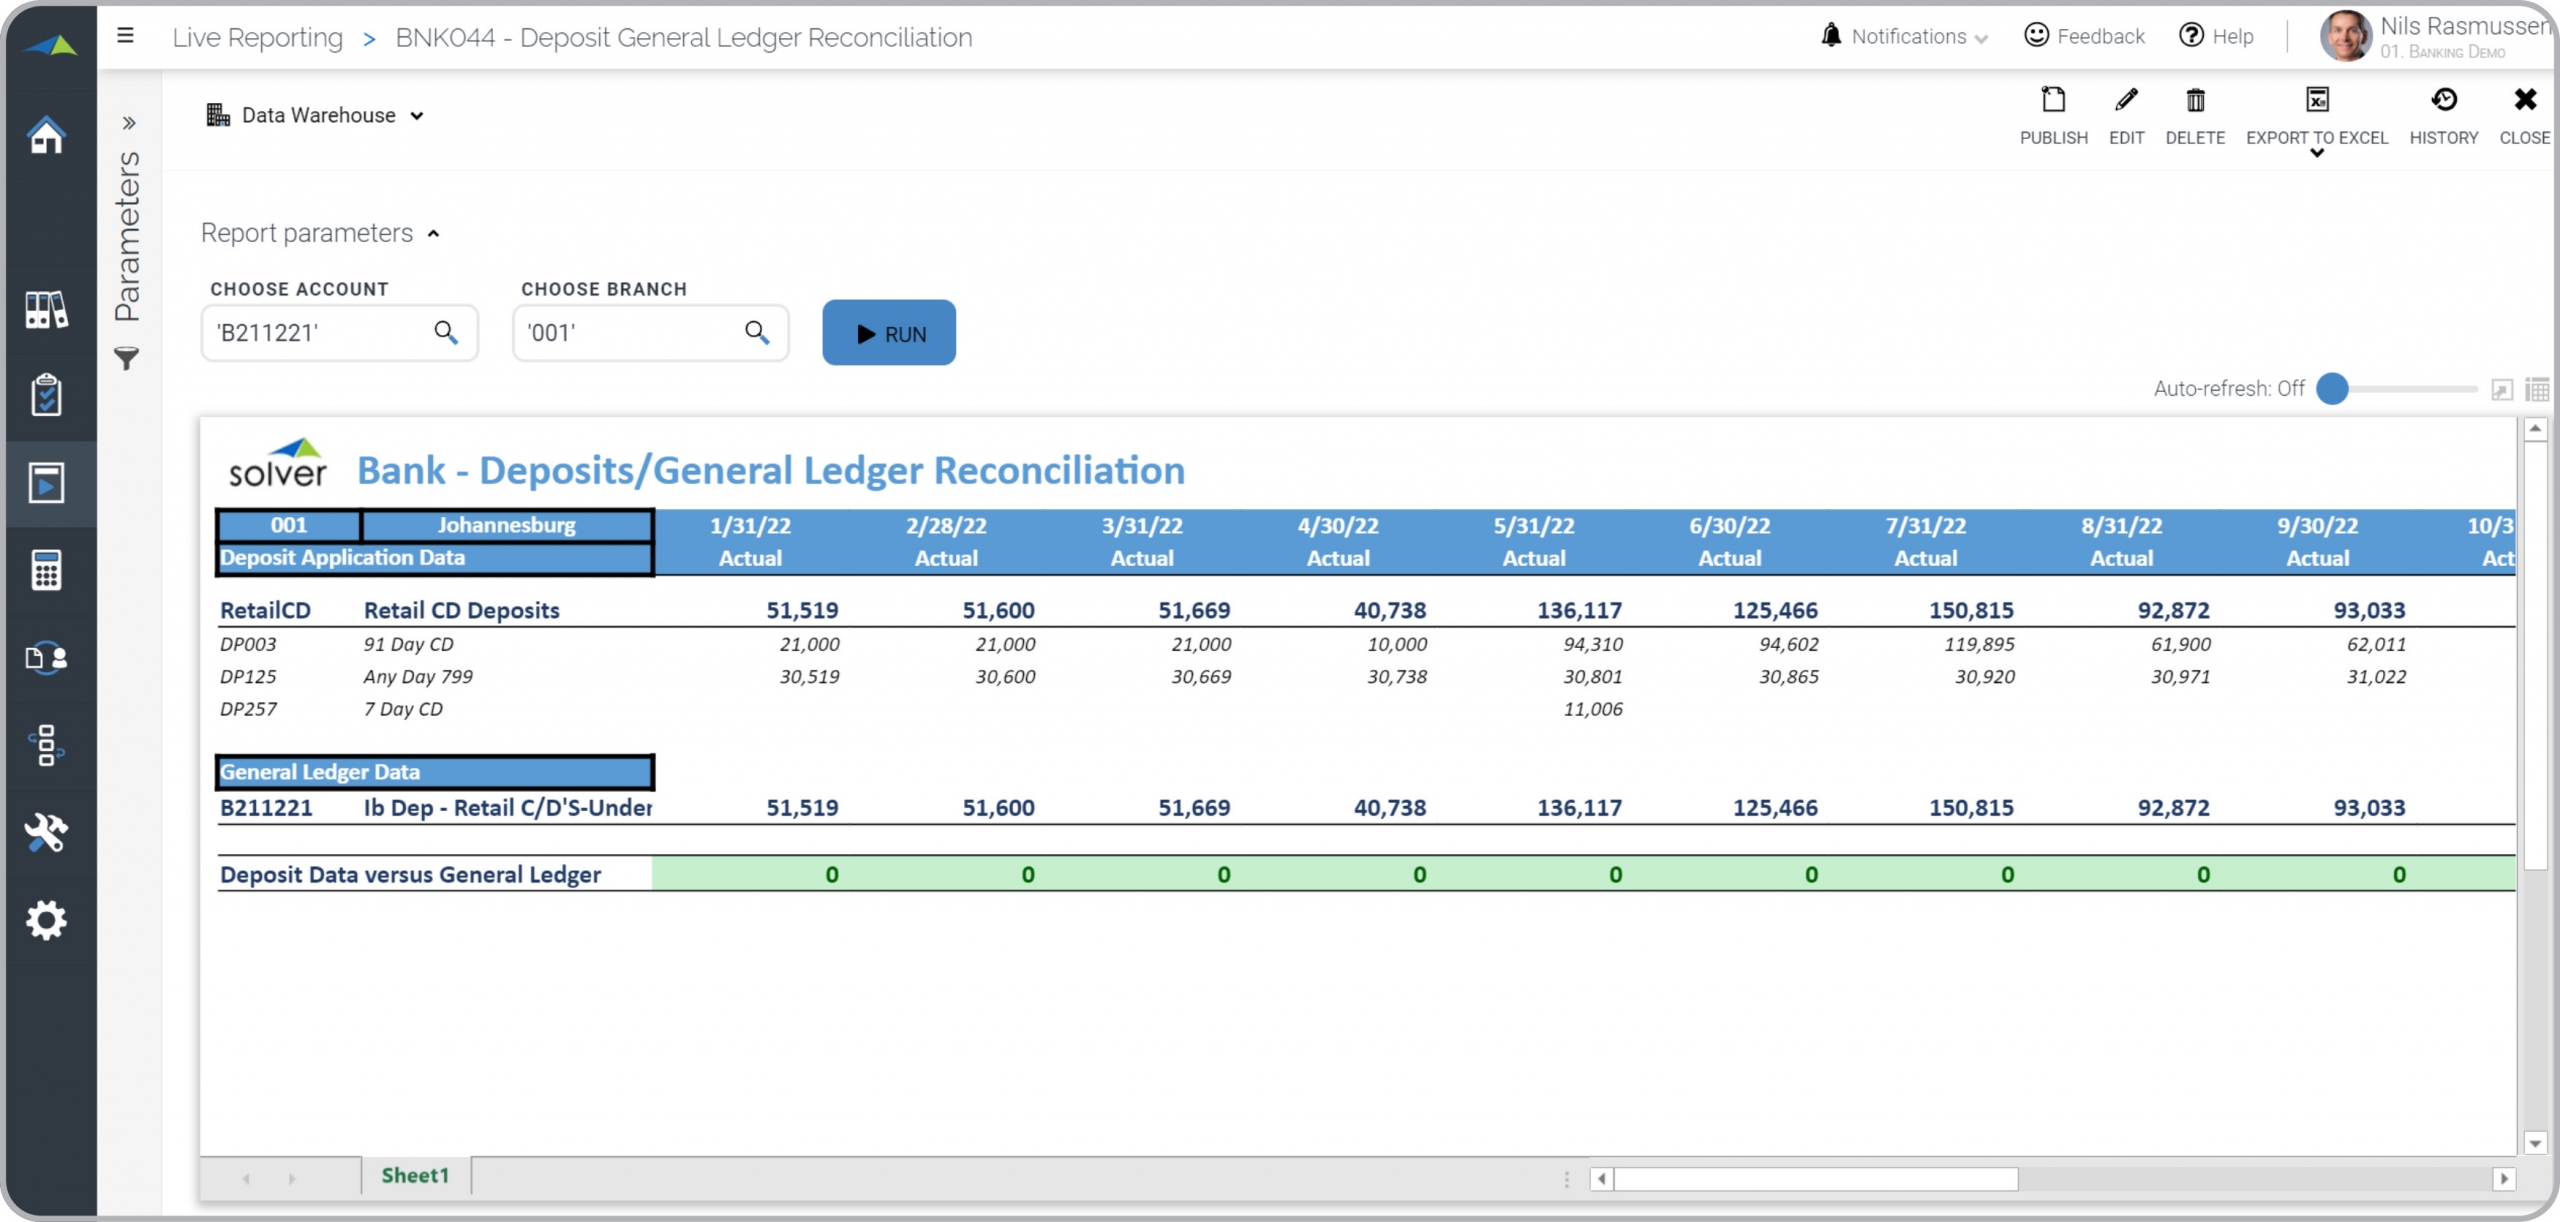
Bank – Deposits/General Ledger Reconciliation
This report automatically reconciles deposits with the related GL account.
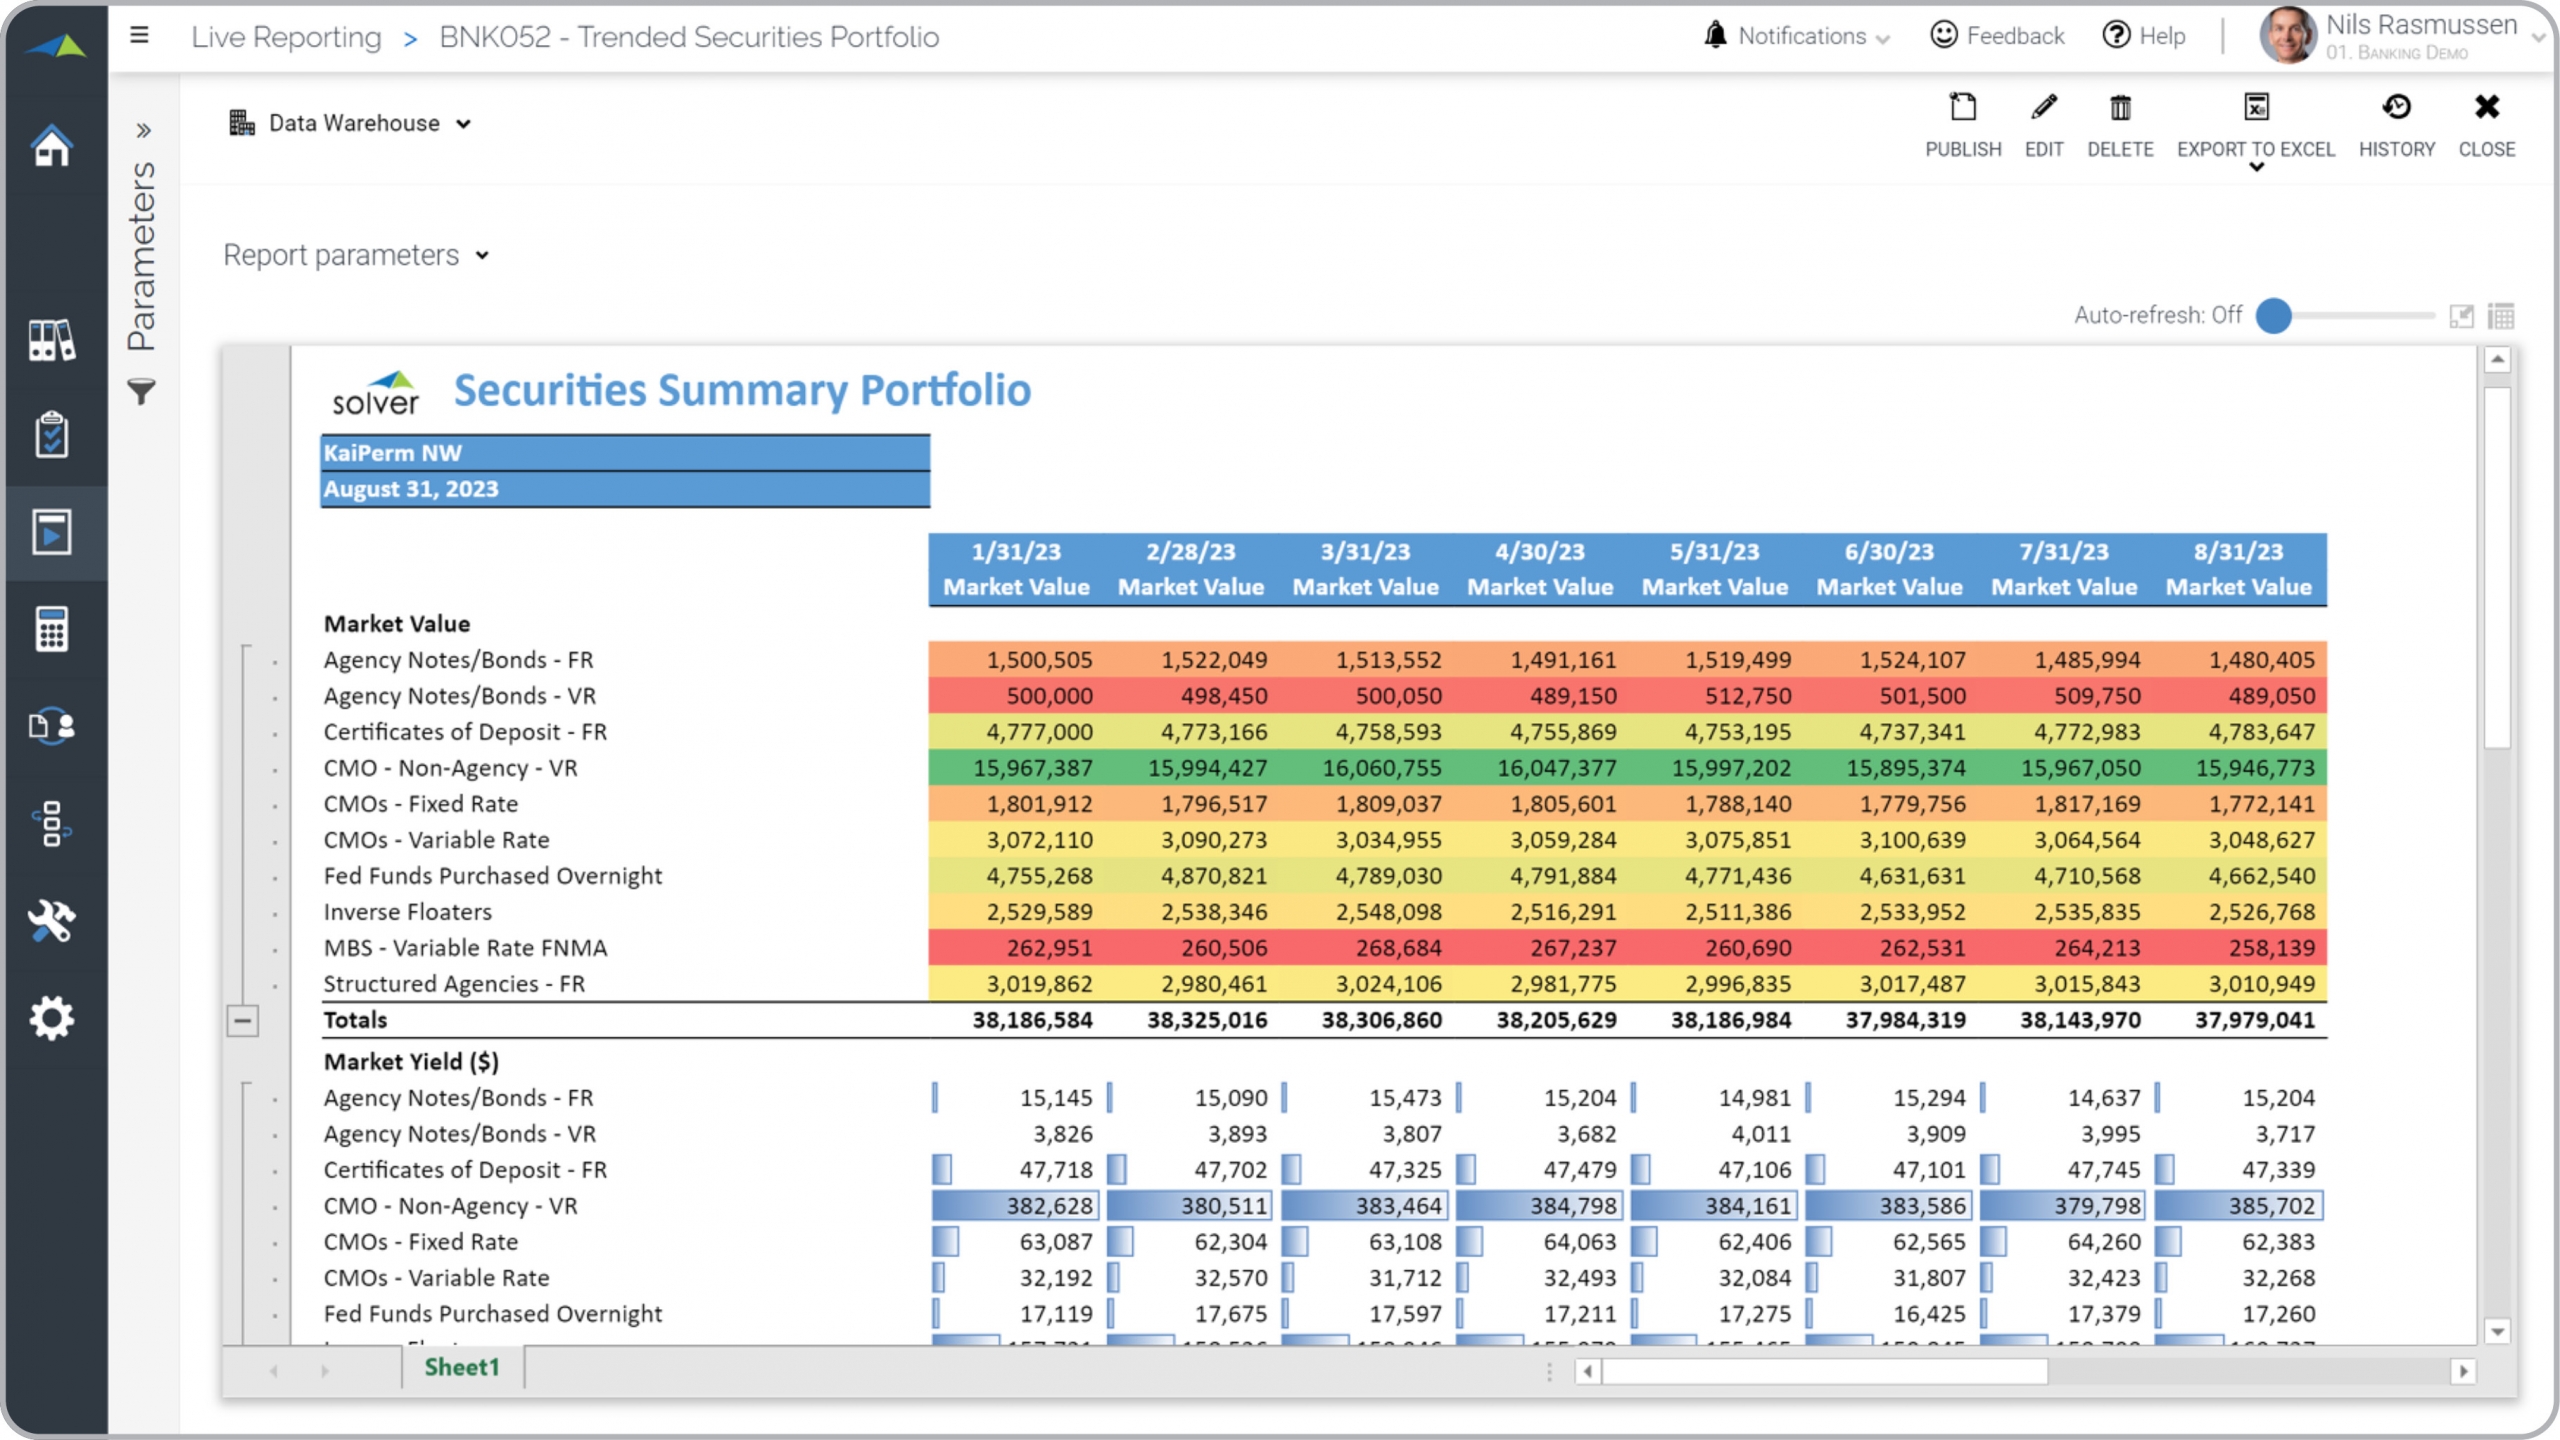
Bank – Securities Summary Portfolio – Trended
Overview and trend analysis of the bank's securities portfolio with yields, market value, etc.

Bank – Securities Summary Portfolio
Overview and graphical analysis of the bank's securities portfolio with yields, market value, etc.
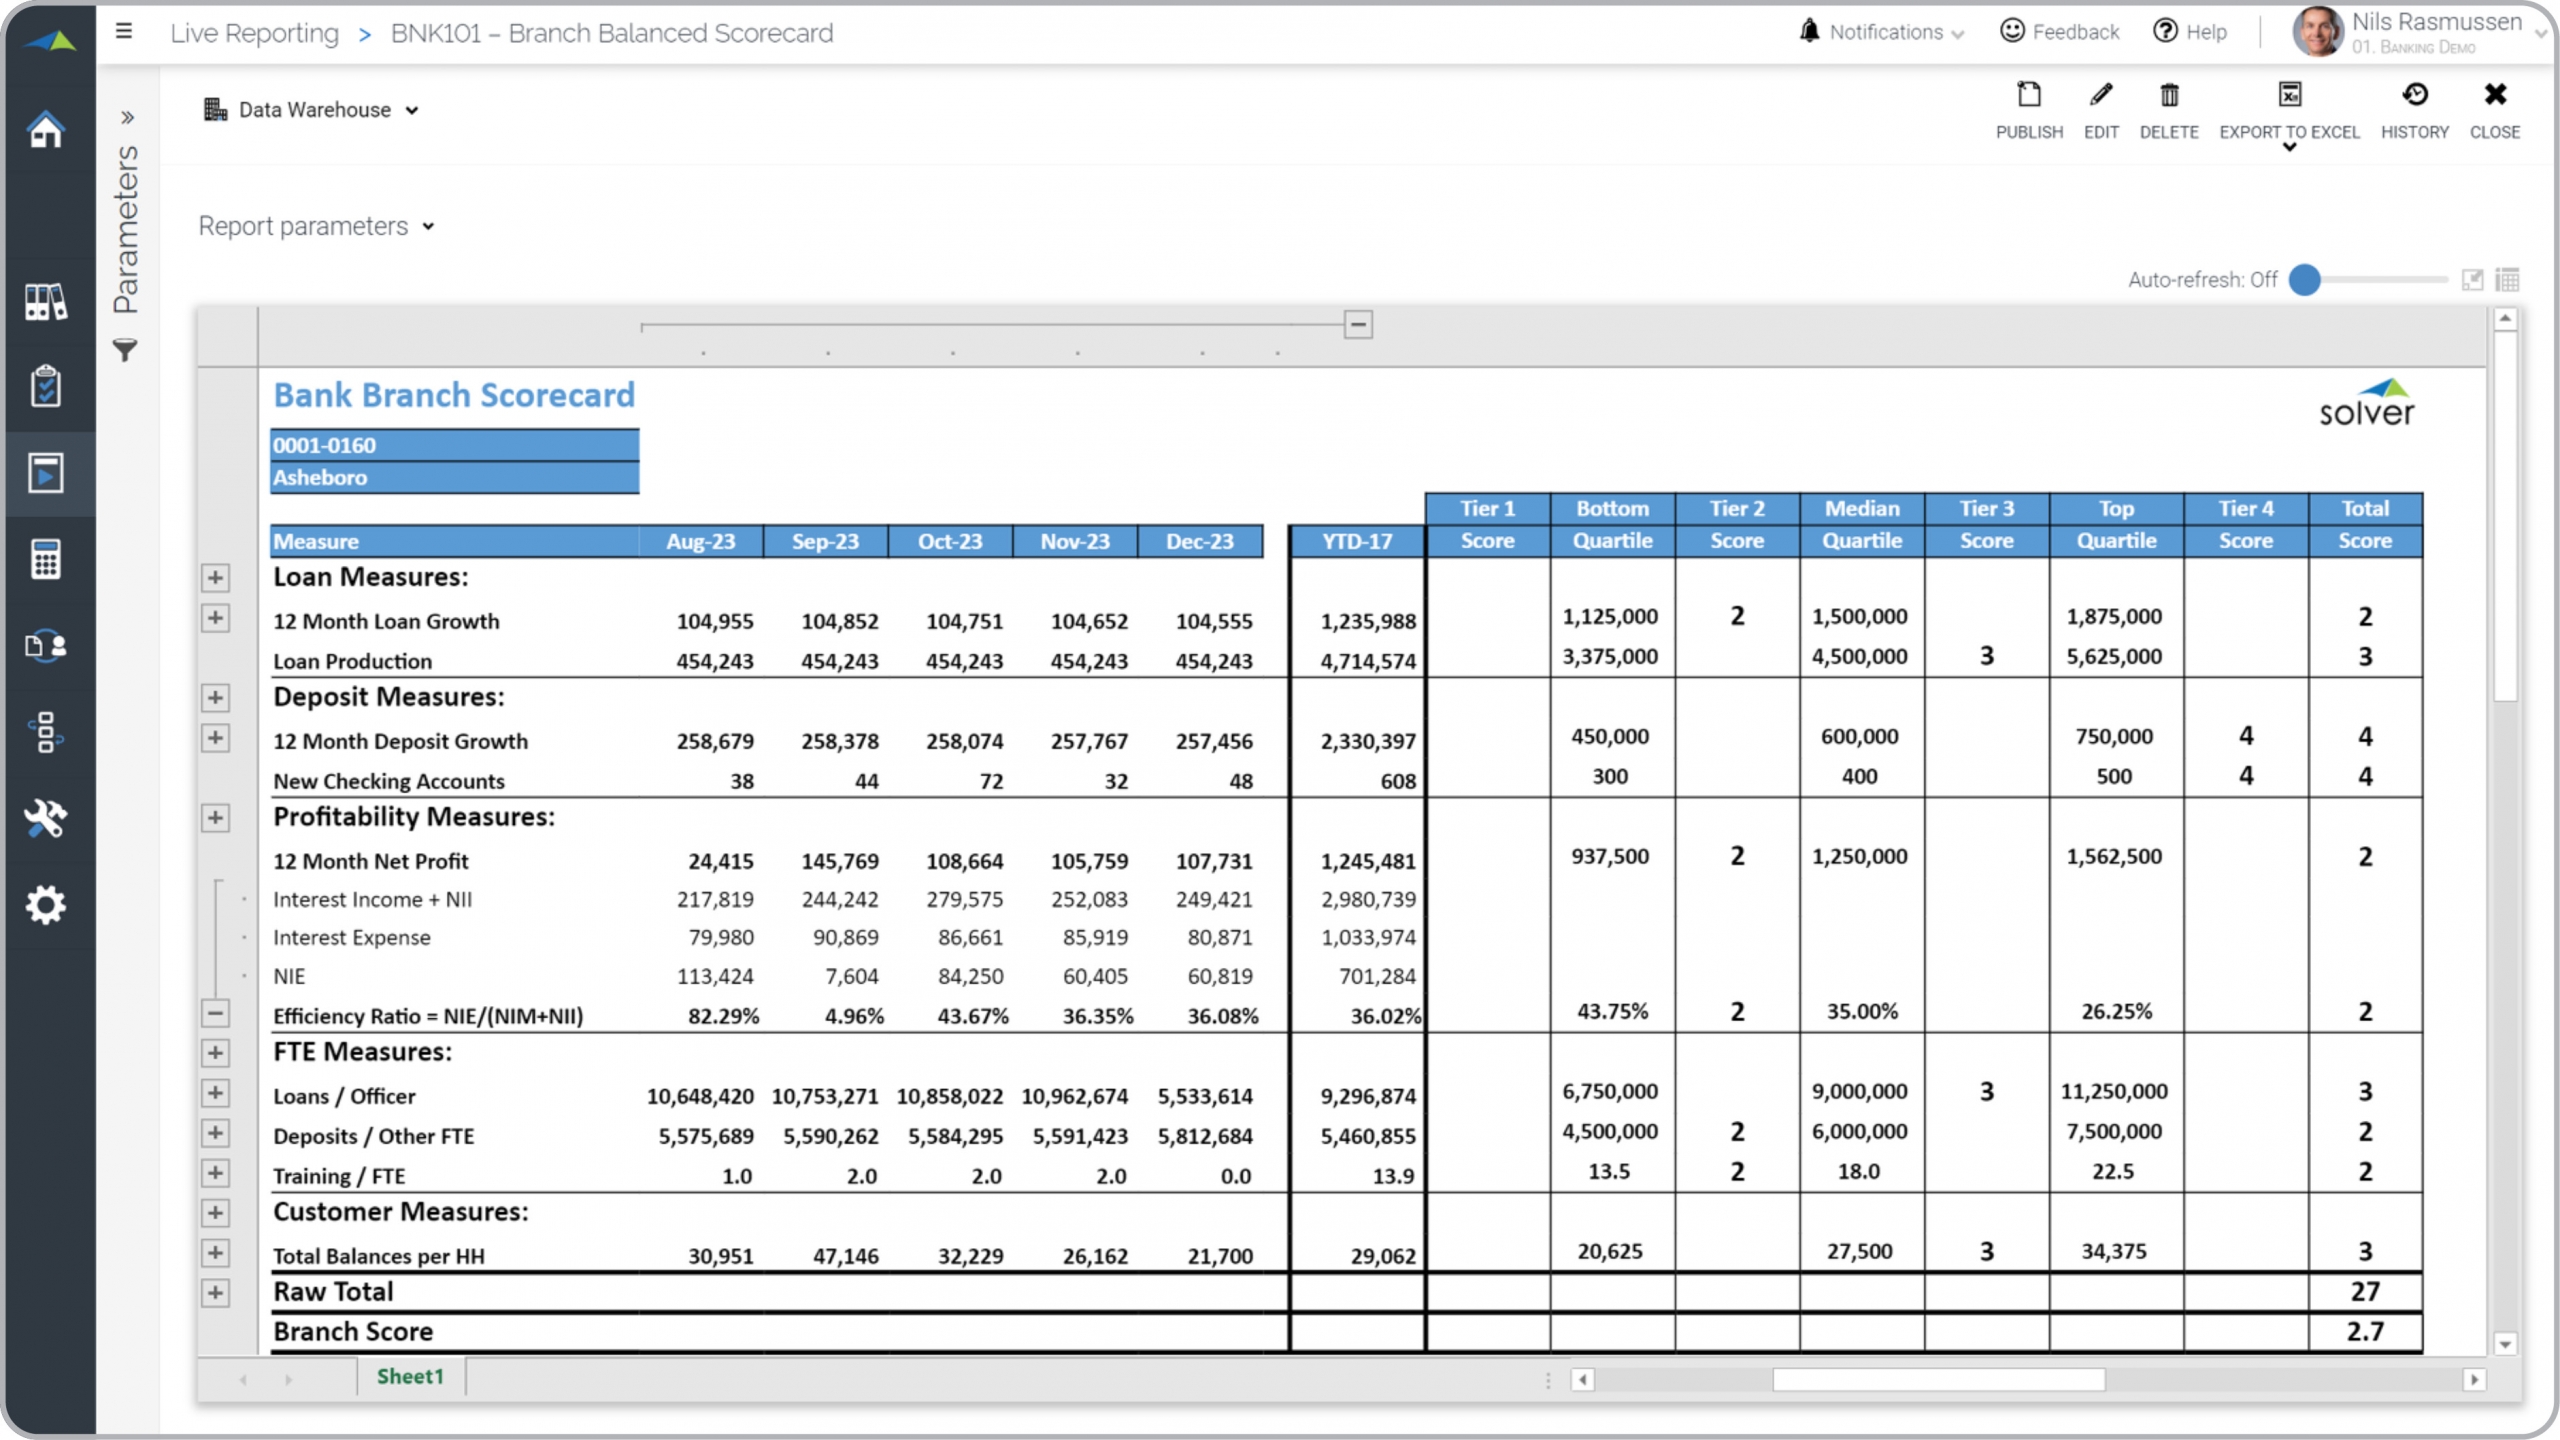
Bank – Branch Scorecard
Overview and graphical analysis of the bank's securities portfolio with yields, market value, etc.
Bank – Securities Listing by Category
Security report by category and with yields, market value, and life performance.
Bank – Branch Yield Rate Analysis
Yield and rate analysis for a branch with comparison of current period, last year and budget.
Bank – Branch Loan Production
Monthly loan KPIs by category with fees, margins and expenses.
Bank – Branch Income Statement
Financial report with current month, last year and budget variance analysis.
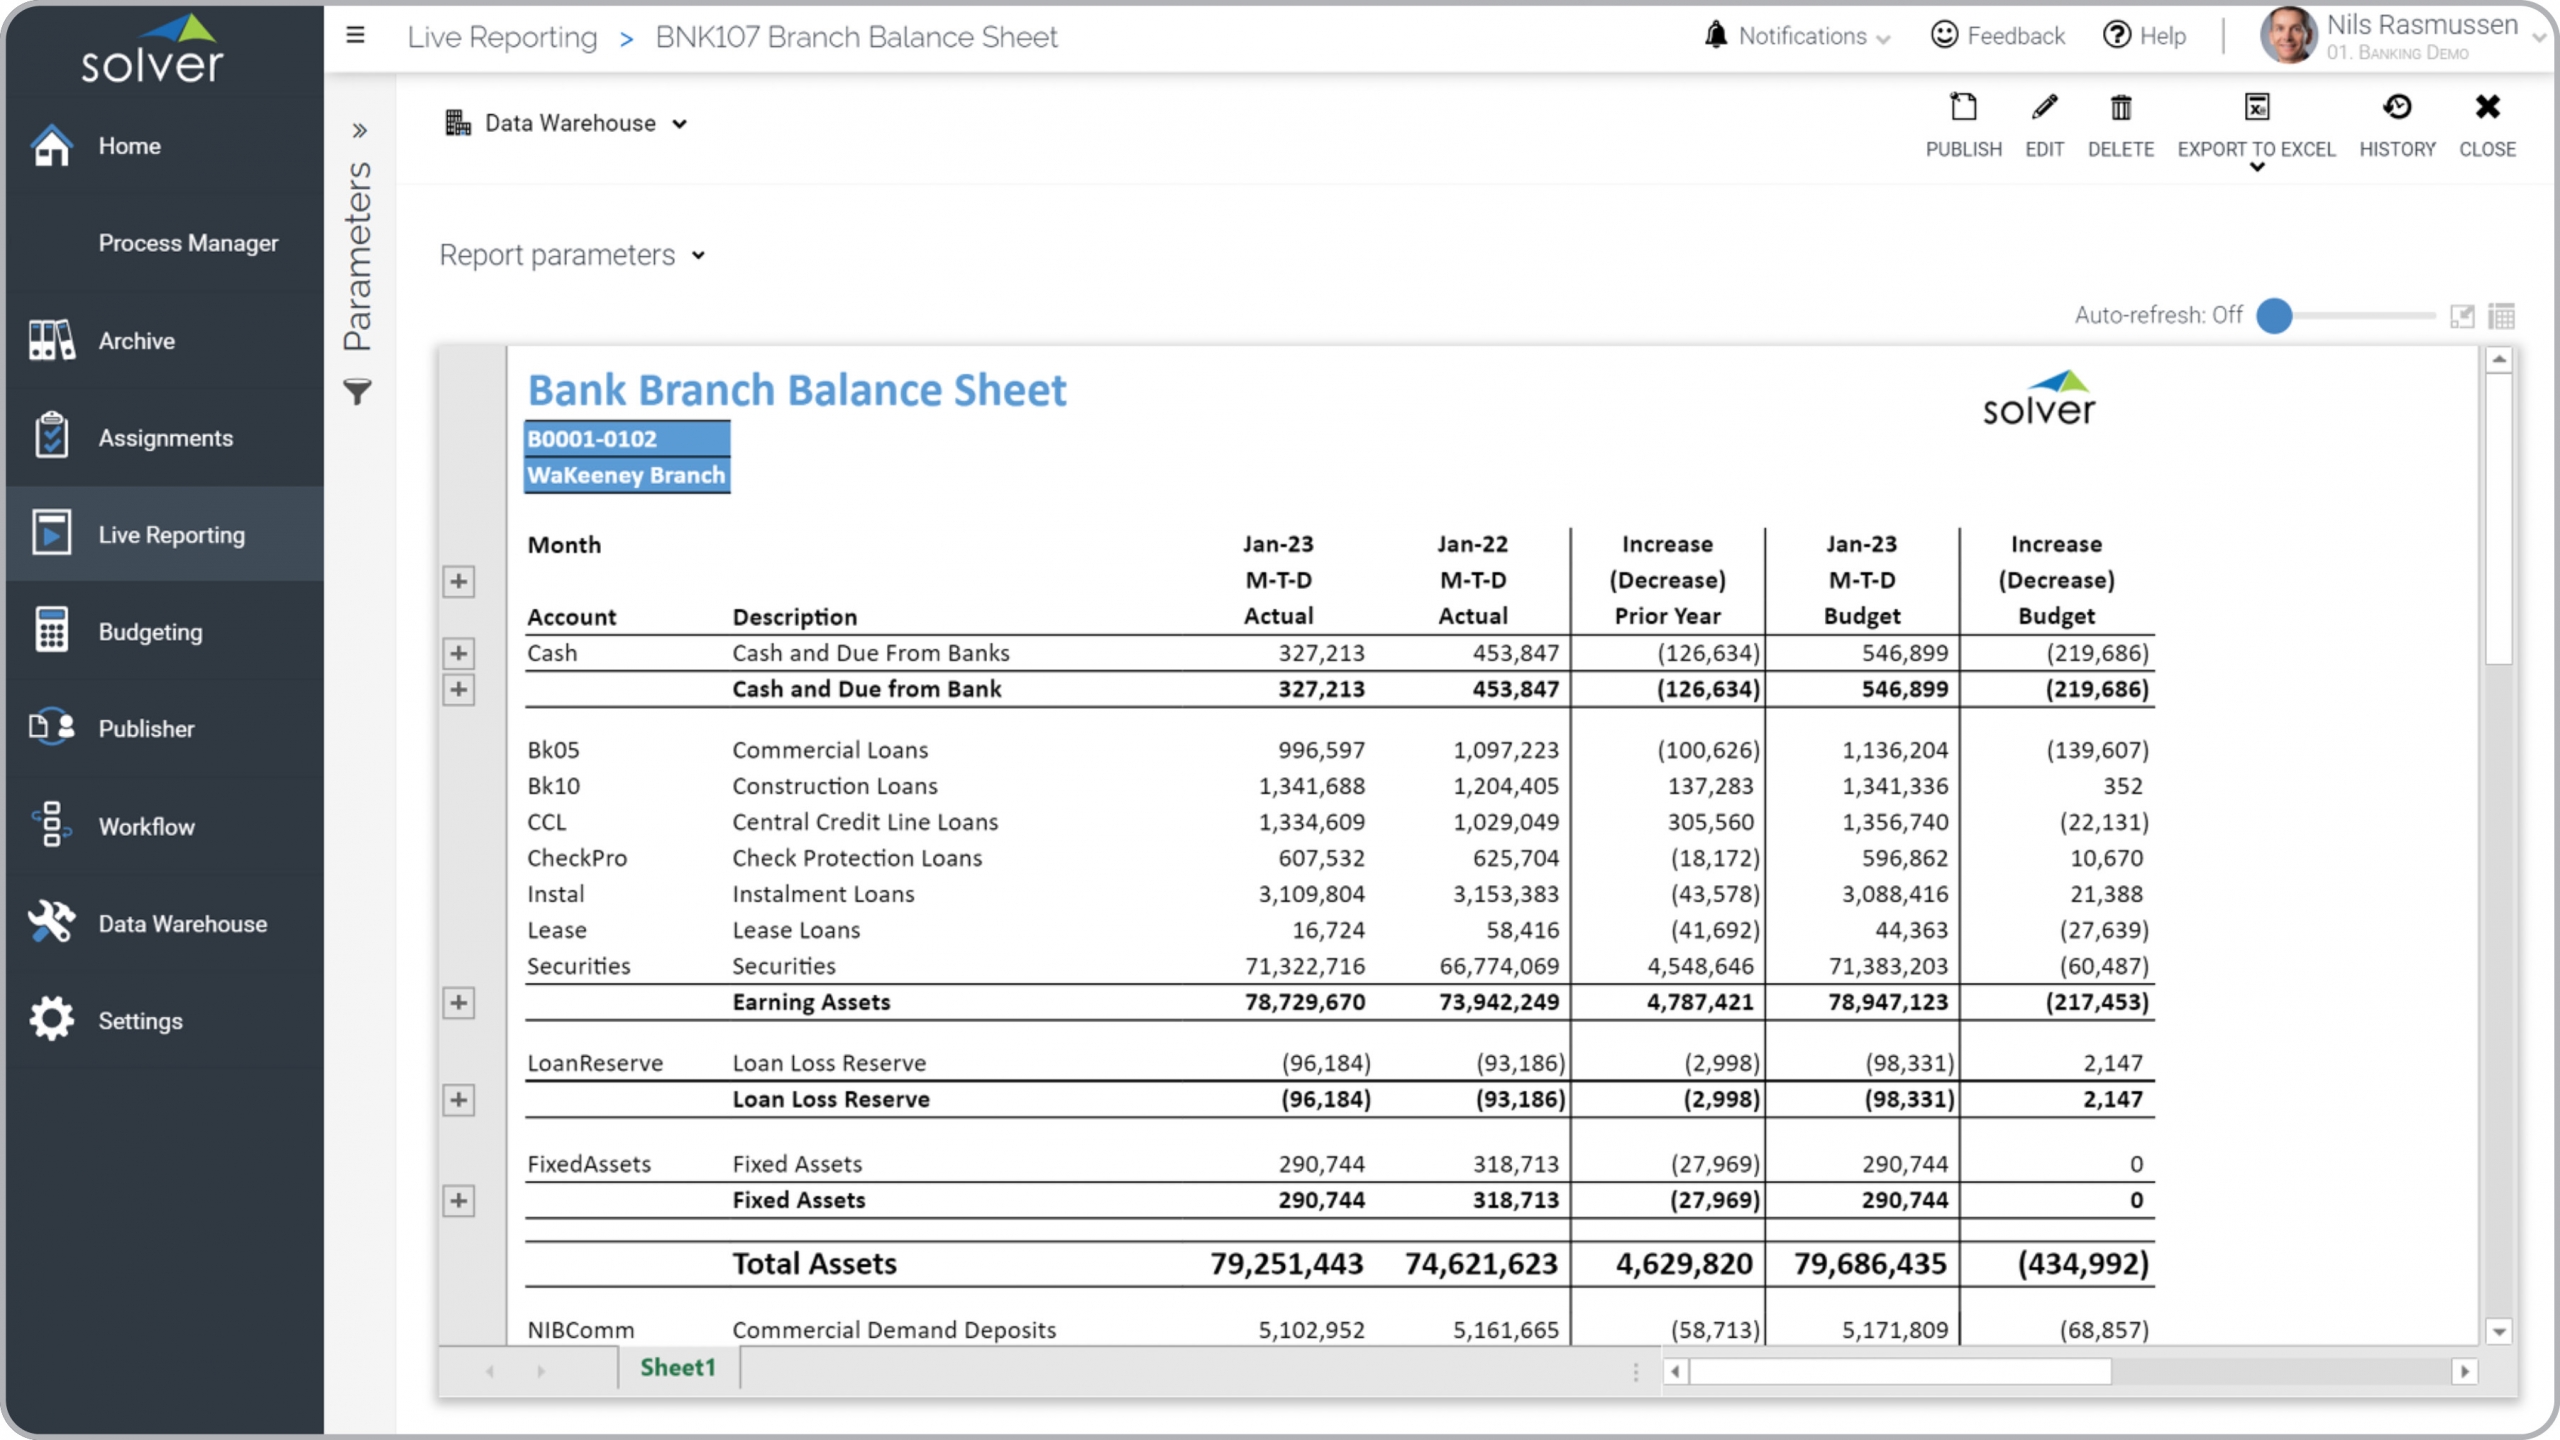
Bank – Branch Balance Sheet
Financial report with current month, last year and budget variance analysis.
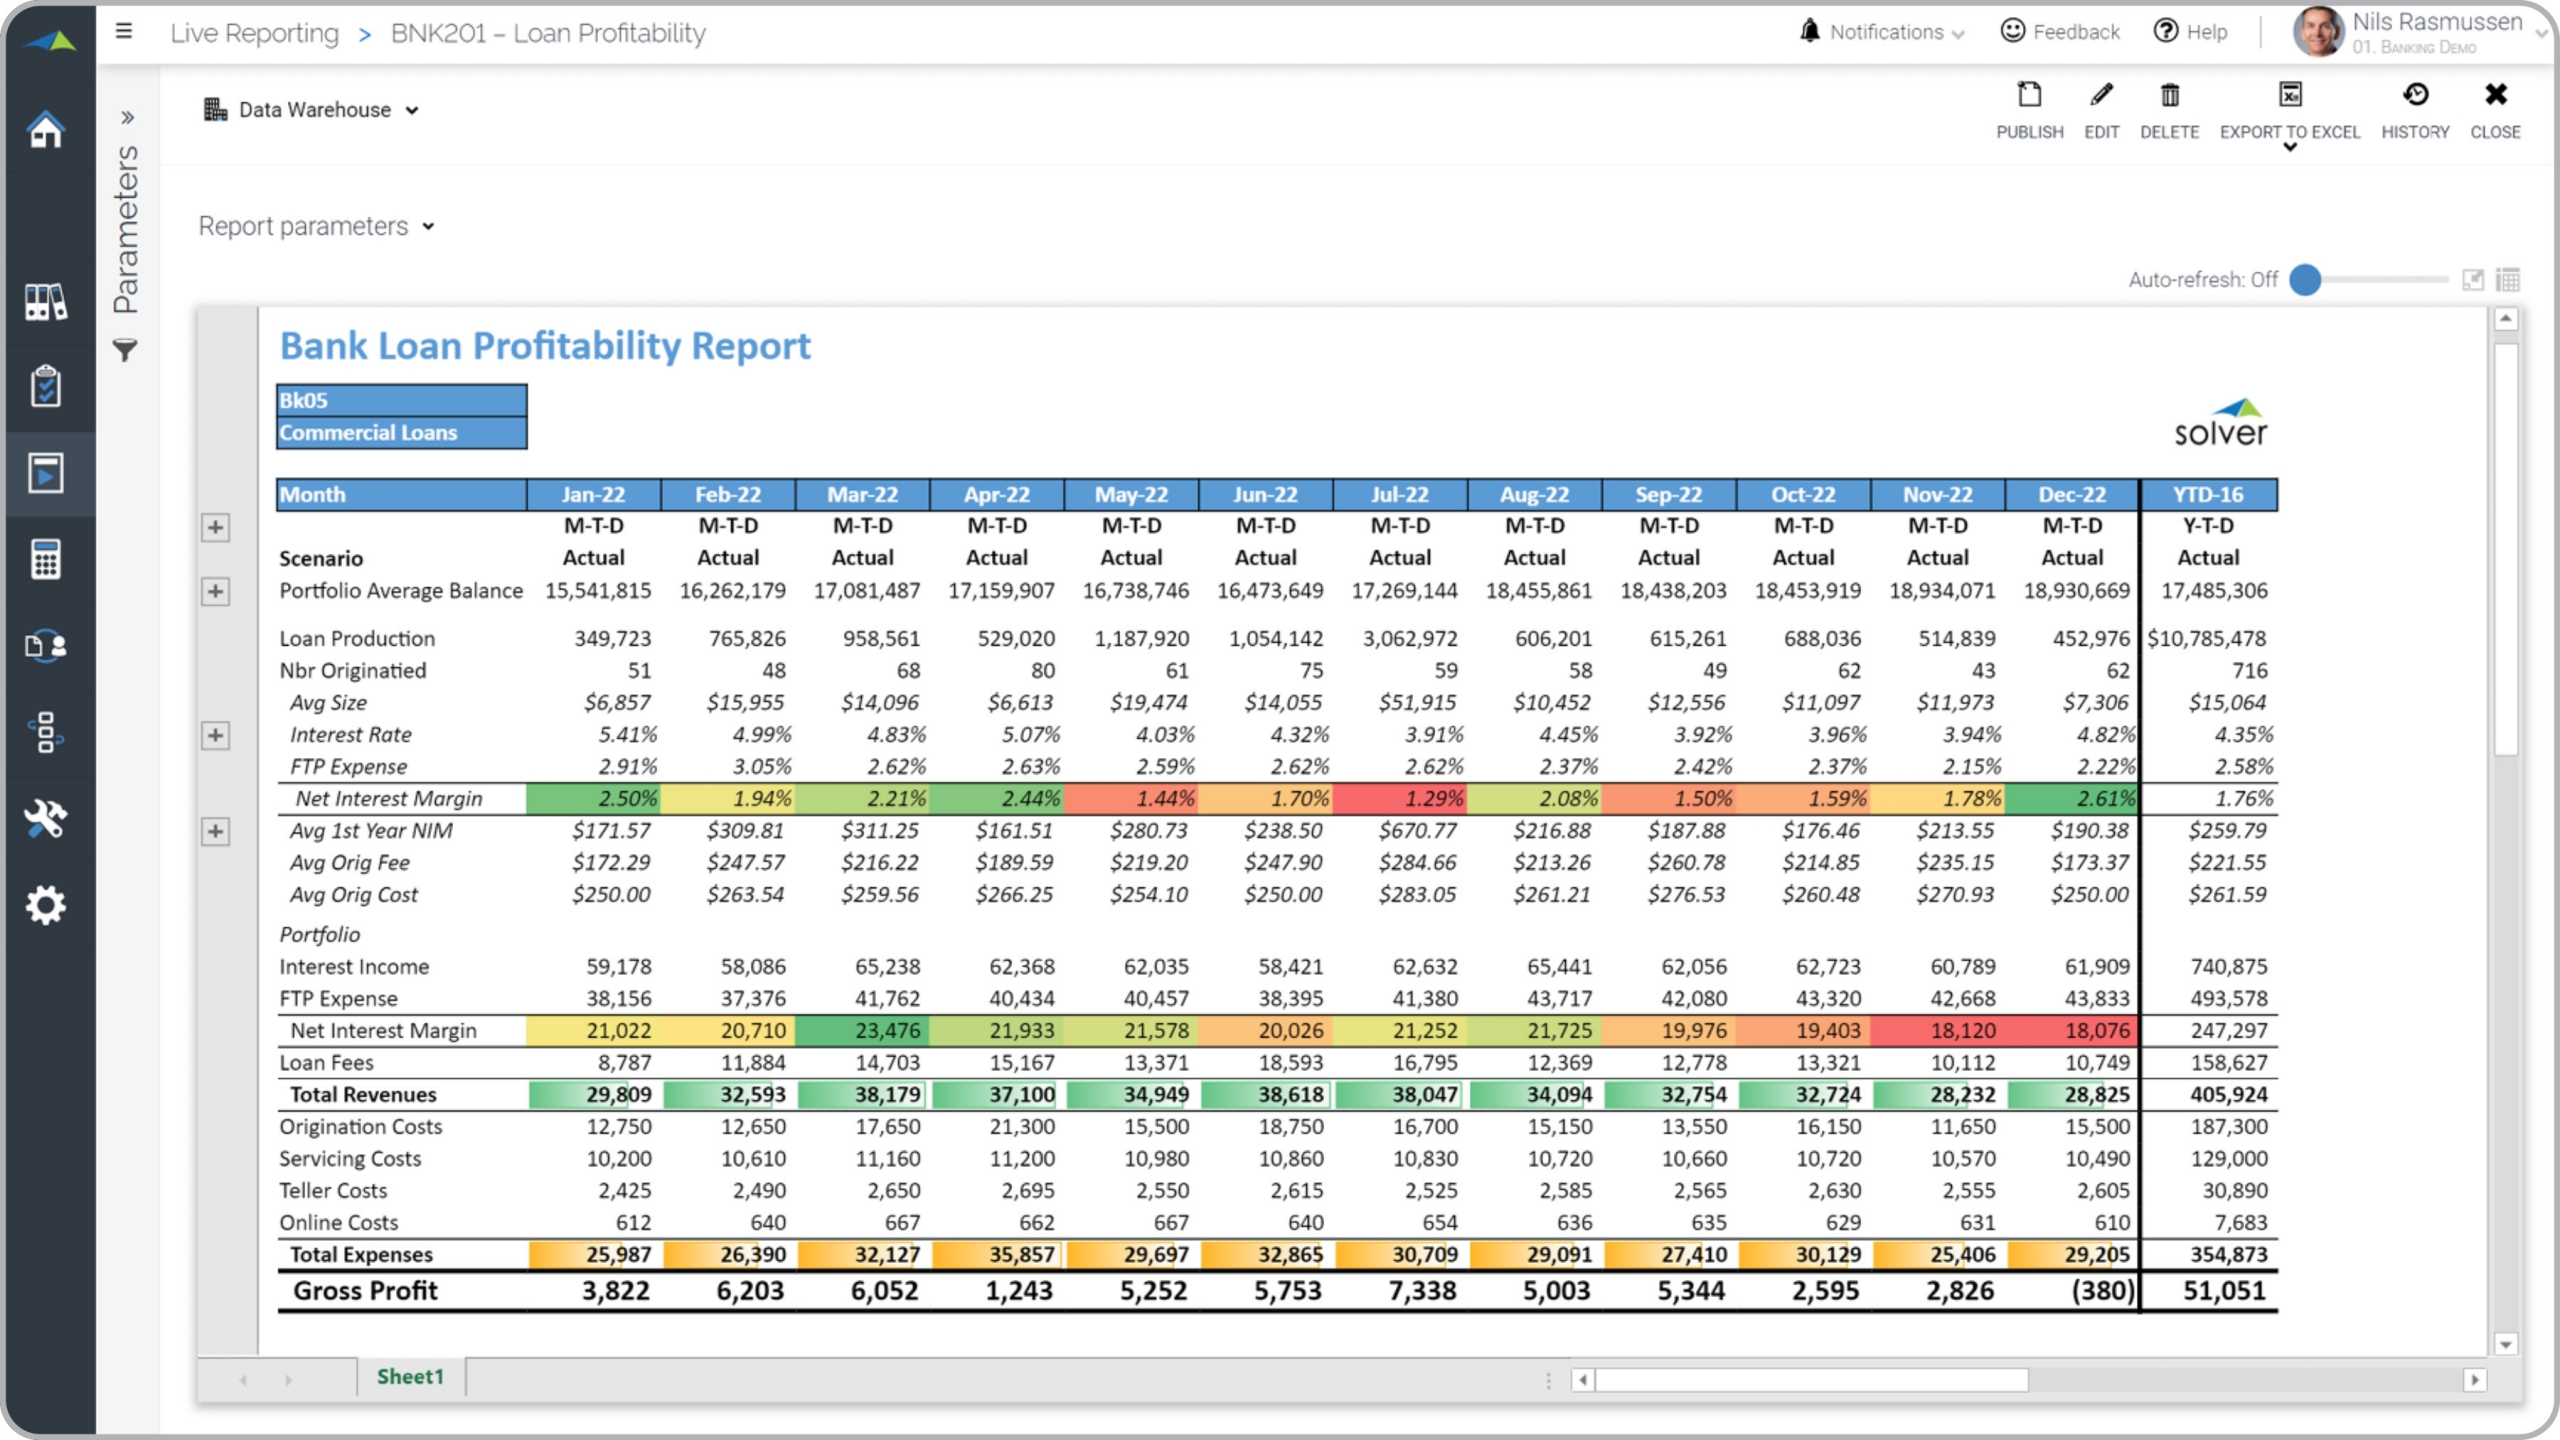
Bank – Loan Profitability
Monthly trend of loan revenues, expenses and profit.
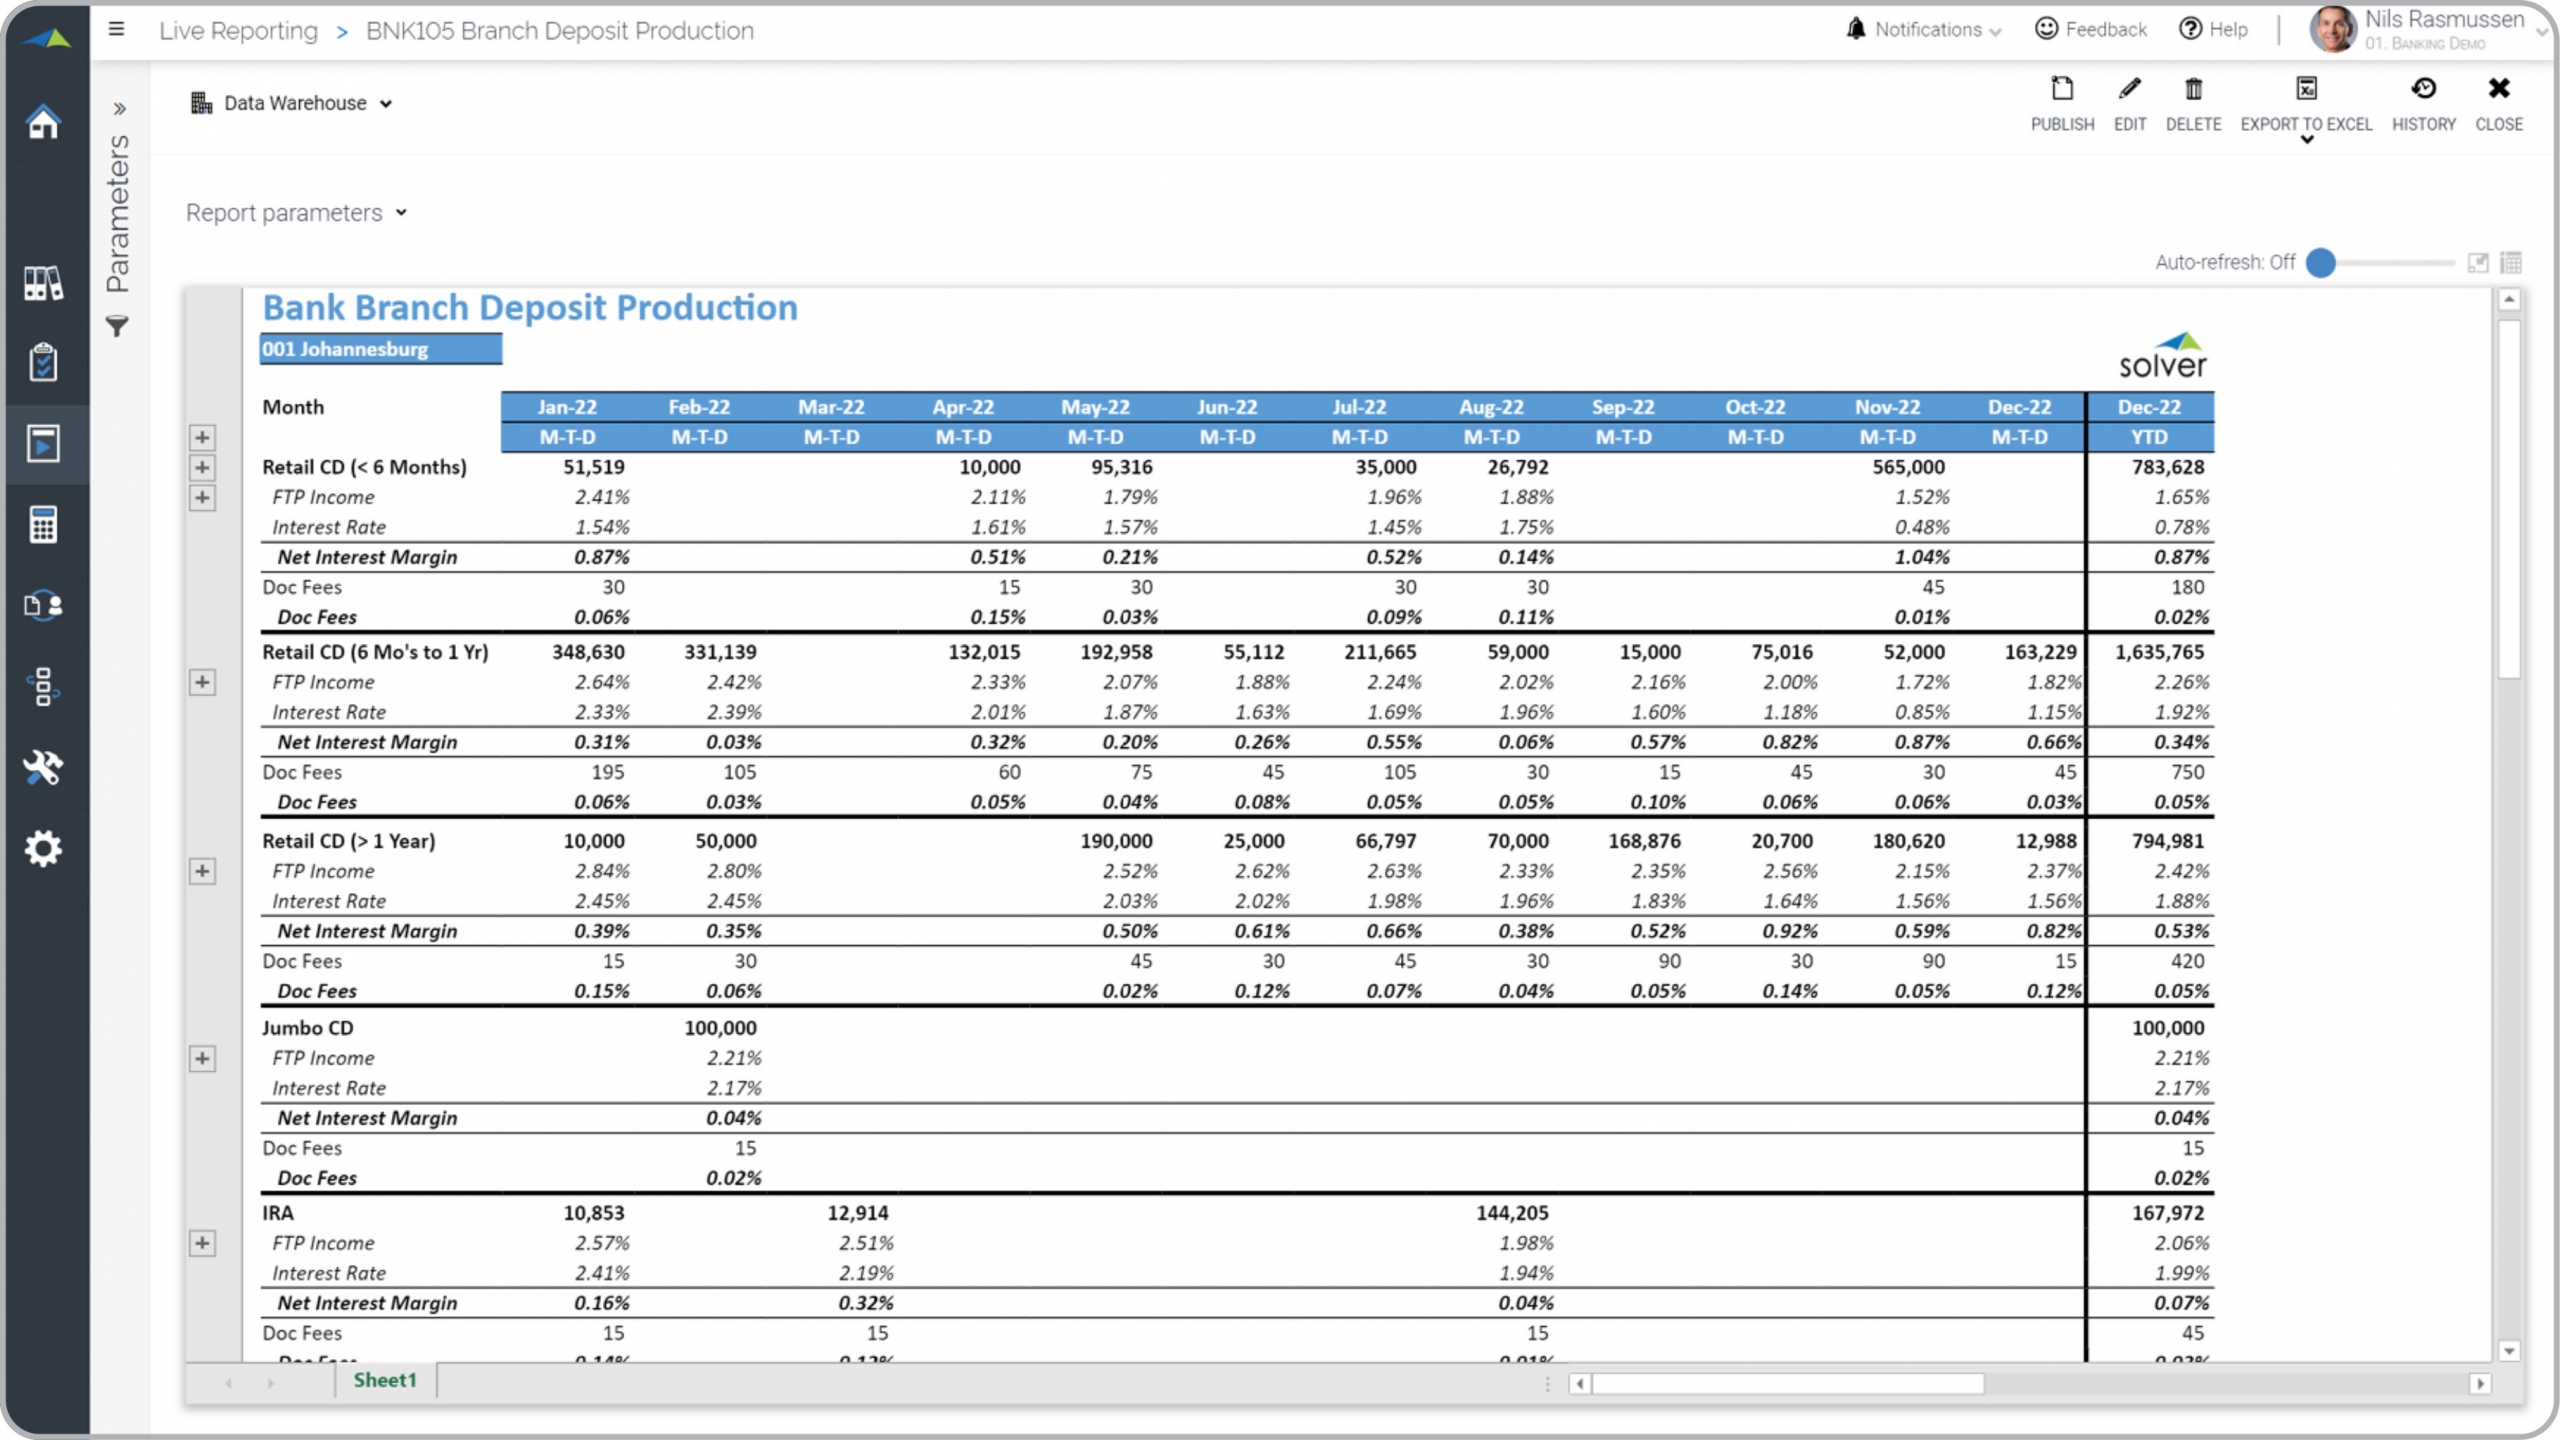
Bank – Branch Deposit Production
Monthly deposit KPIs by deposit type with fees, margins and expenses.
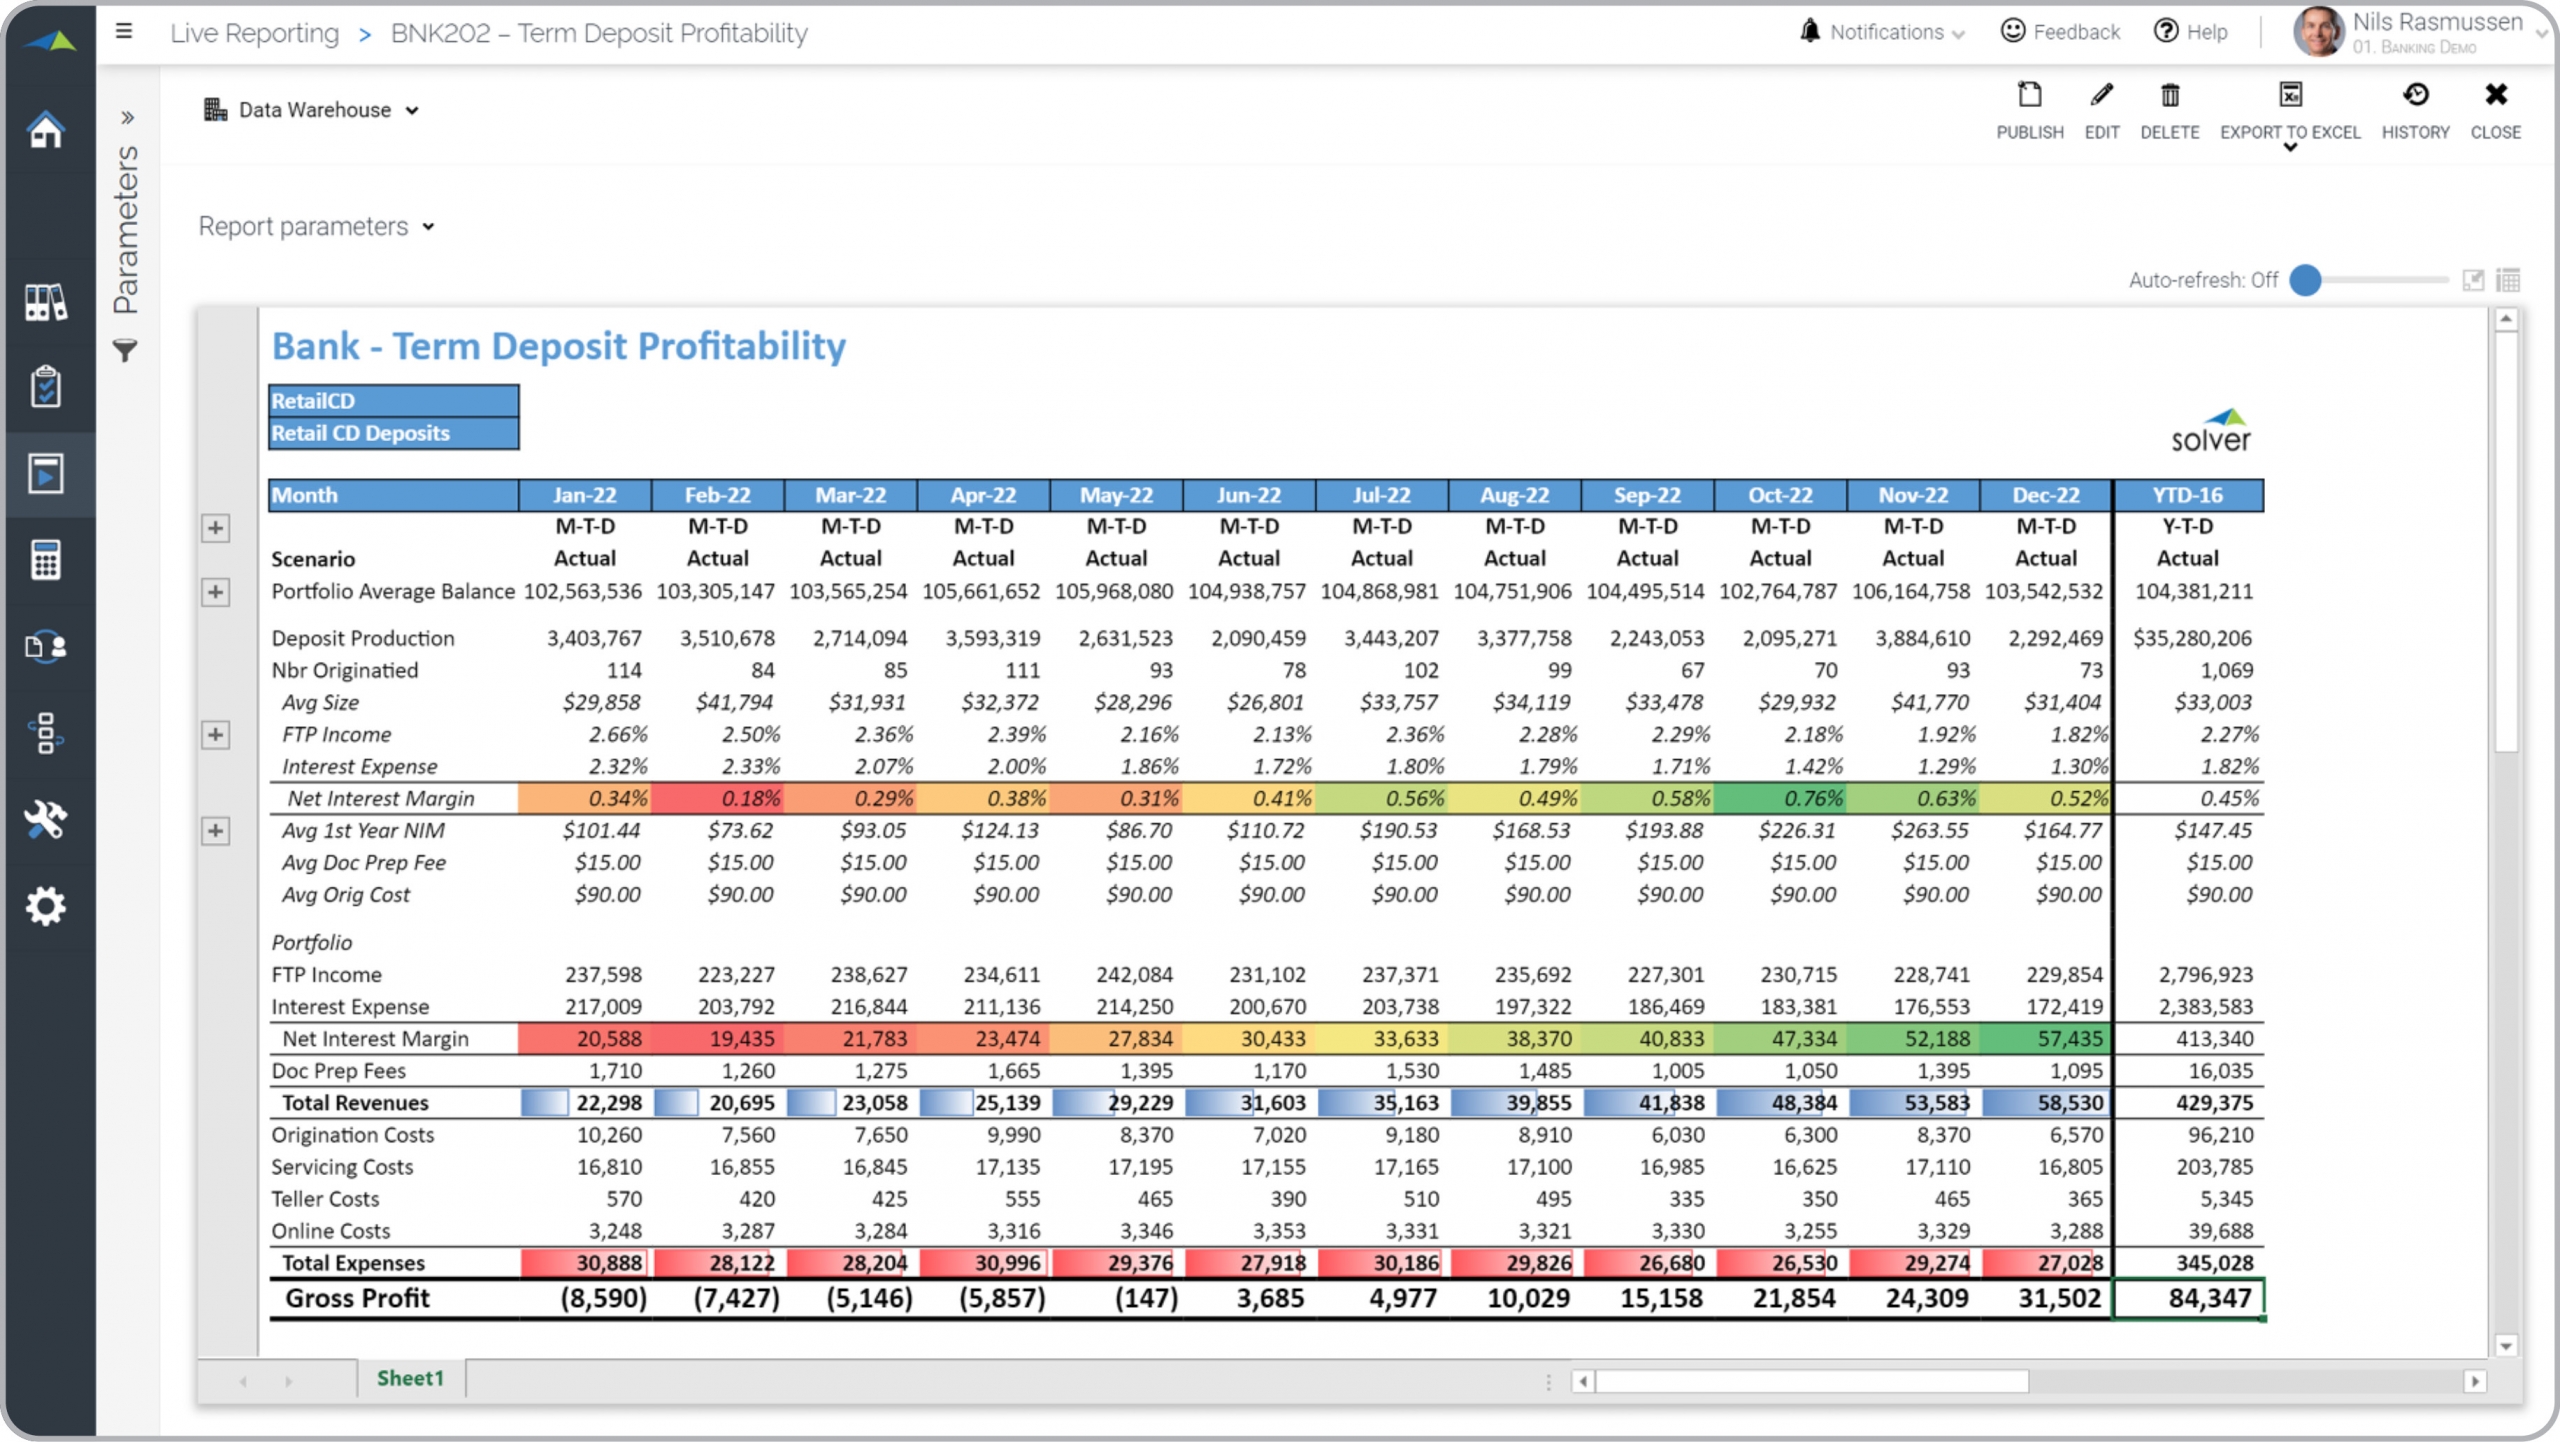
Bank – Term Deposit Profitability
Monthly trend of term deposits with revenues, expenses and profit.
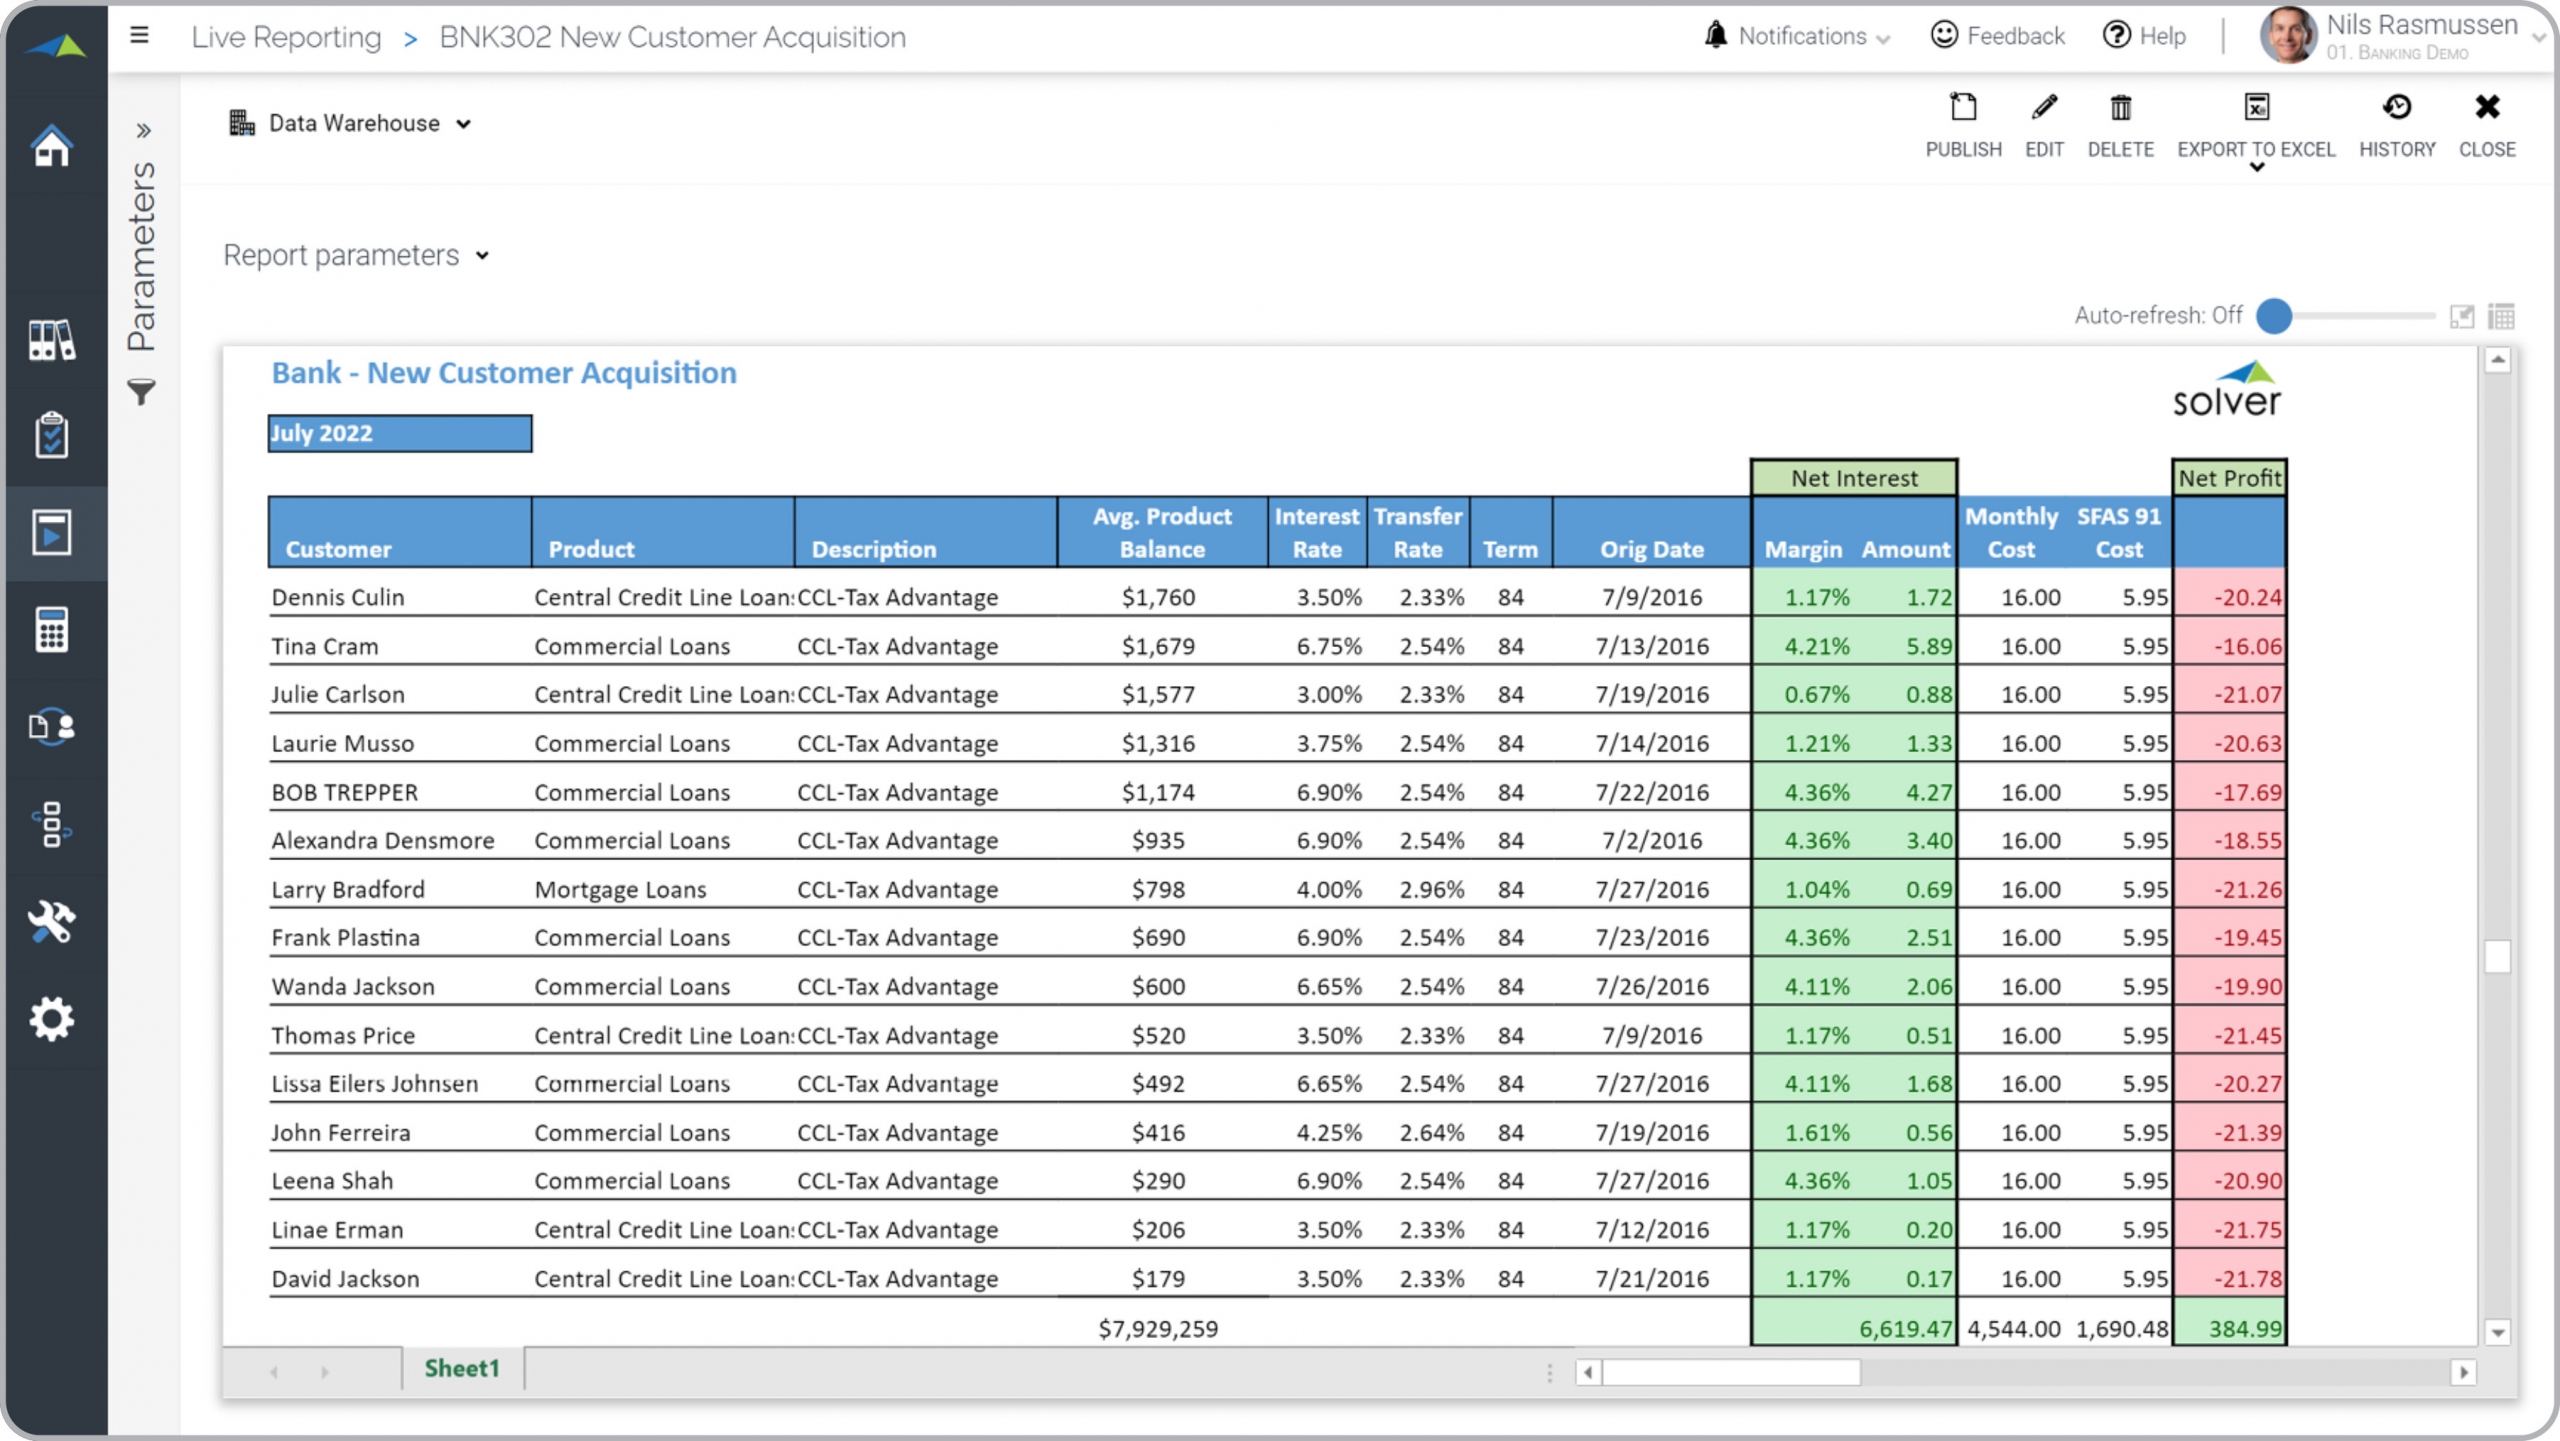
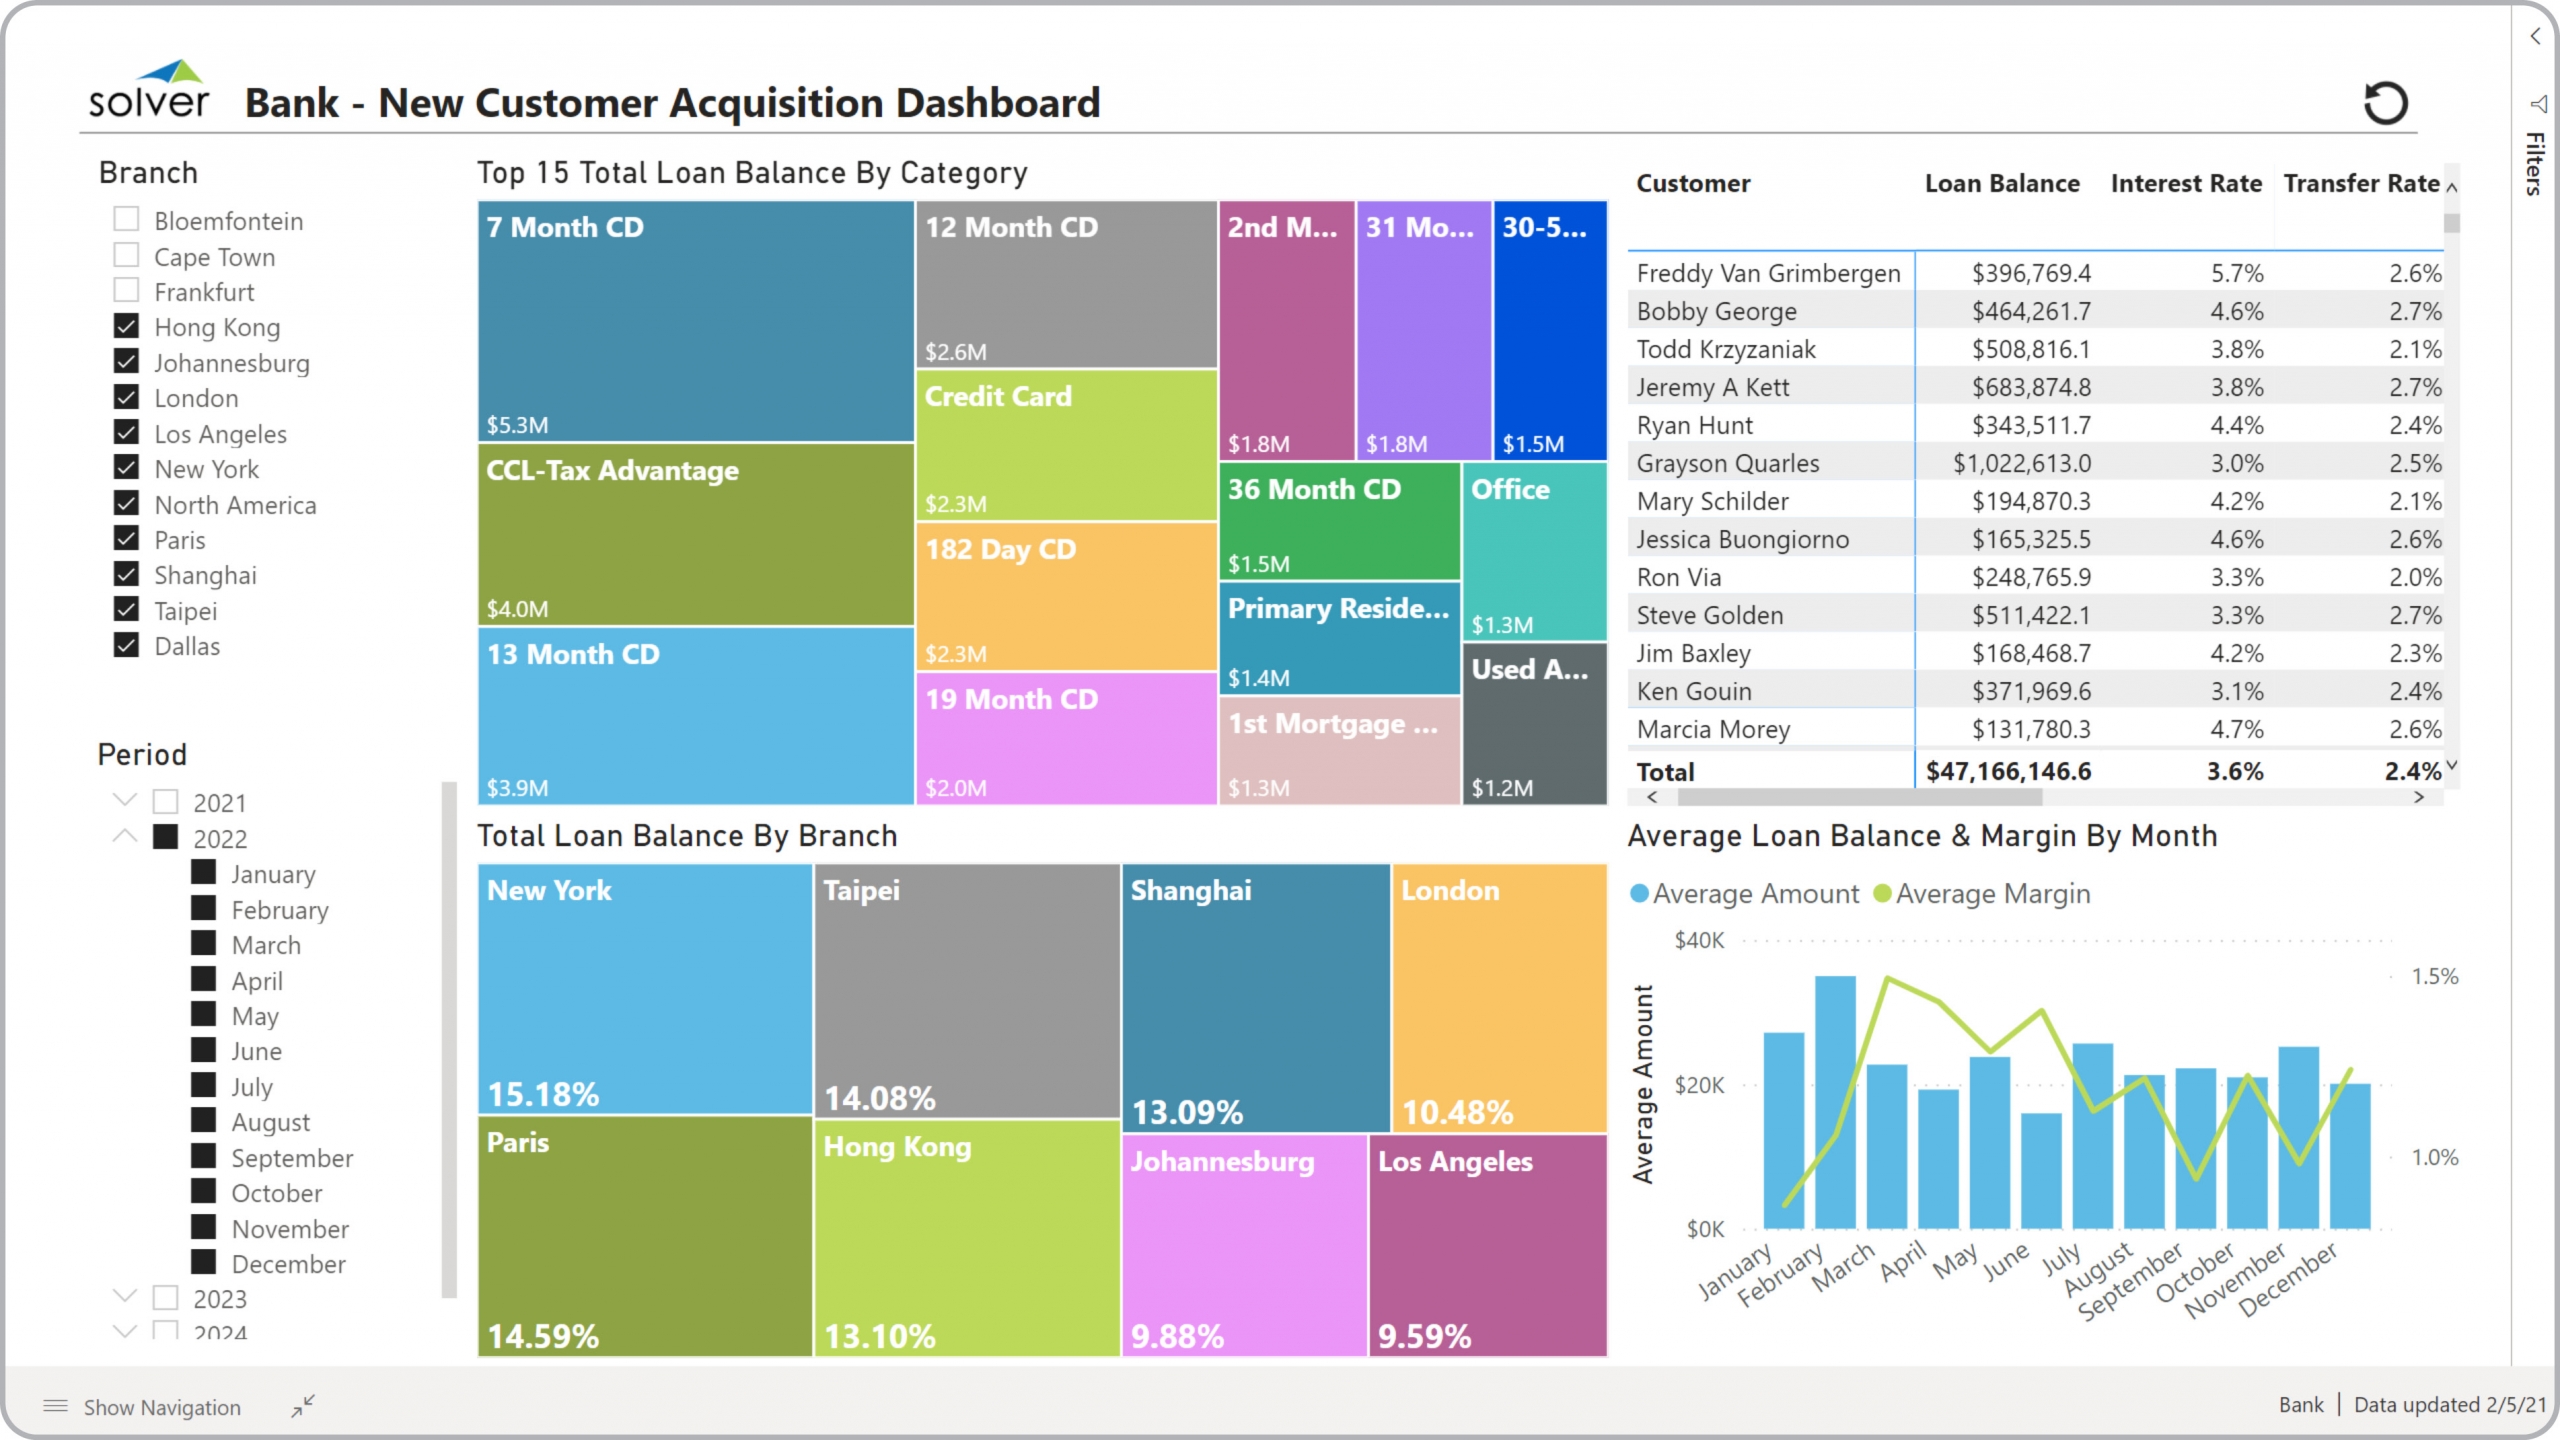
Bank – New Customer Acquisition
Profit (loss) and KPIs per new customer acquisition.
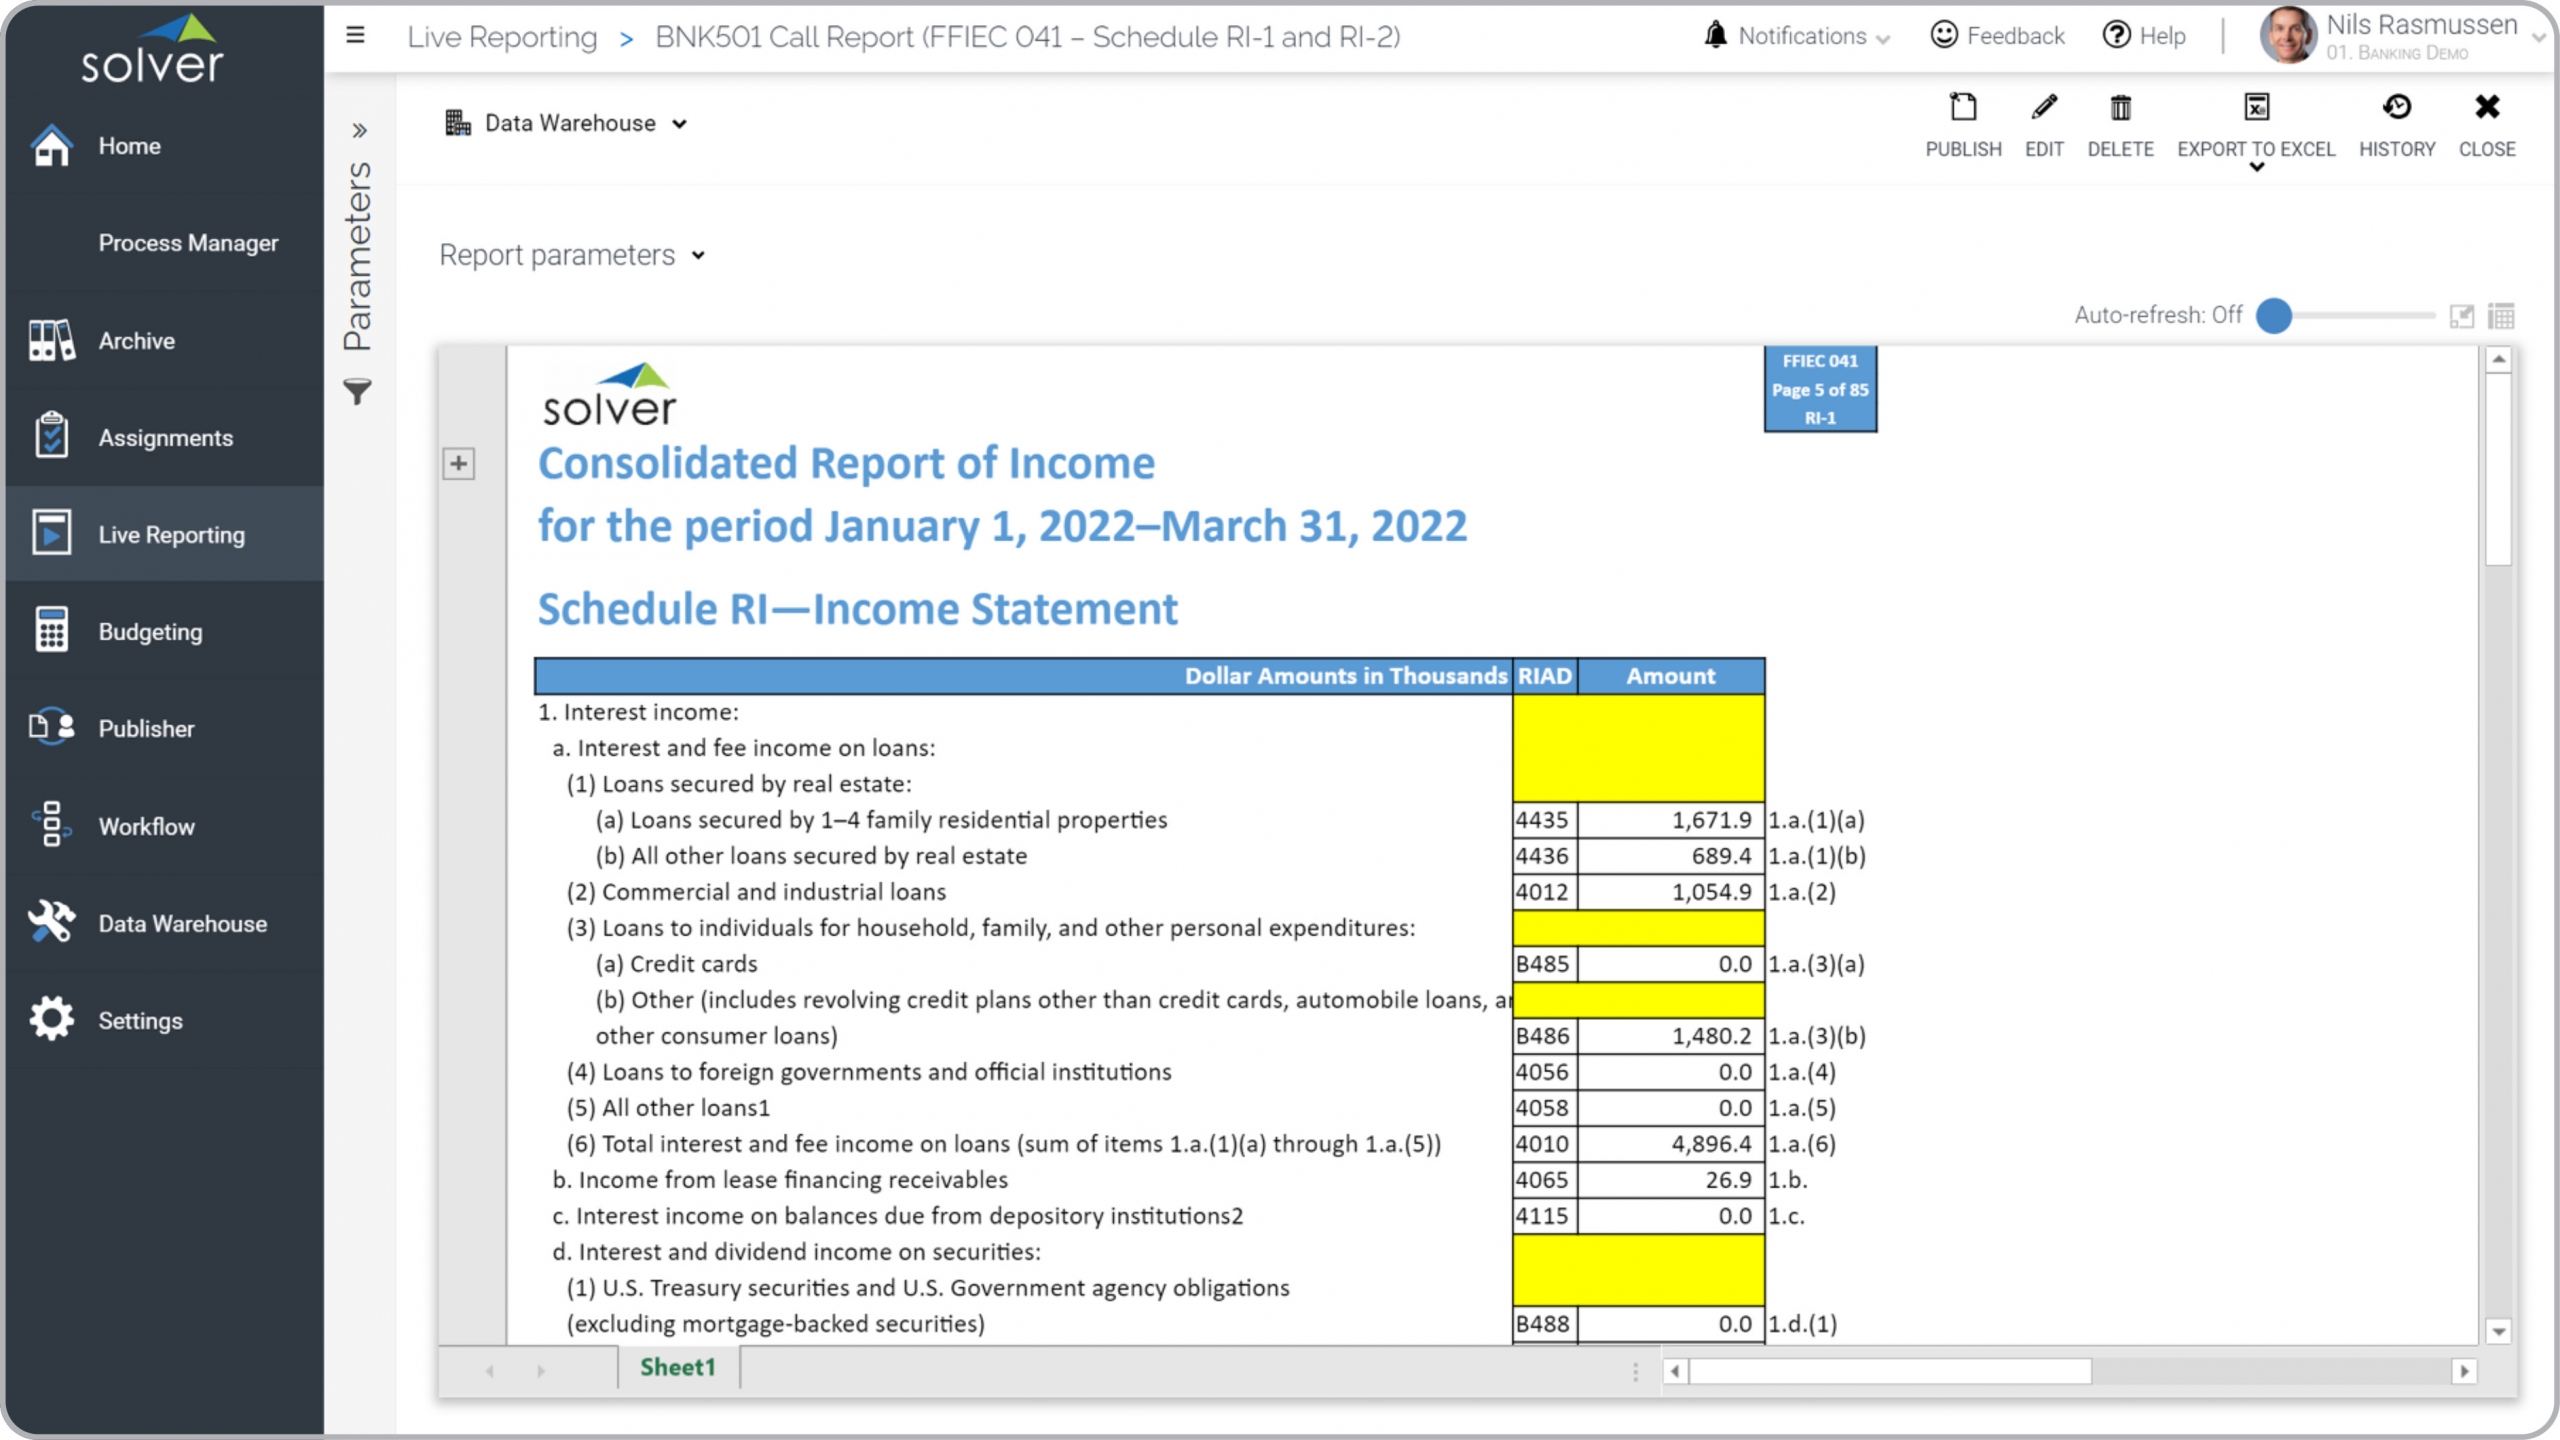
Bank – Call Report Example
Example of a Consolidated Report of Income call report for a bank.
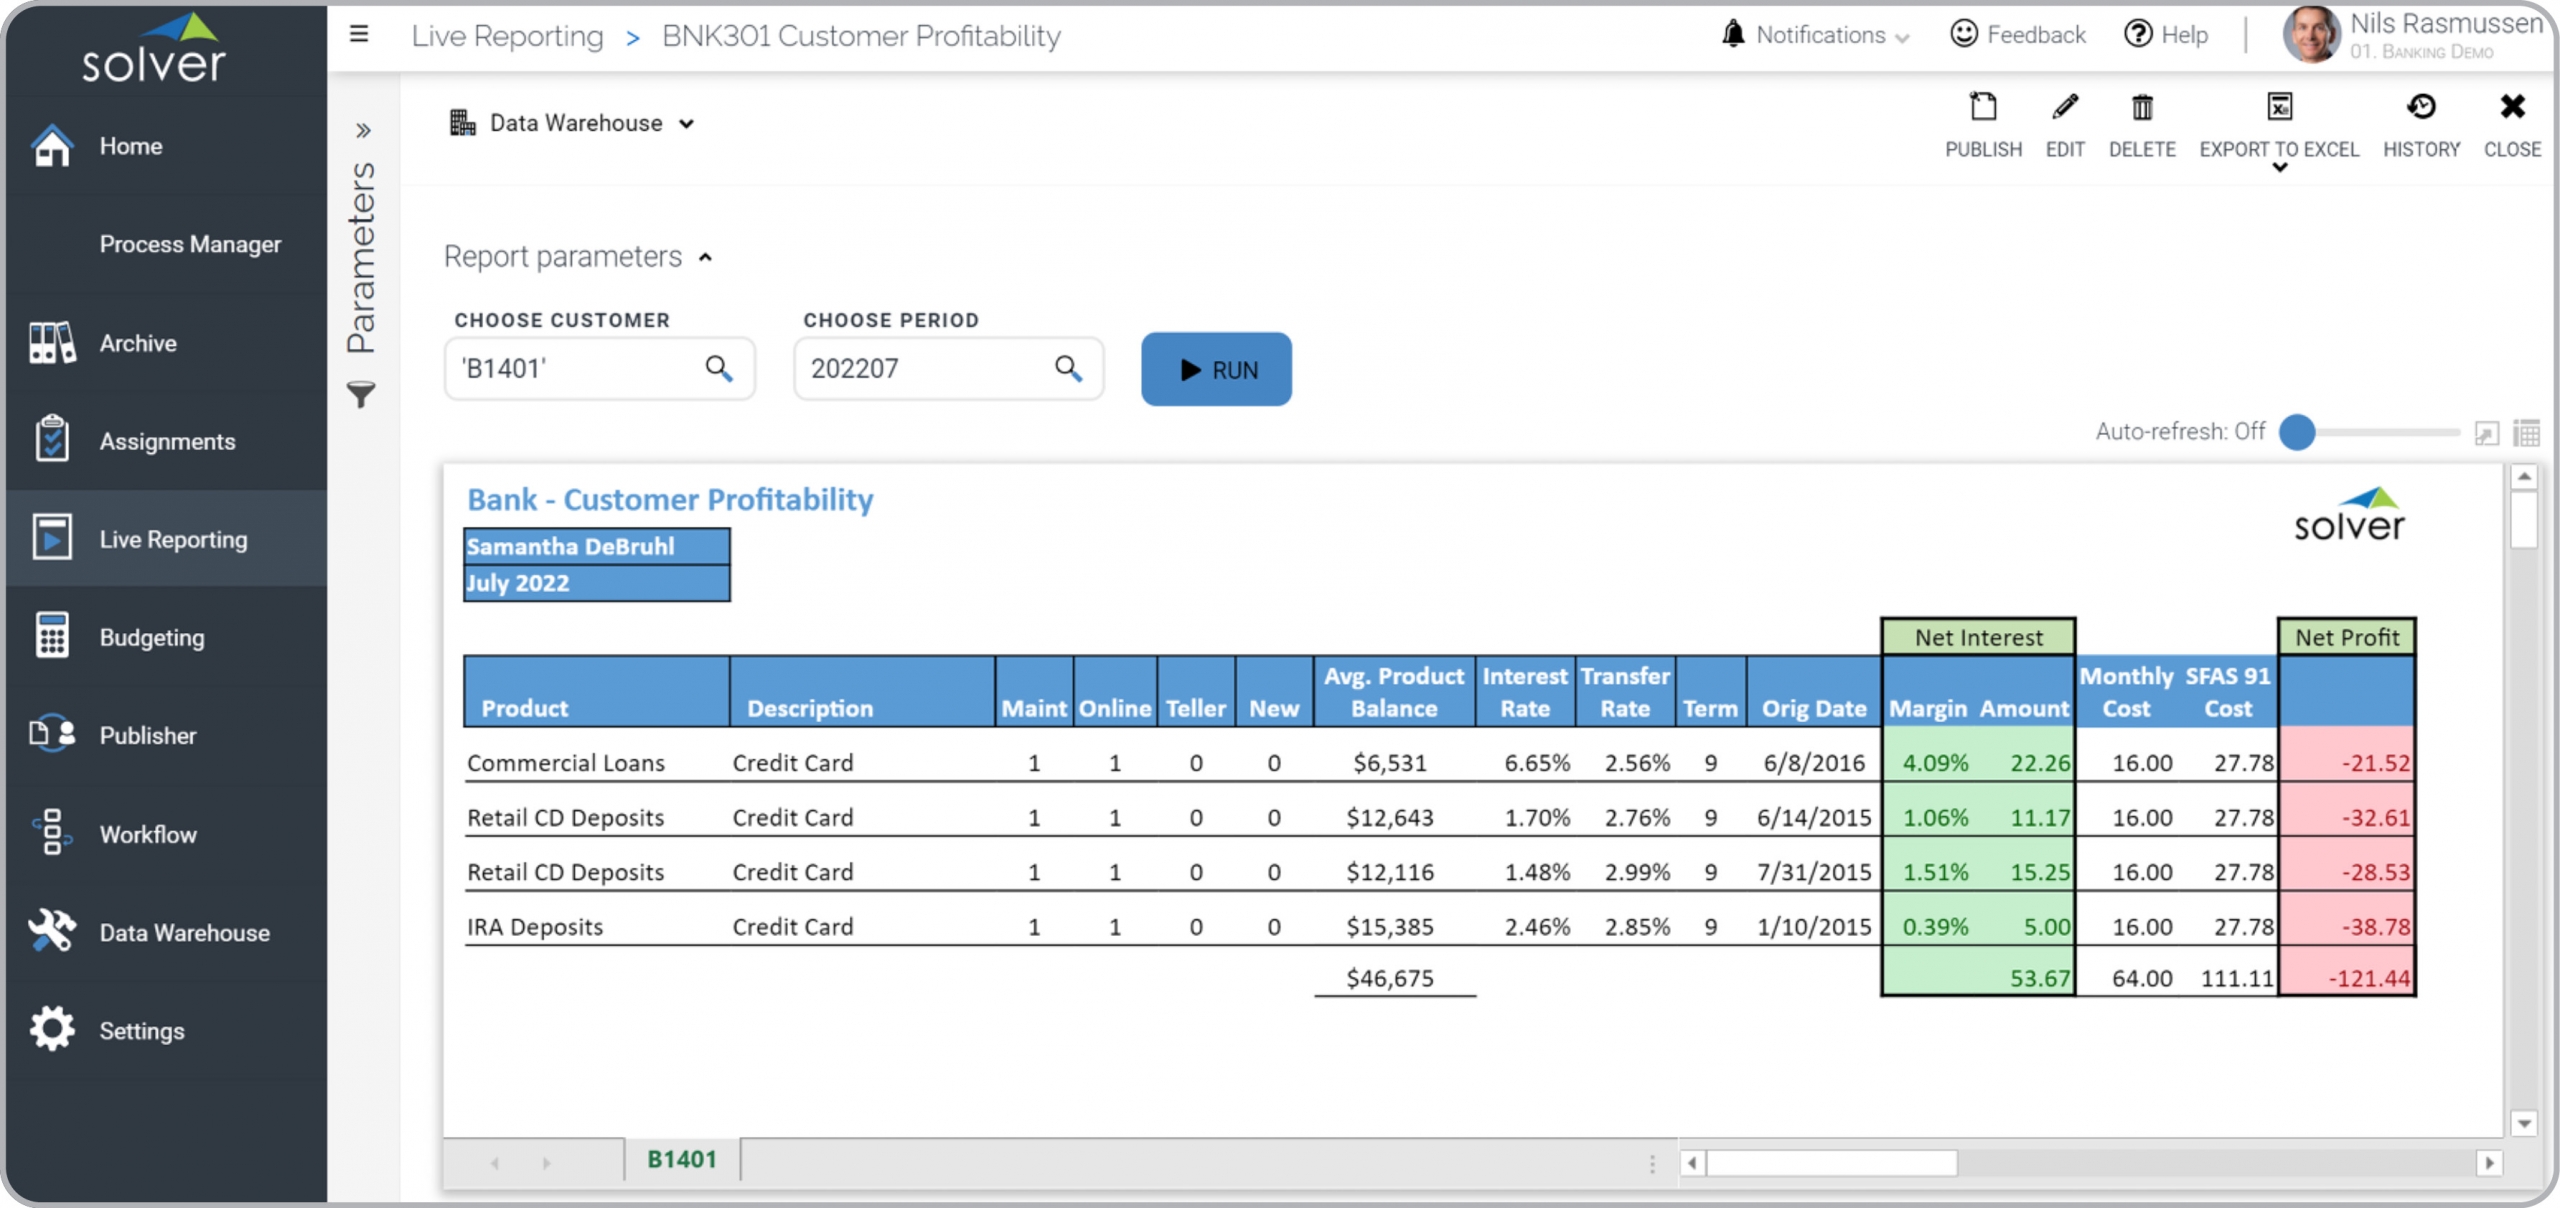
Bank – Customer Profitability
Profit (loss) per individual bank customer.
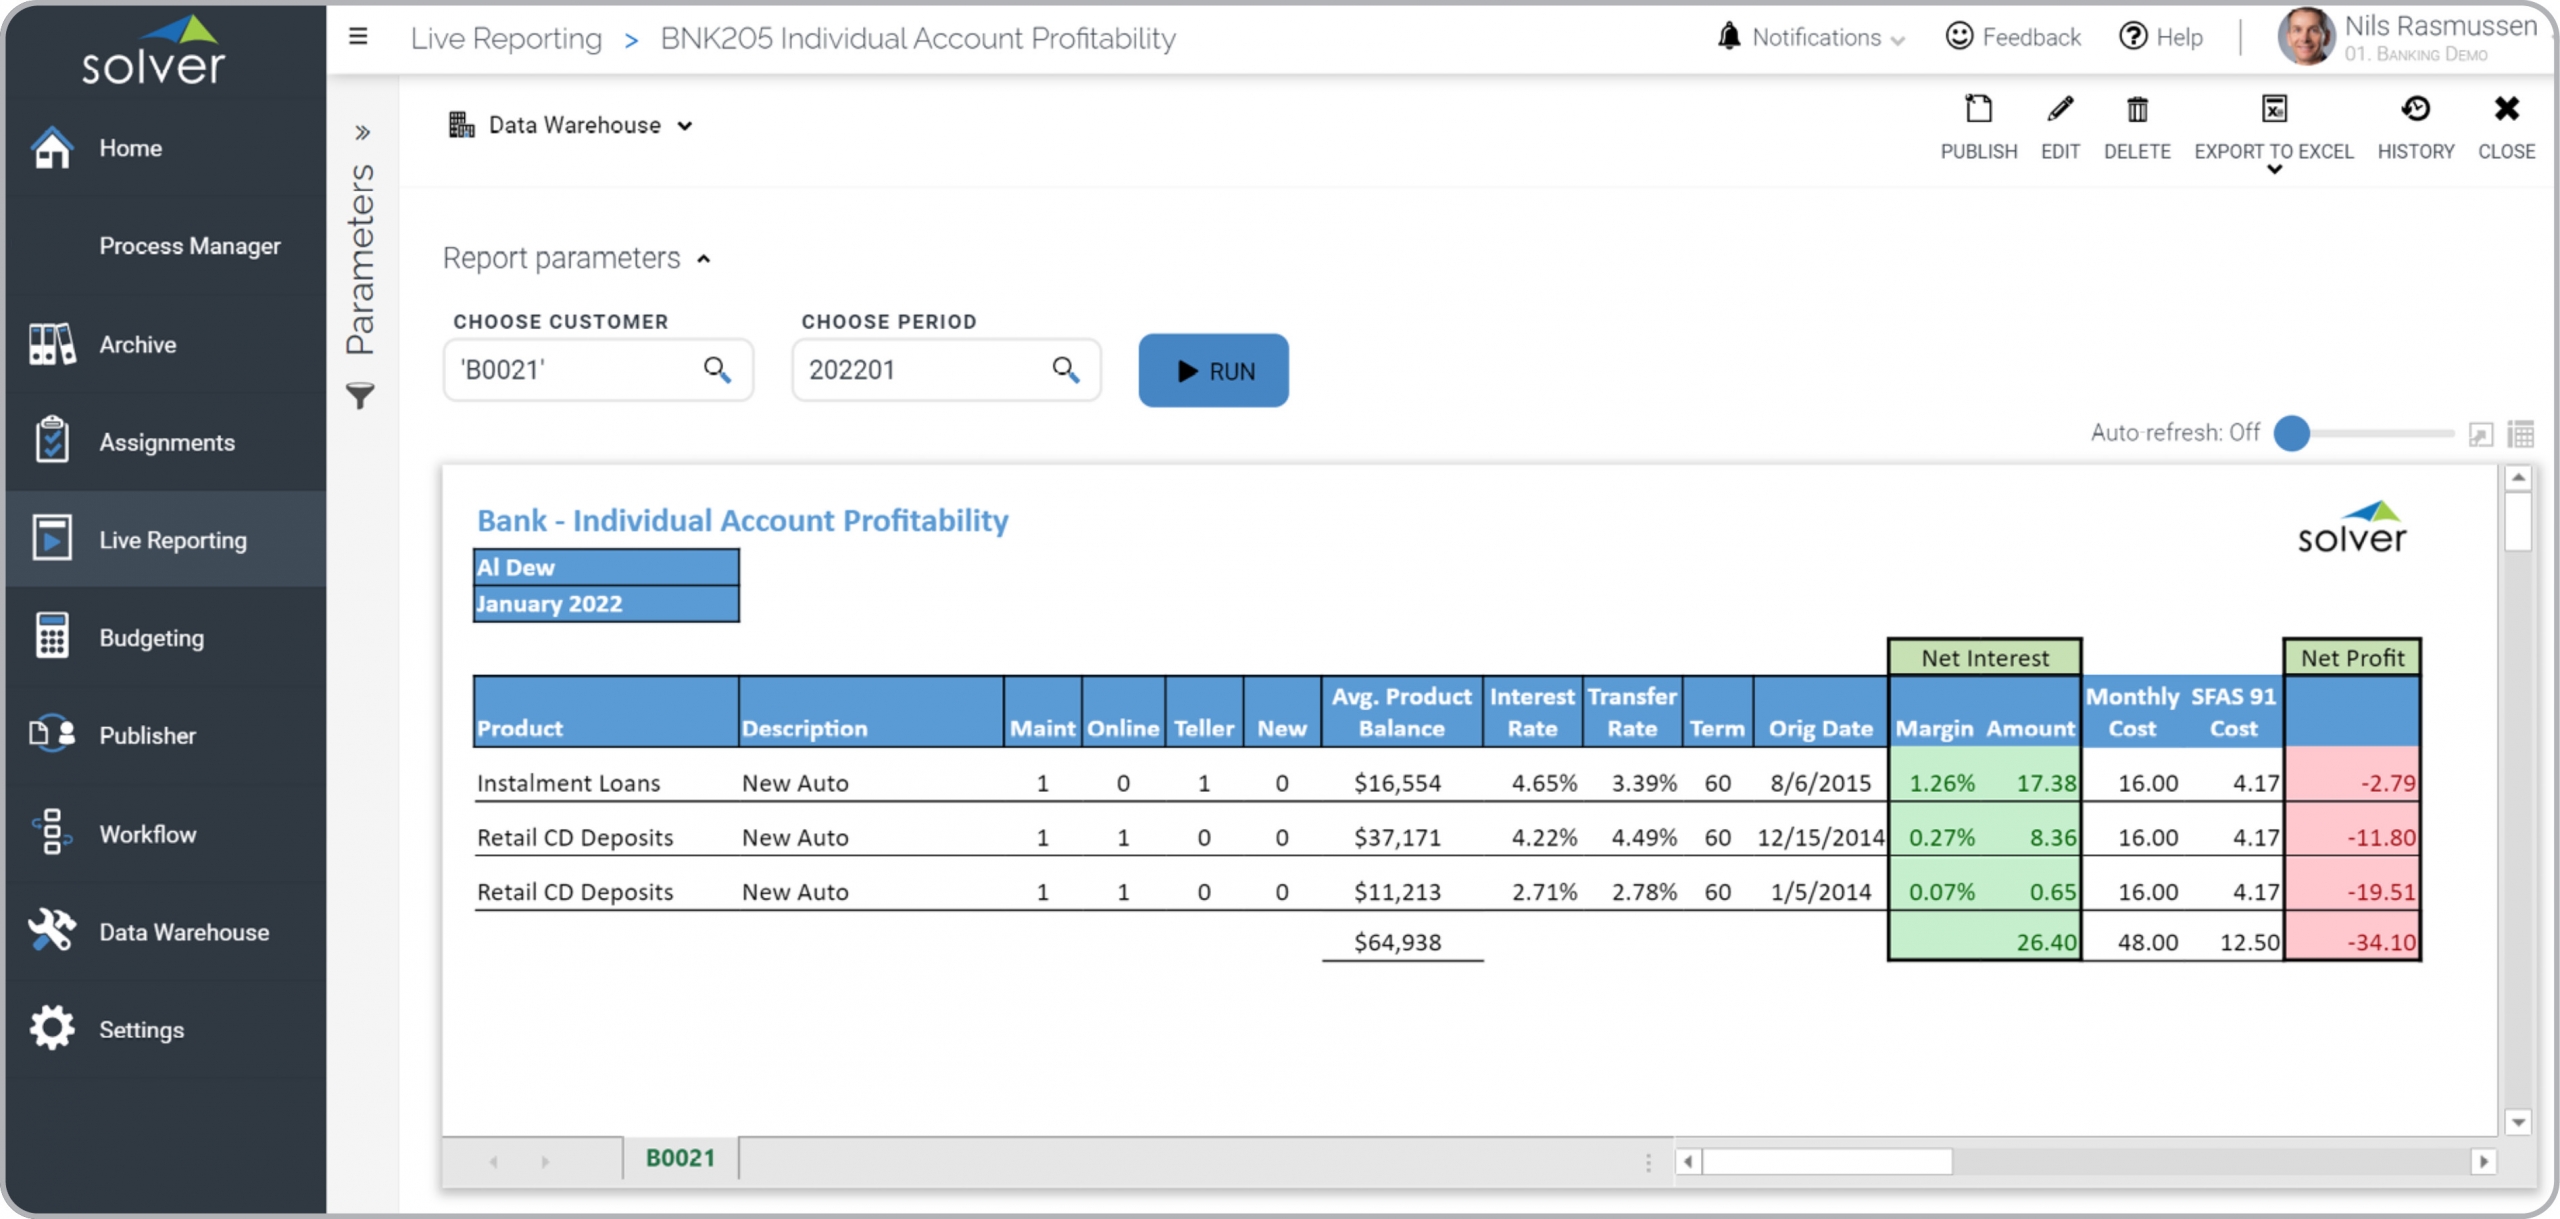
Bank – Individual Account Profitability
Monthly trend of term deposits with revenues, expenses and profit.
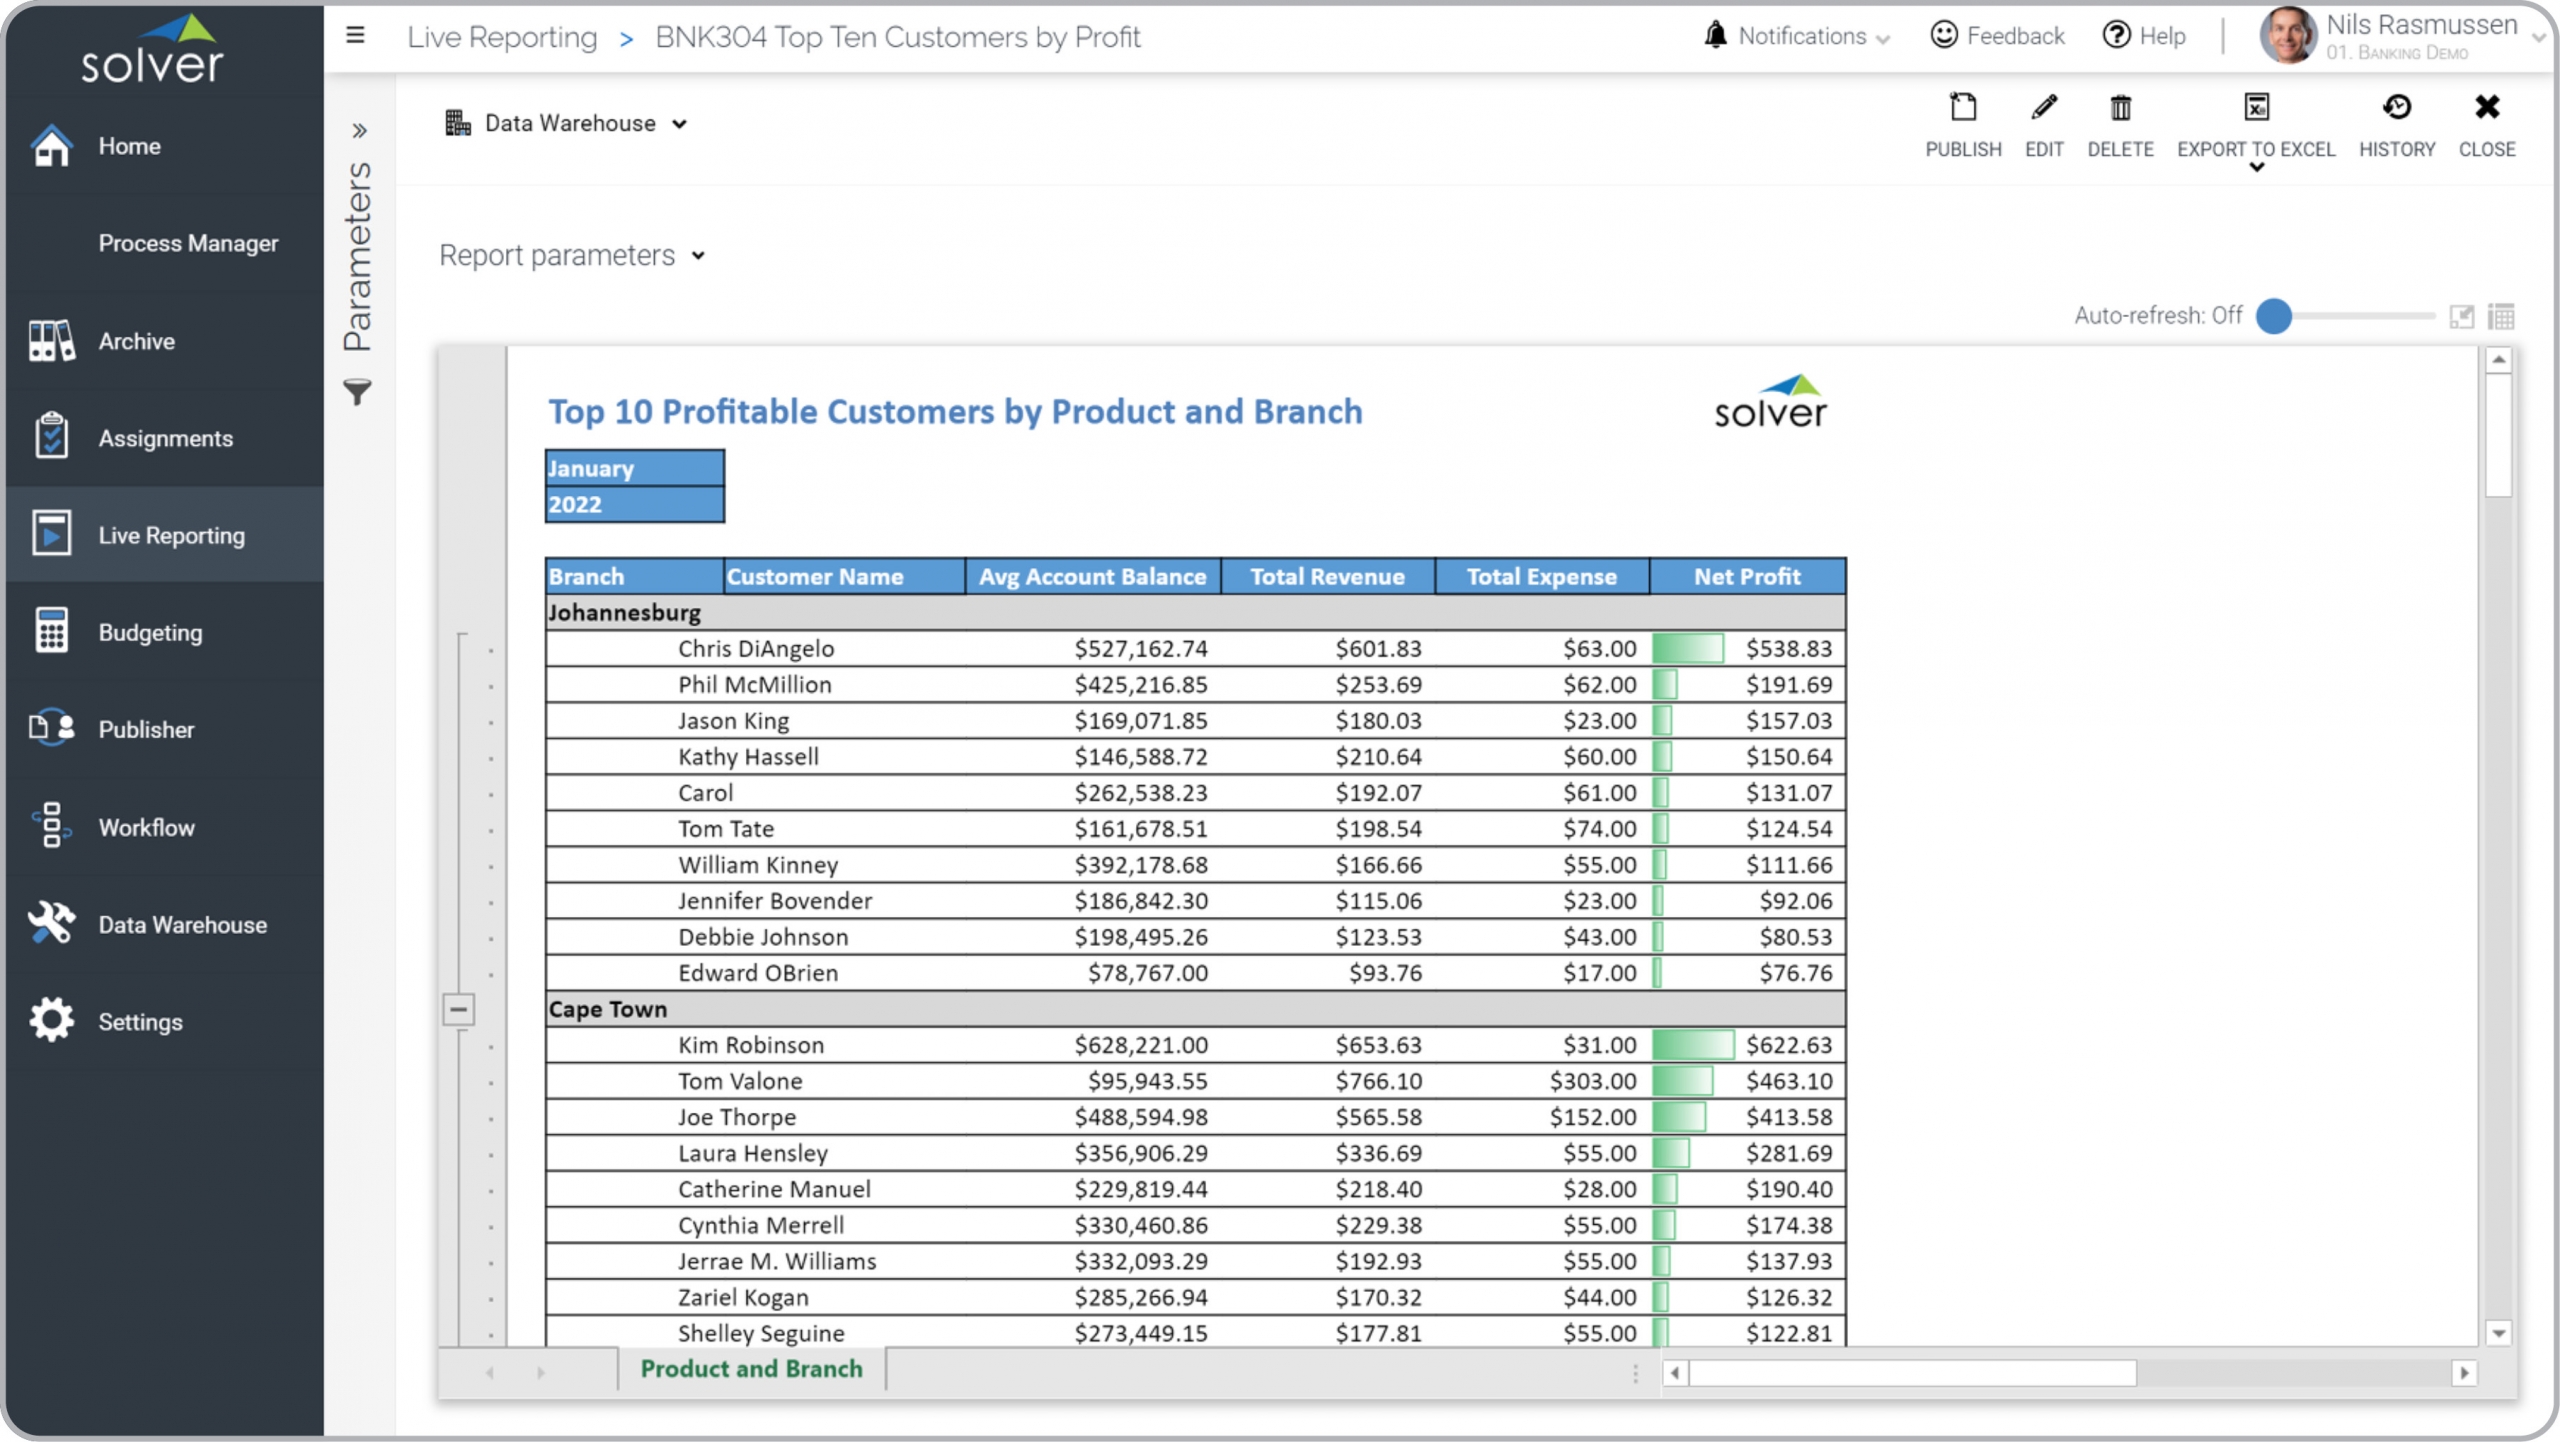
Bank – Top 10 Customers by Profit
Top customers ranked by branch and profit.
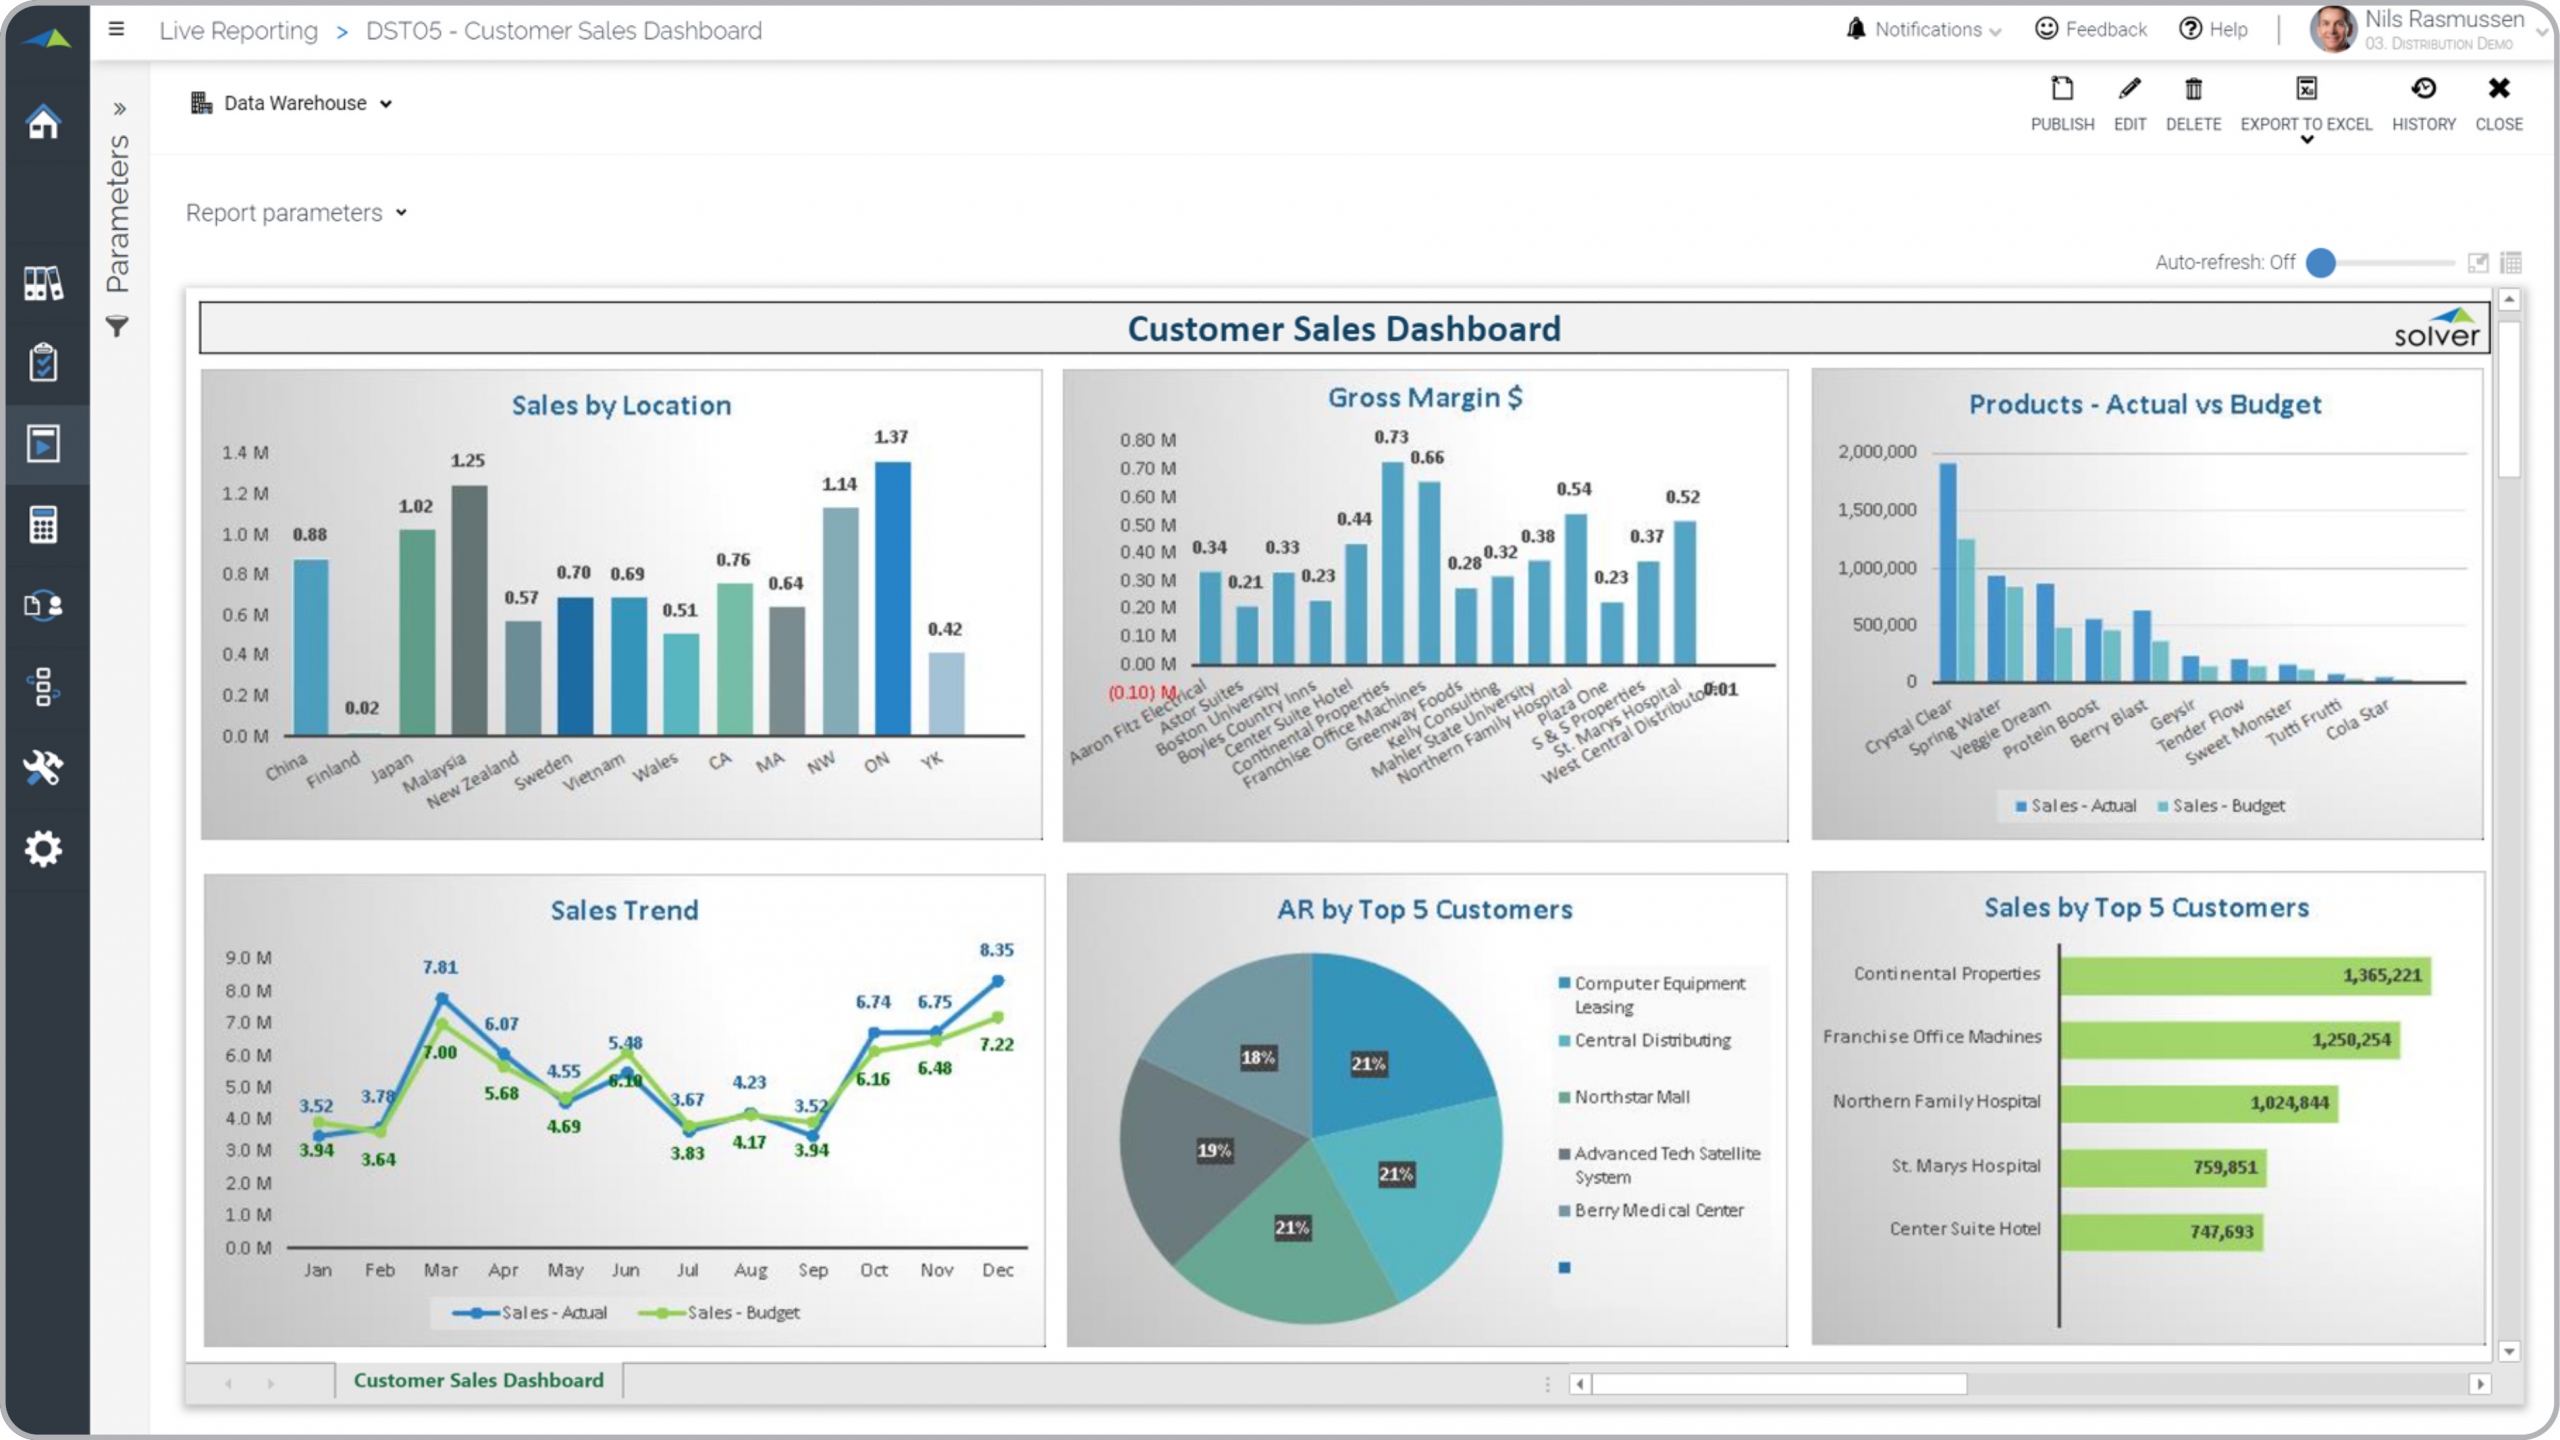
Distribution – Customer Sales Dashboard
Customer sales analysis with trends, location, gross margin and top customers.
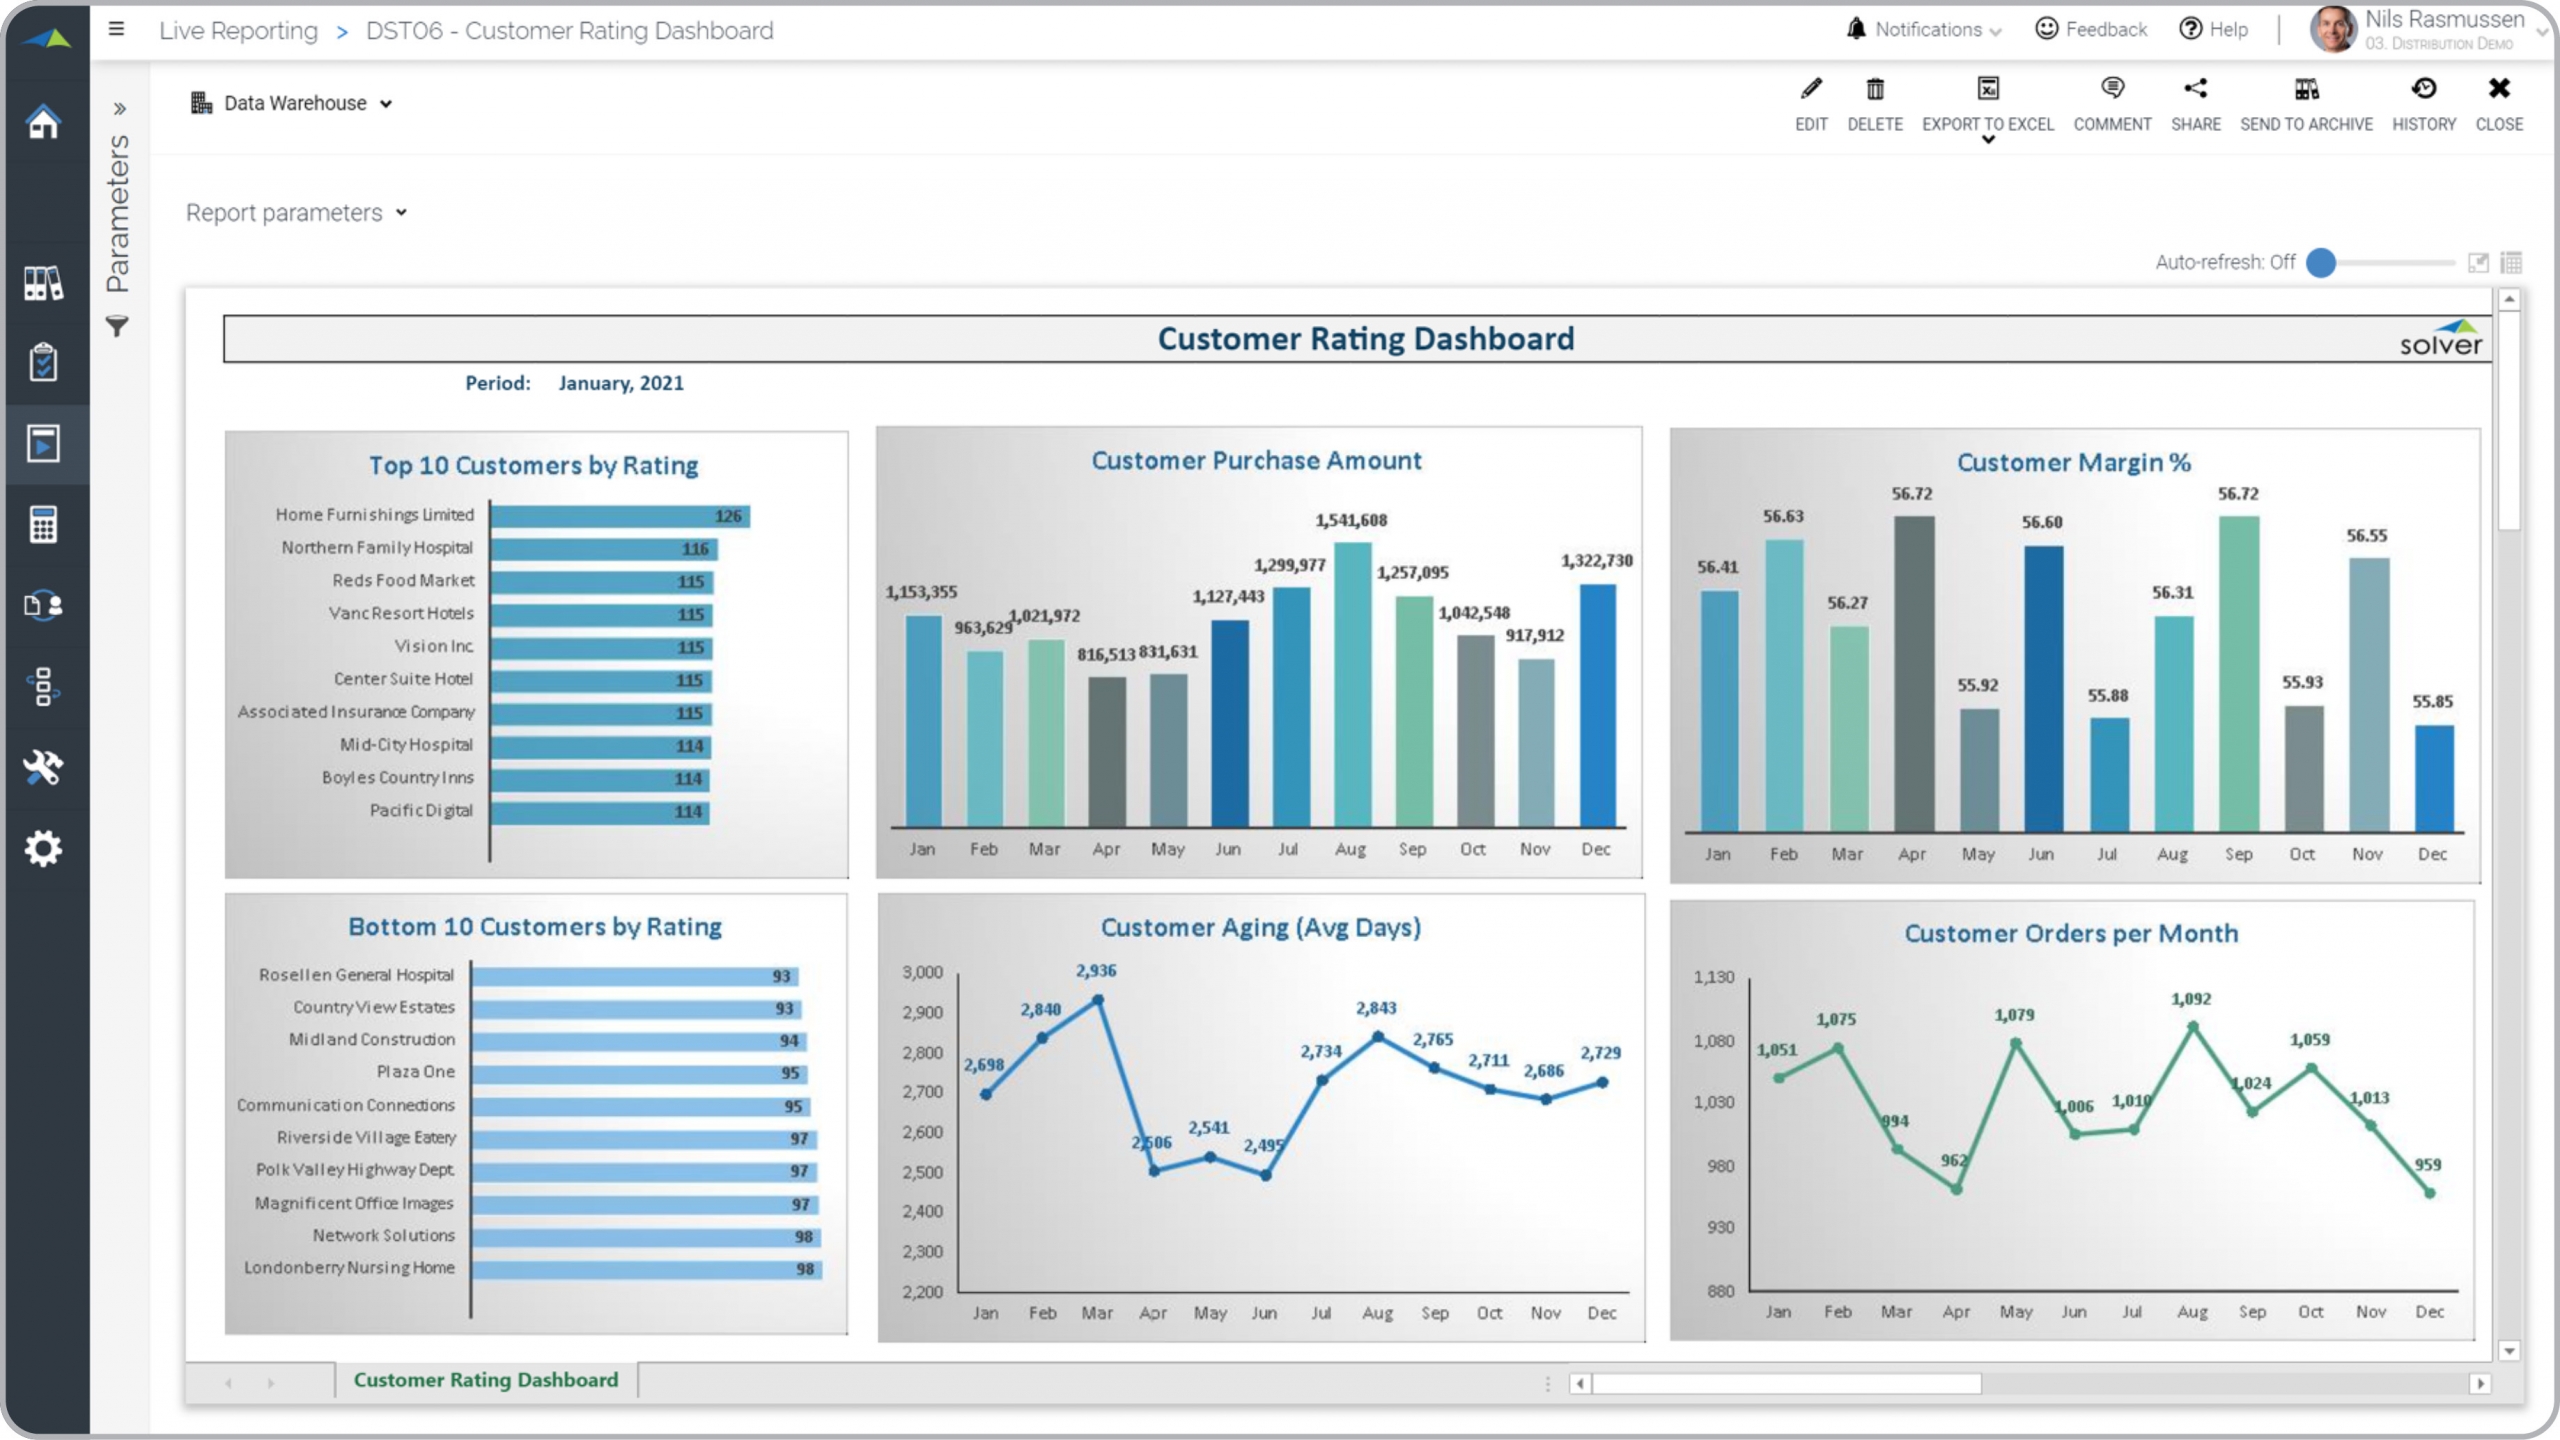
Distribution – Customer Rating Dashboard
Ranking of customers by spend, monthly trend, margin, AR aging and orders.
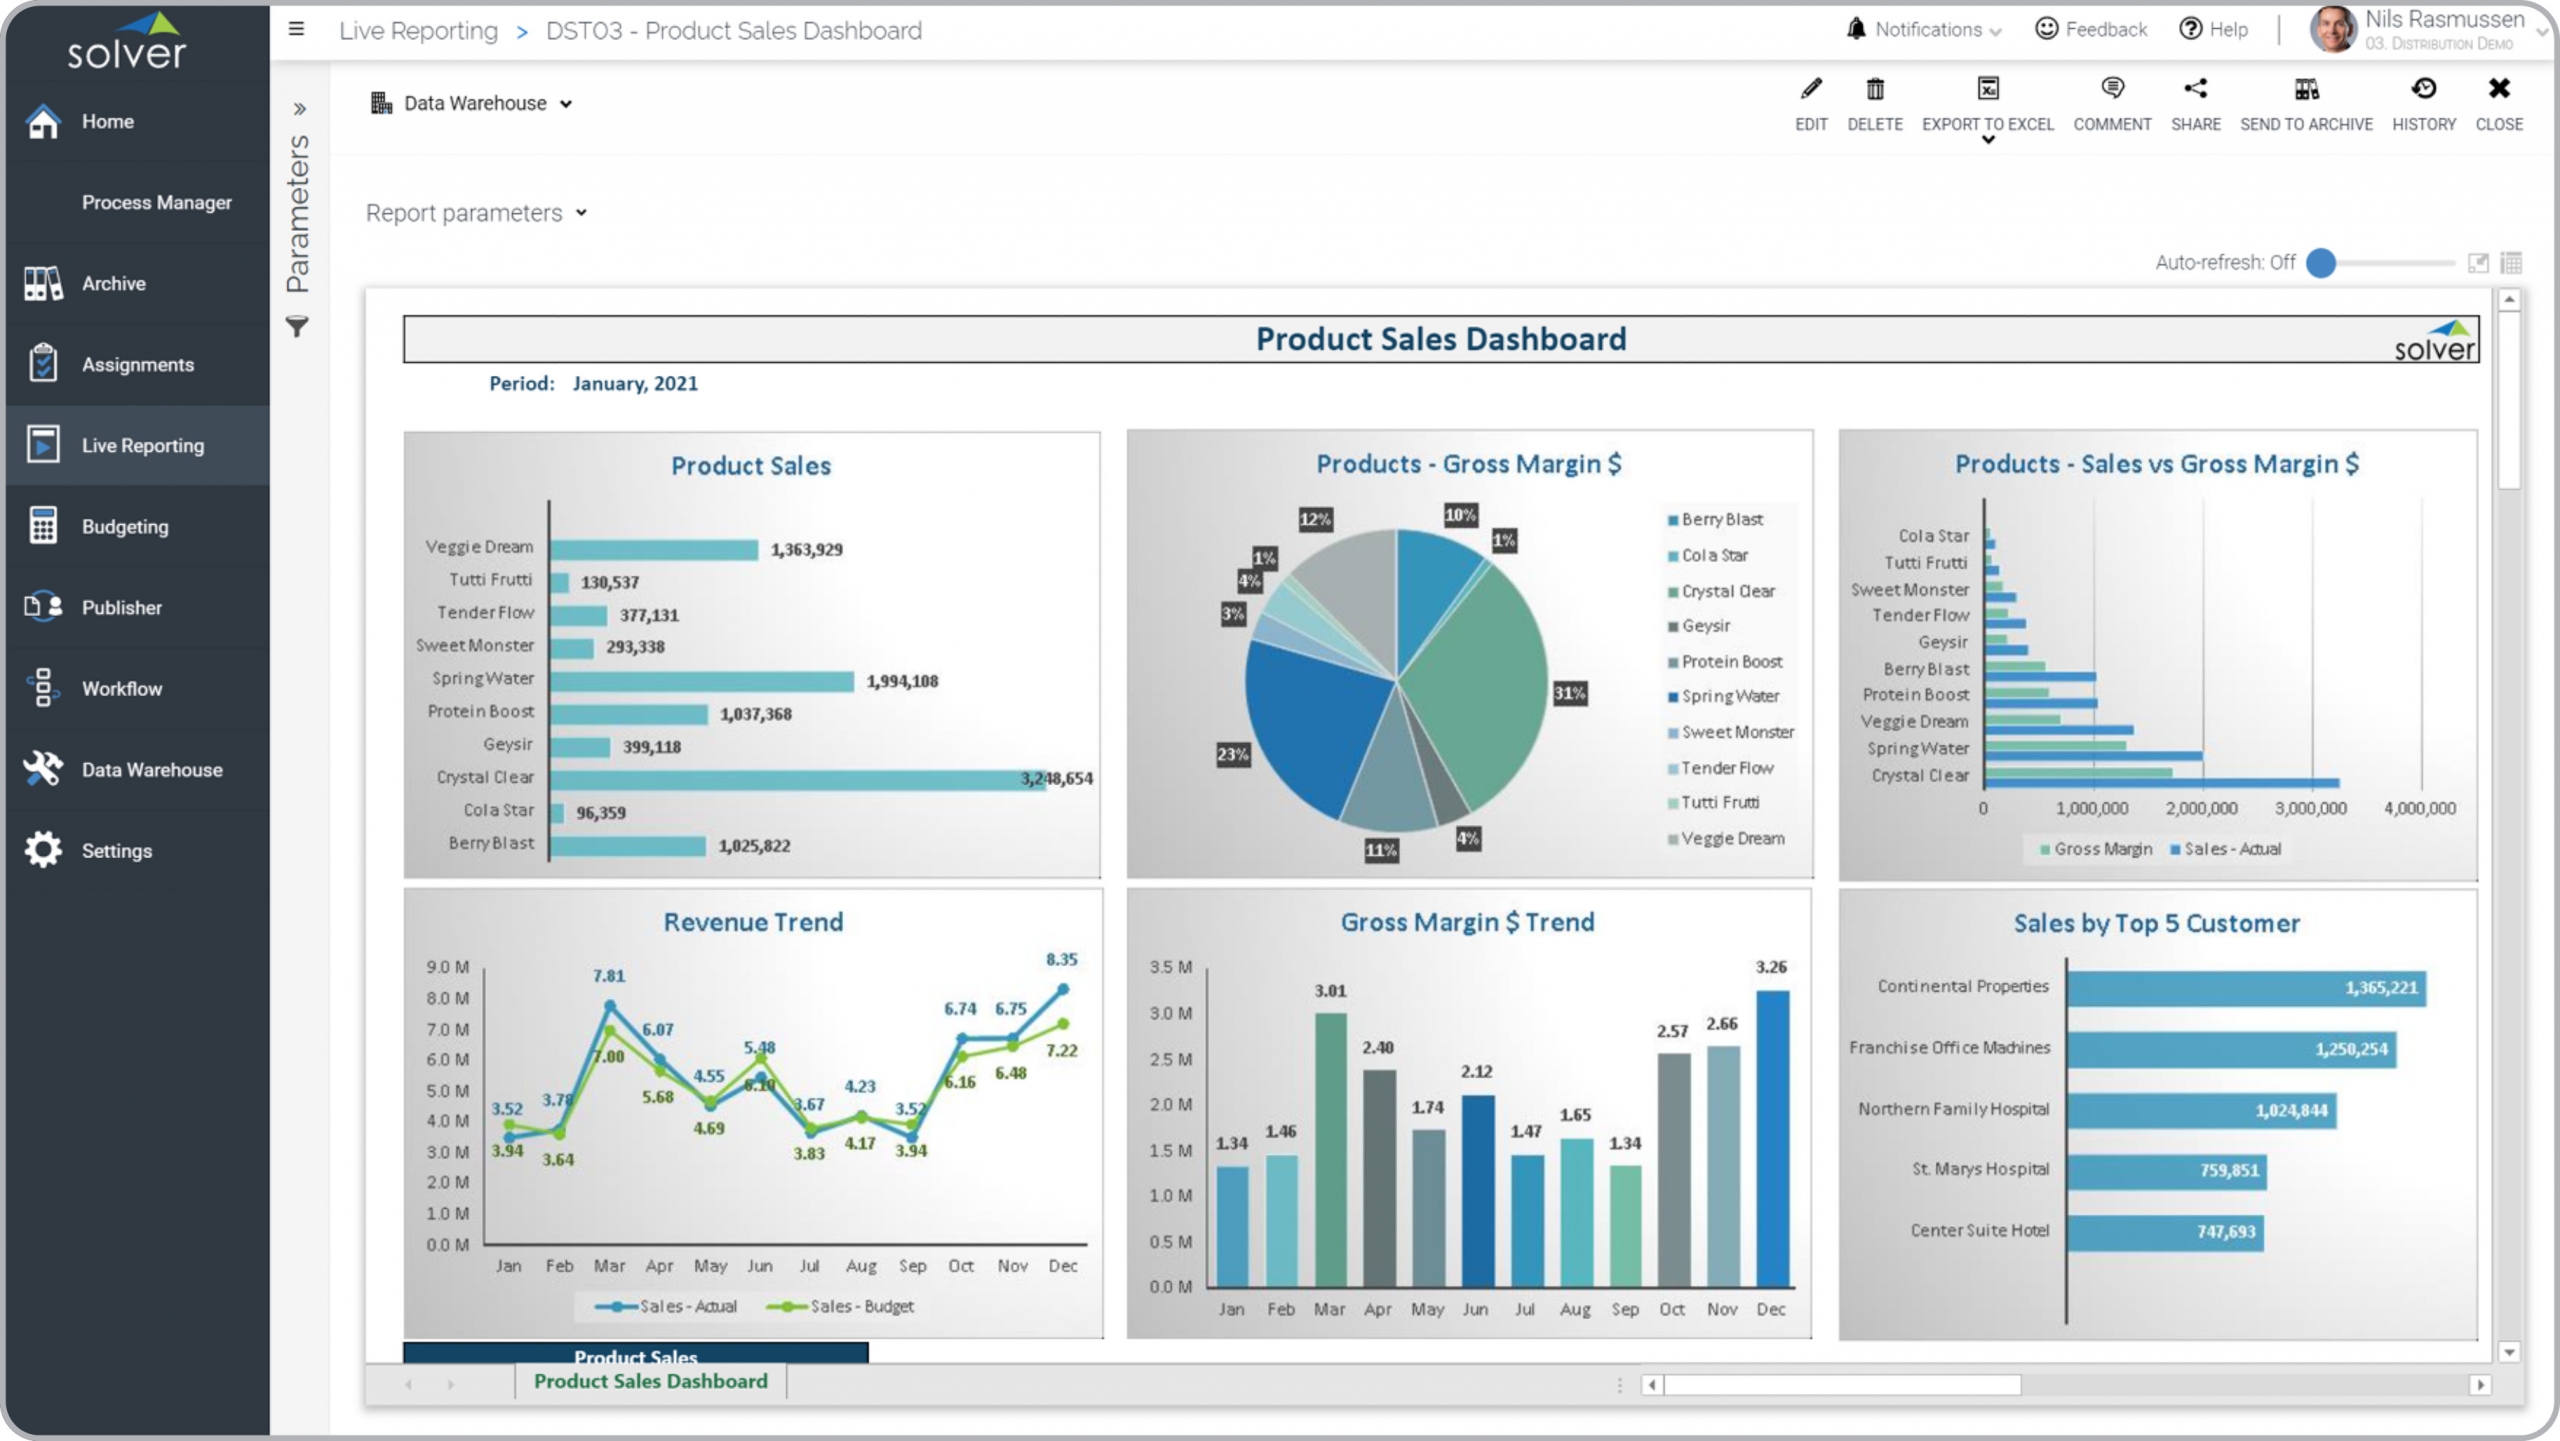
Distribution – Product Sales Dashboard
Summary view of product sales KPIs with revenue trend, sales by product and gross margin.
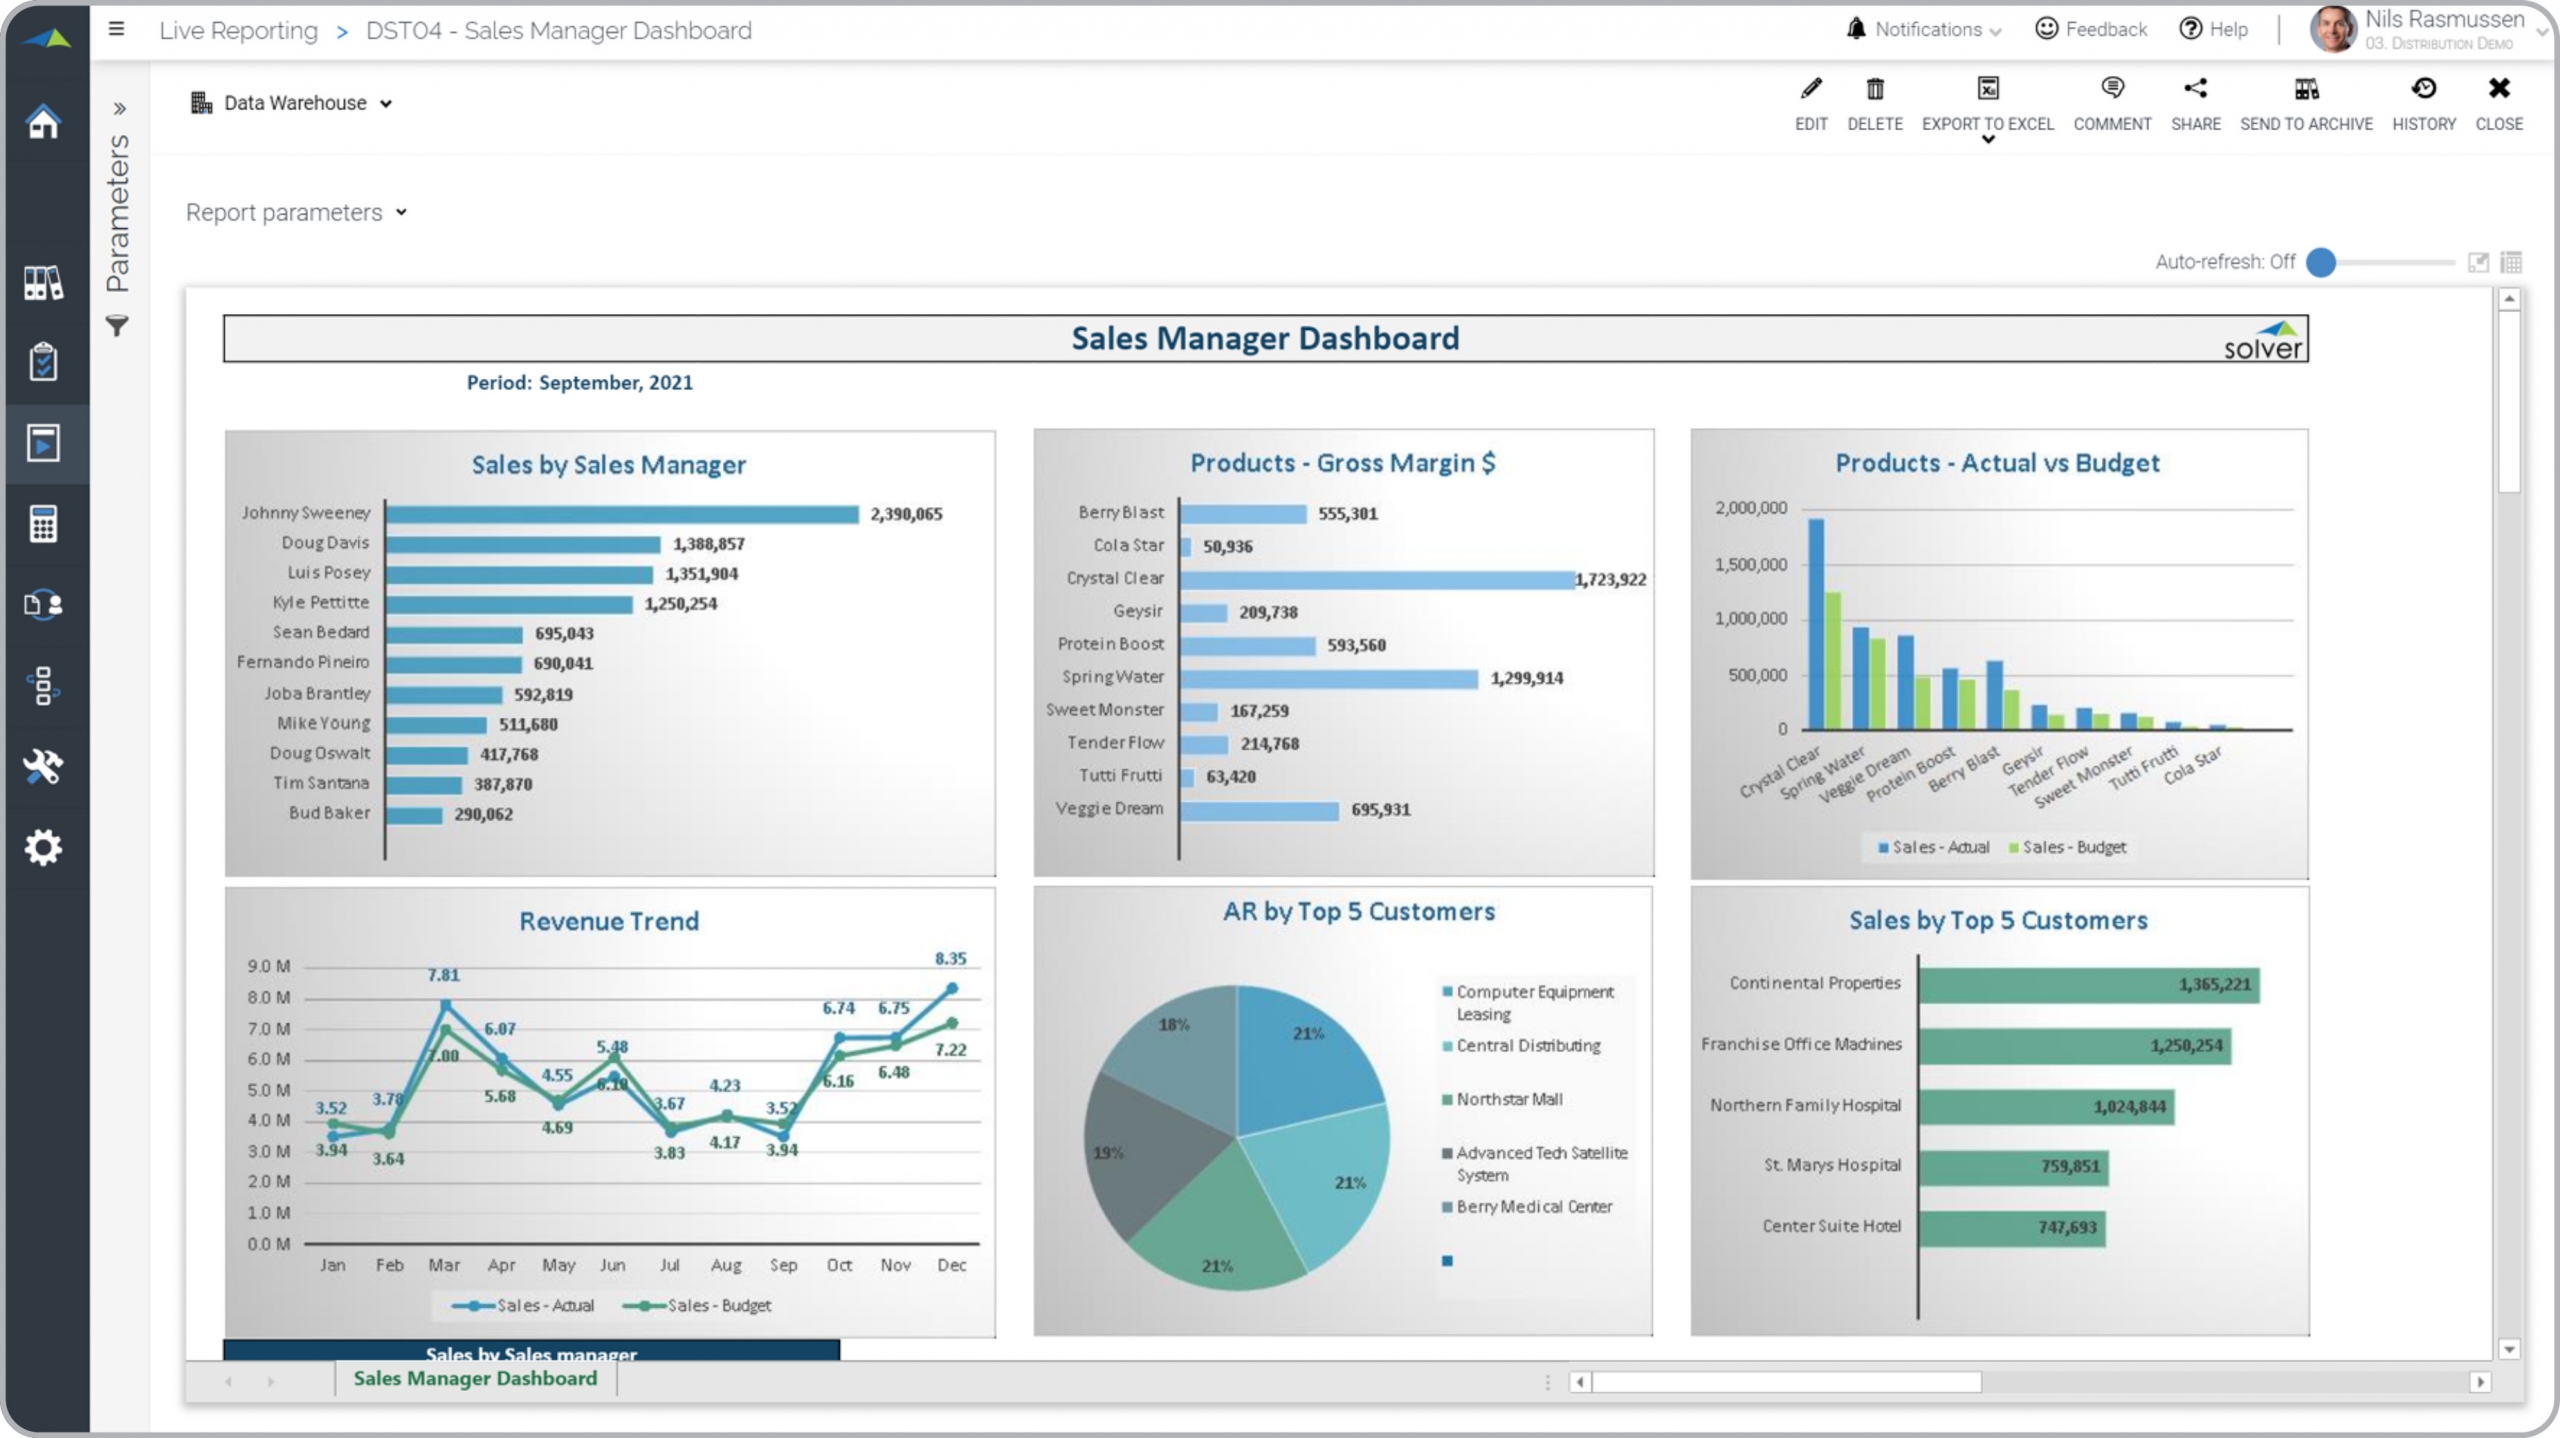
Distribution – Sales Manager Dashboard
Top KPIs for a manager, incl. sales by customer and product, gross margin and AR.
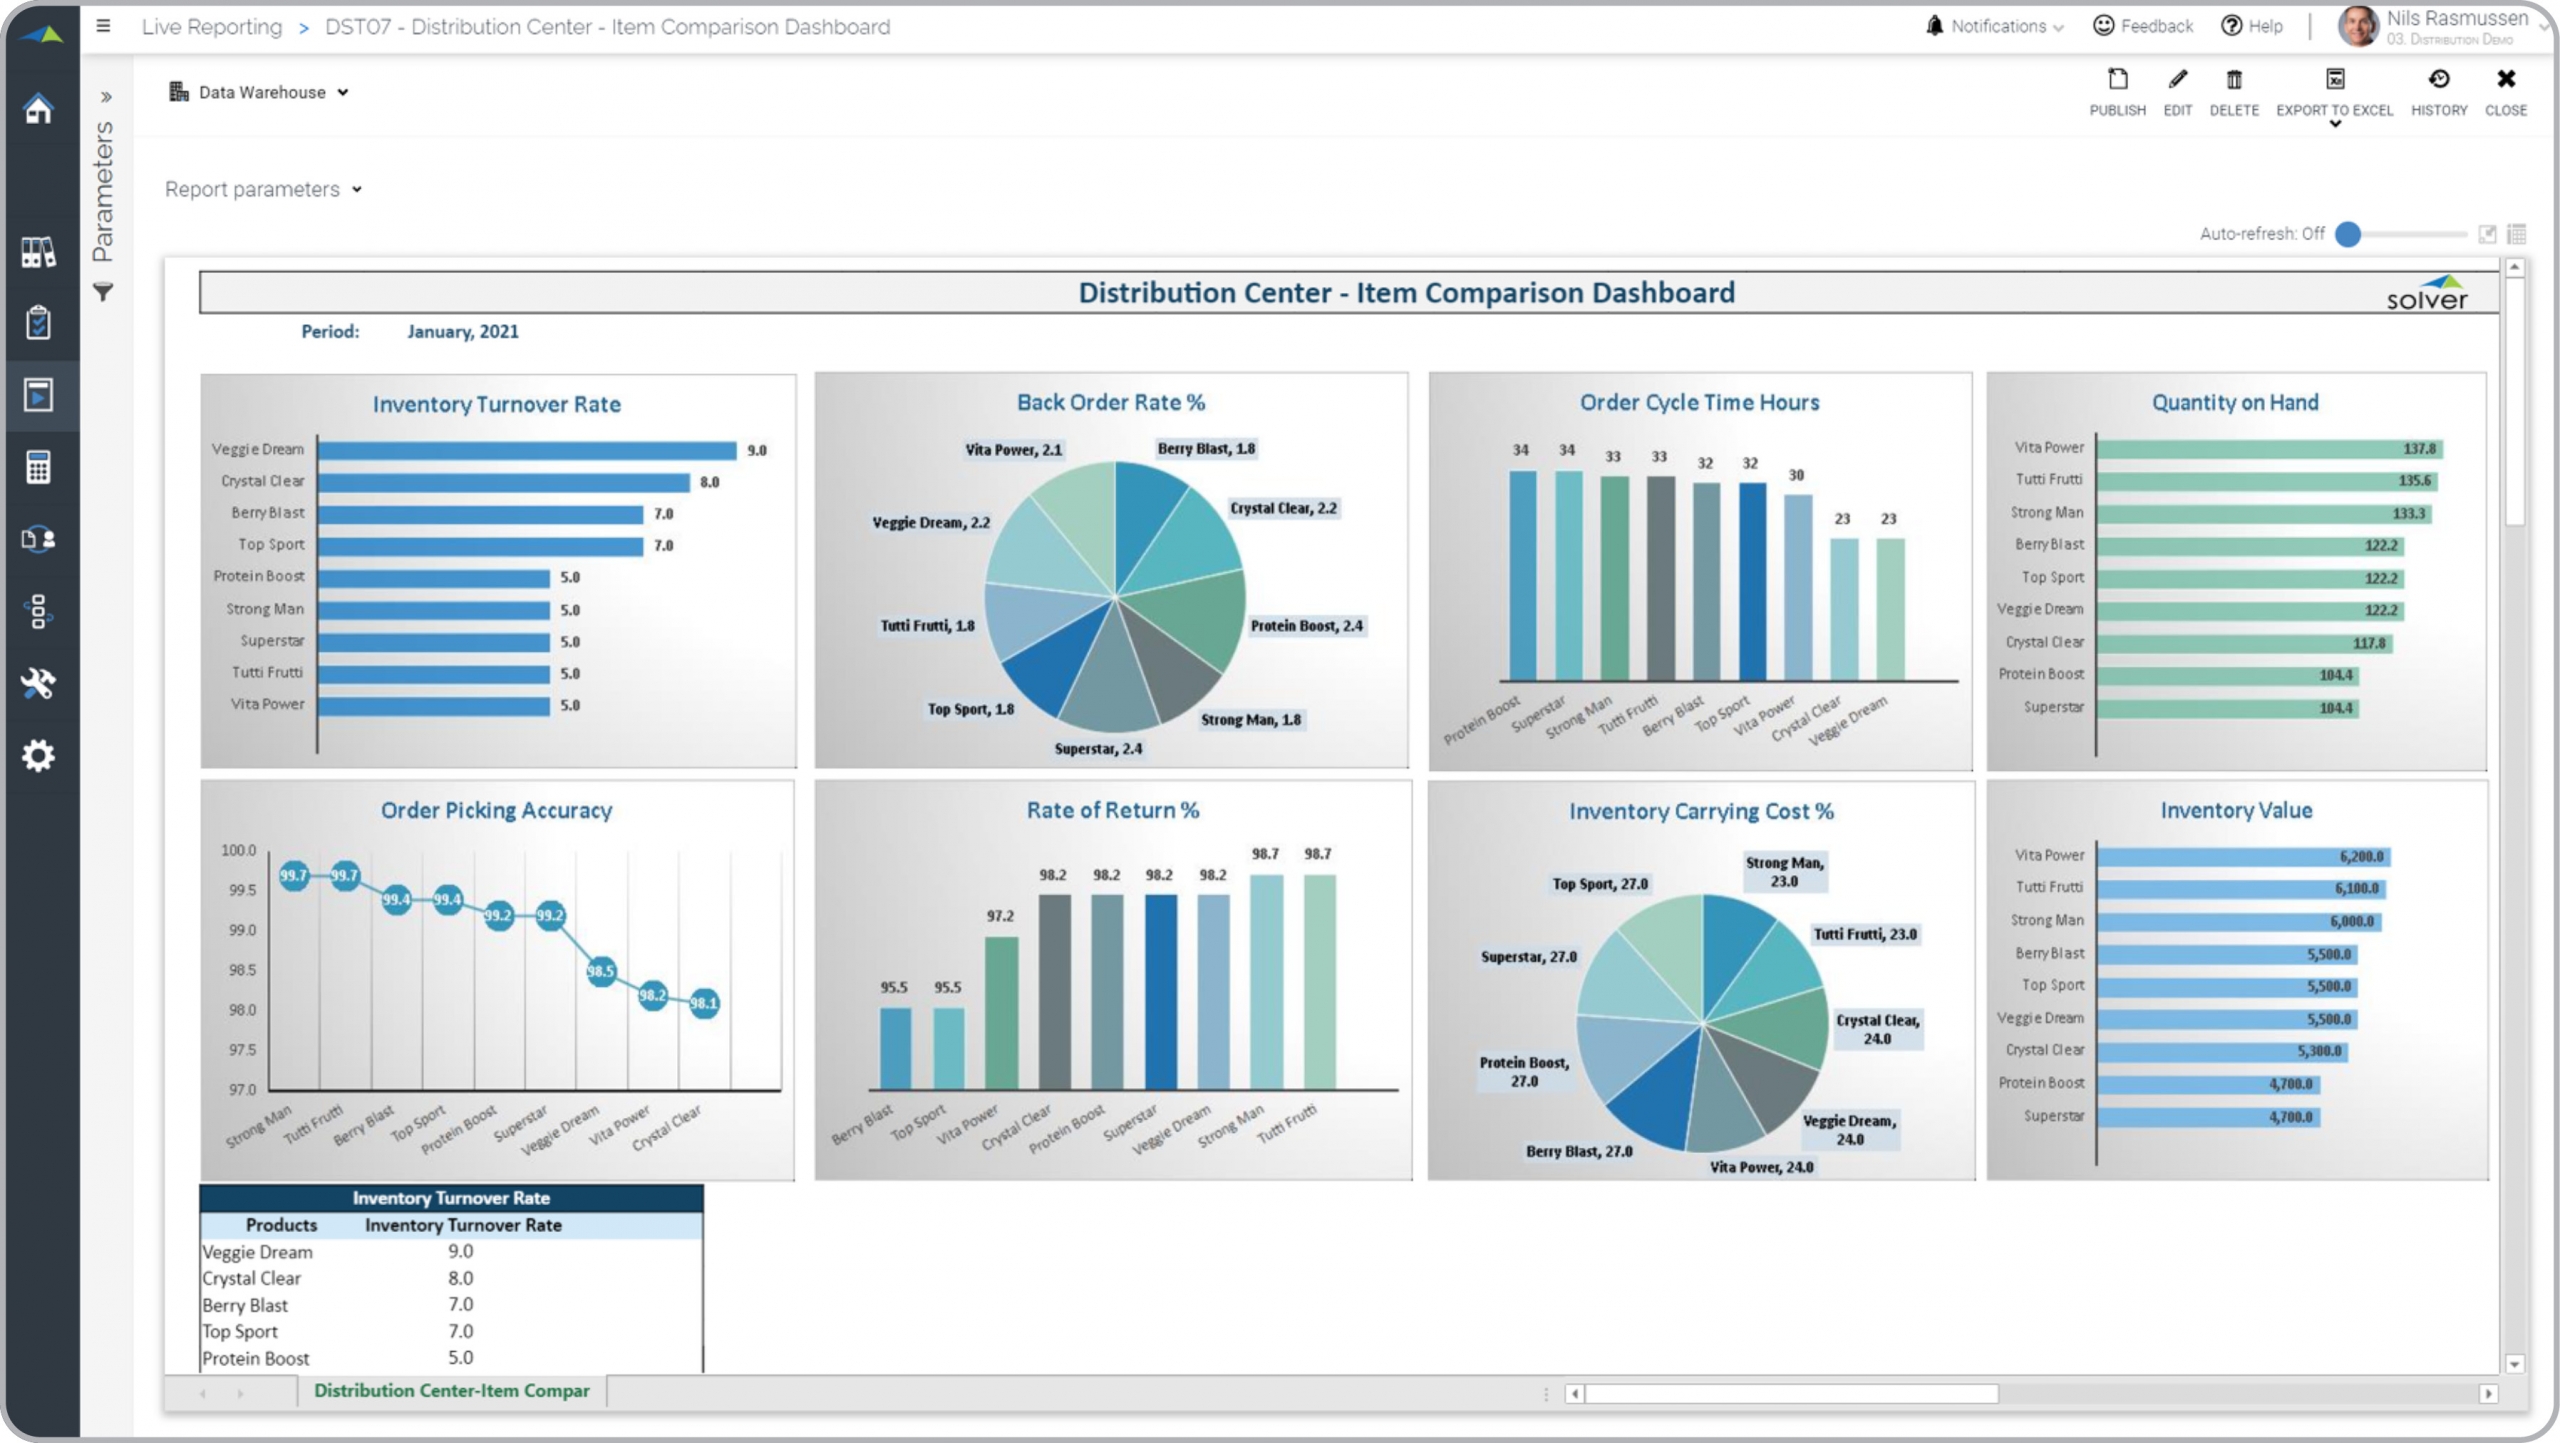
Distribution – Distribution Center – Item Comparison
Comparison of items for different KPIs incl. turnover, back order, cycle time, inventory value.
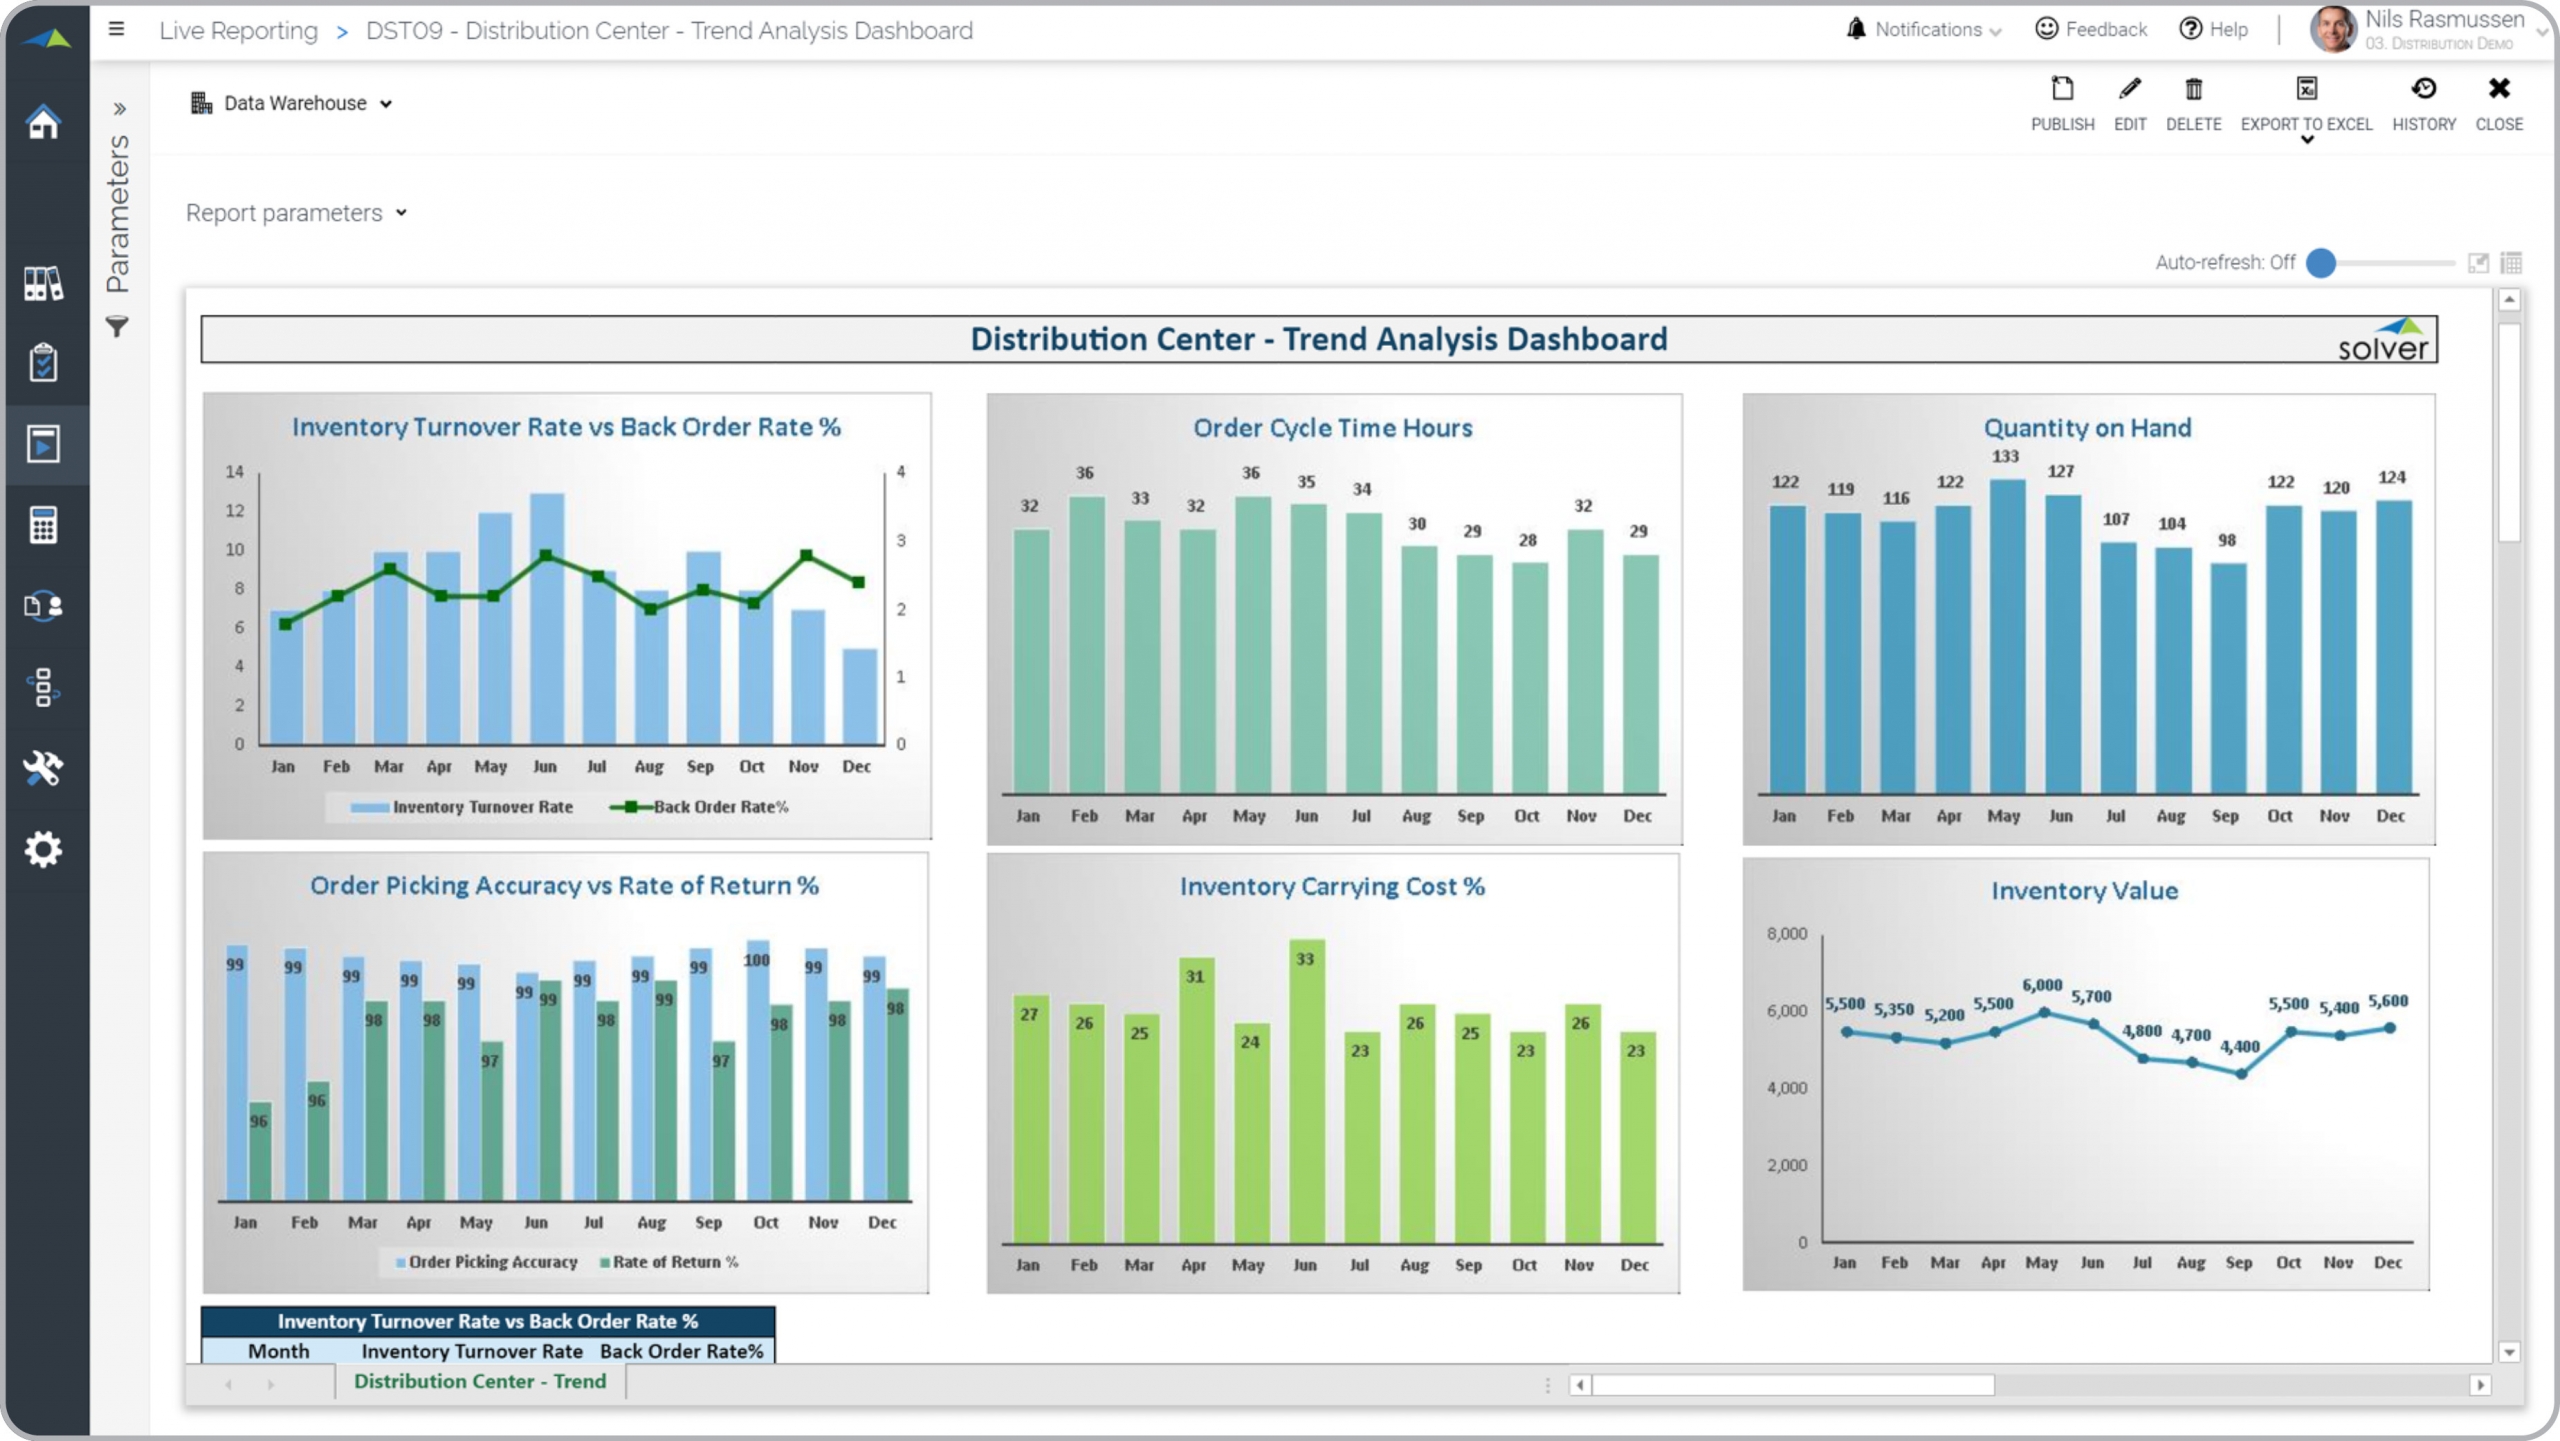
Distribution – Distribution Center – Trend Analysis
Monthly trend analysis for distribution center KPIs.
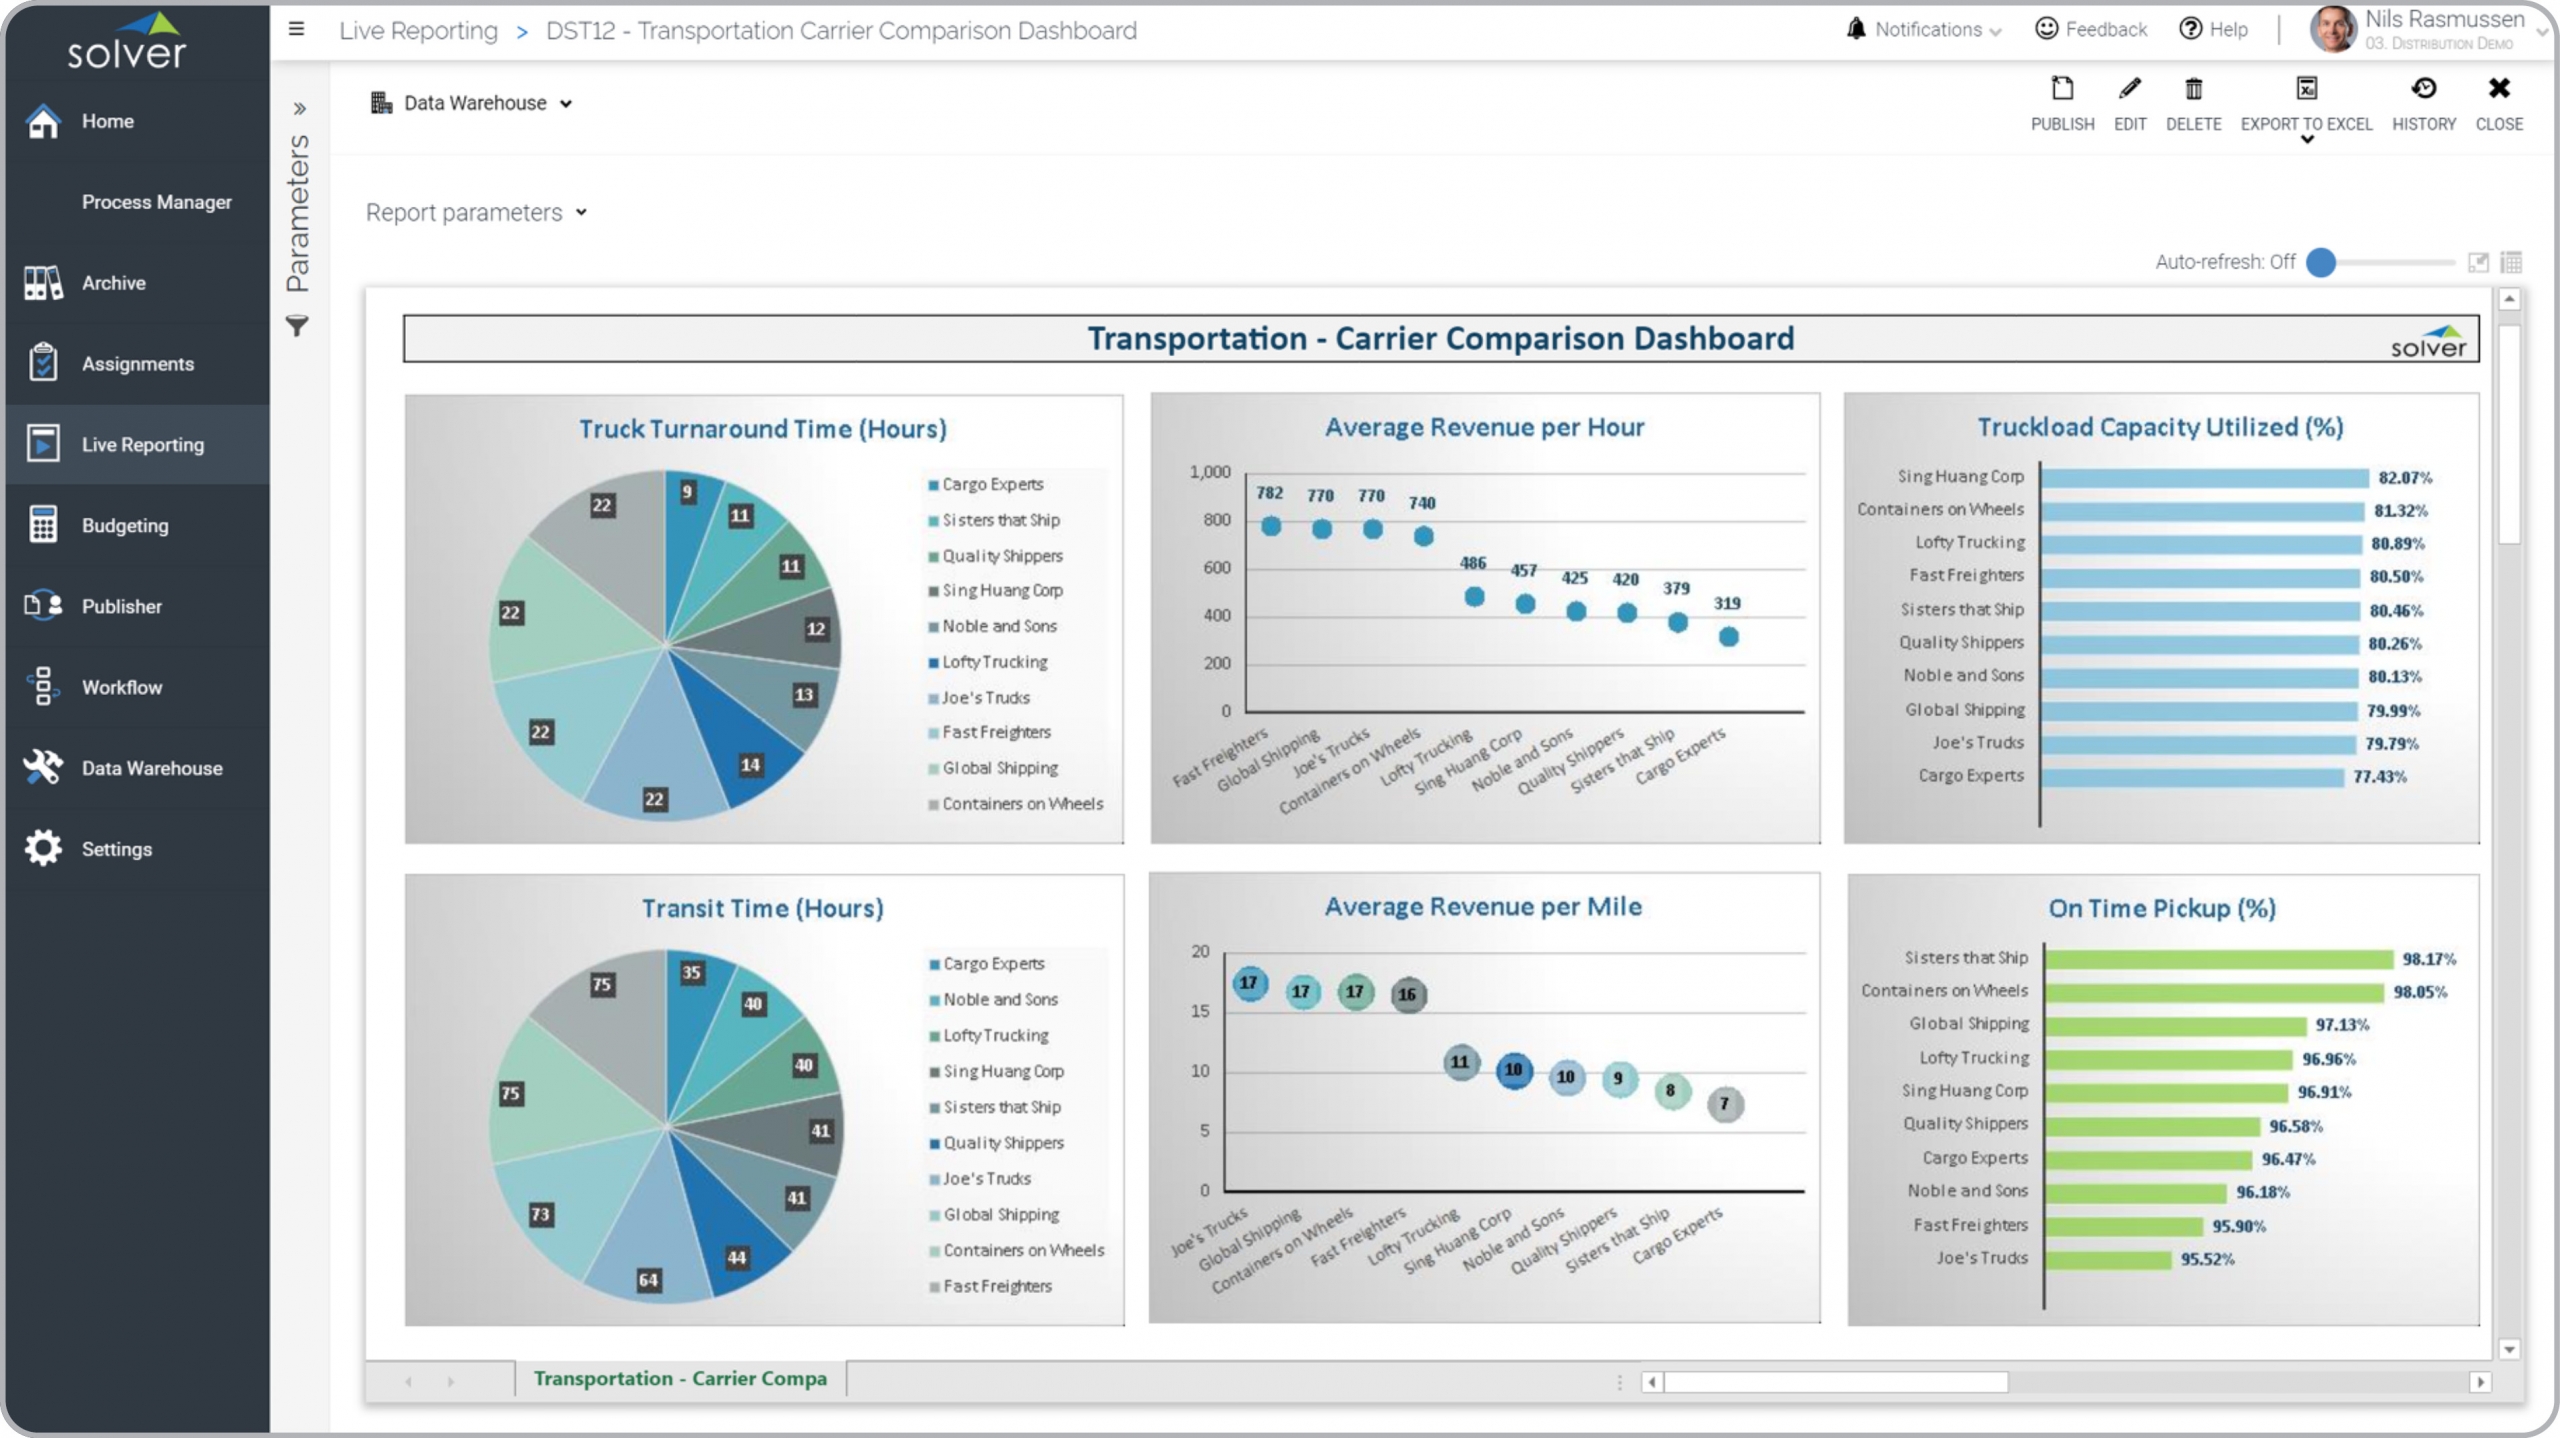
Distribution – Transportation Carrier Comparison Analysis
Comparison and rating of suppliers for KPIs like on time pickup, transit time, etc.
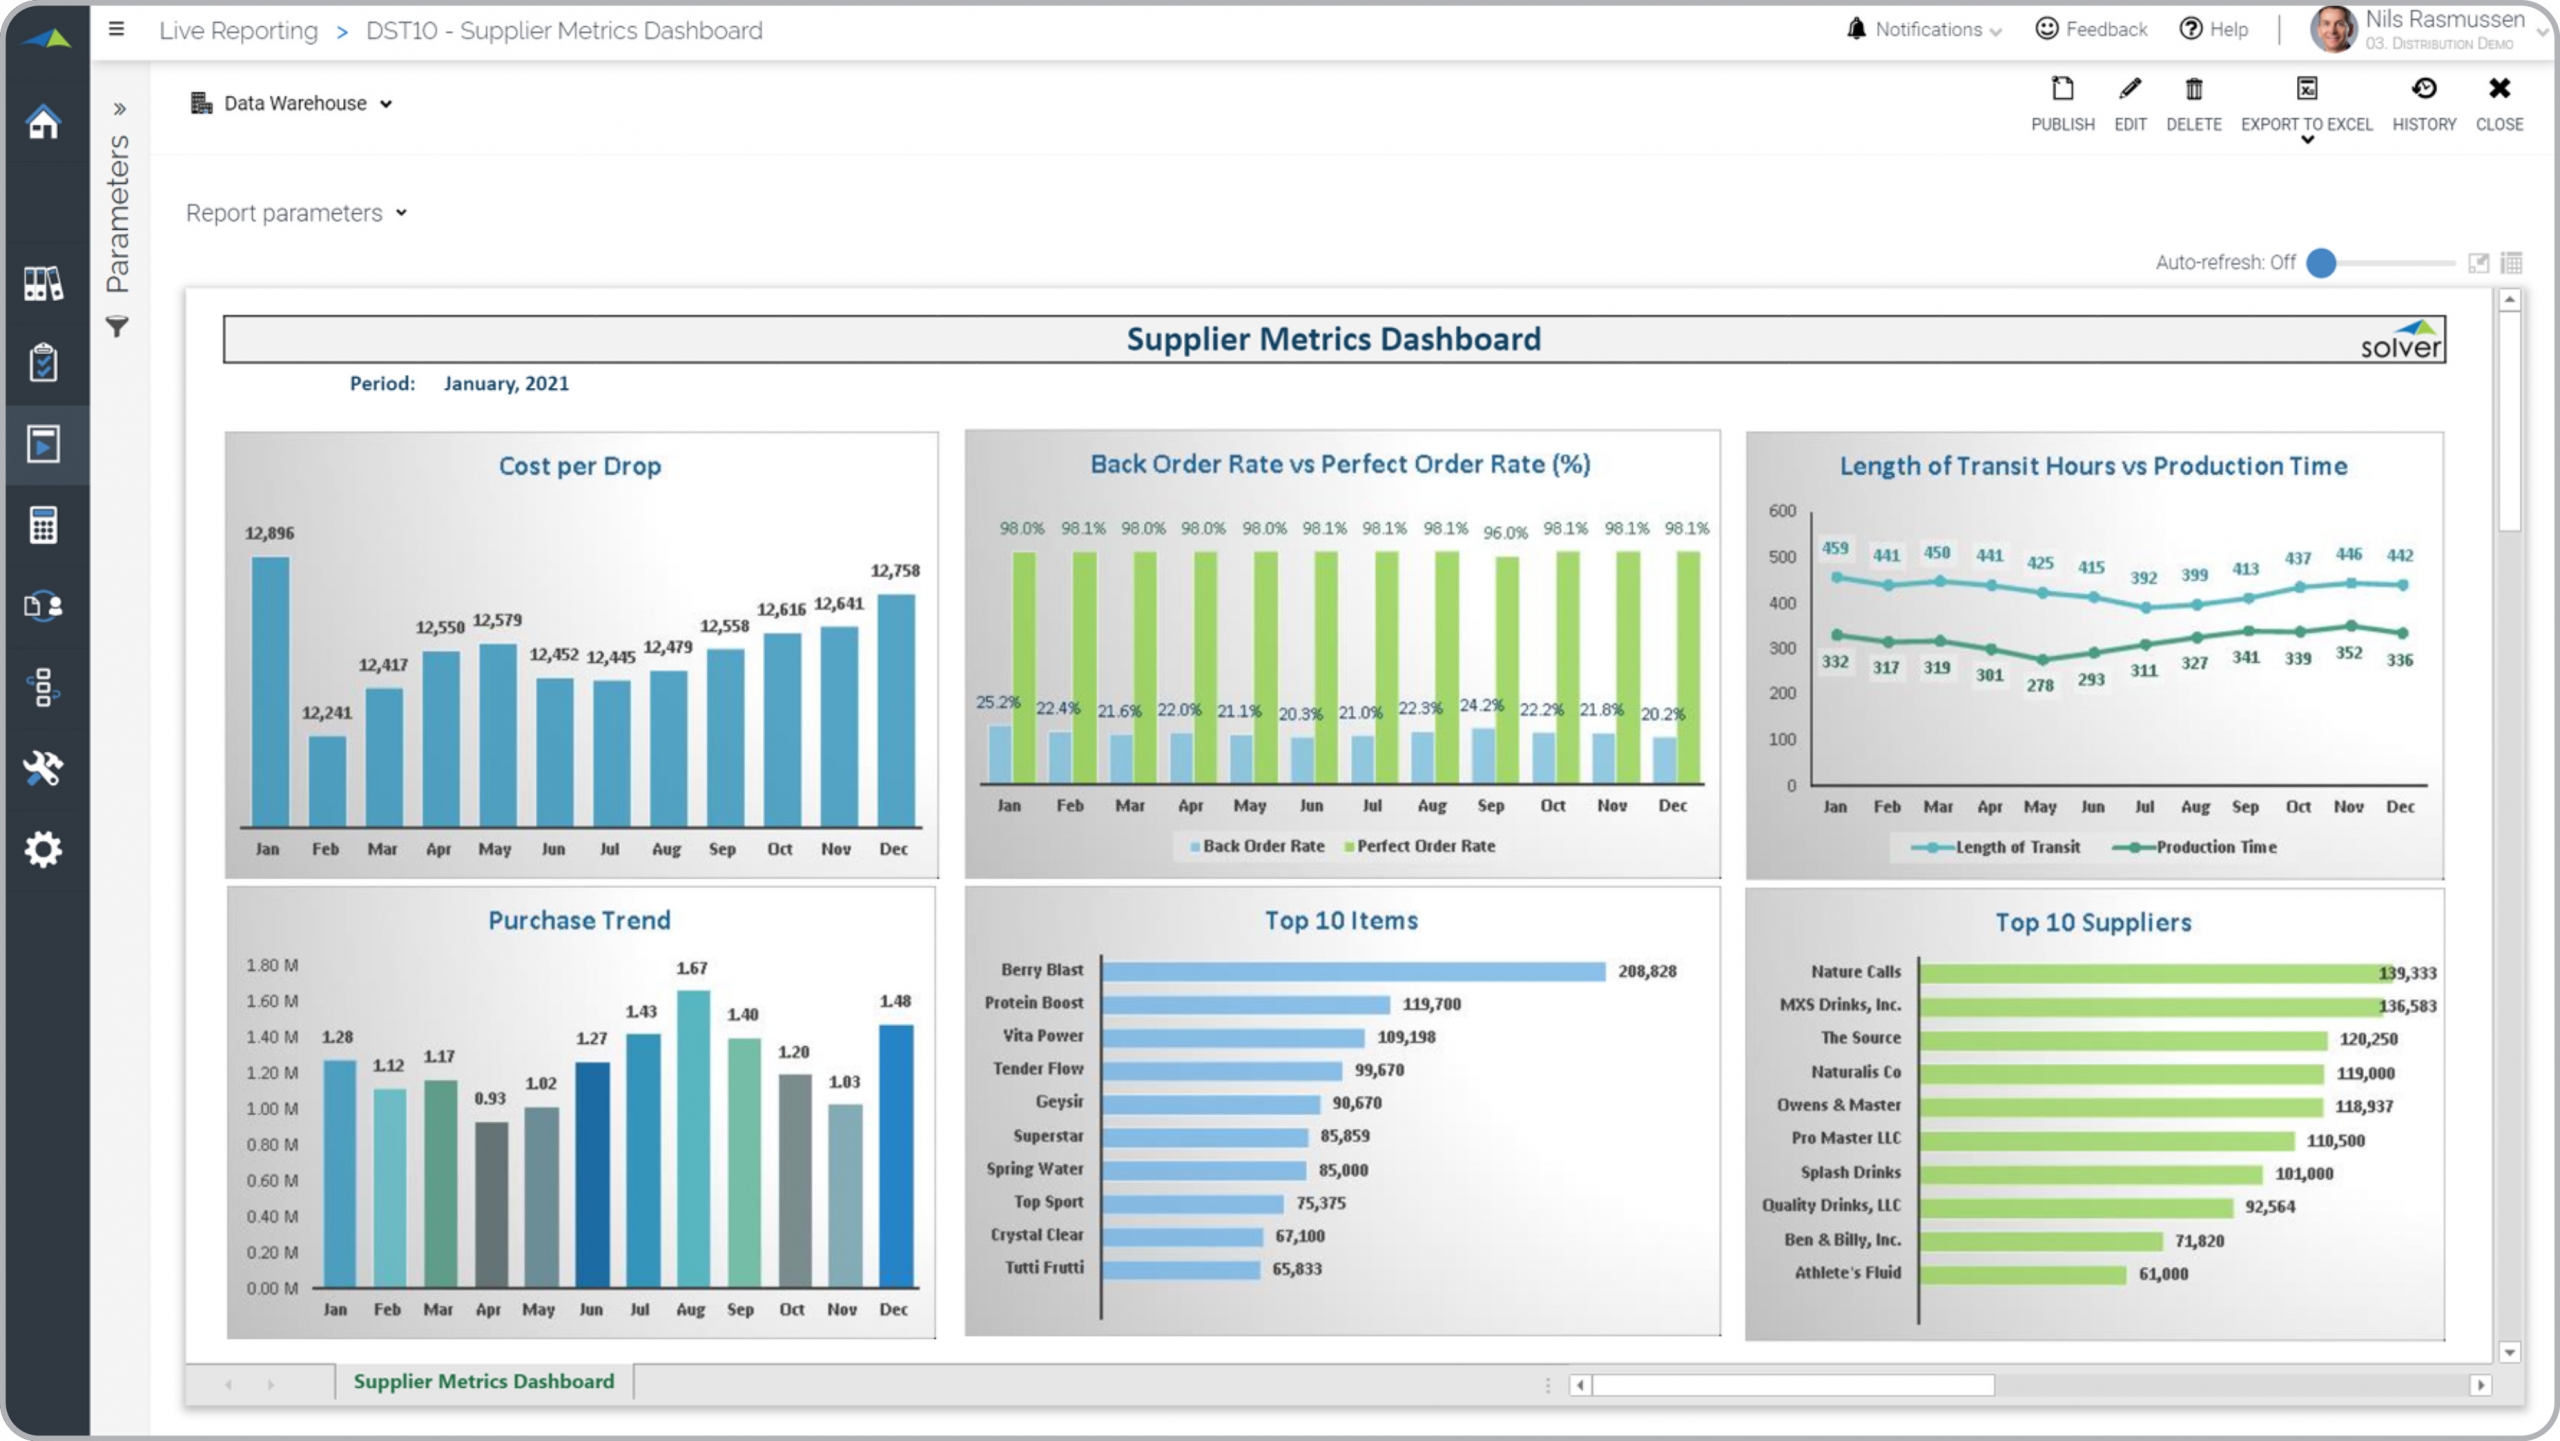
Distribution – Supplier Metrics
Analysis of monthly trends and supplier KPIs, including Top 10 suppliers and items.
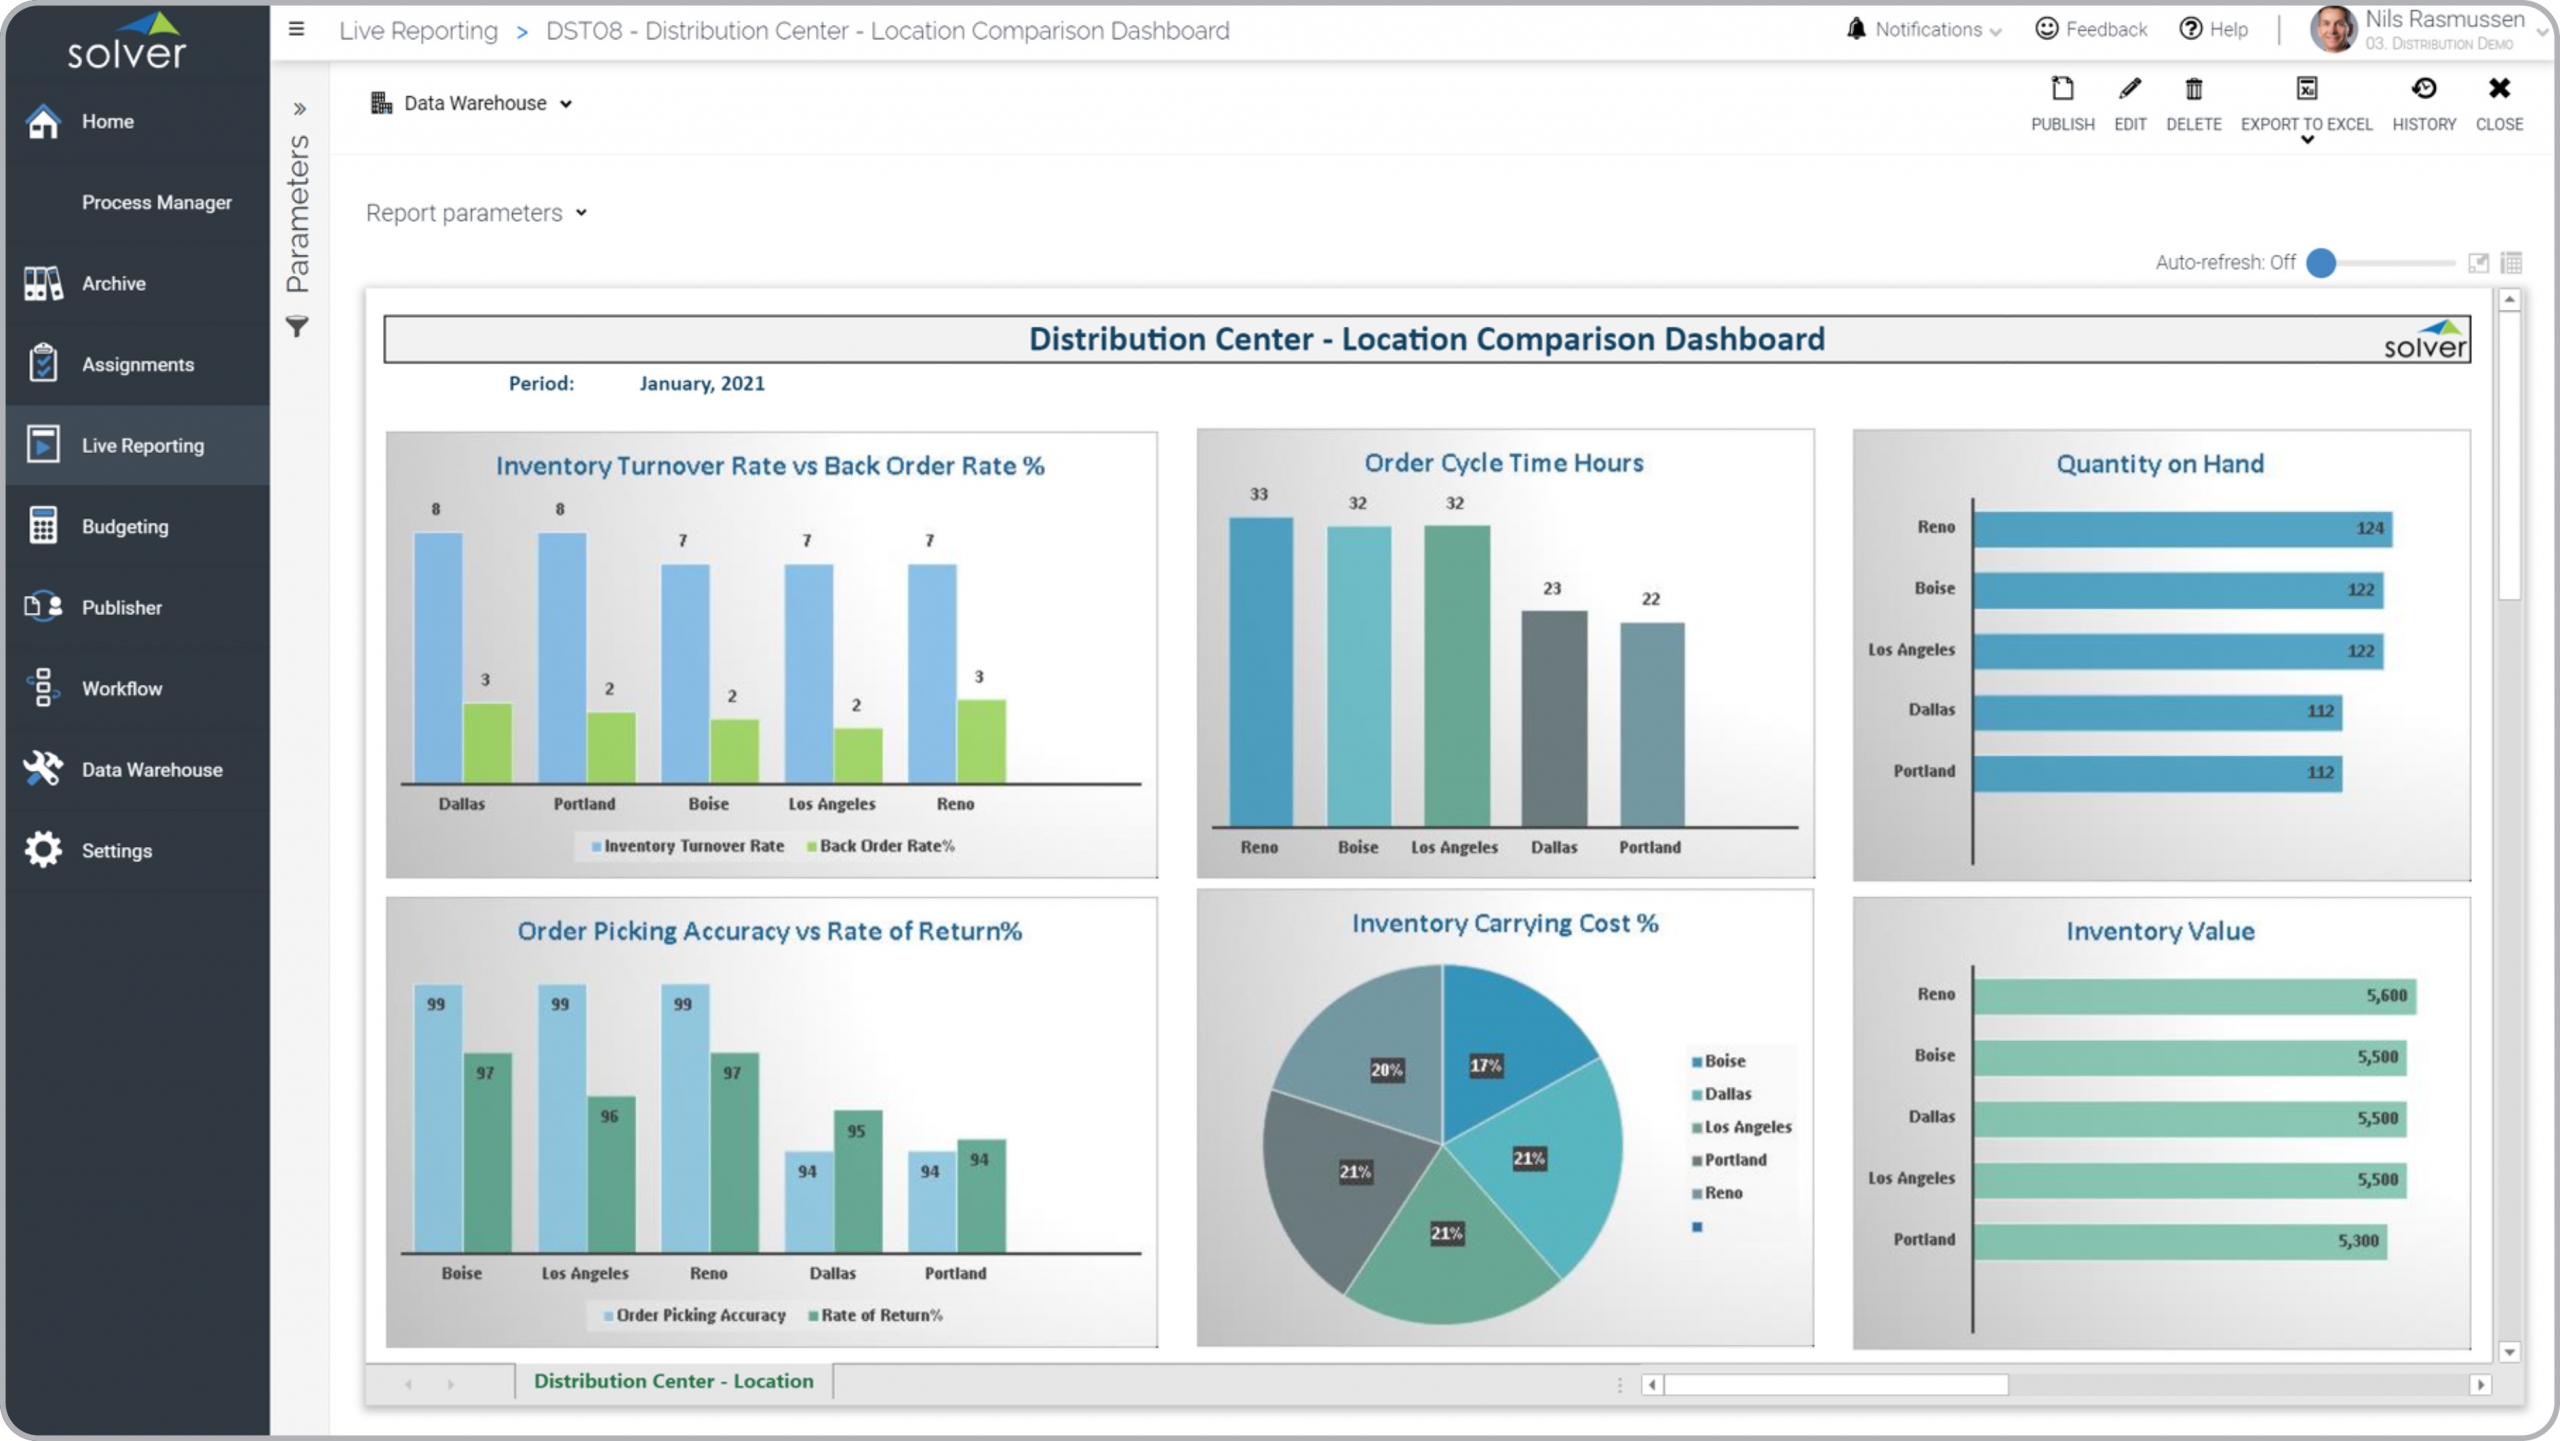
Distribution – Distribution Center – Location Comparison
Comparison of KPIs by location, such as inventory turnover, quantity on hand and cycle time.
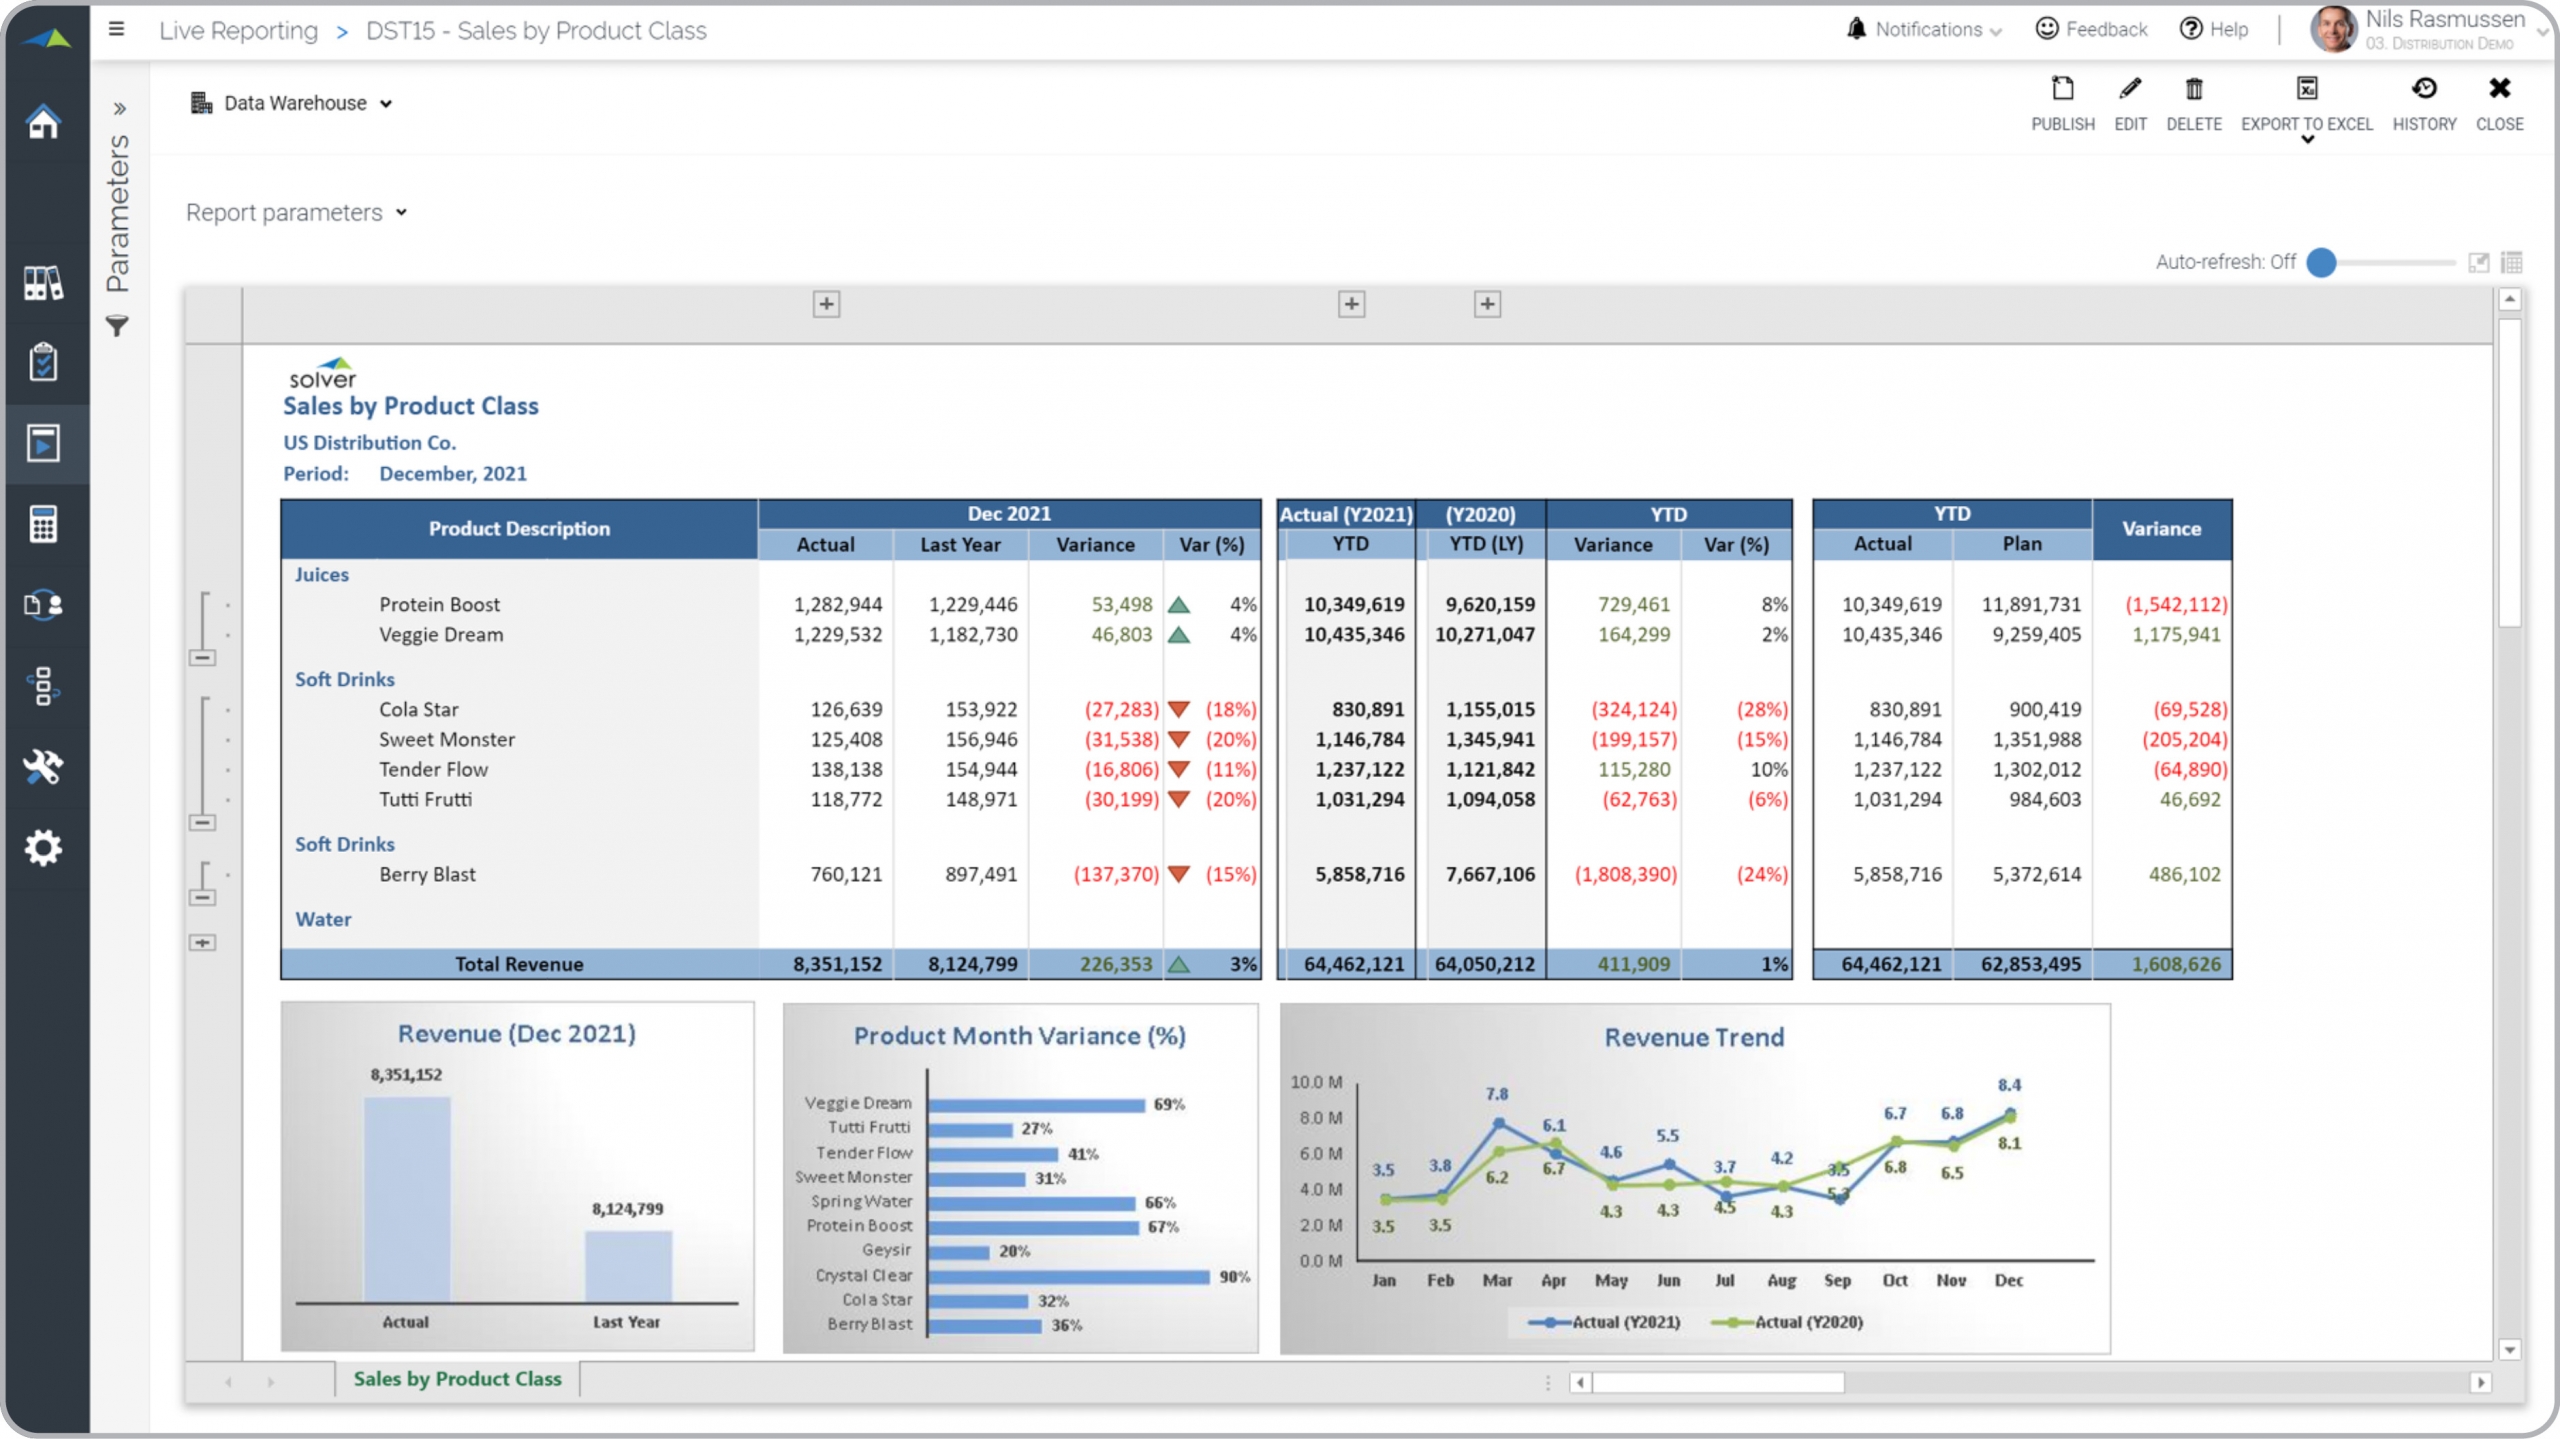
Distribution – Sales by Product Class
Monthly and YTD sales by product class with charts and expandable columns.
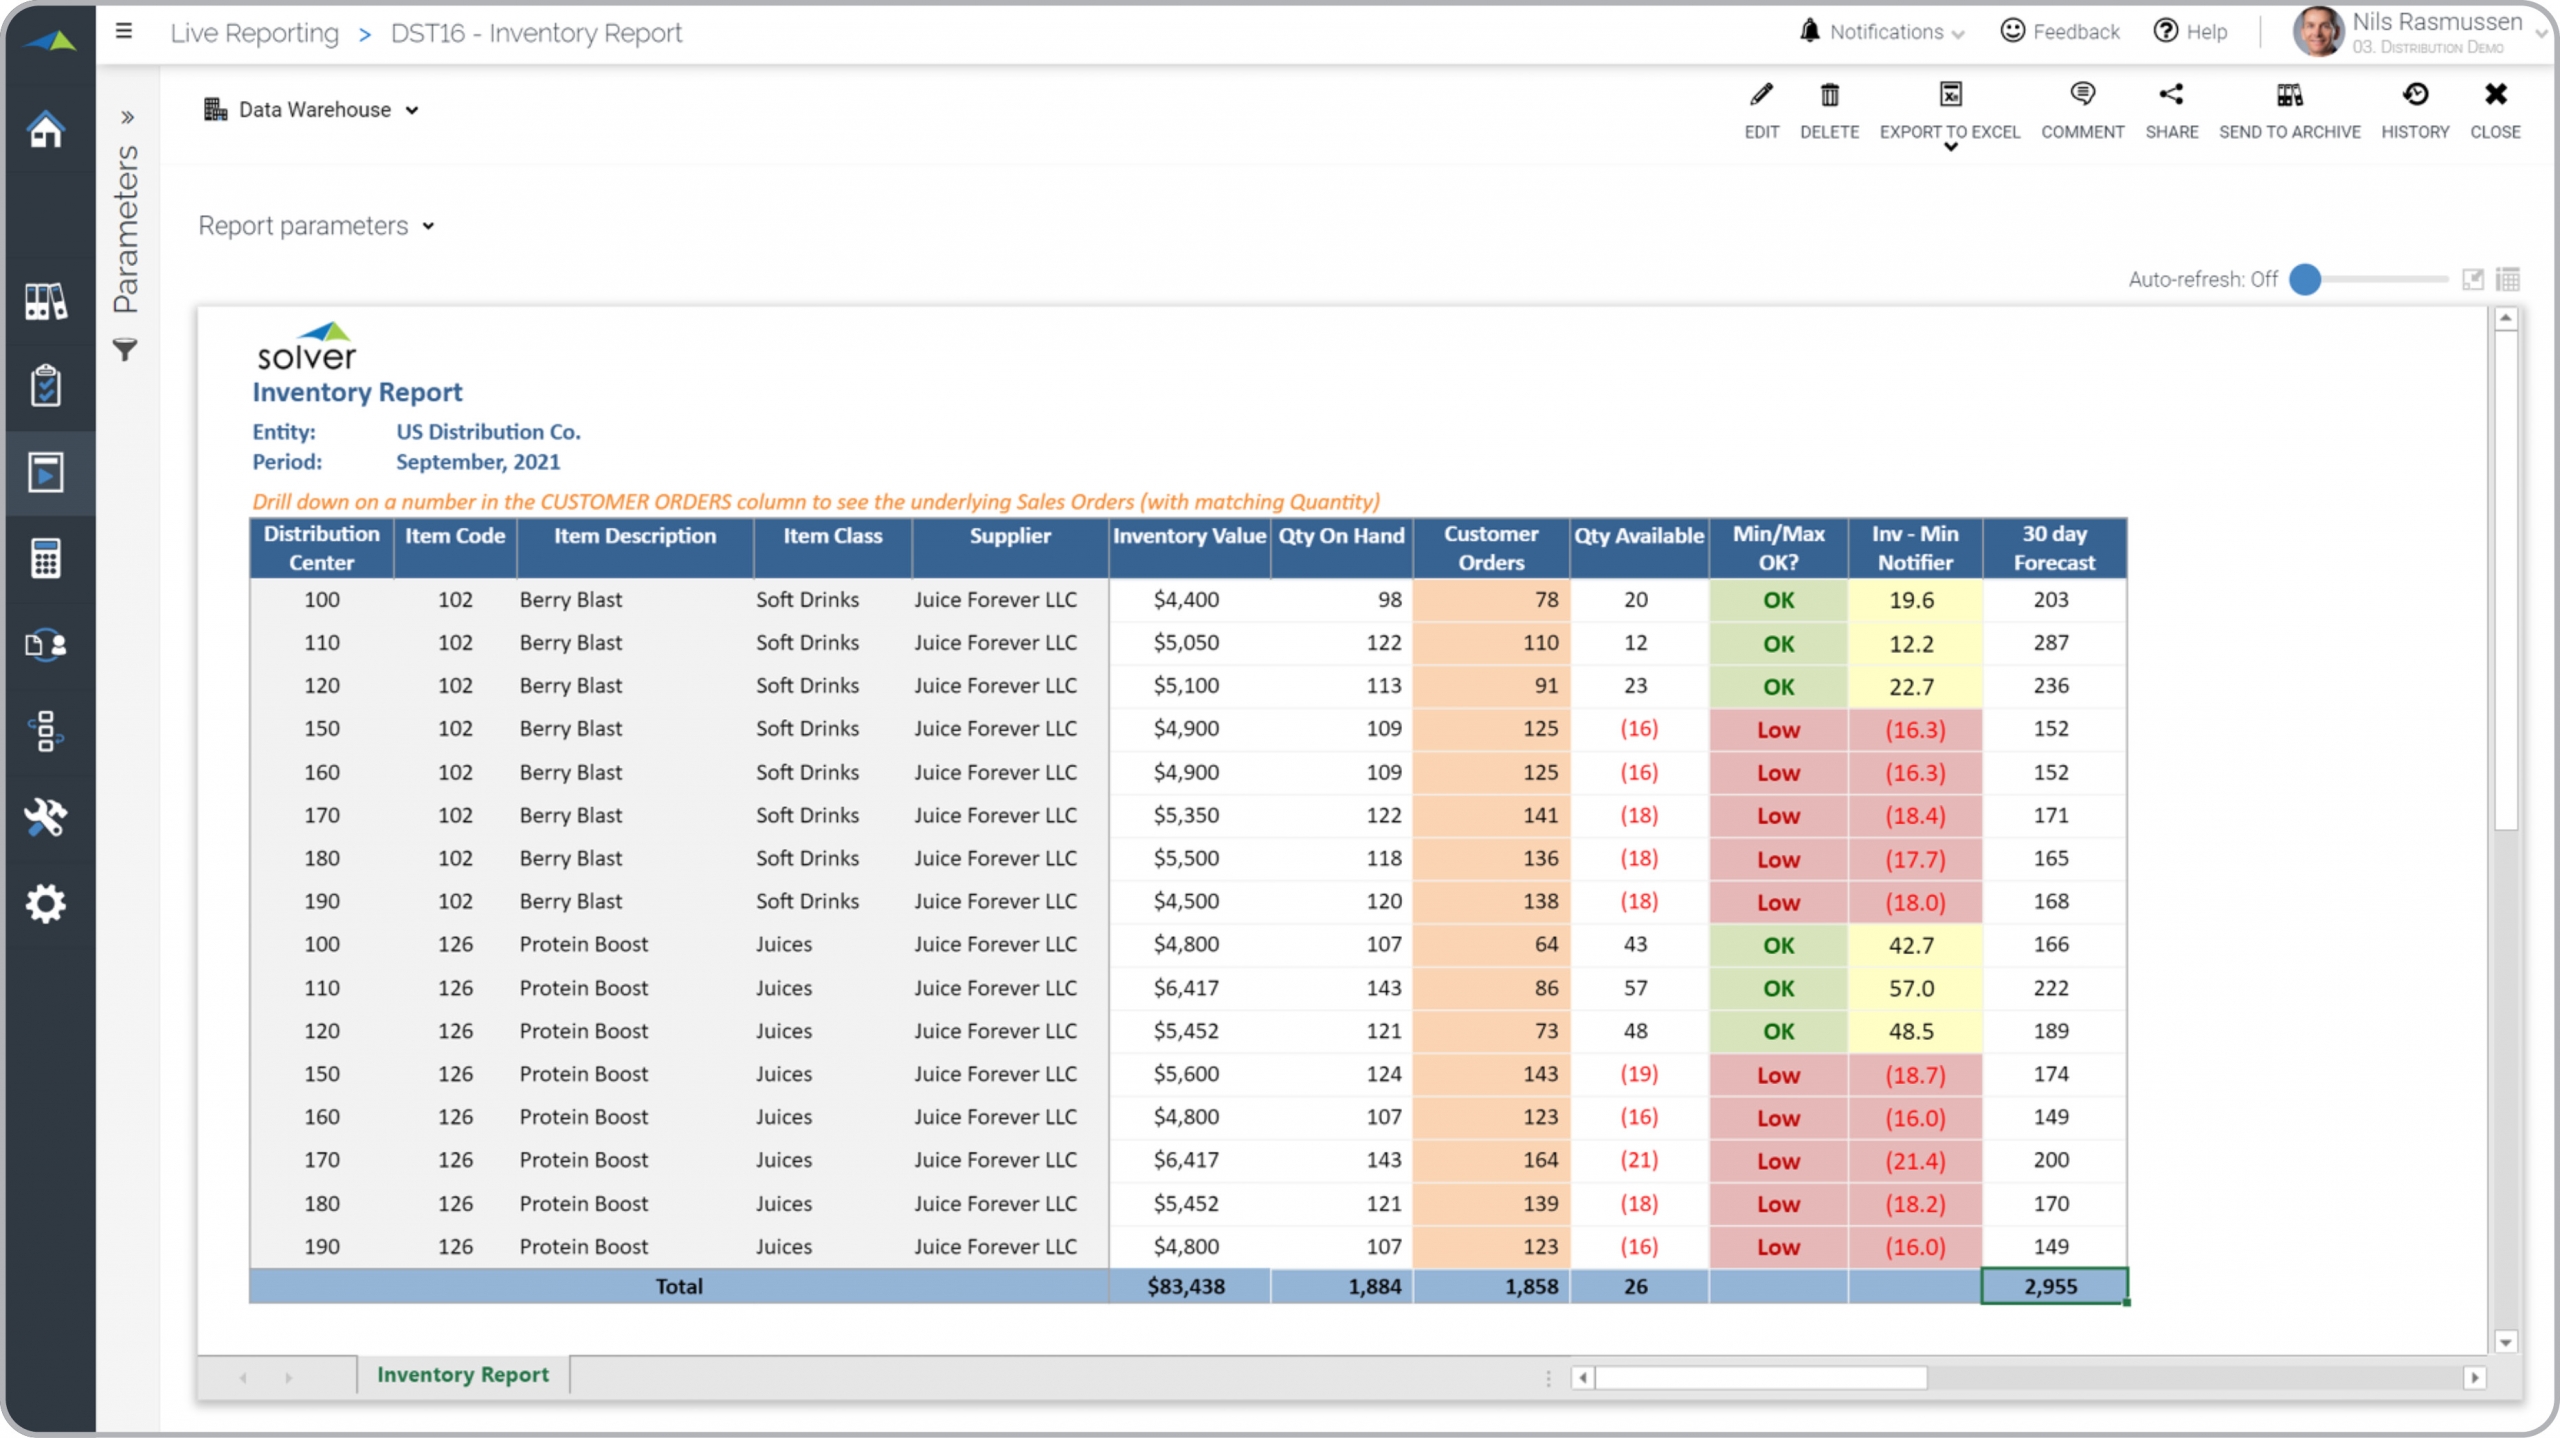
Distribution – Inventory Report
Analysis of orders vs quantity available and min/max inventory levels, and drill to orders.
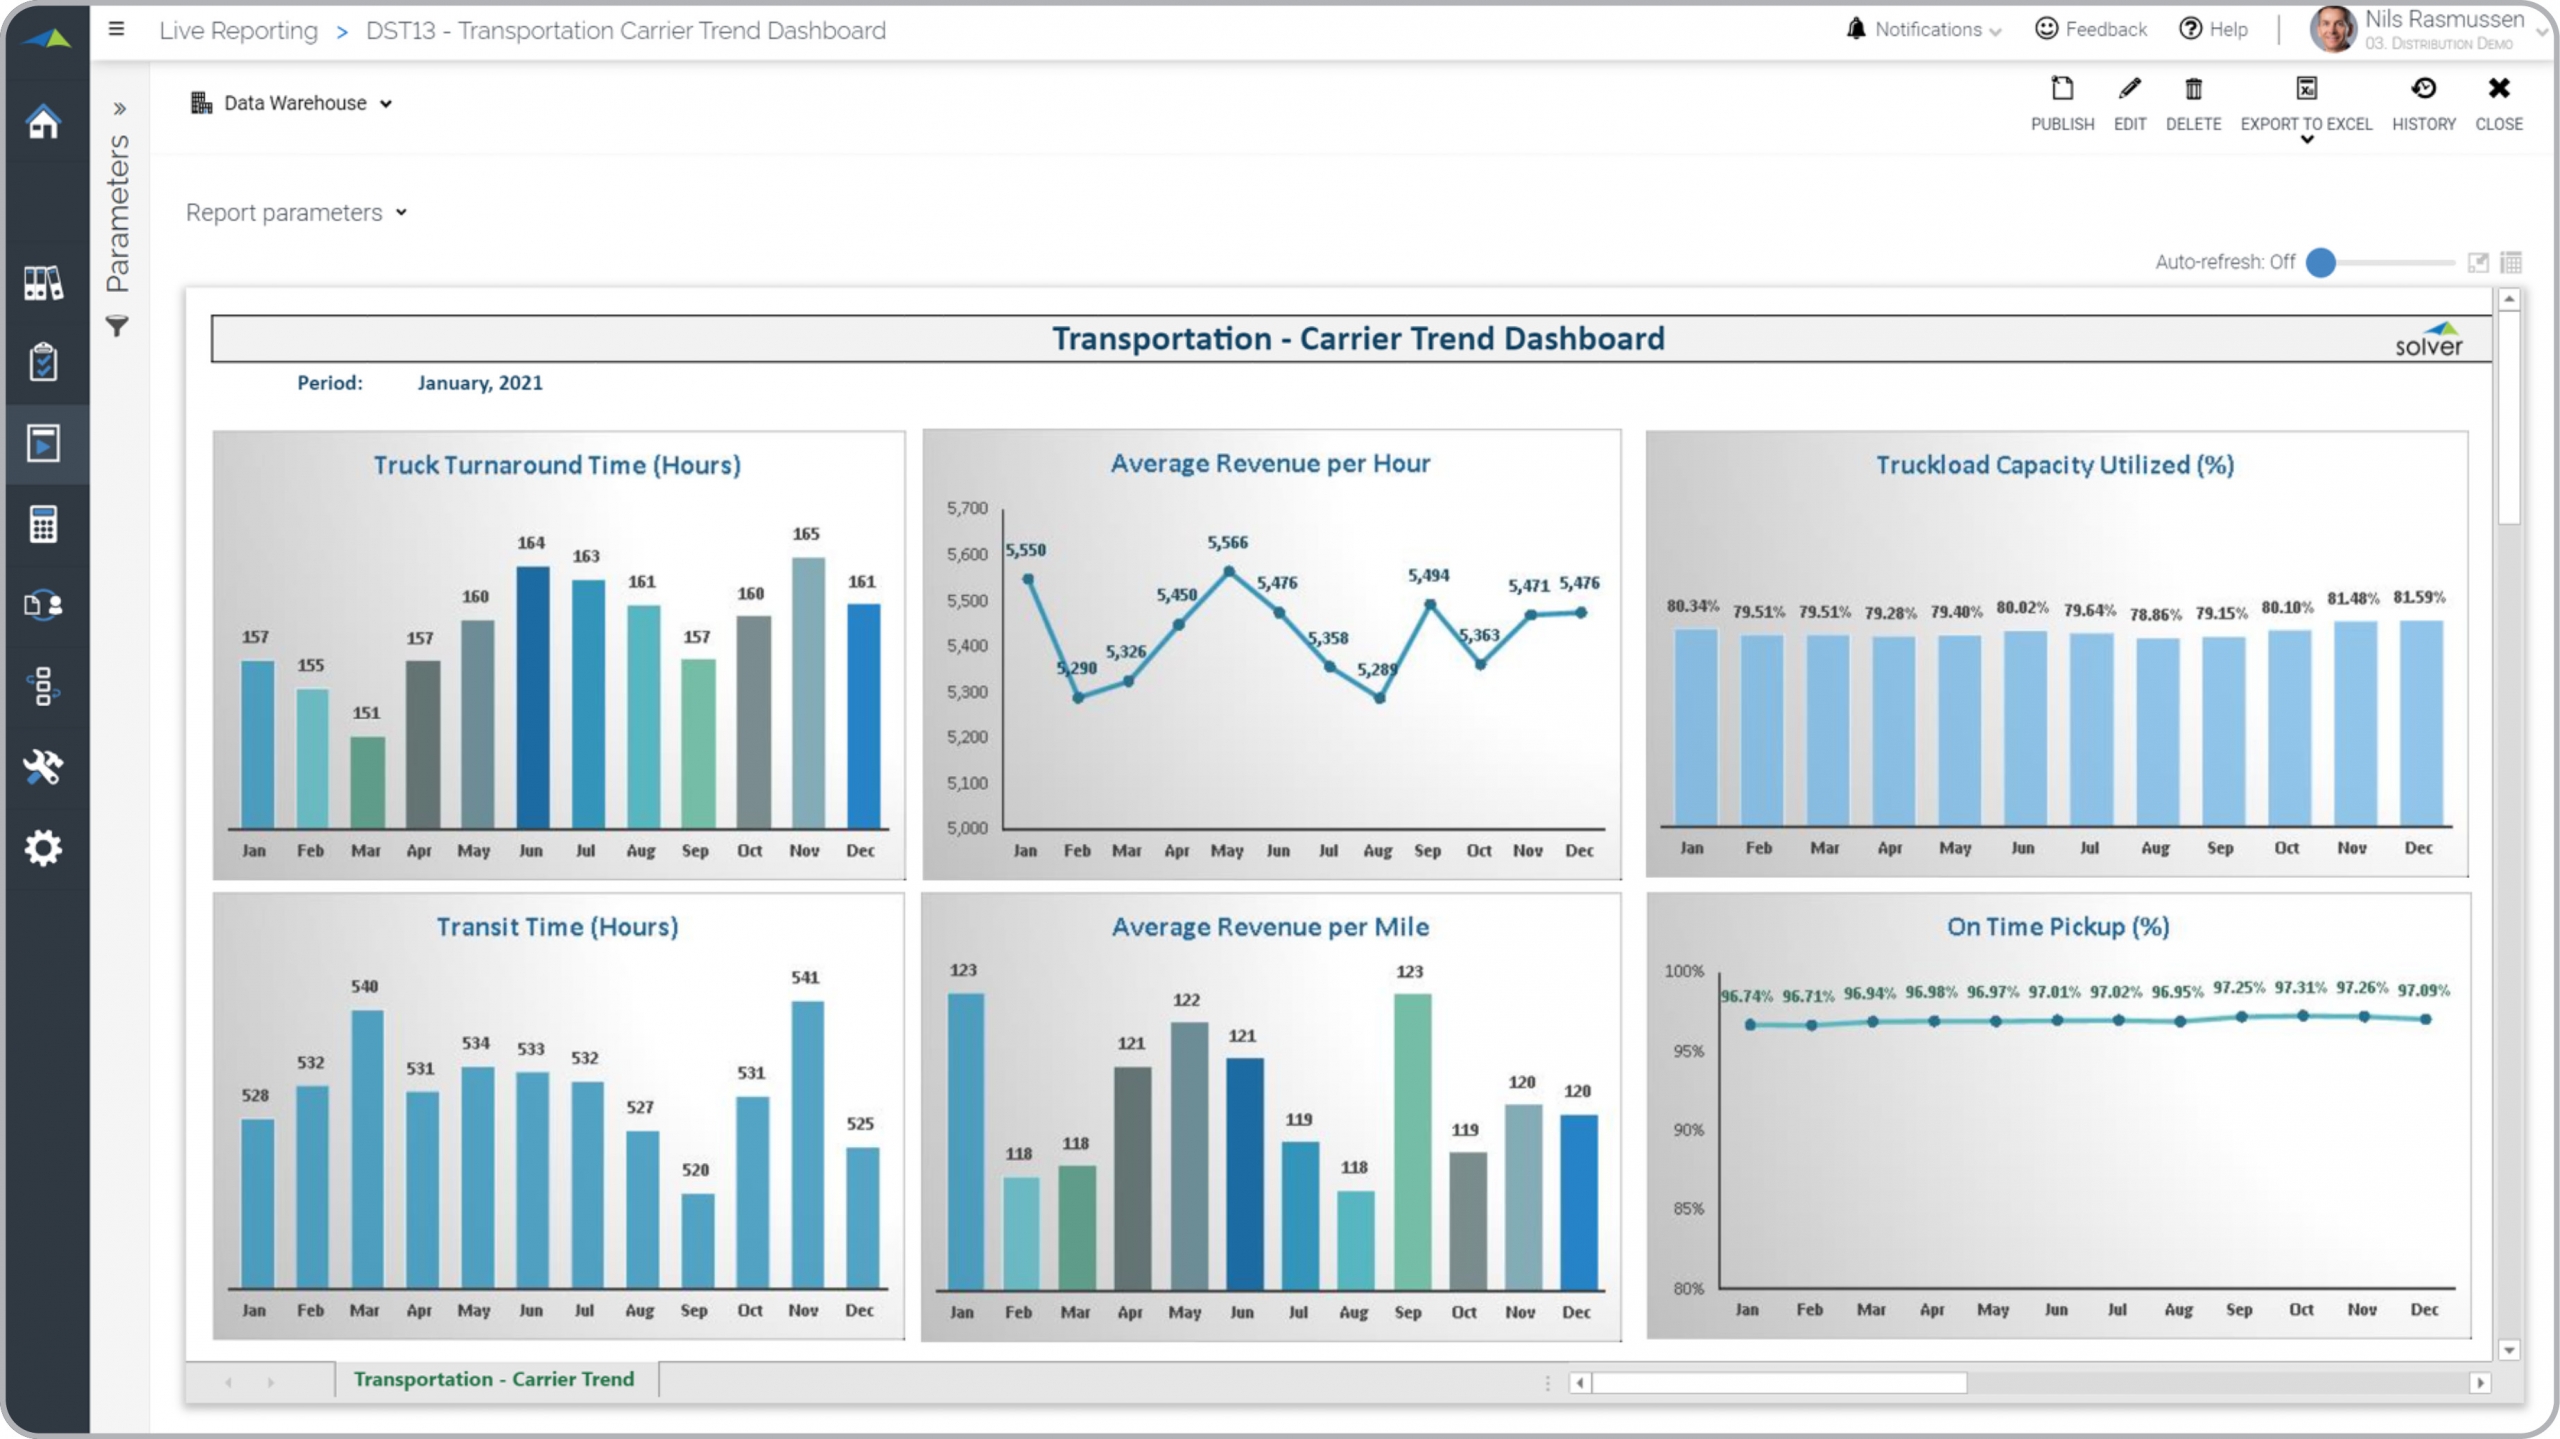
Distribution – Transportation Carrier Trend Analysis
Monthly trend analysis of carrier KPIs.
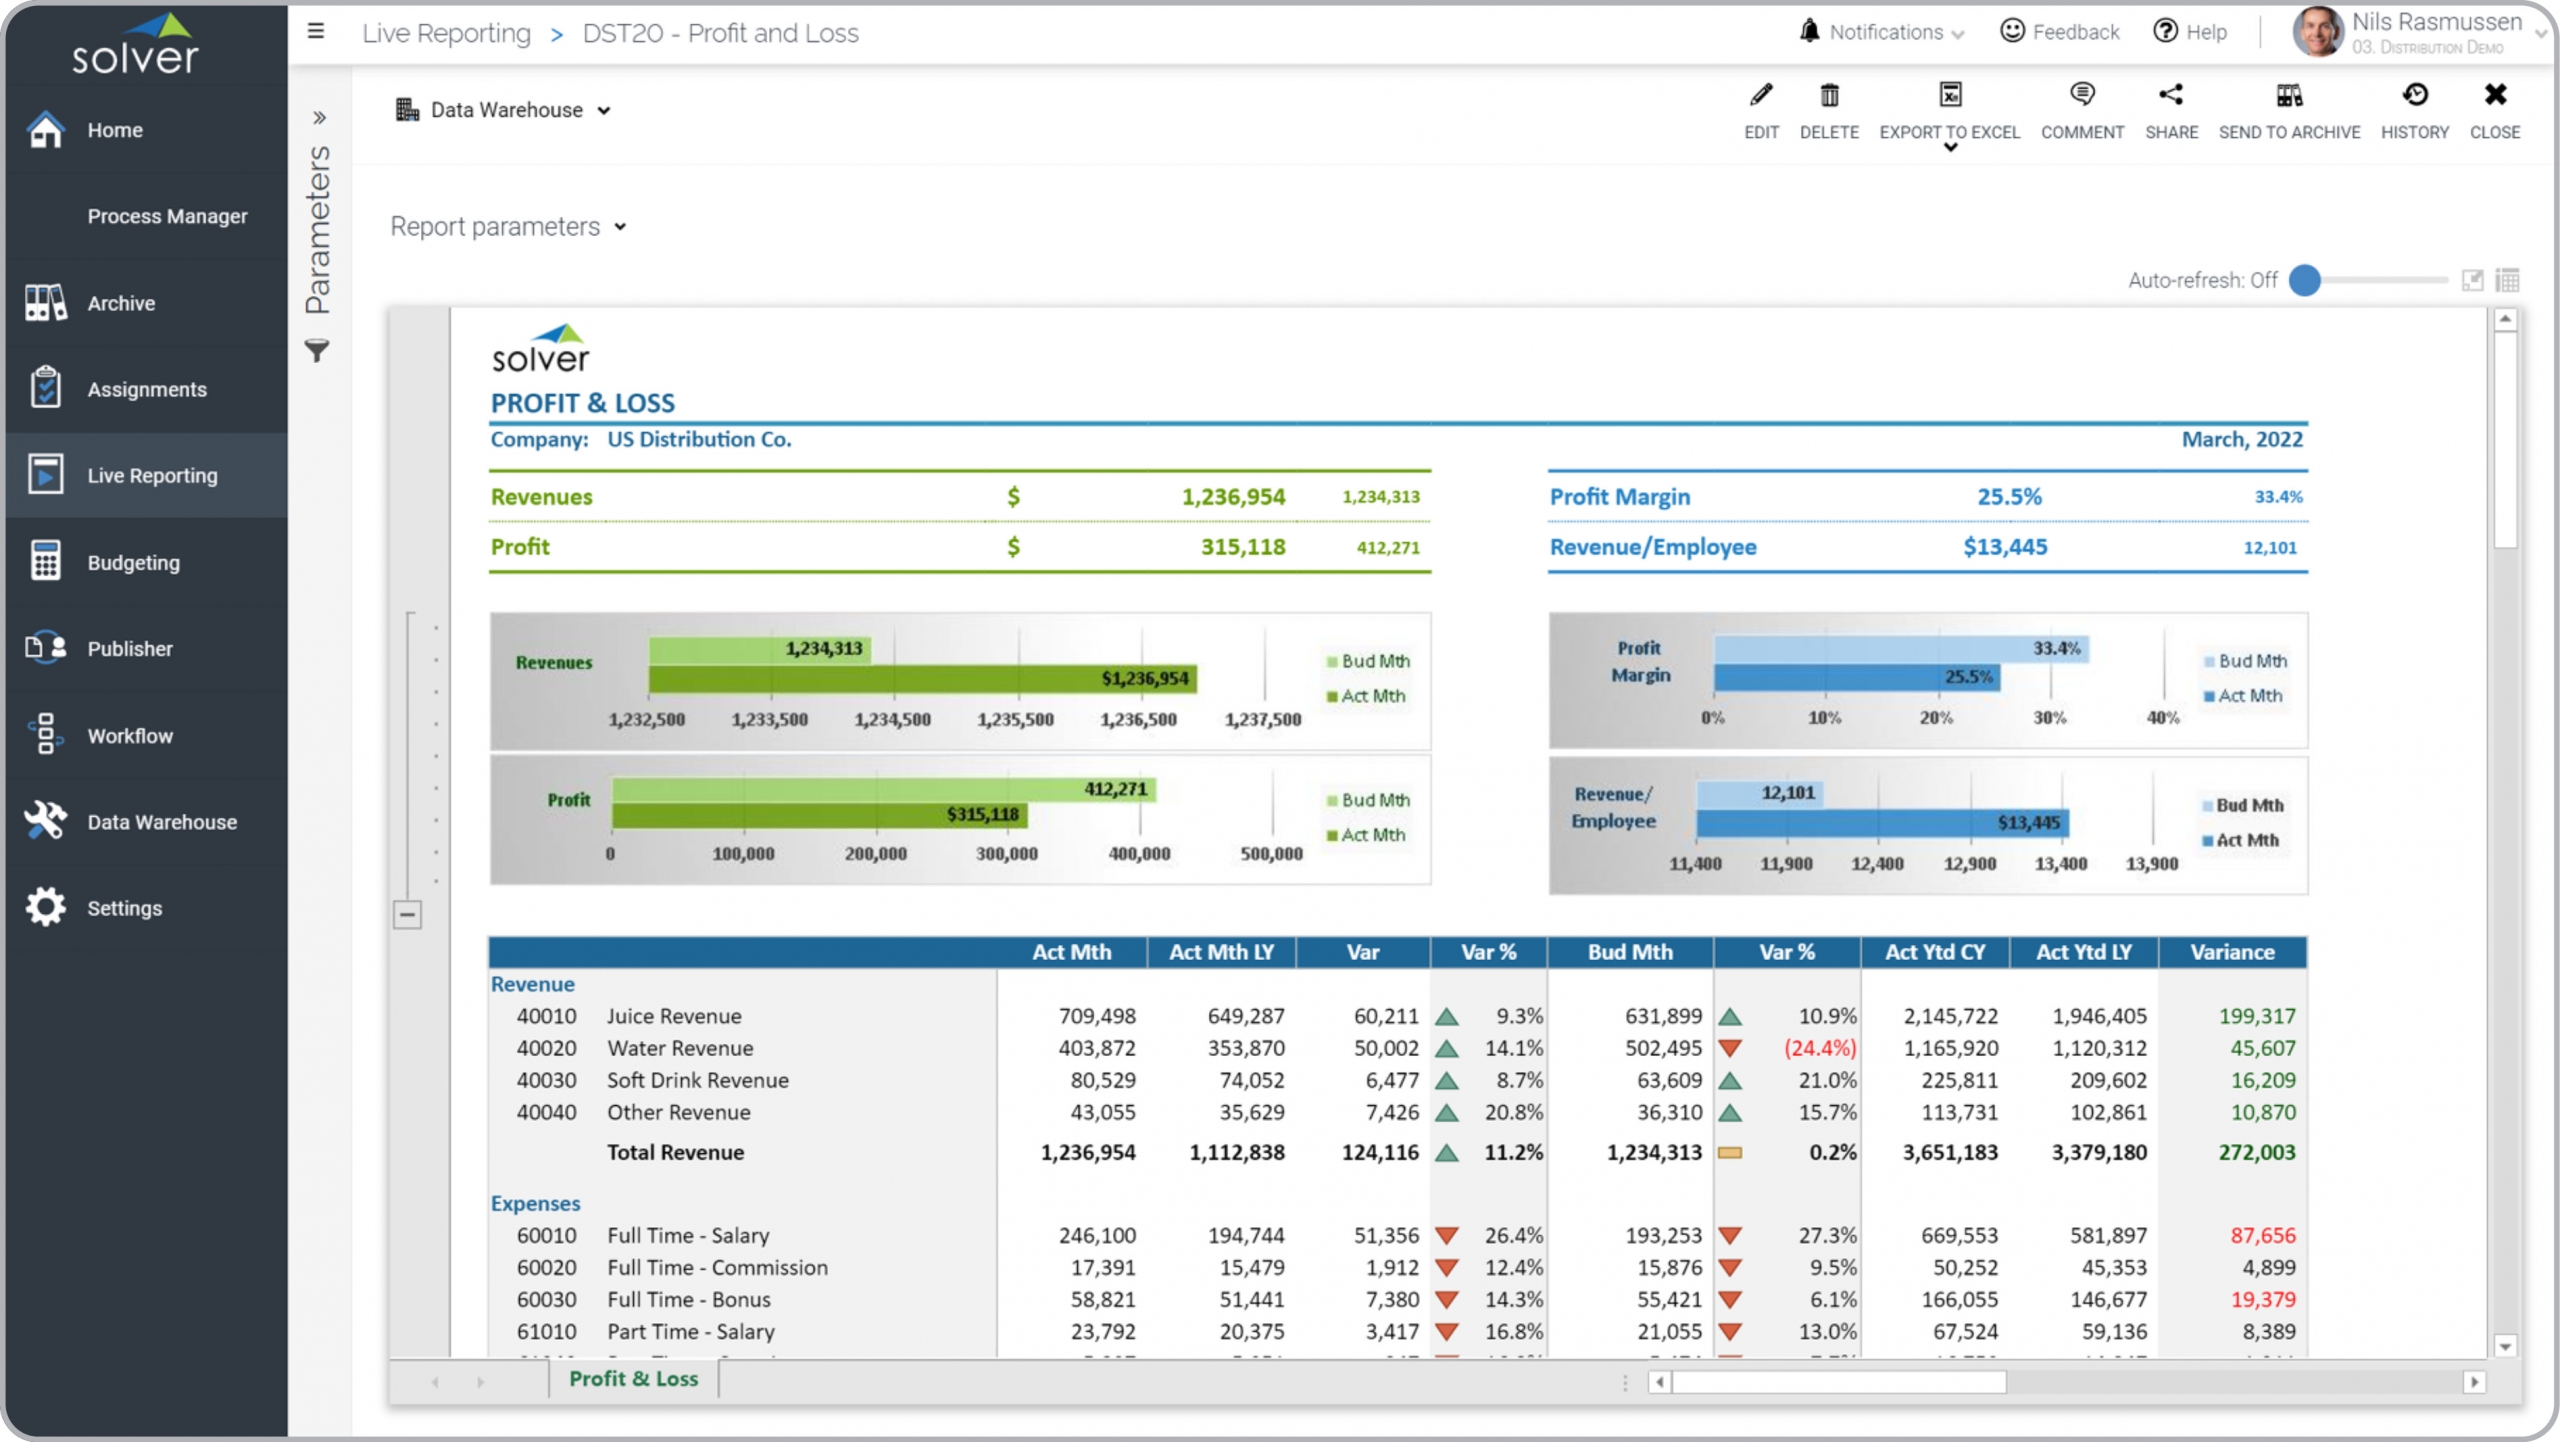
Distribution – Profit & Loss Report
Modern layout for a monthly P&L for a distribution company.
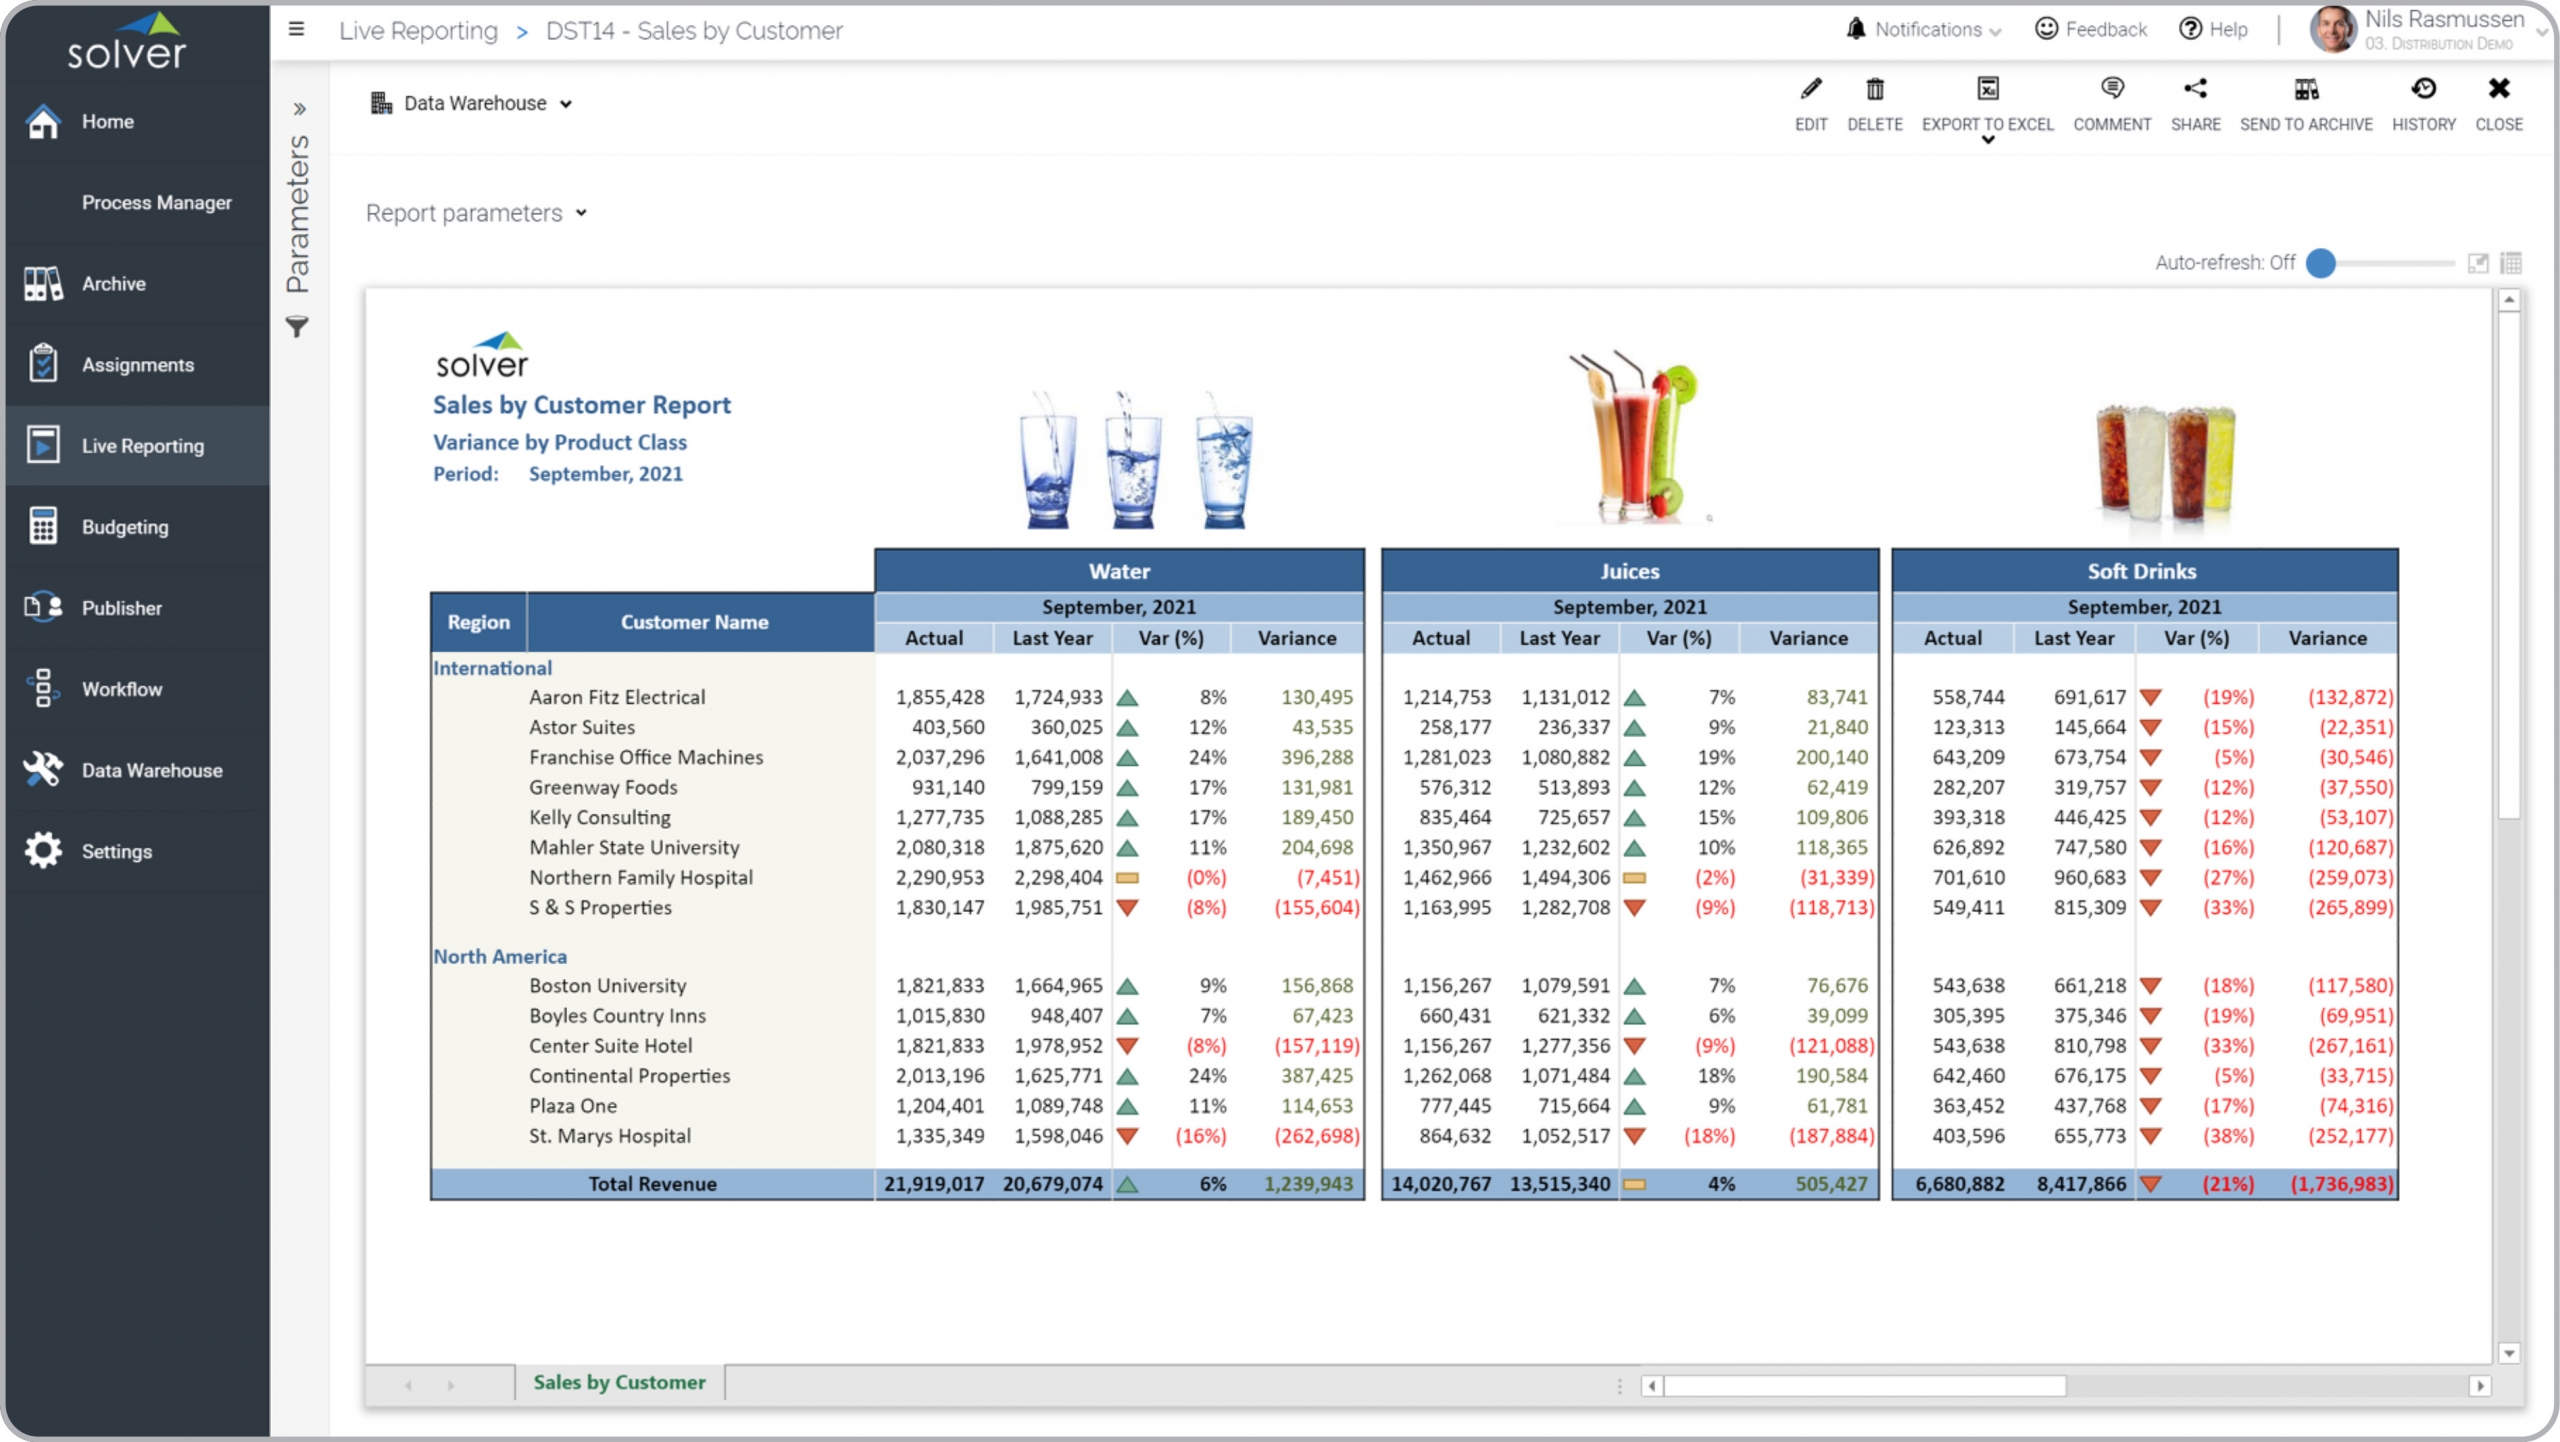
Distribution – Sales by Customer
Sales by product group for domestic and international customers.
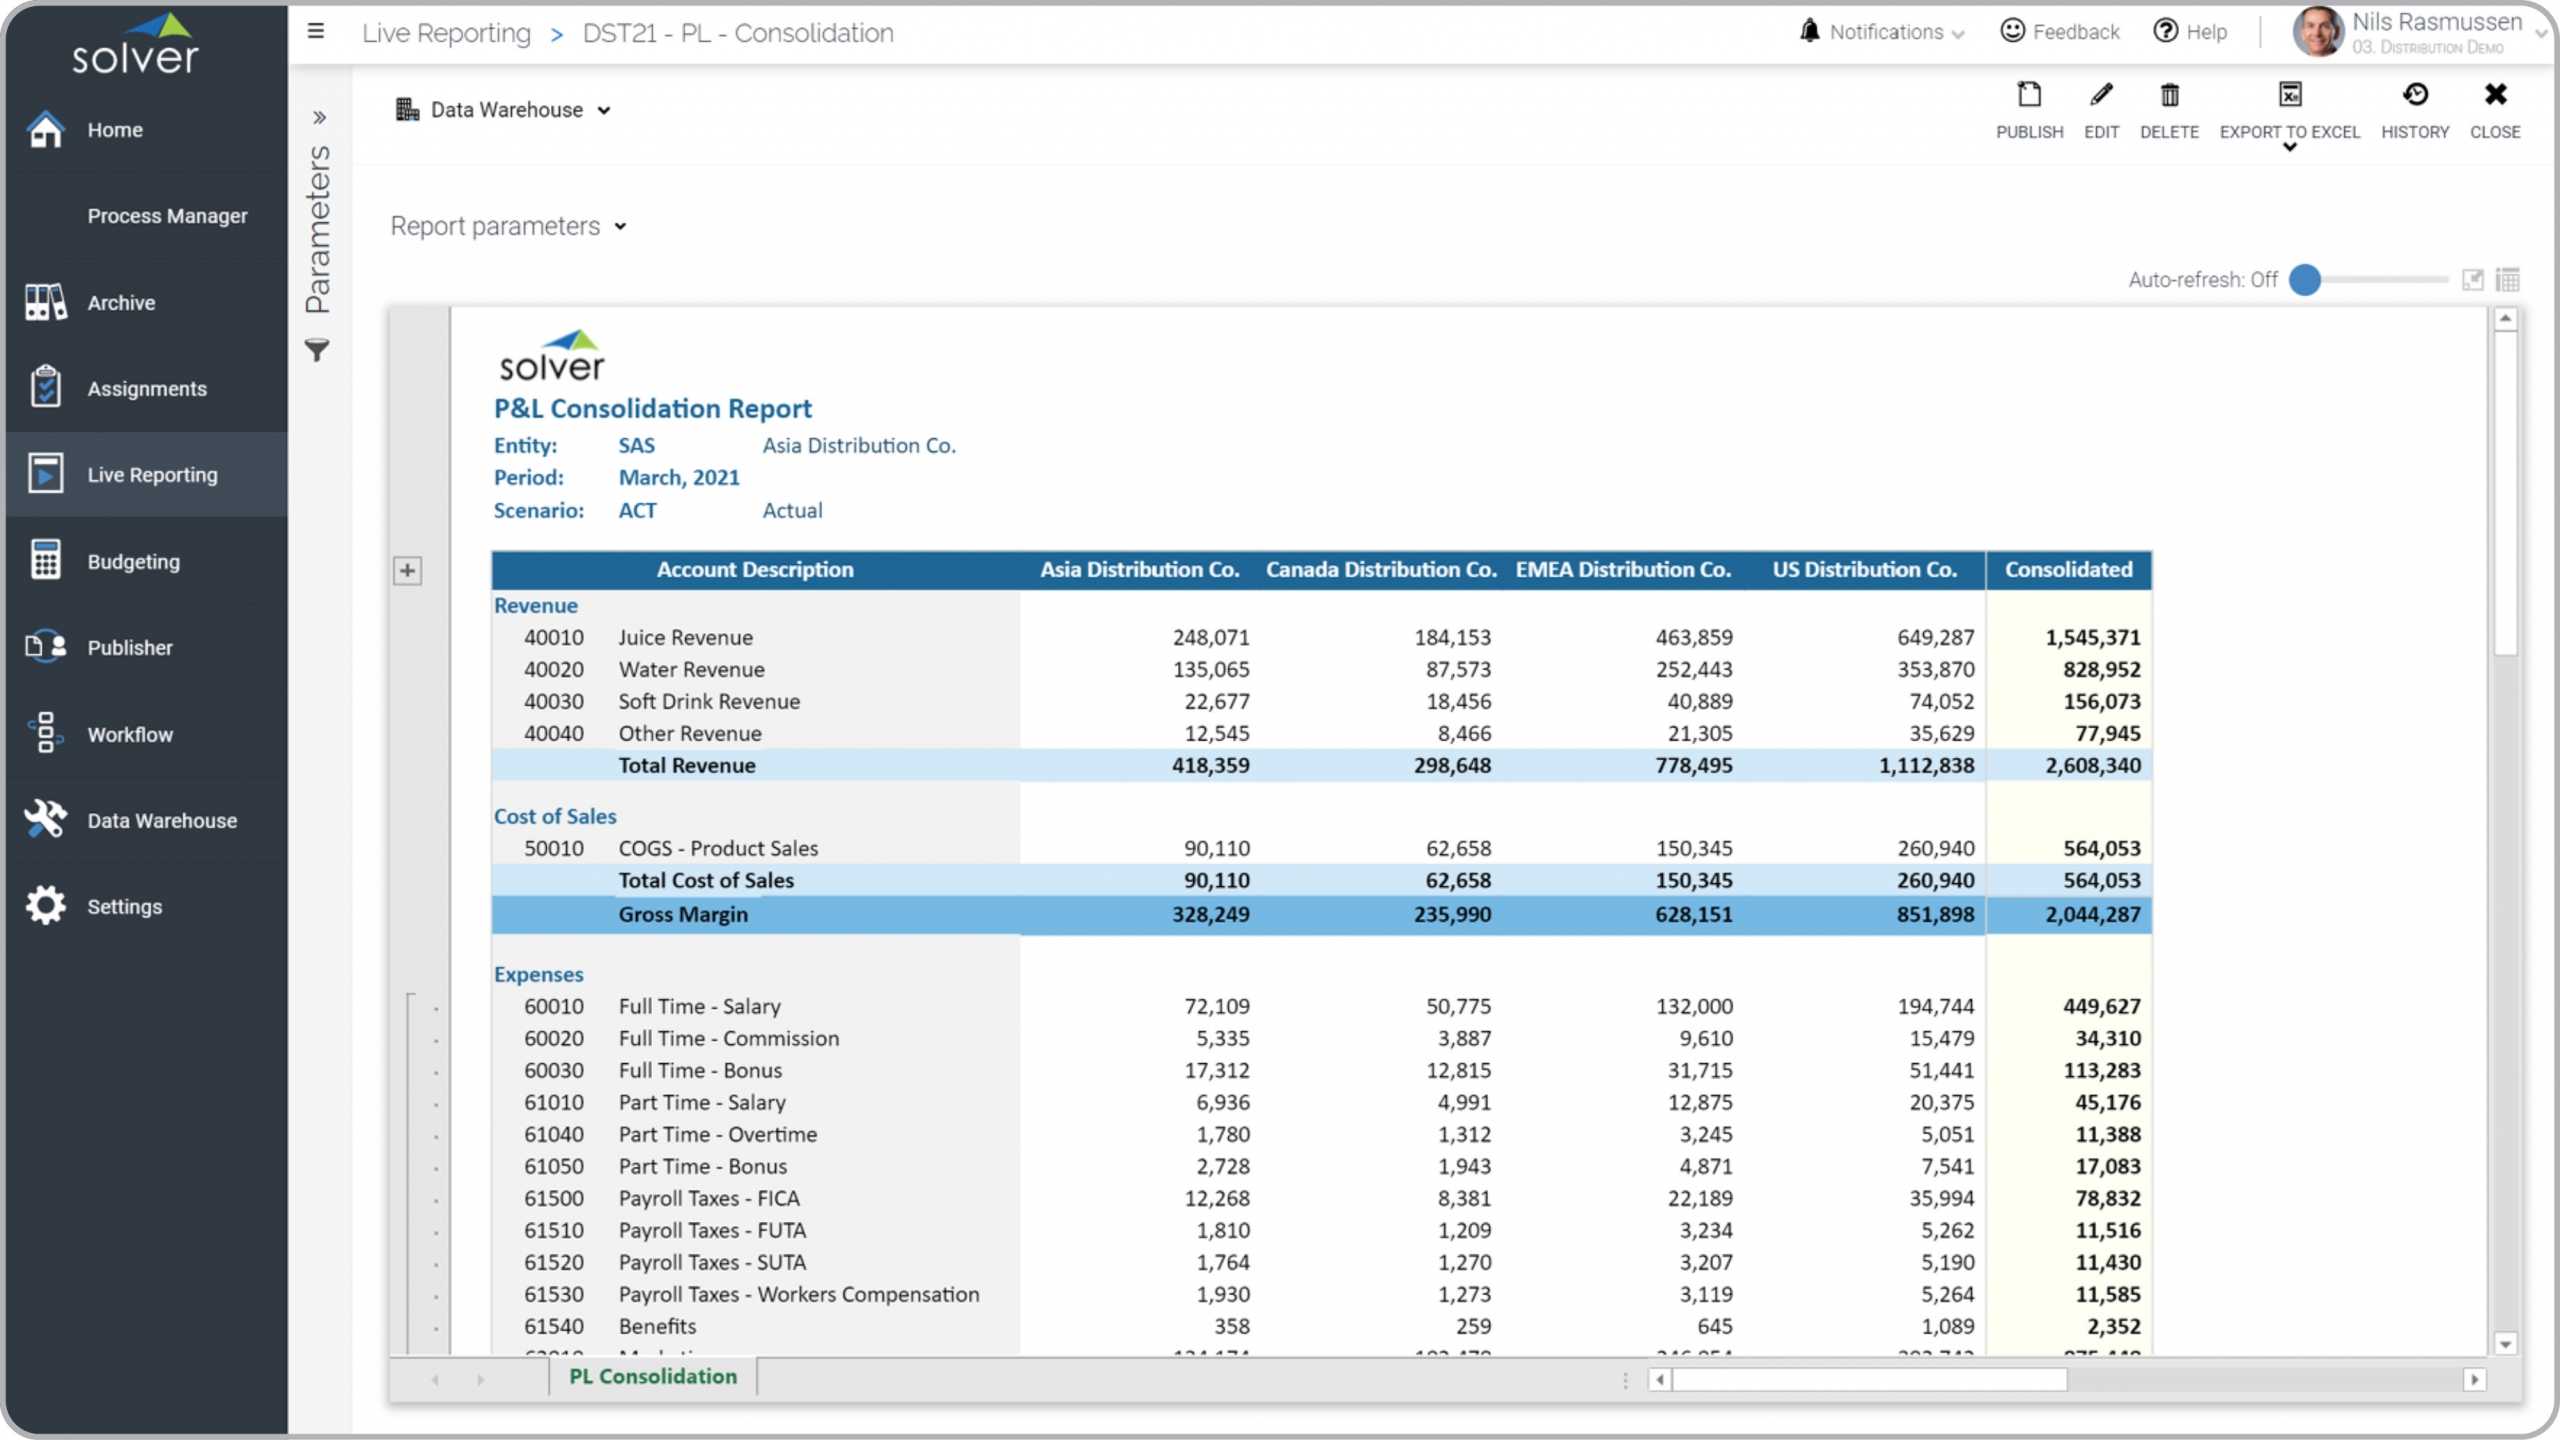
Distribution – Consolidation Report
Consolidated financial statement for a distribution company.
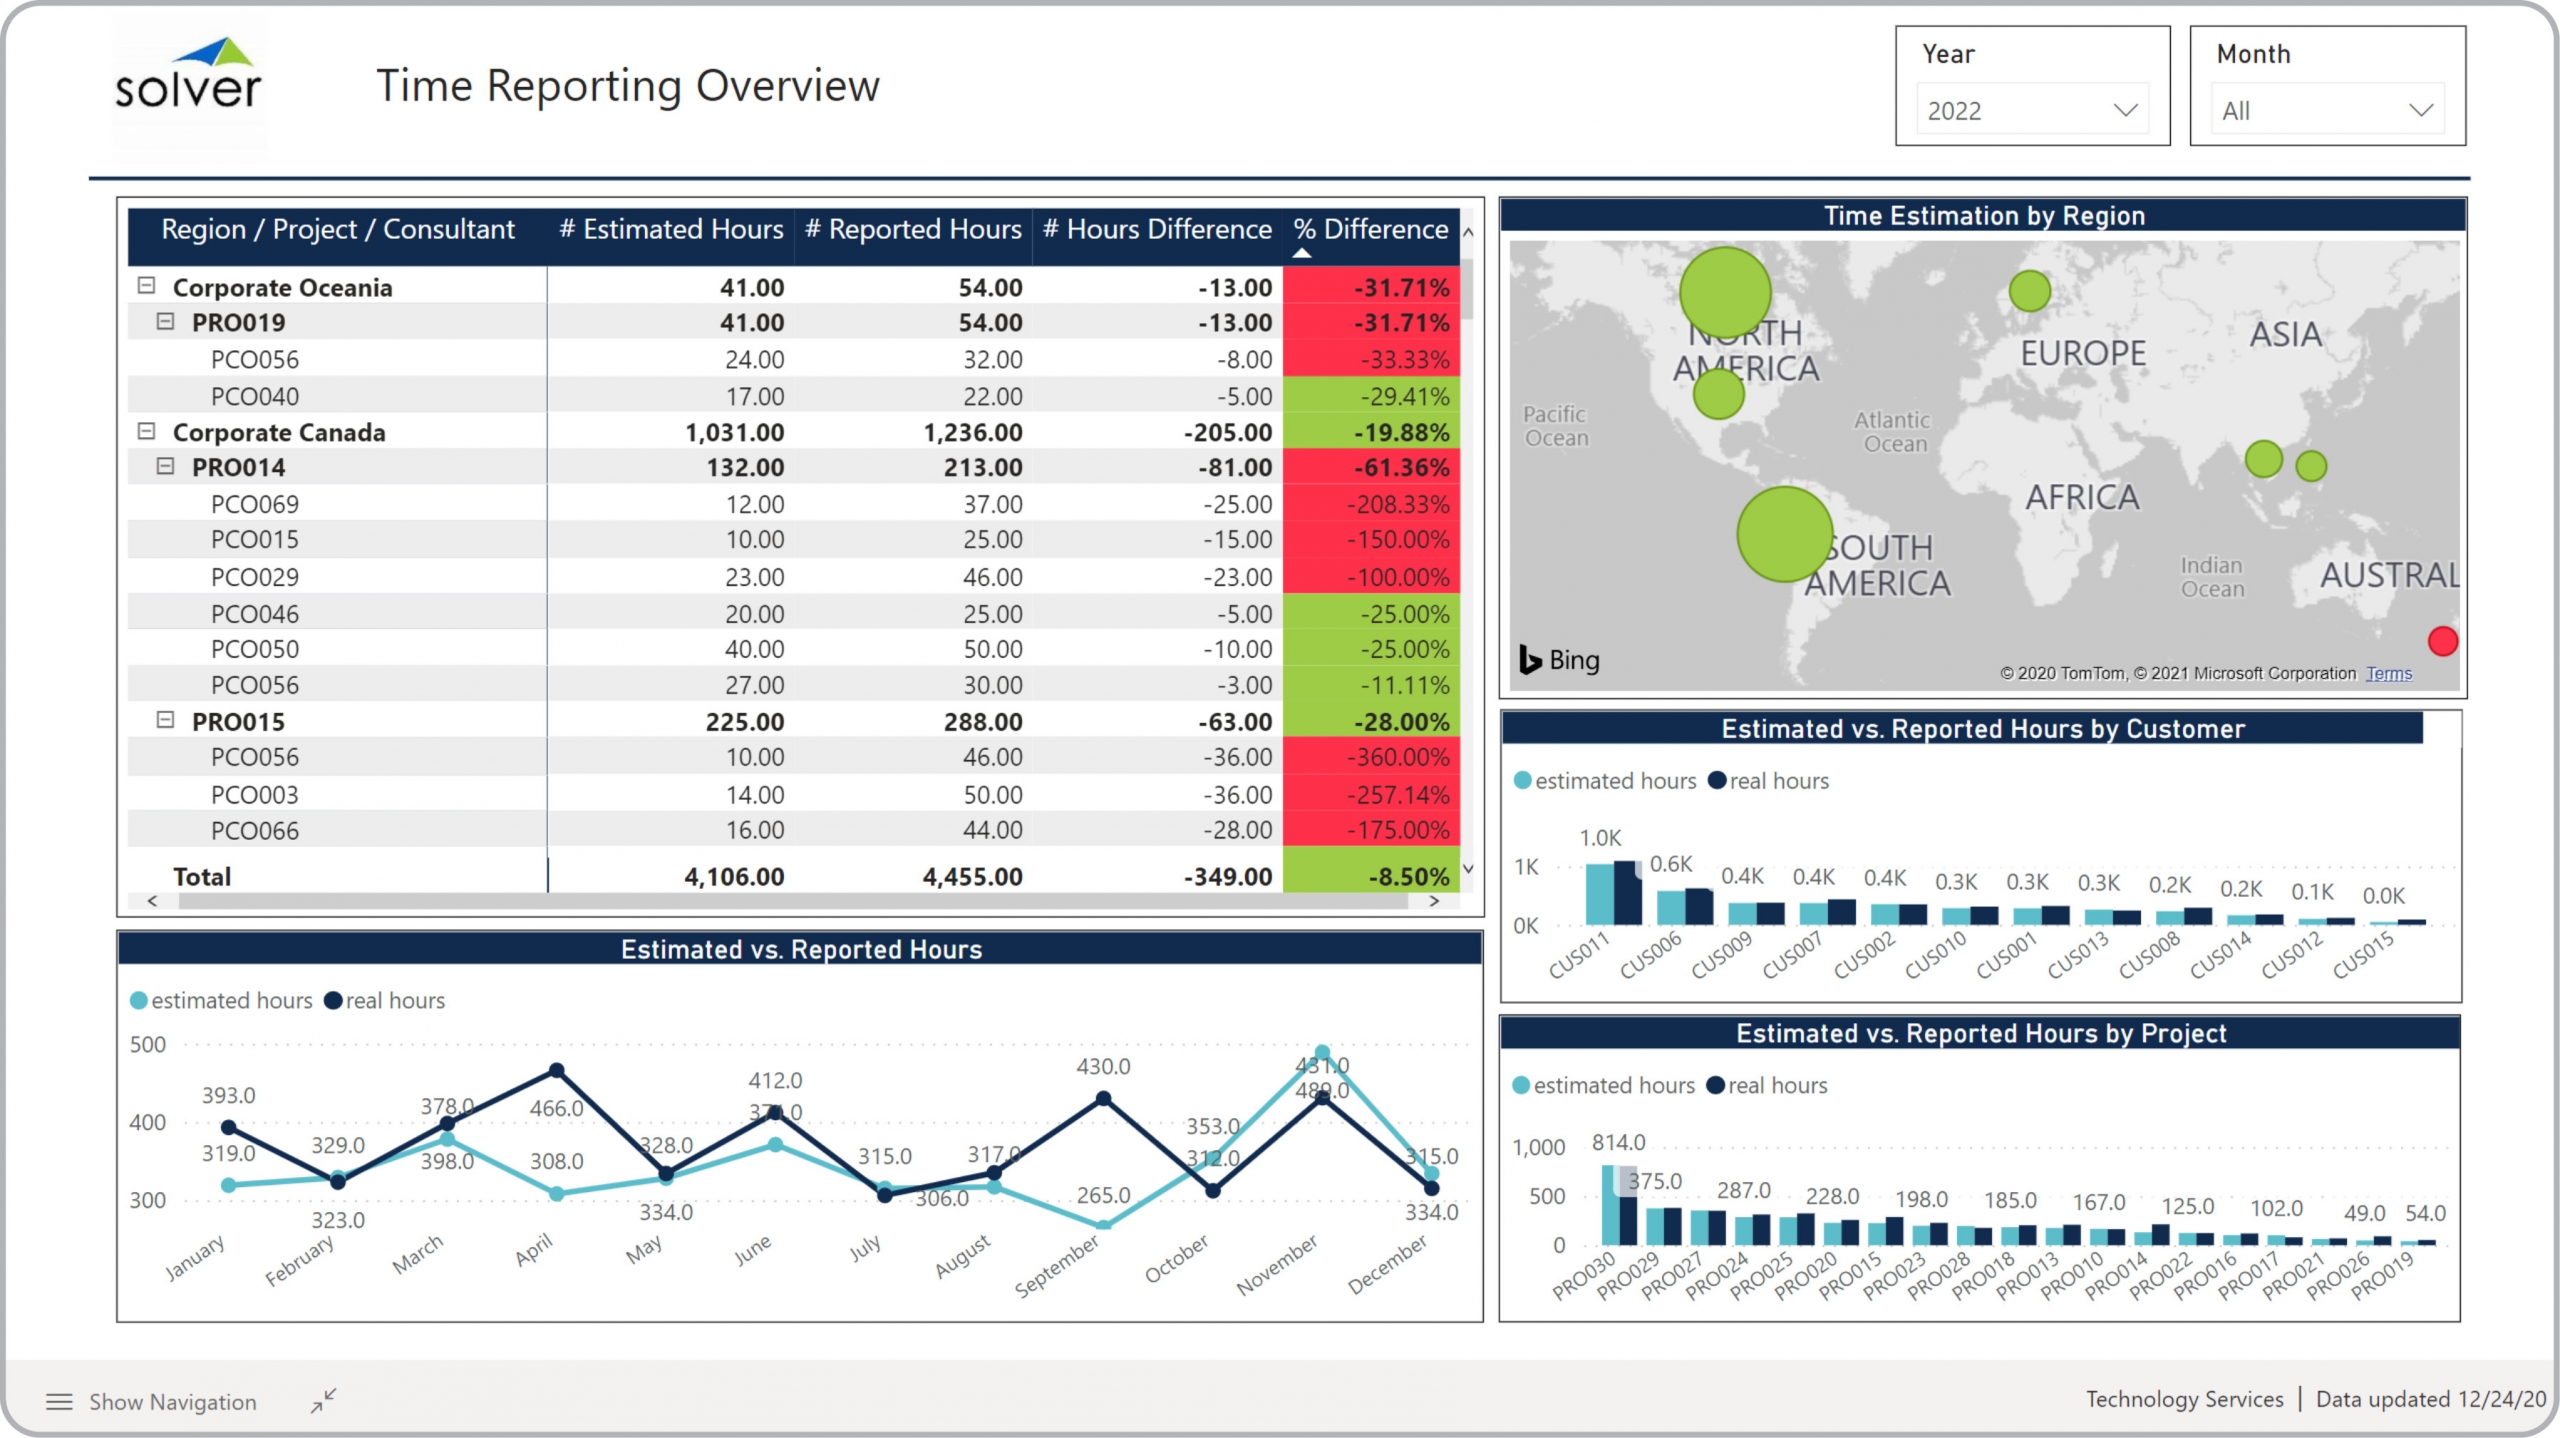
Tech – Time Reporting Overview
Power BI dashboard for consulting hours with metrics like reported vs. estimated hours by customer and project.
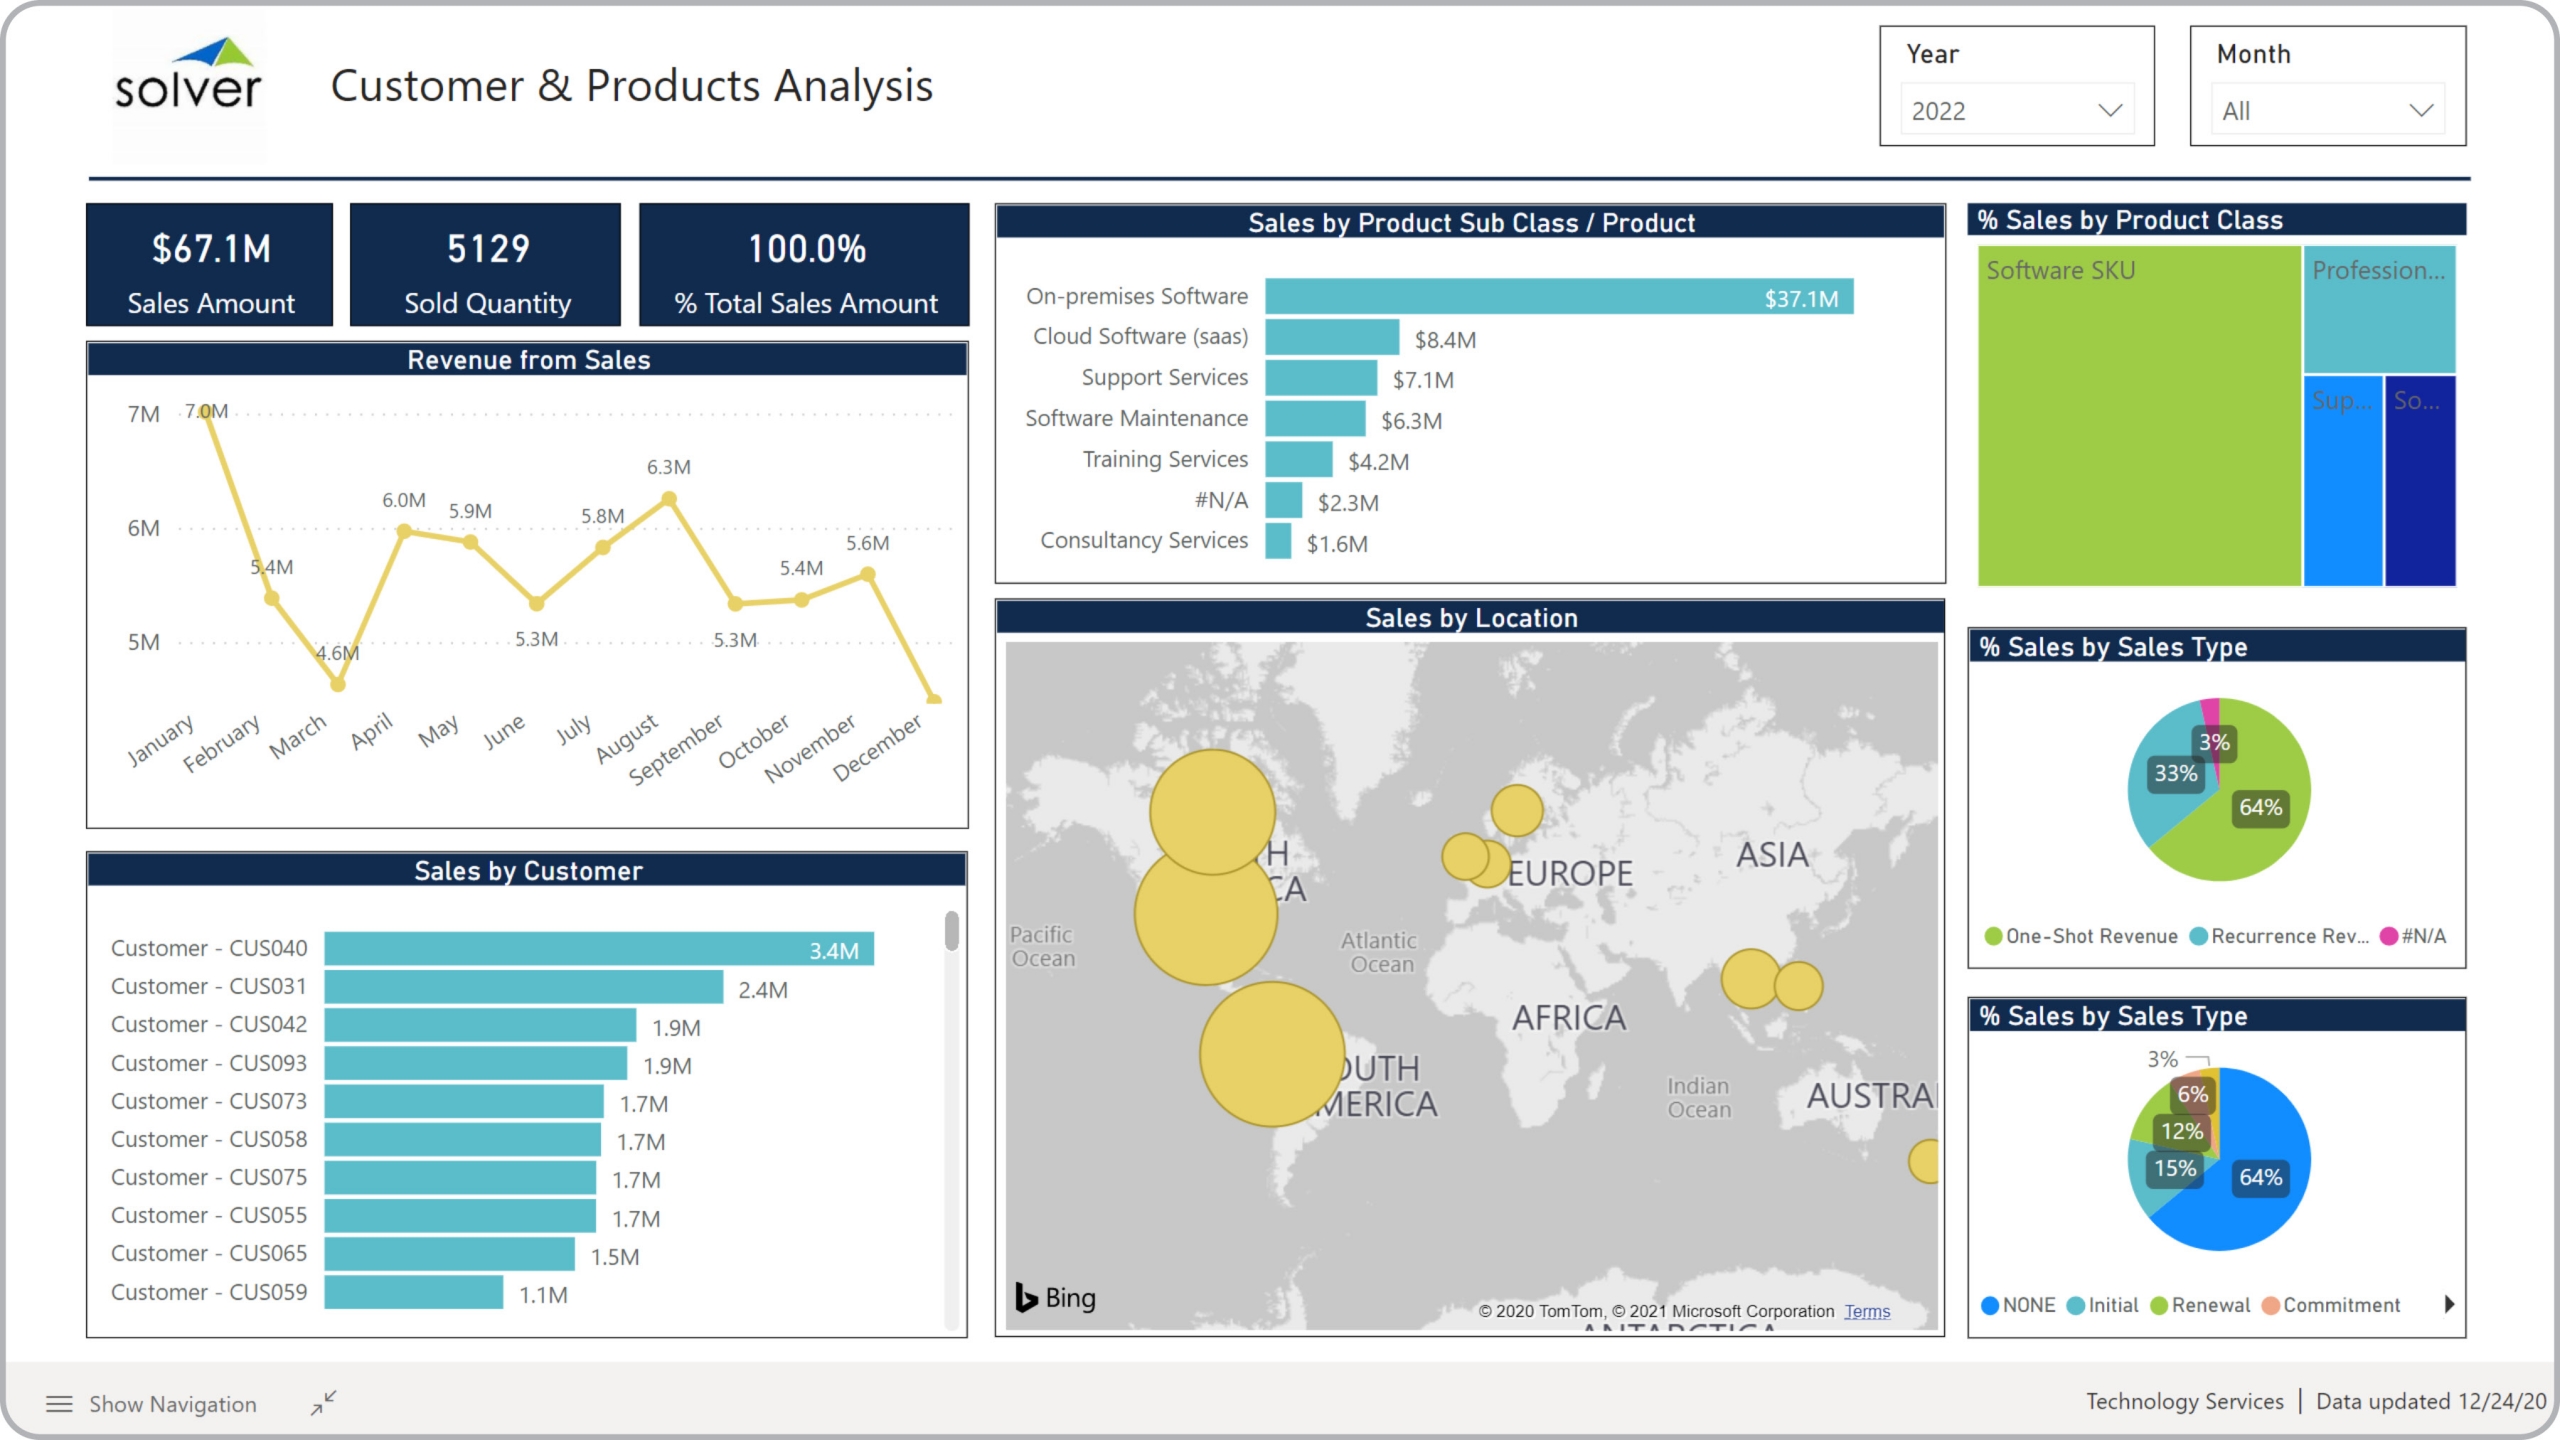
Tech – Customer and Product Sales
Power BI dashboard for analysis of sales KPIs by customer, product and region.
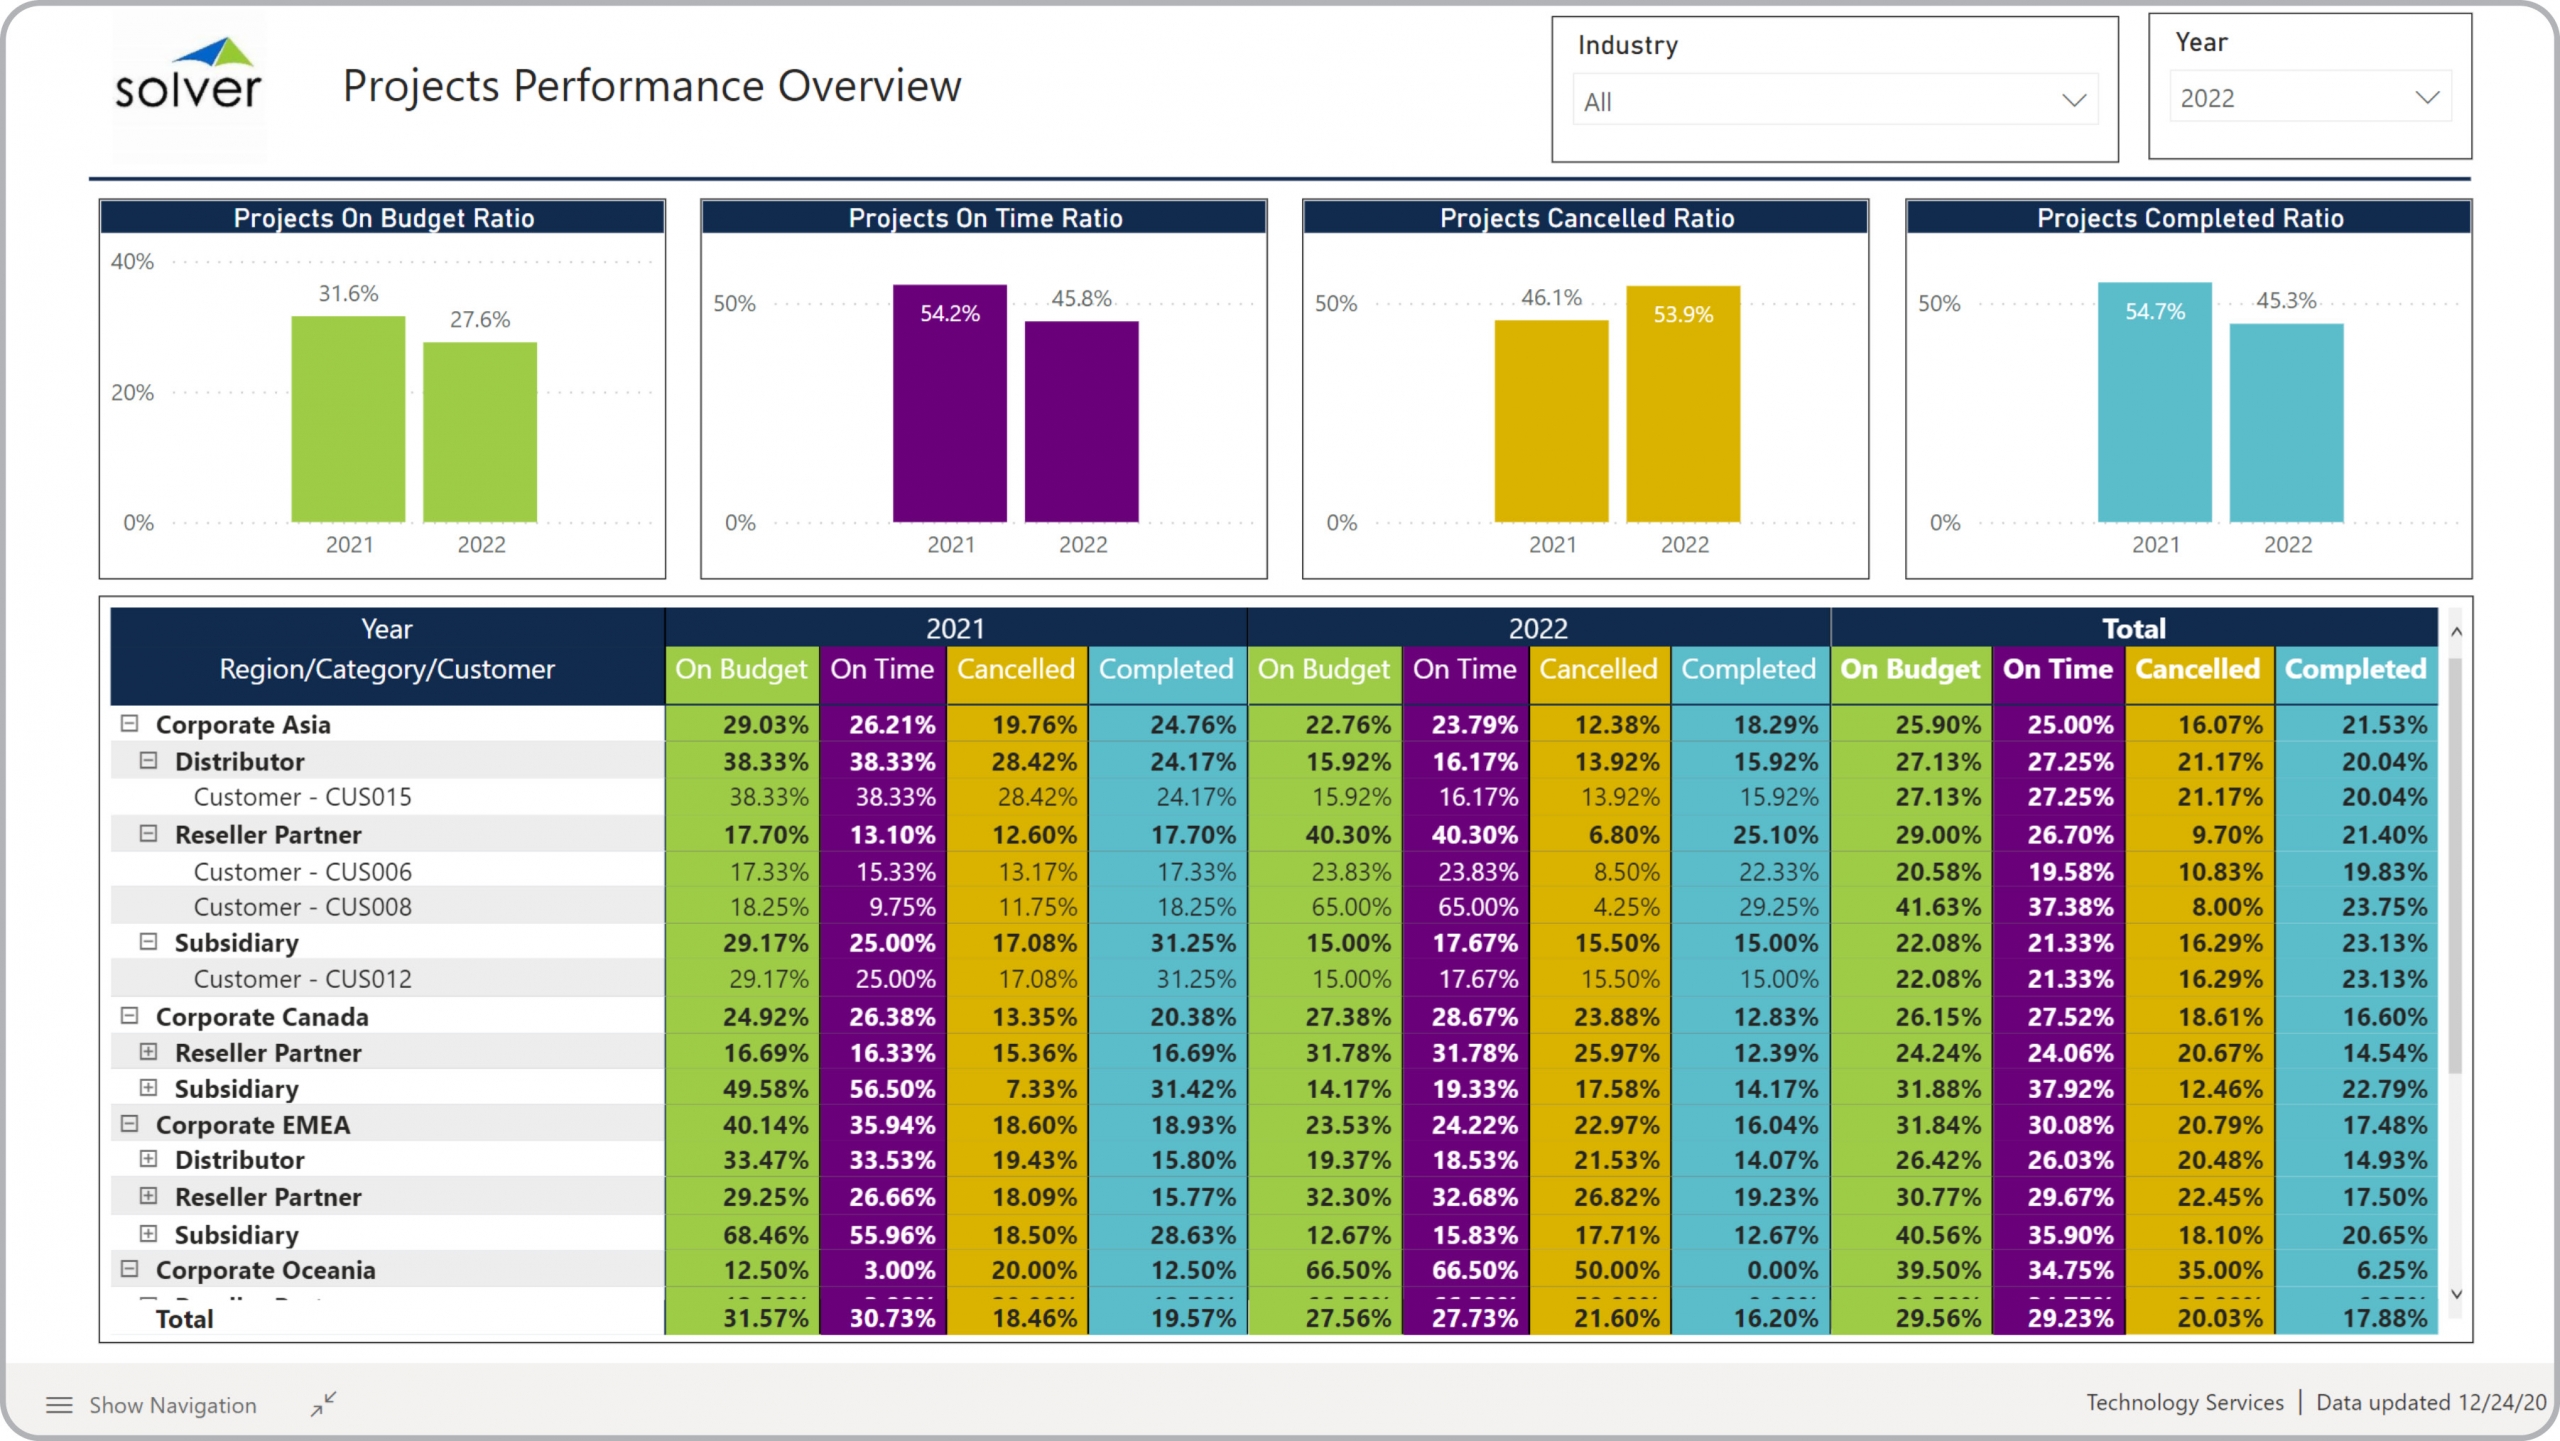
Tech – Project Performance Overview
Power BI dashboard for project analysis dashboard with metrics by project and customer and budgeted, completed, etc.
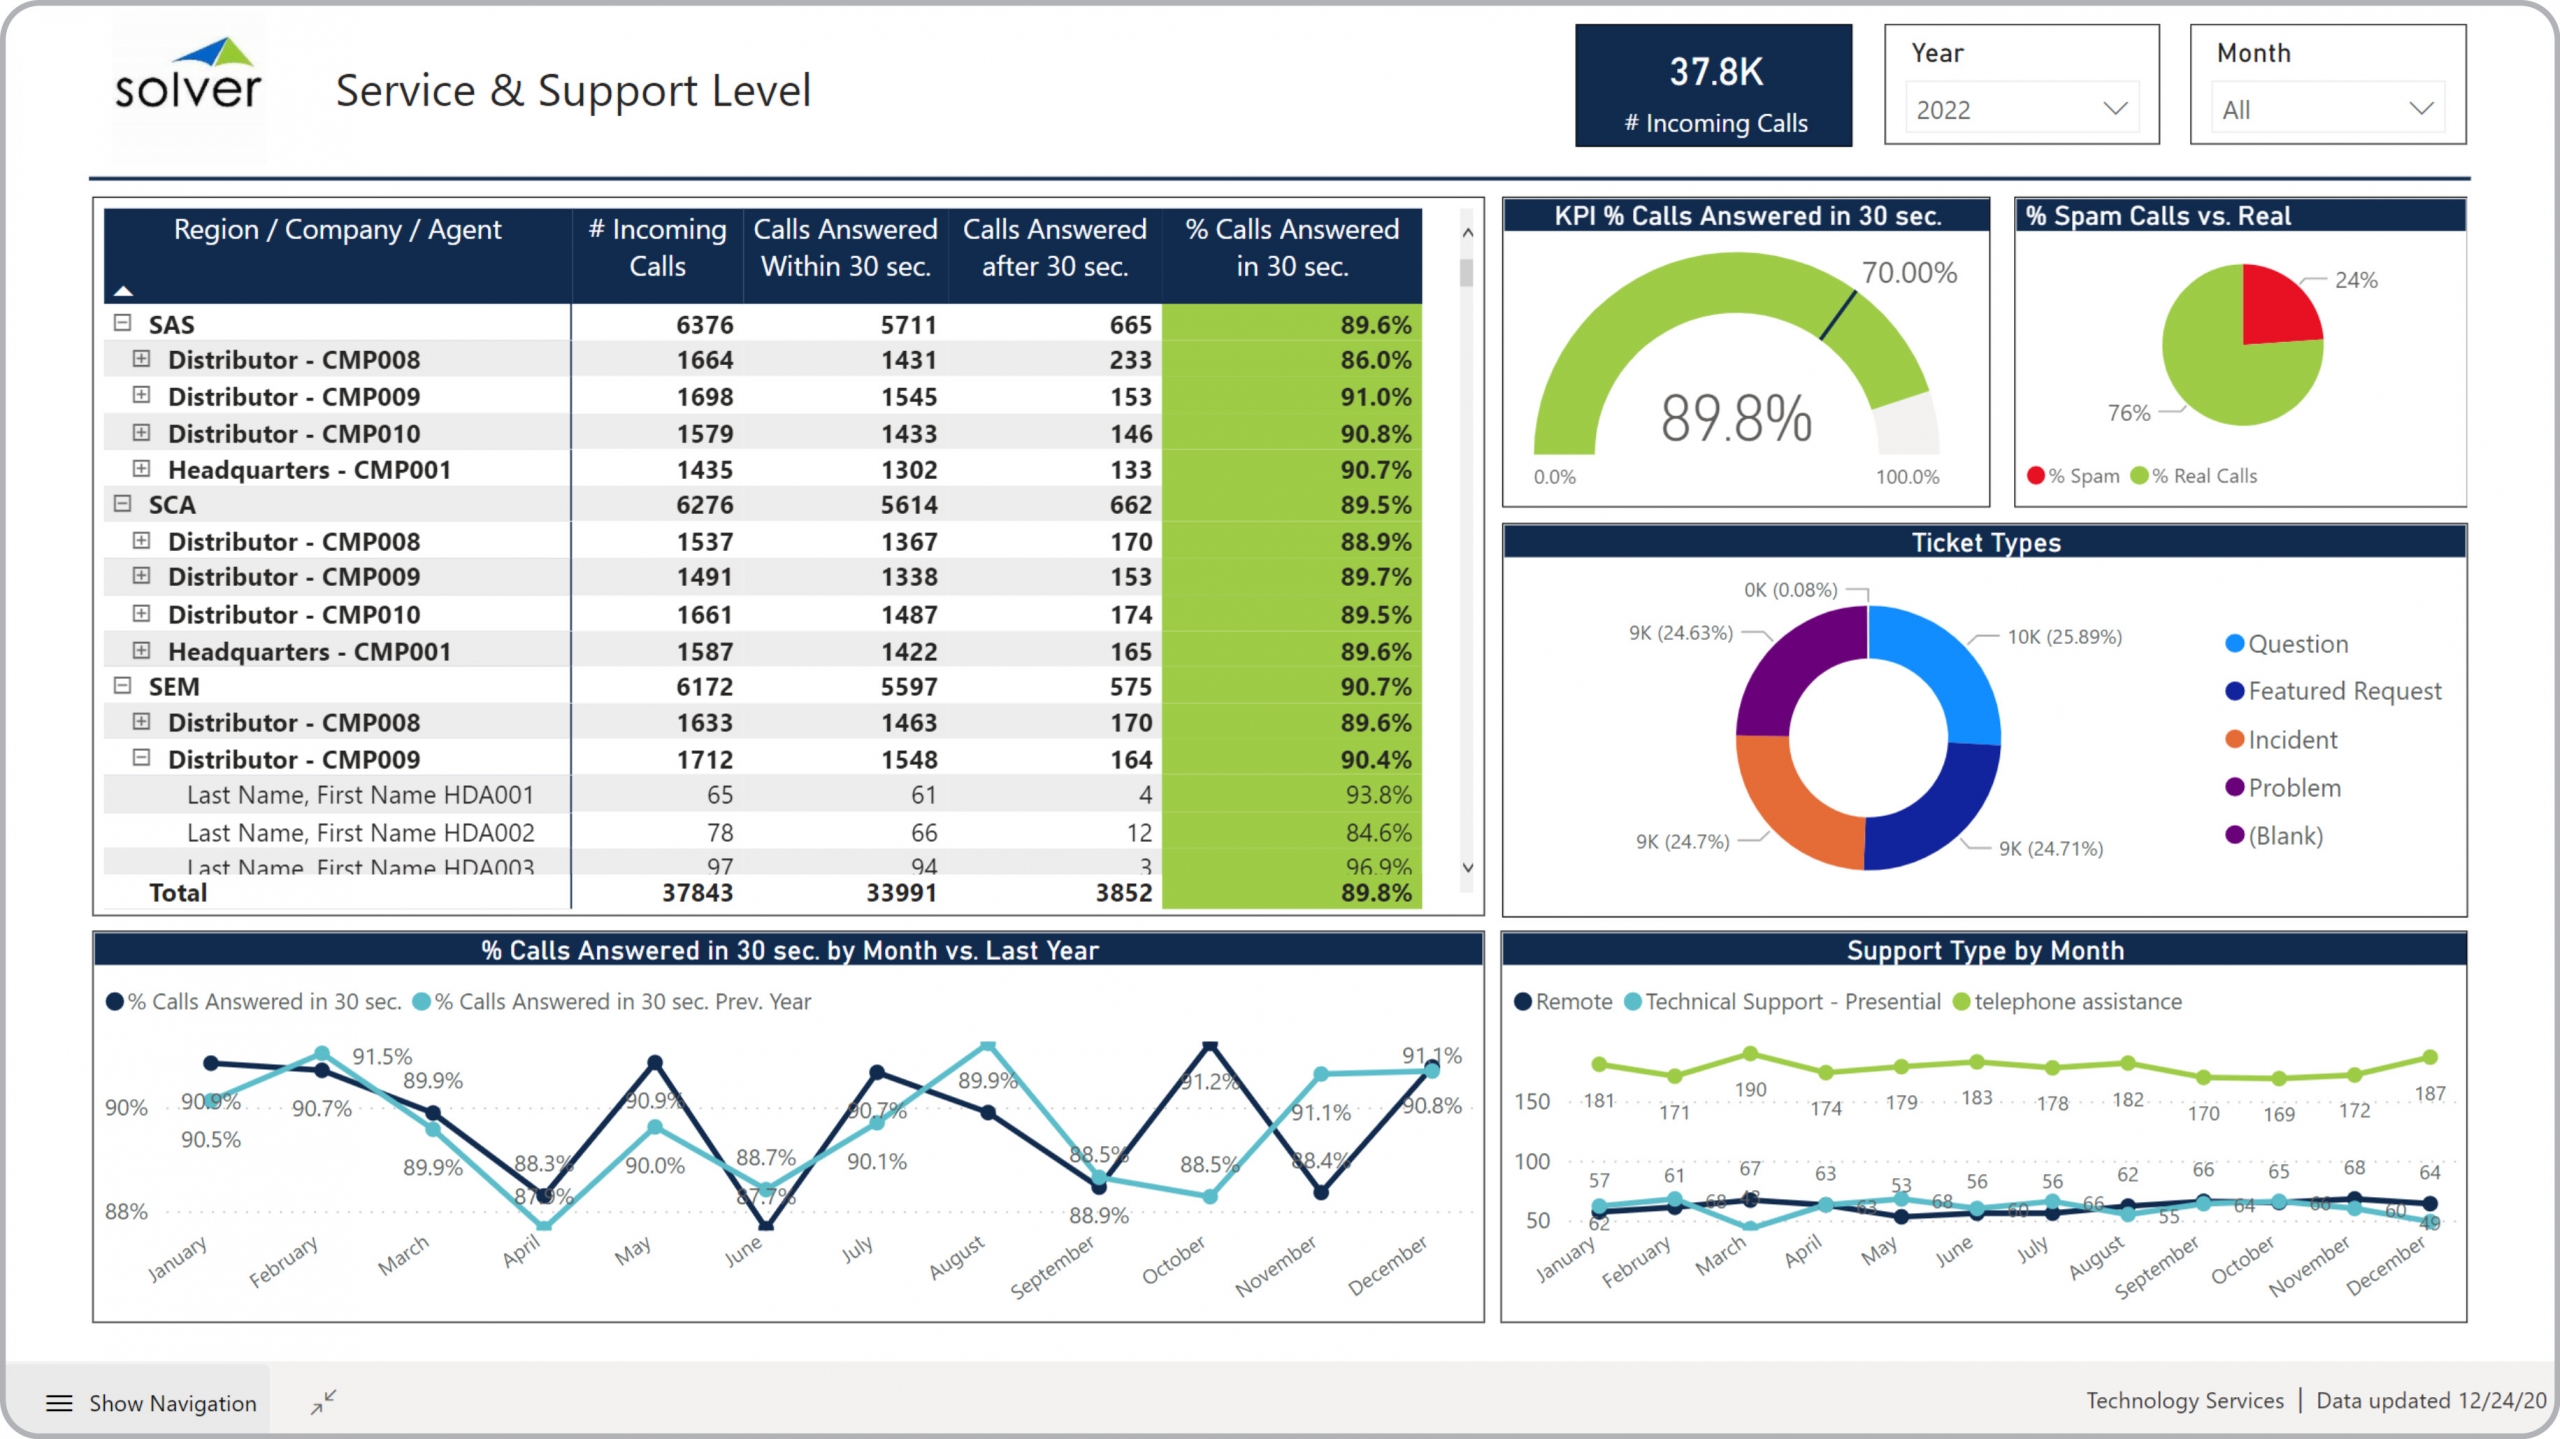
Tech – Service and Support Level
Power BI dashboard for analysis of helpdesk performance incl. response times, support ticket volume and ticket type.
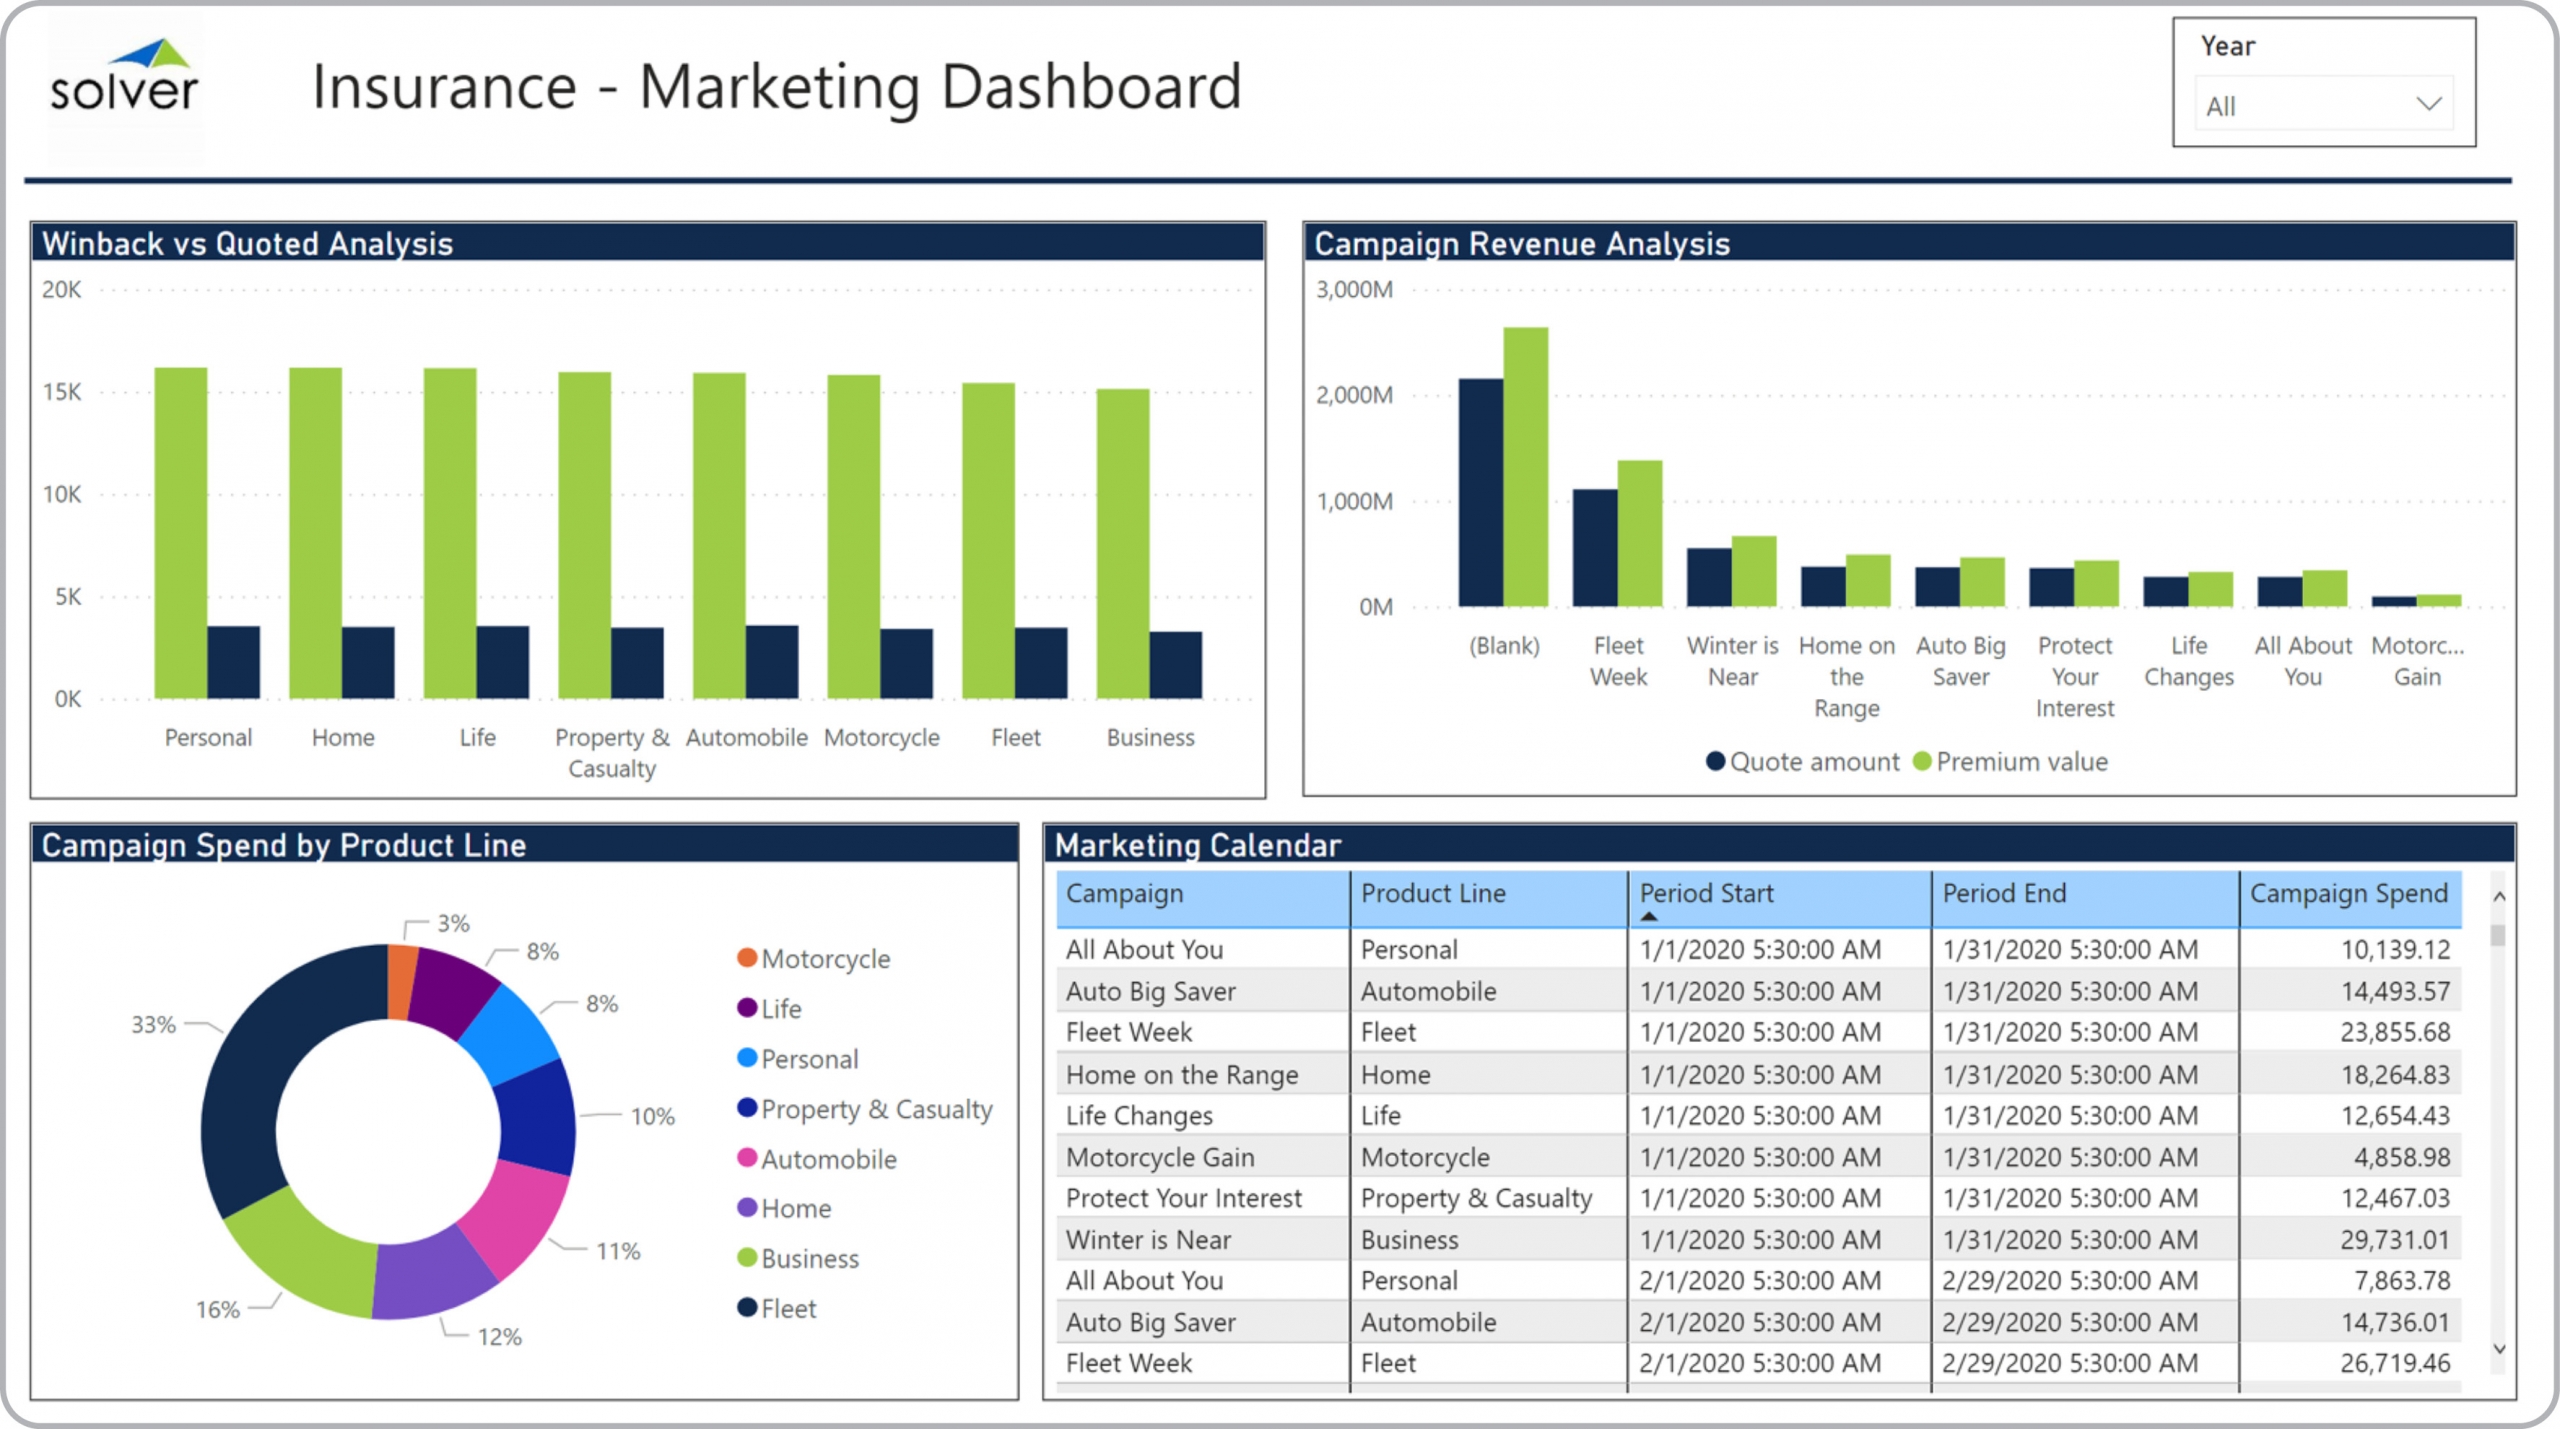
Insurance – Marketing
Power BI dashboard for won versus quoted deals by product, campaign revenue and spend, marketing calendar.
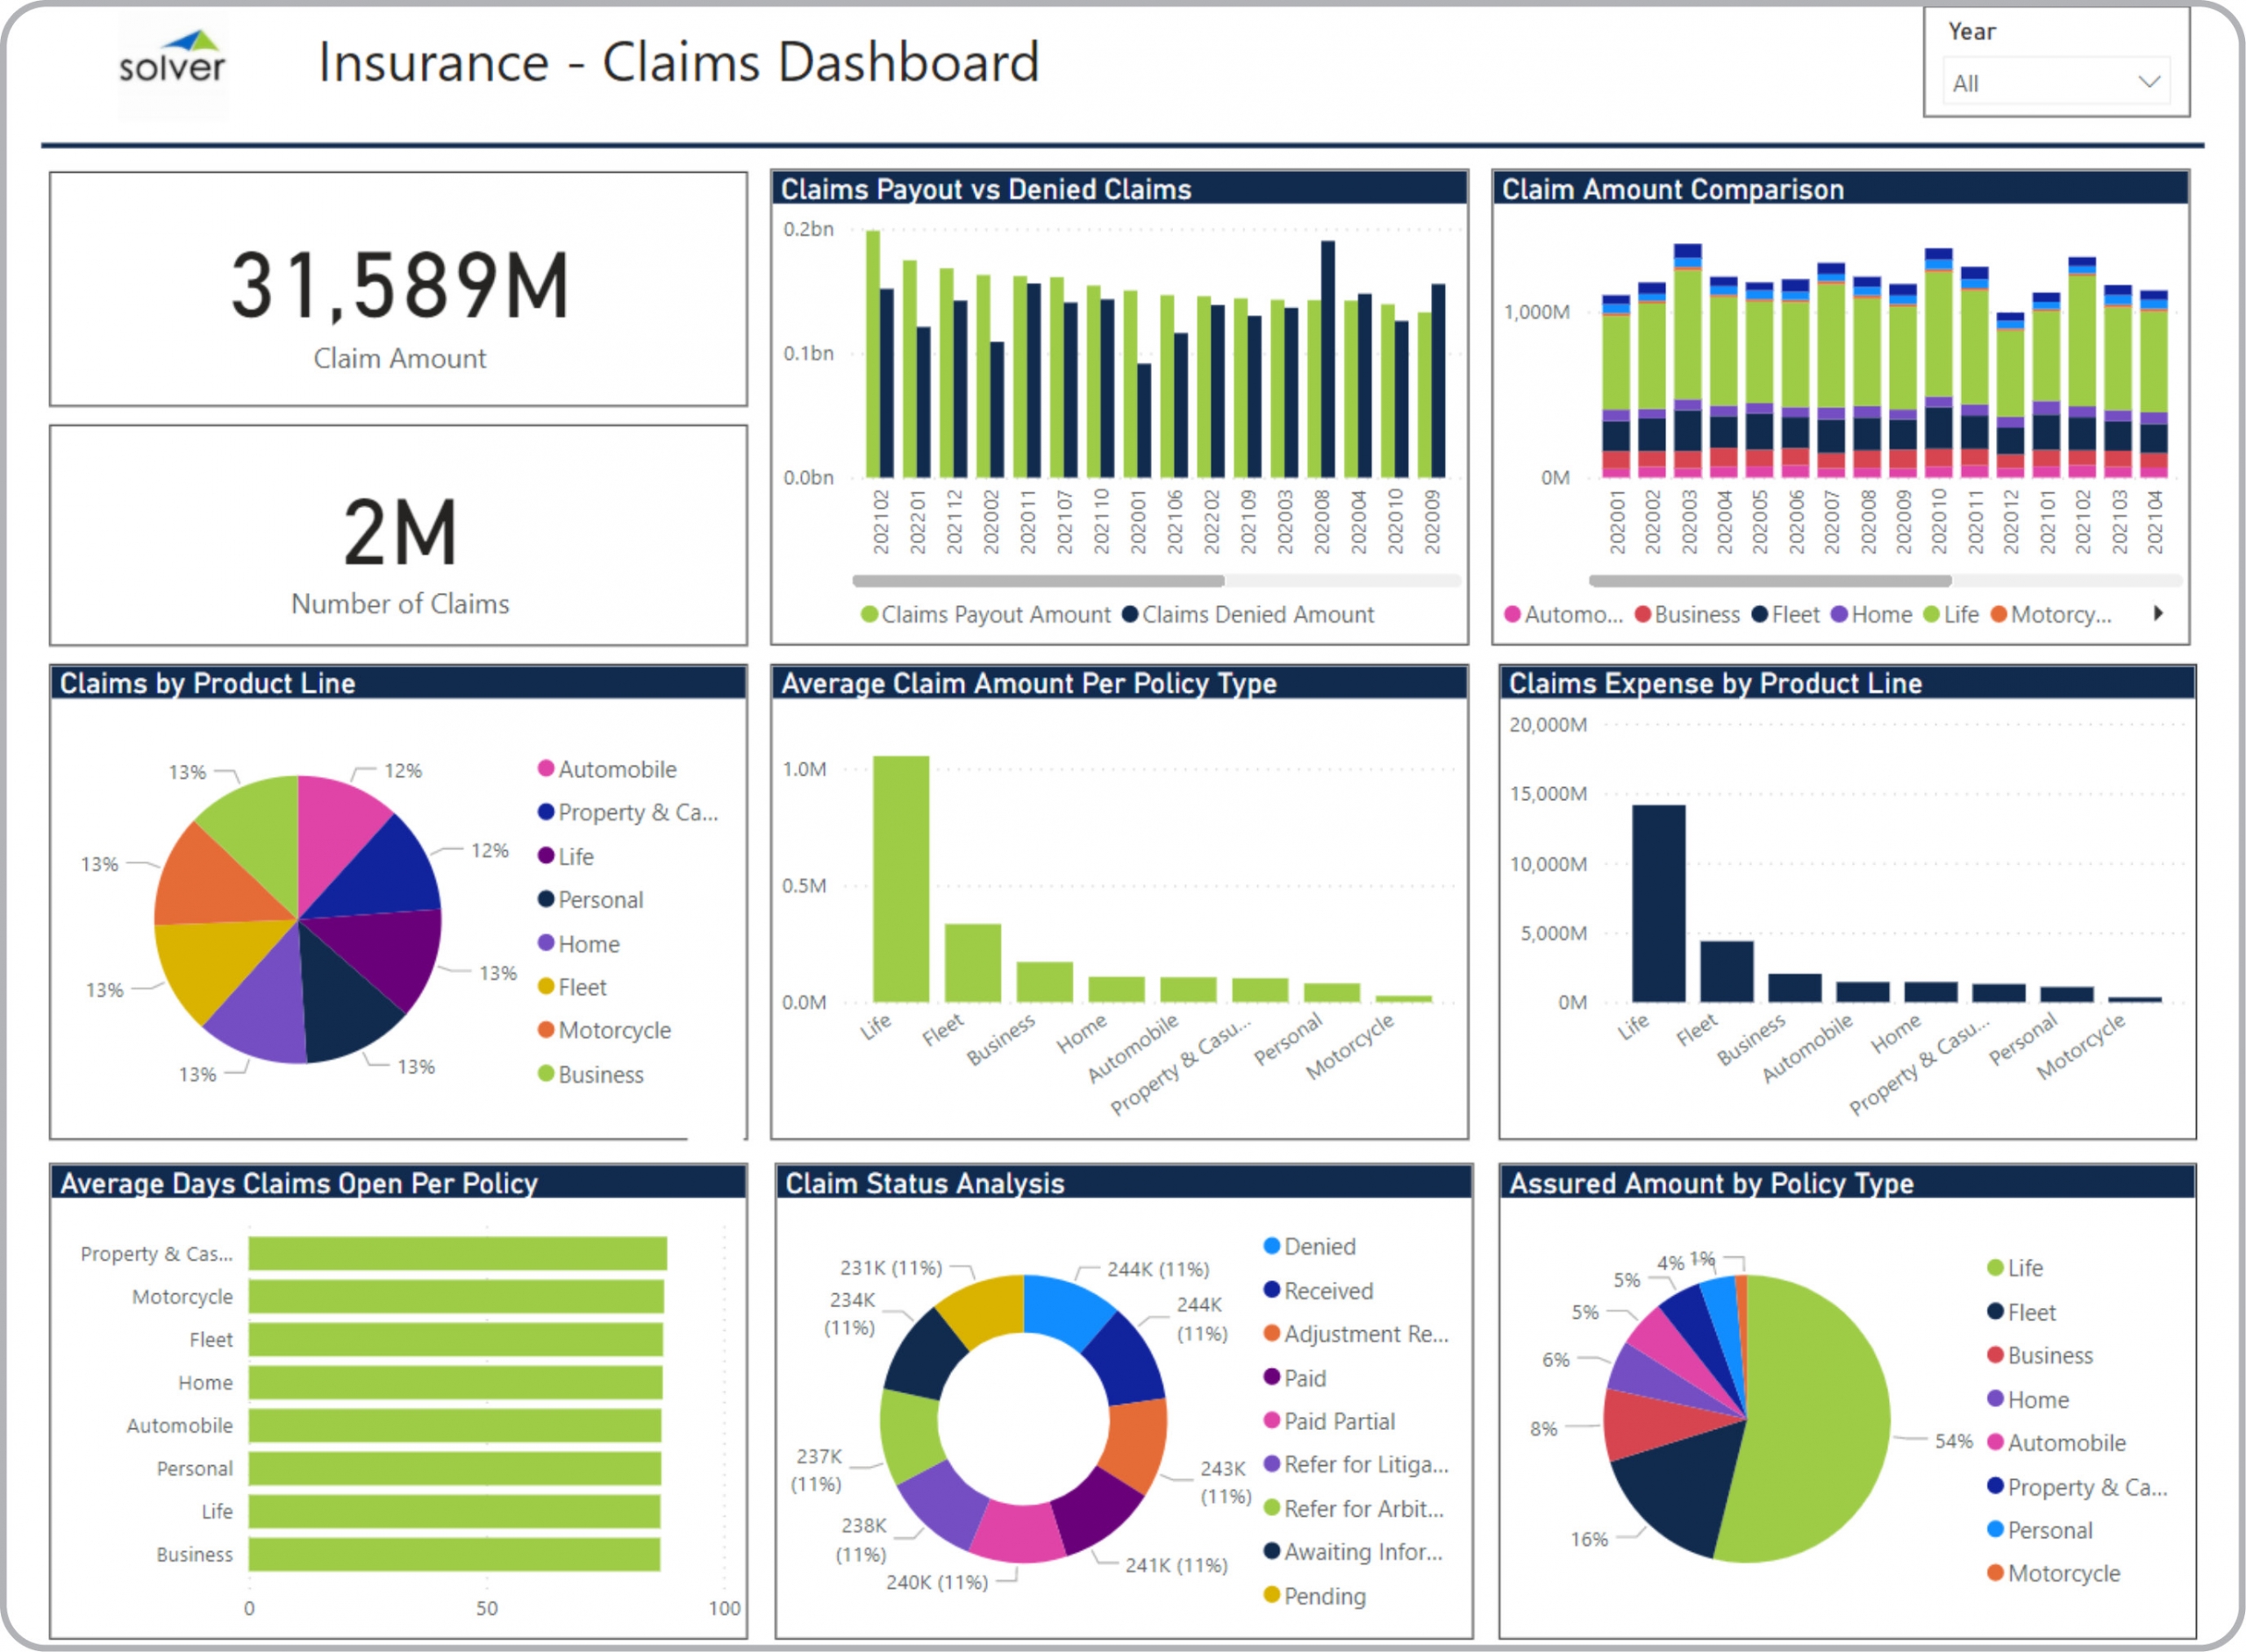
Insurance – Claims
Power BI dashboard for analysis of claims KPIs including amount, number of claims, status, assured amount by policy, etc.
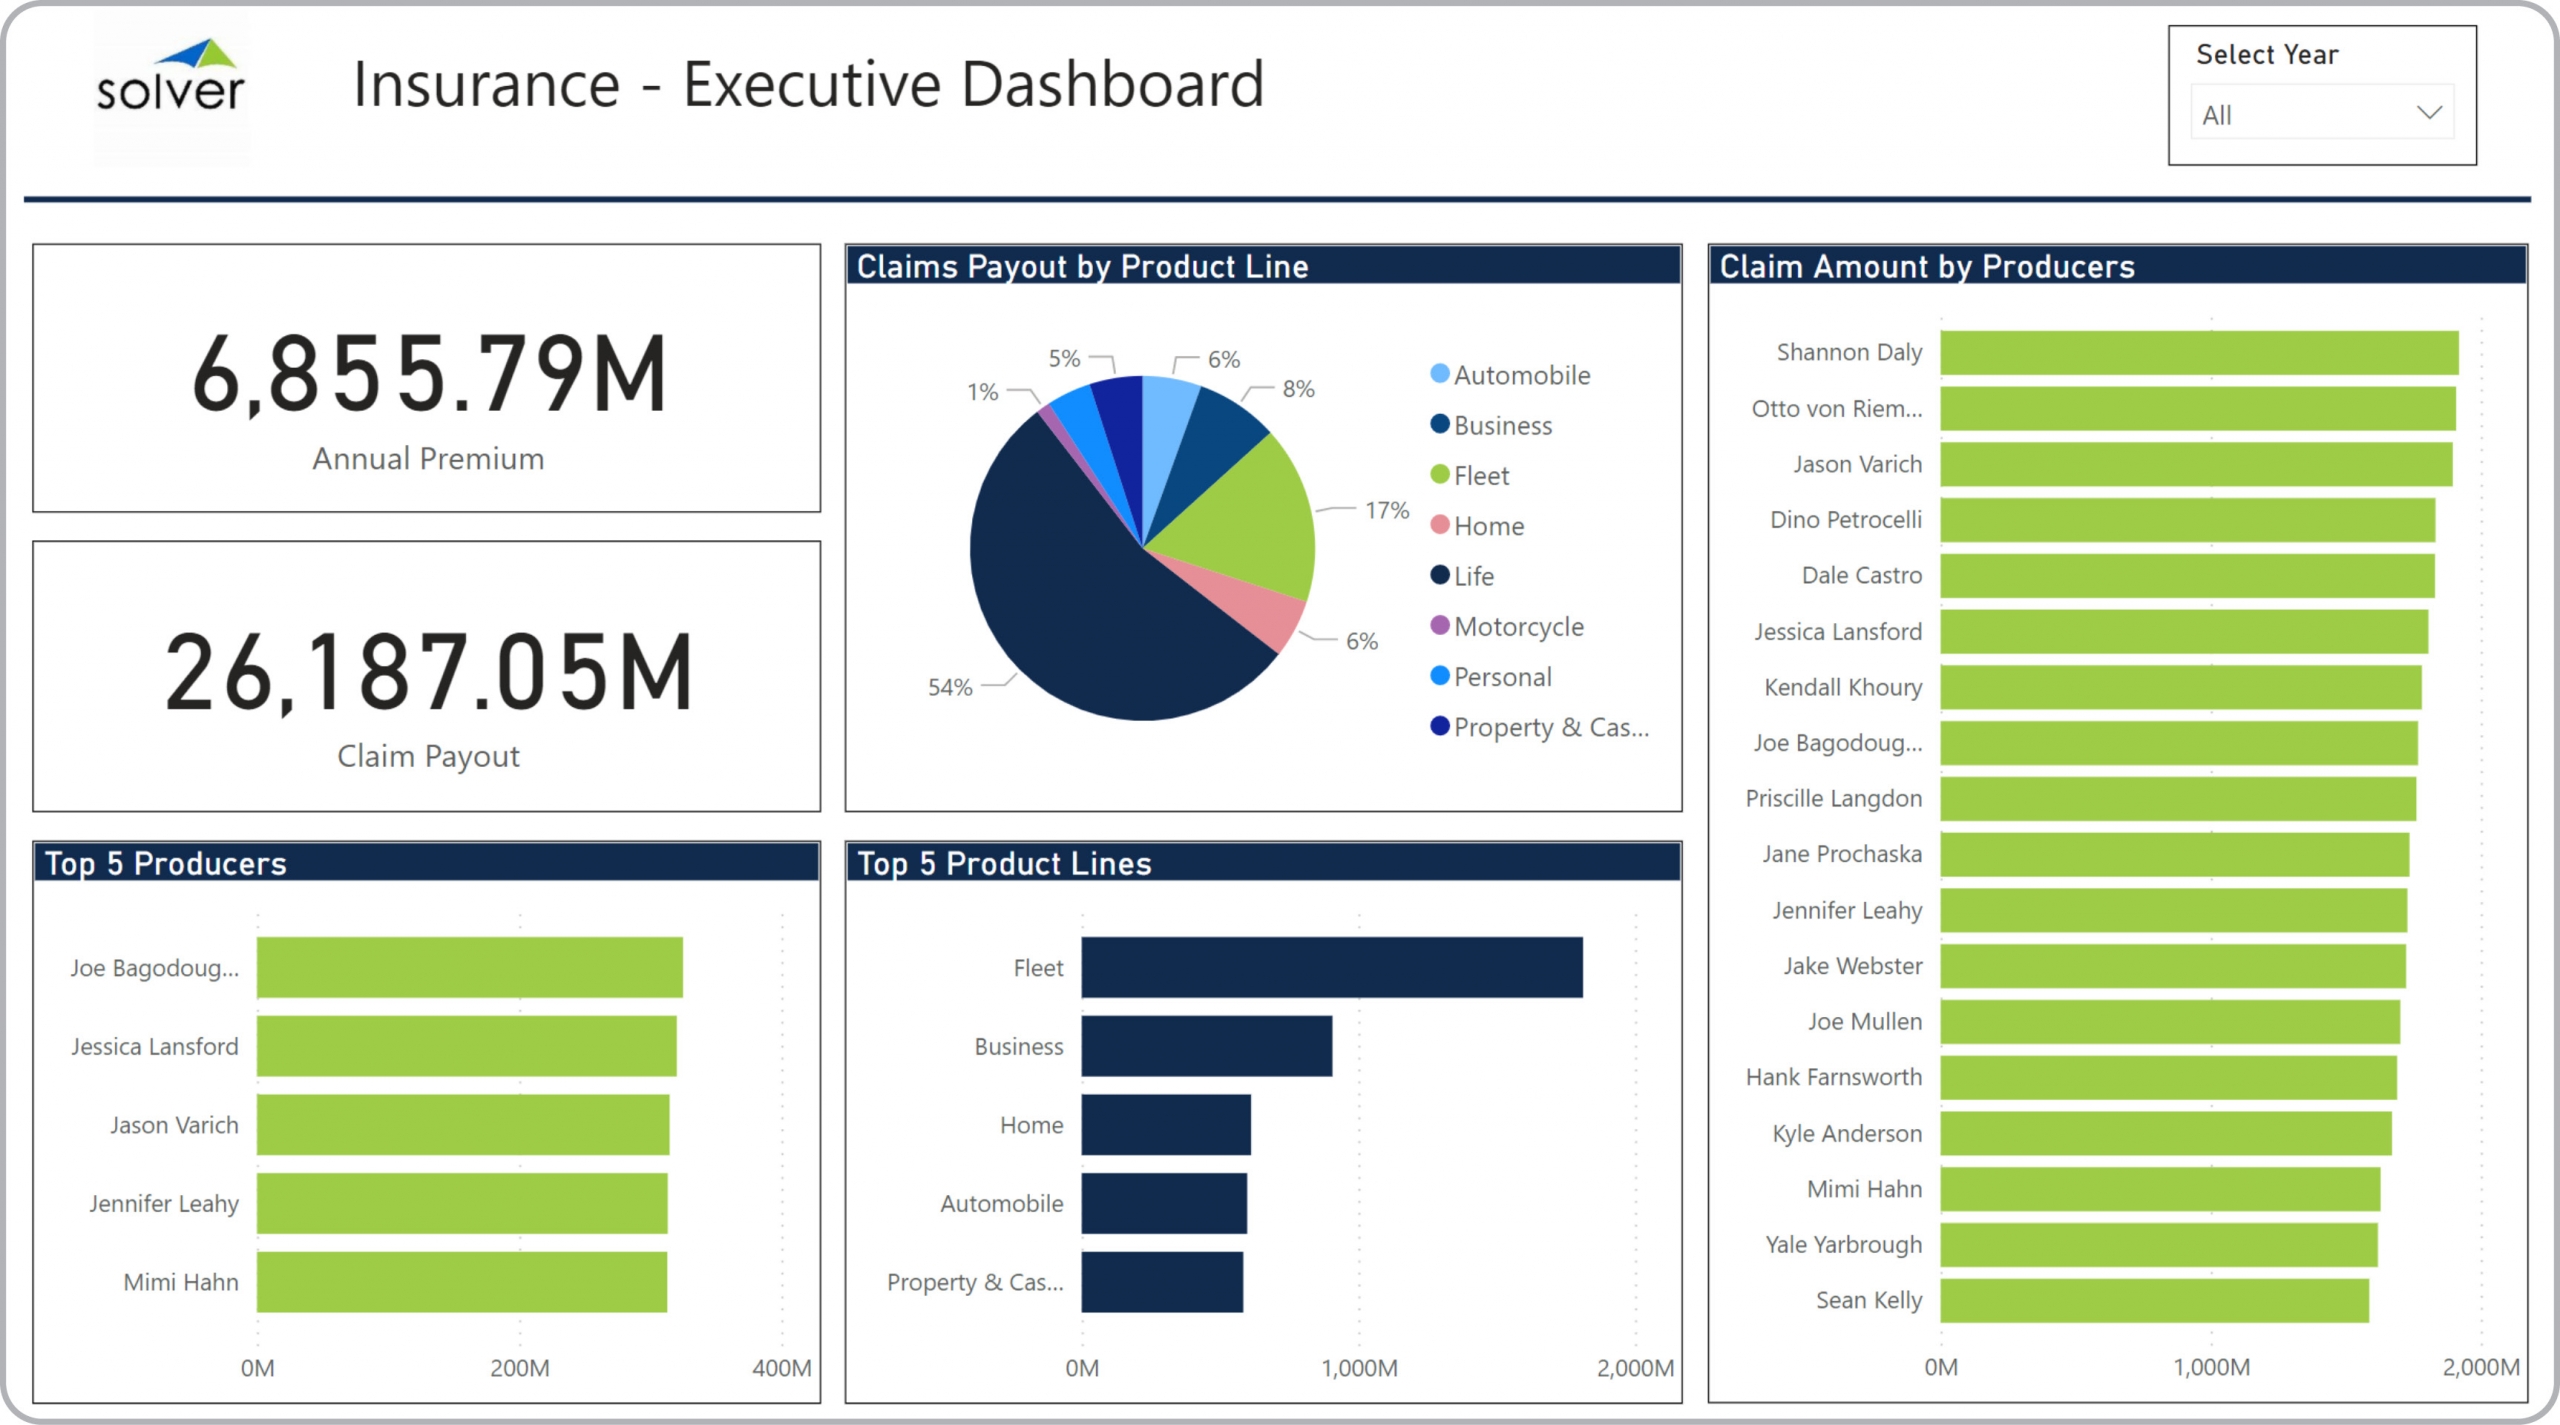
Insurance – Executive Dashboard
Power BI dashboard for top KPIs for an executive including claims, top producers and top products.
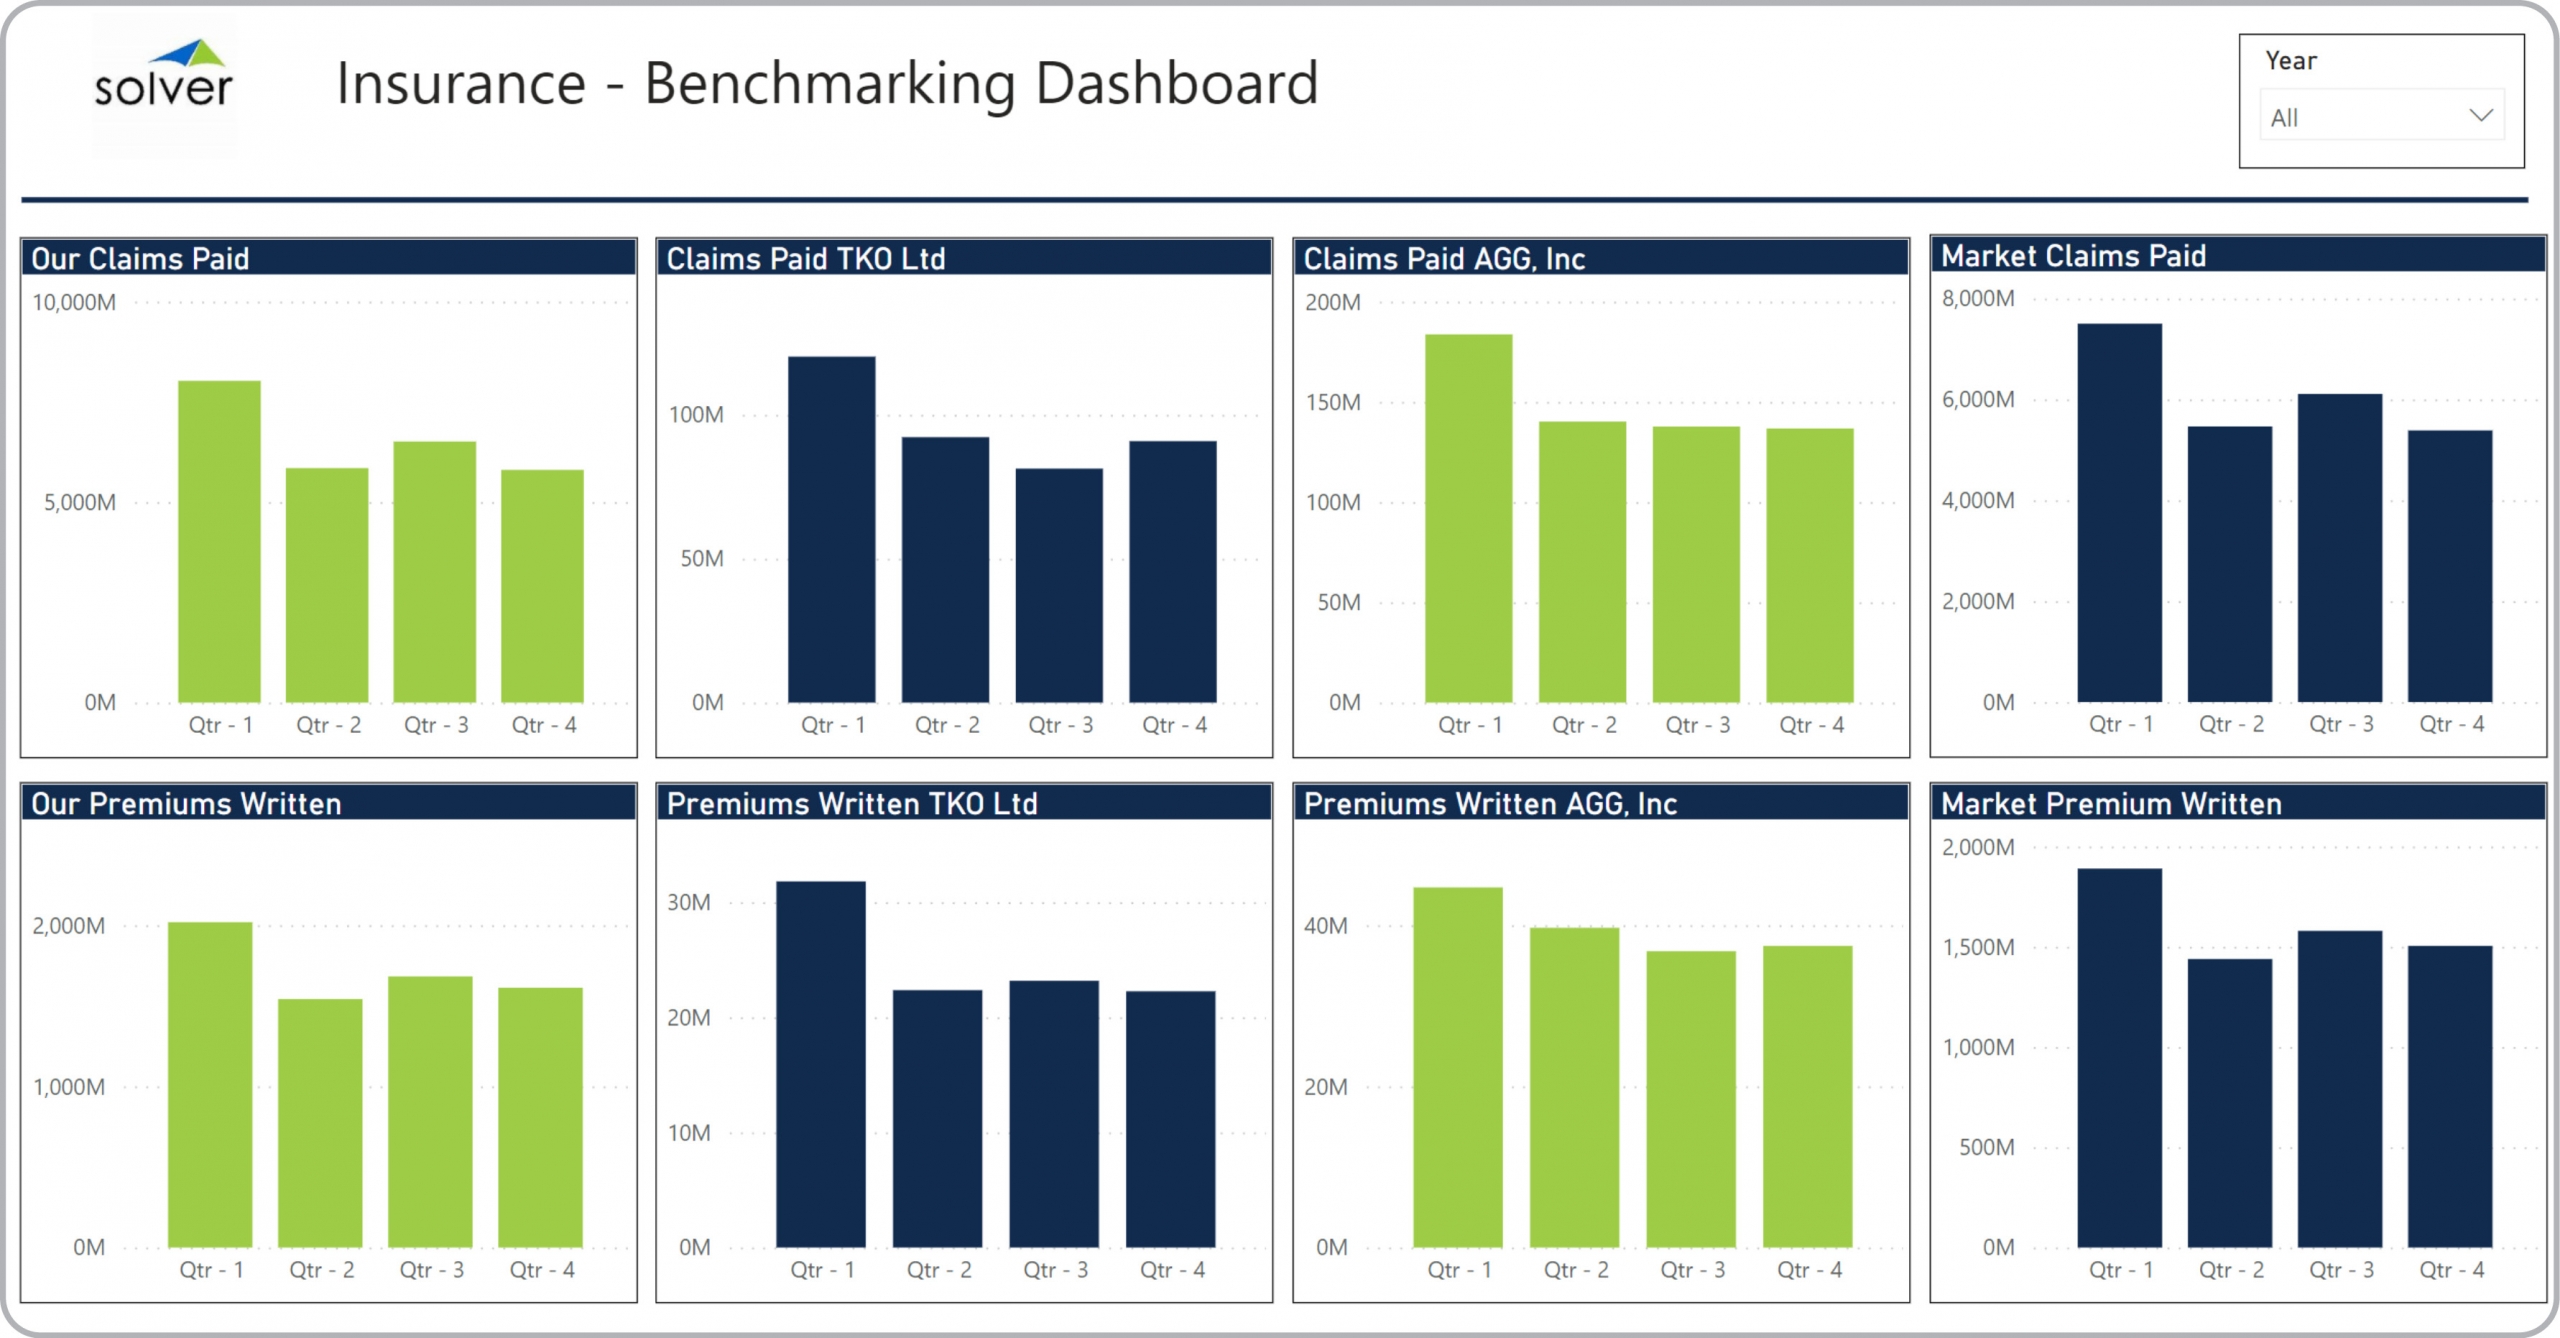
Insurance – Benchmarking
Power BI dashboard for comparing quarterly claims paid and premiums written with other companies.
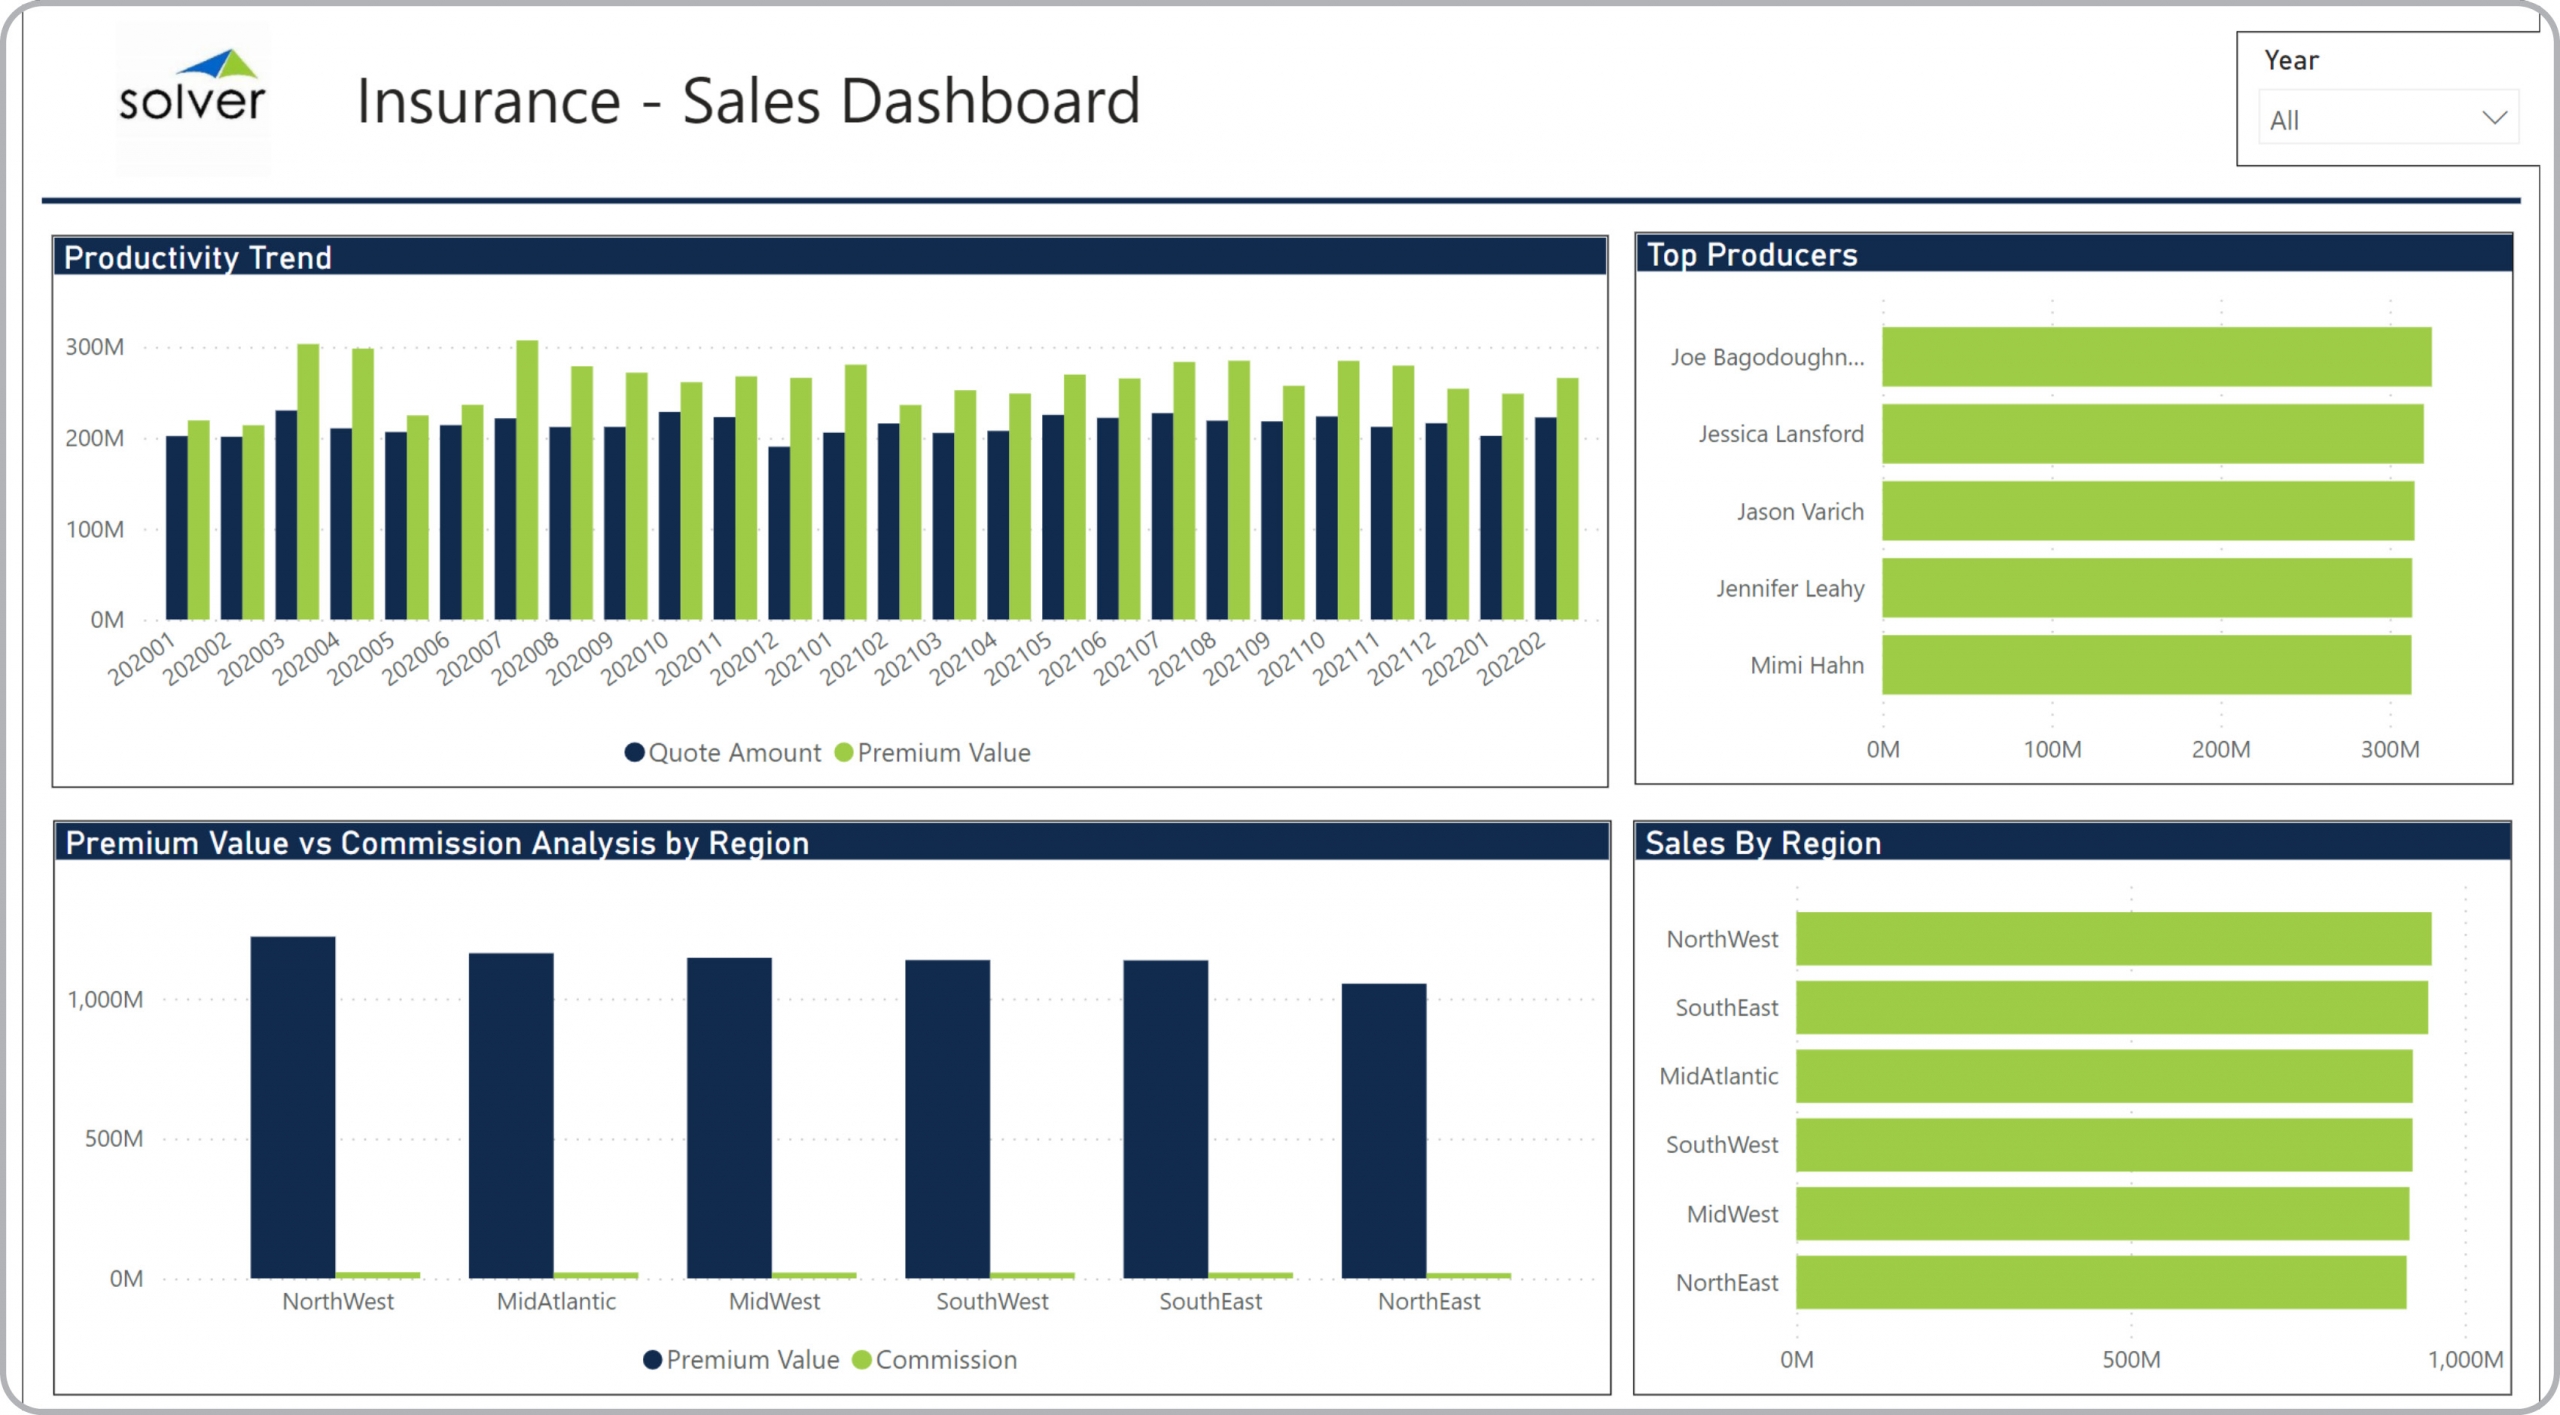
Insurance – Sales
Power BI dashboard for productivity trend analysis, top sales by producer and sales by region.
Distr – Executive Dashboard
Summary view of distribution KPIs like inventory turnover, top customers and products

Bank – Securities Dashboard
Power BI dashboard for securities tree map by market value, securities ranks by book value and yield.

Bank – Product Dashboard
Power BI dashboard for securities tree map by market value, securities ranks by book value and yield.
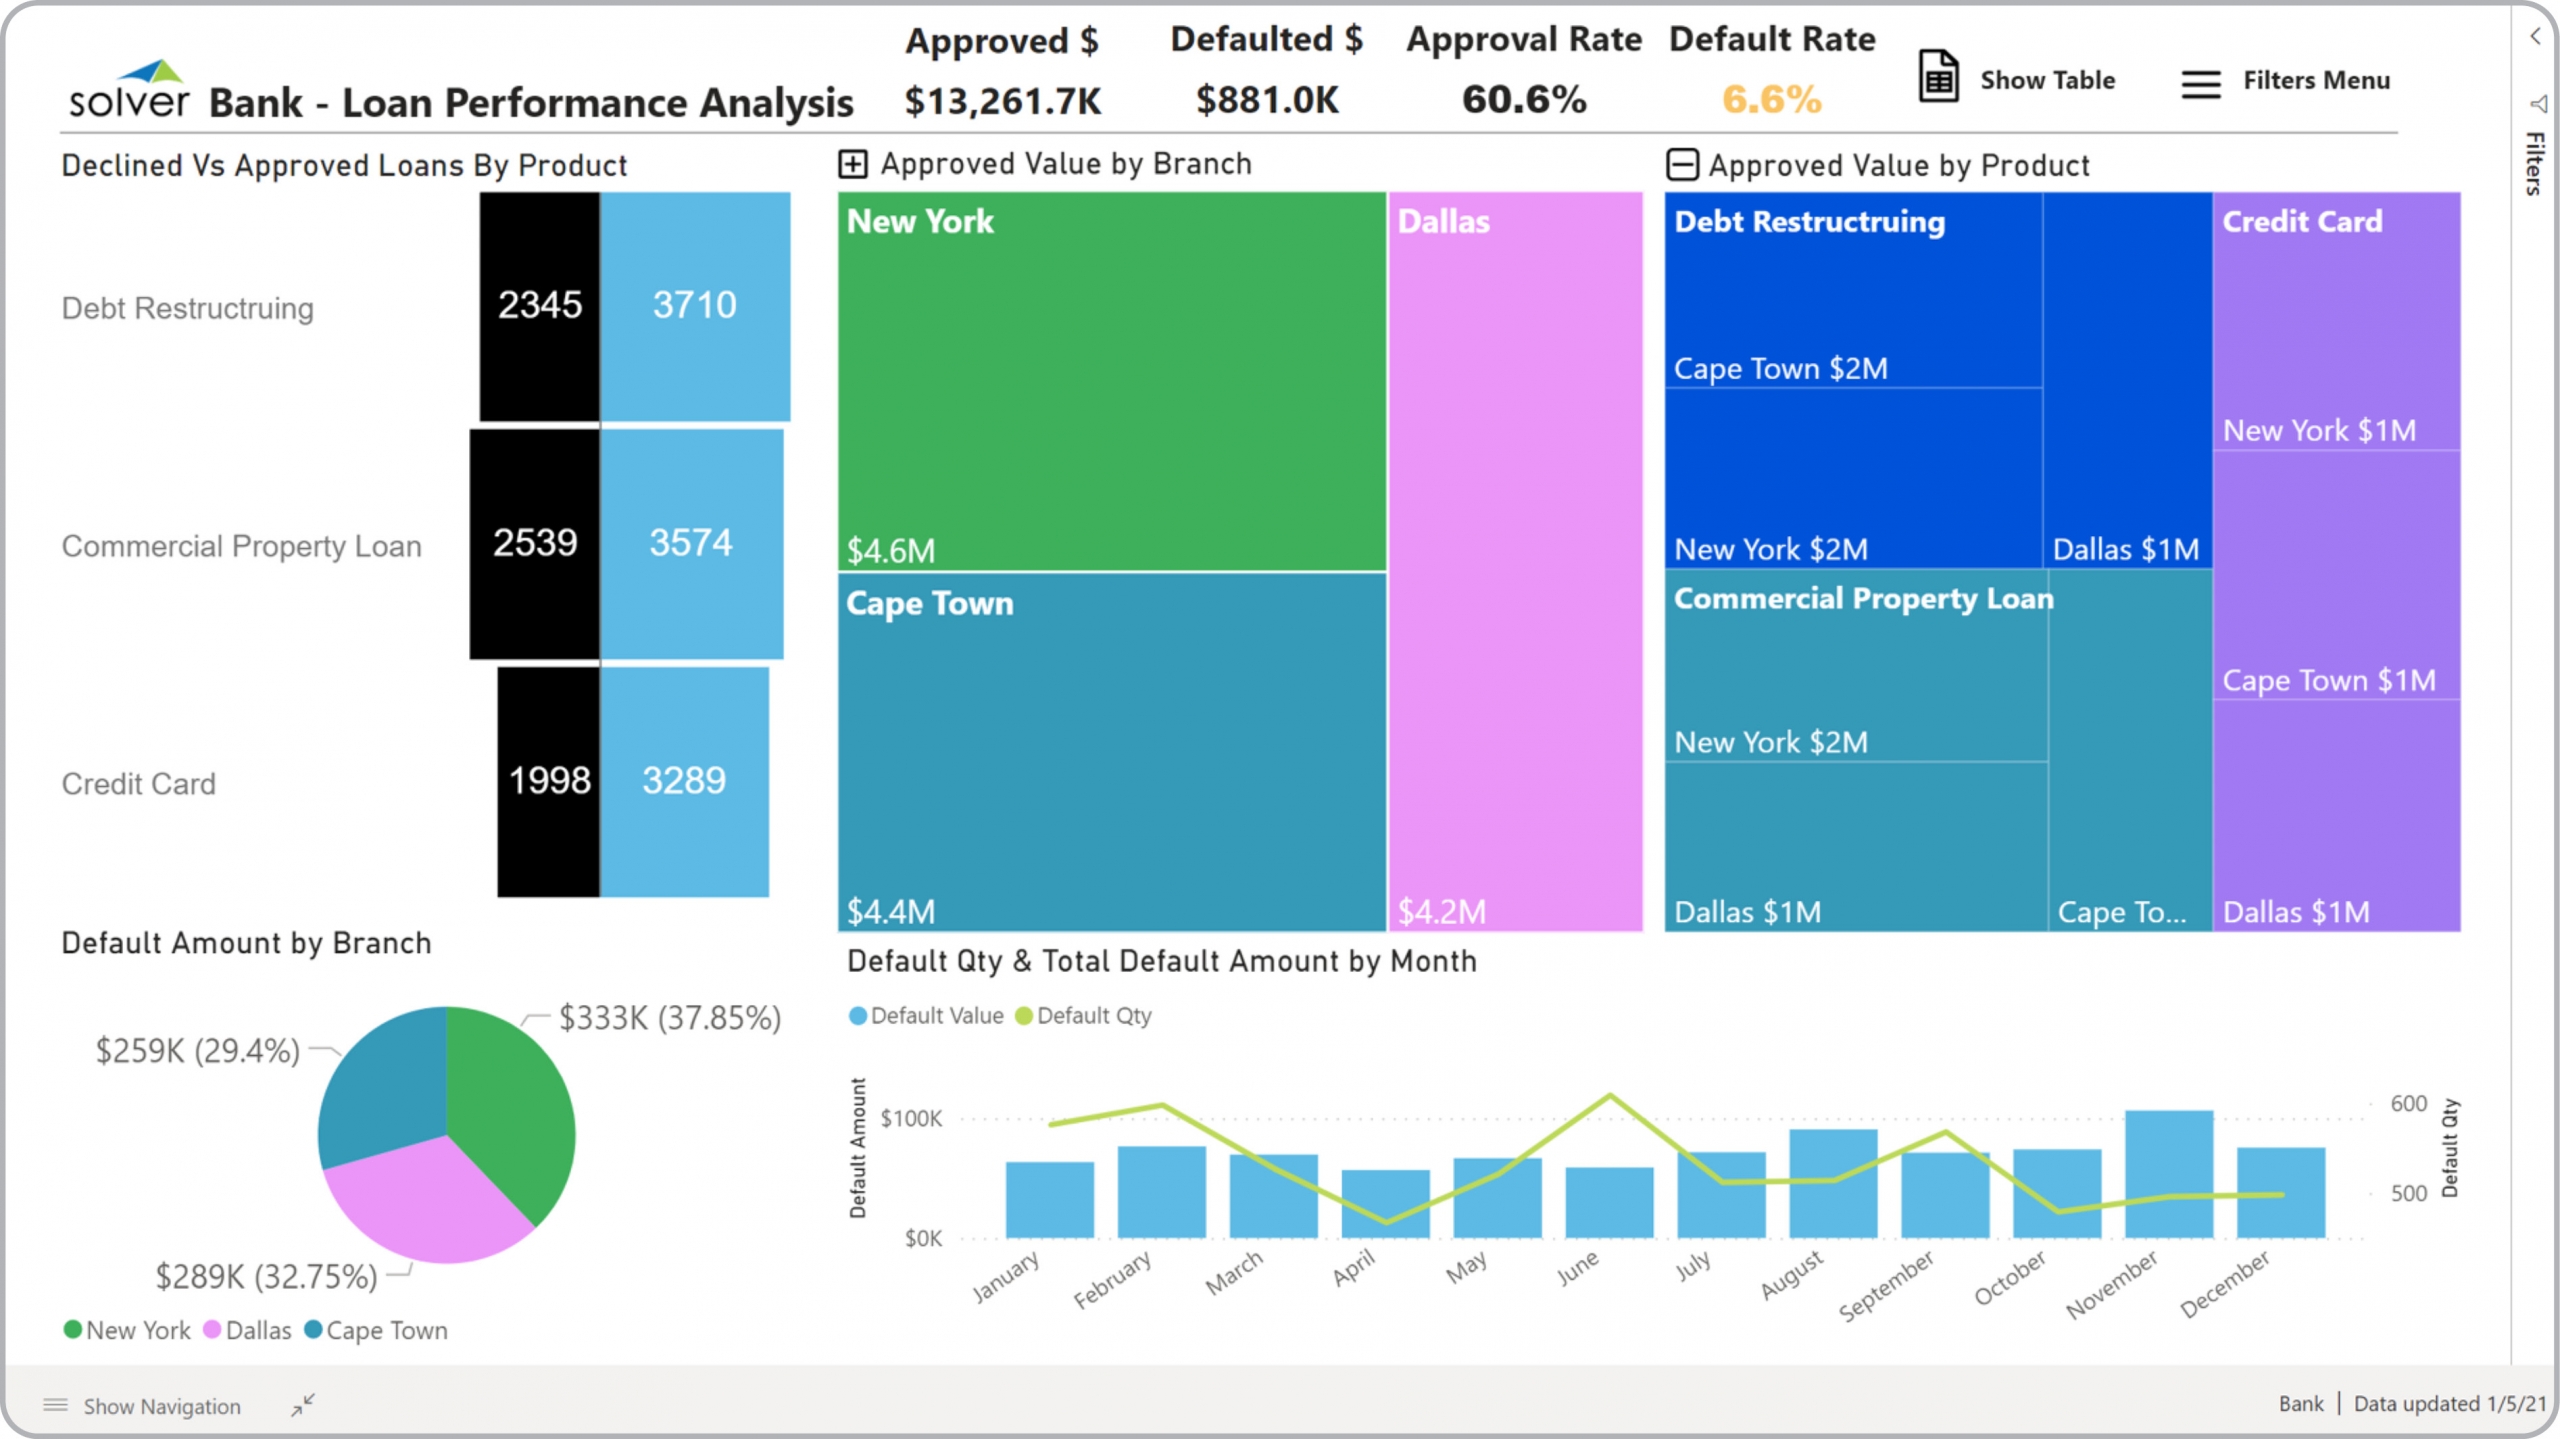
Bank – Loan Performance
Power BI dashboard for declined vs approved loans by product, loan defaults by branch, default trend, loans approved.
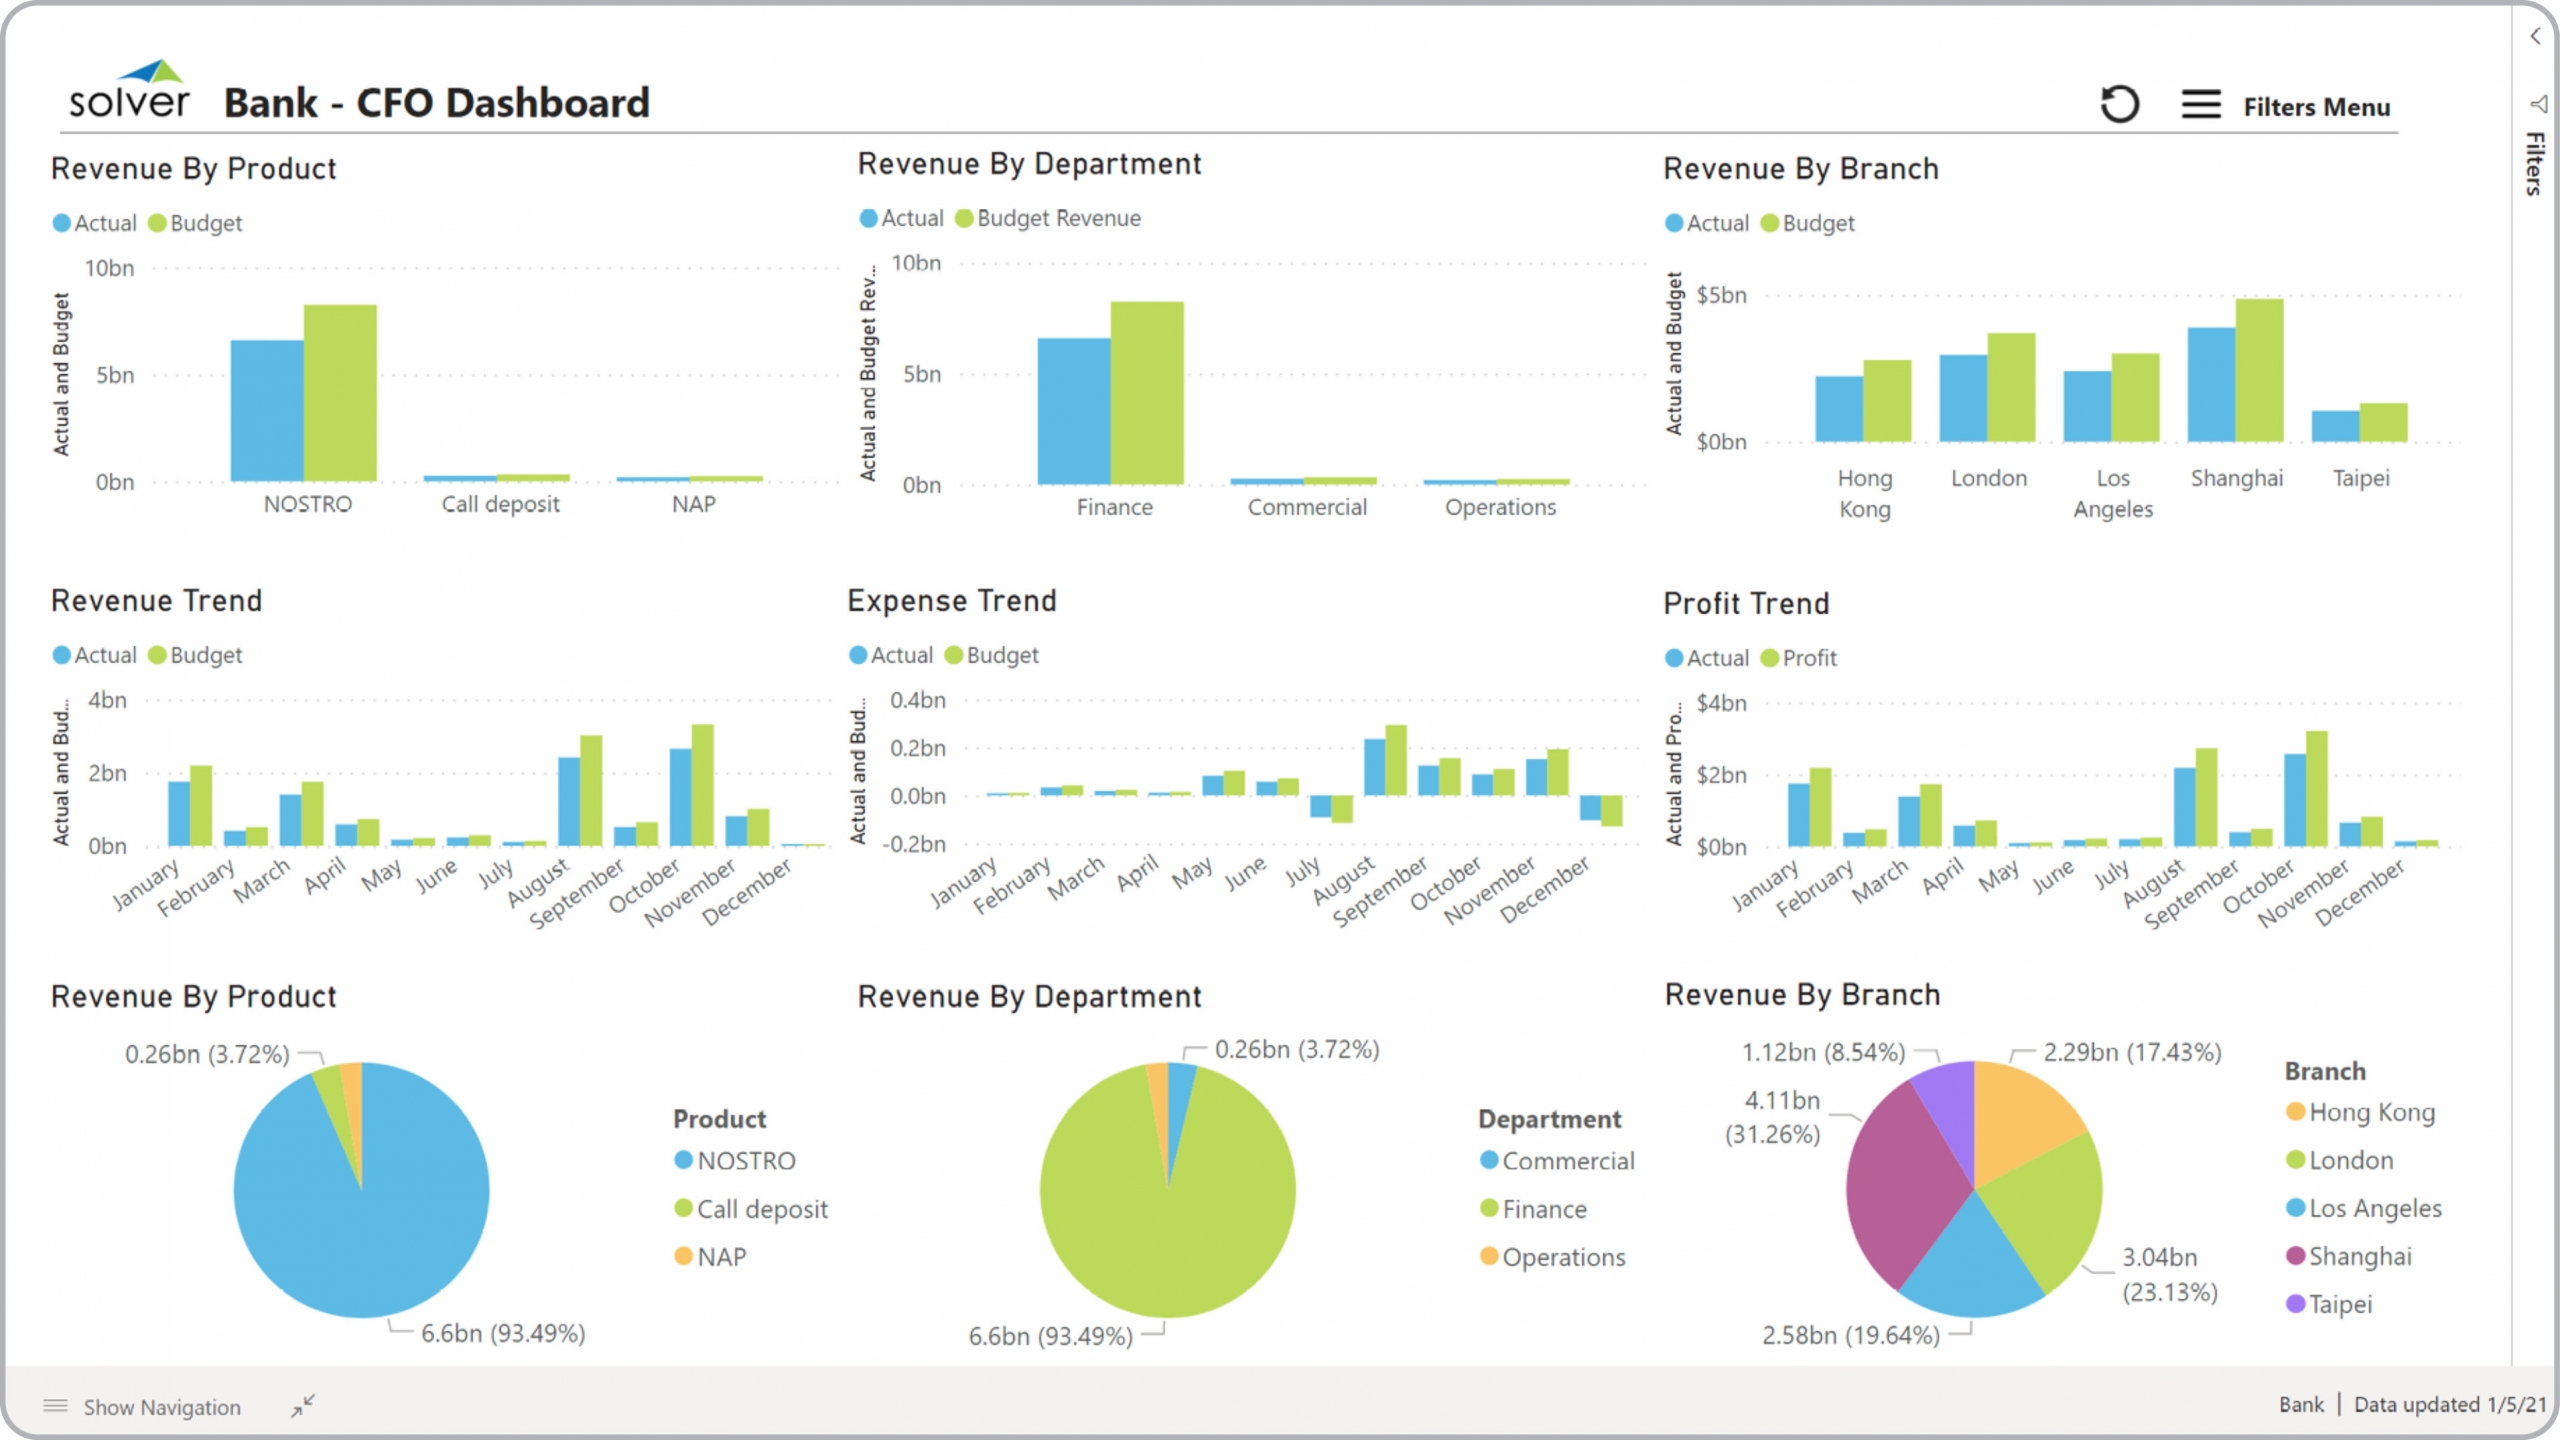
Bank – CFO Dashboard
Power BI dashboard for analysis of revenues by product and department, expenses, and profit.
Bank – New Customer Acquisition
Power BI dashboard for analysis of acquired customers and related loans and metrics.
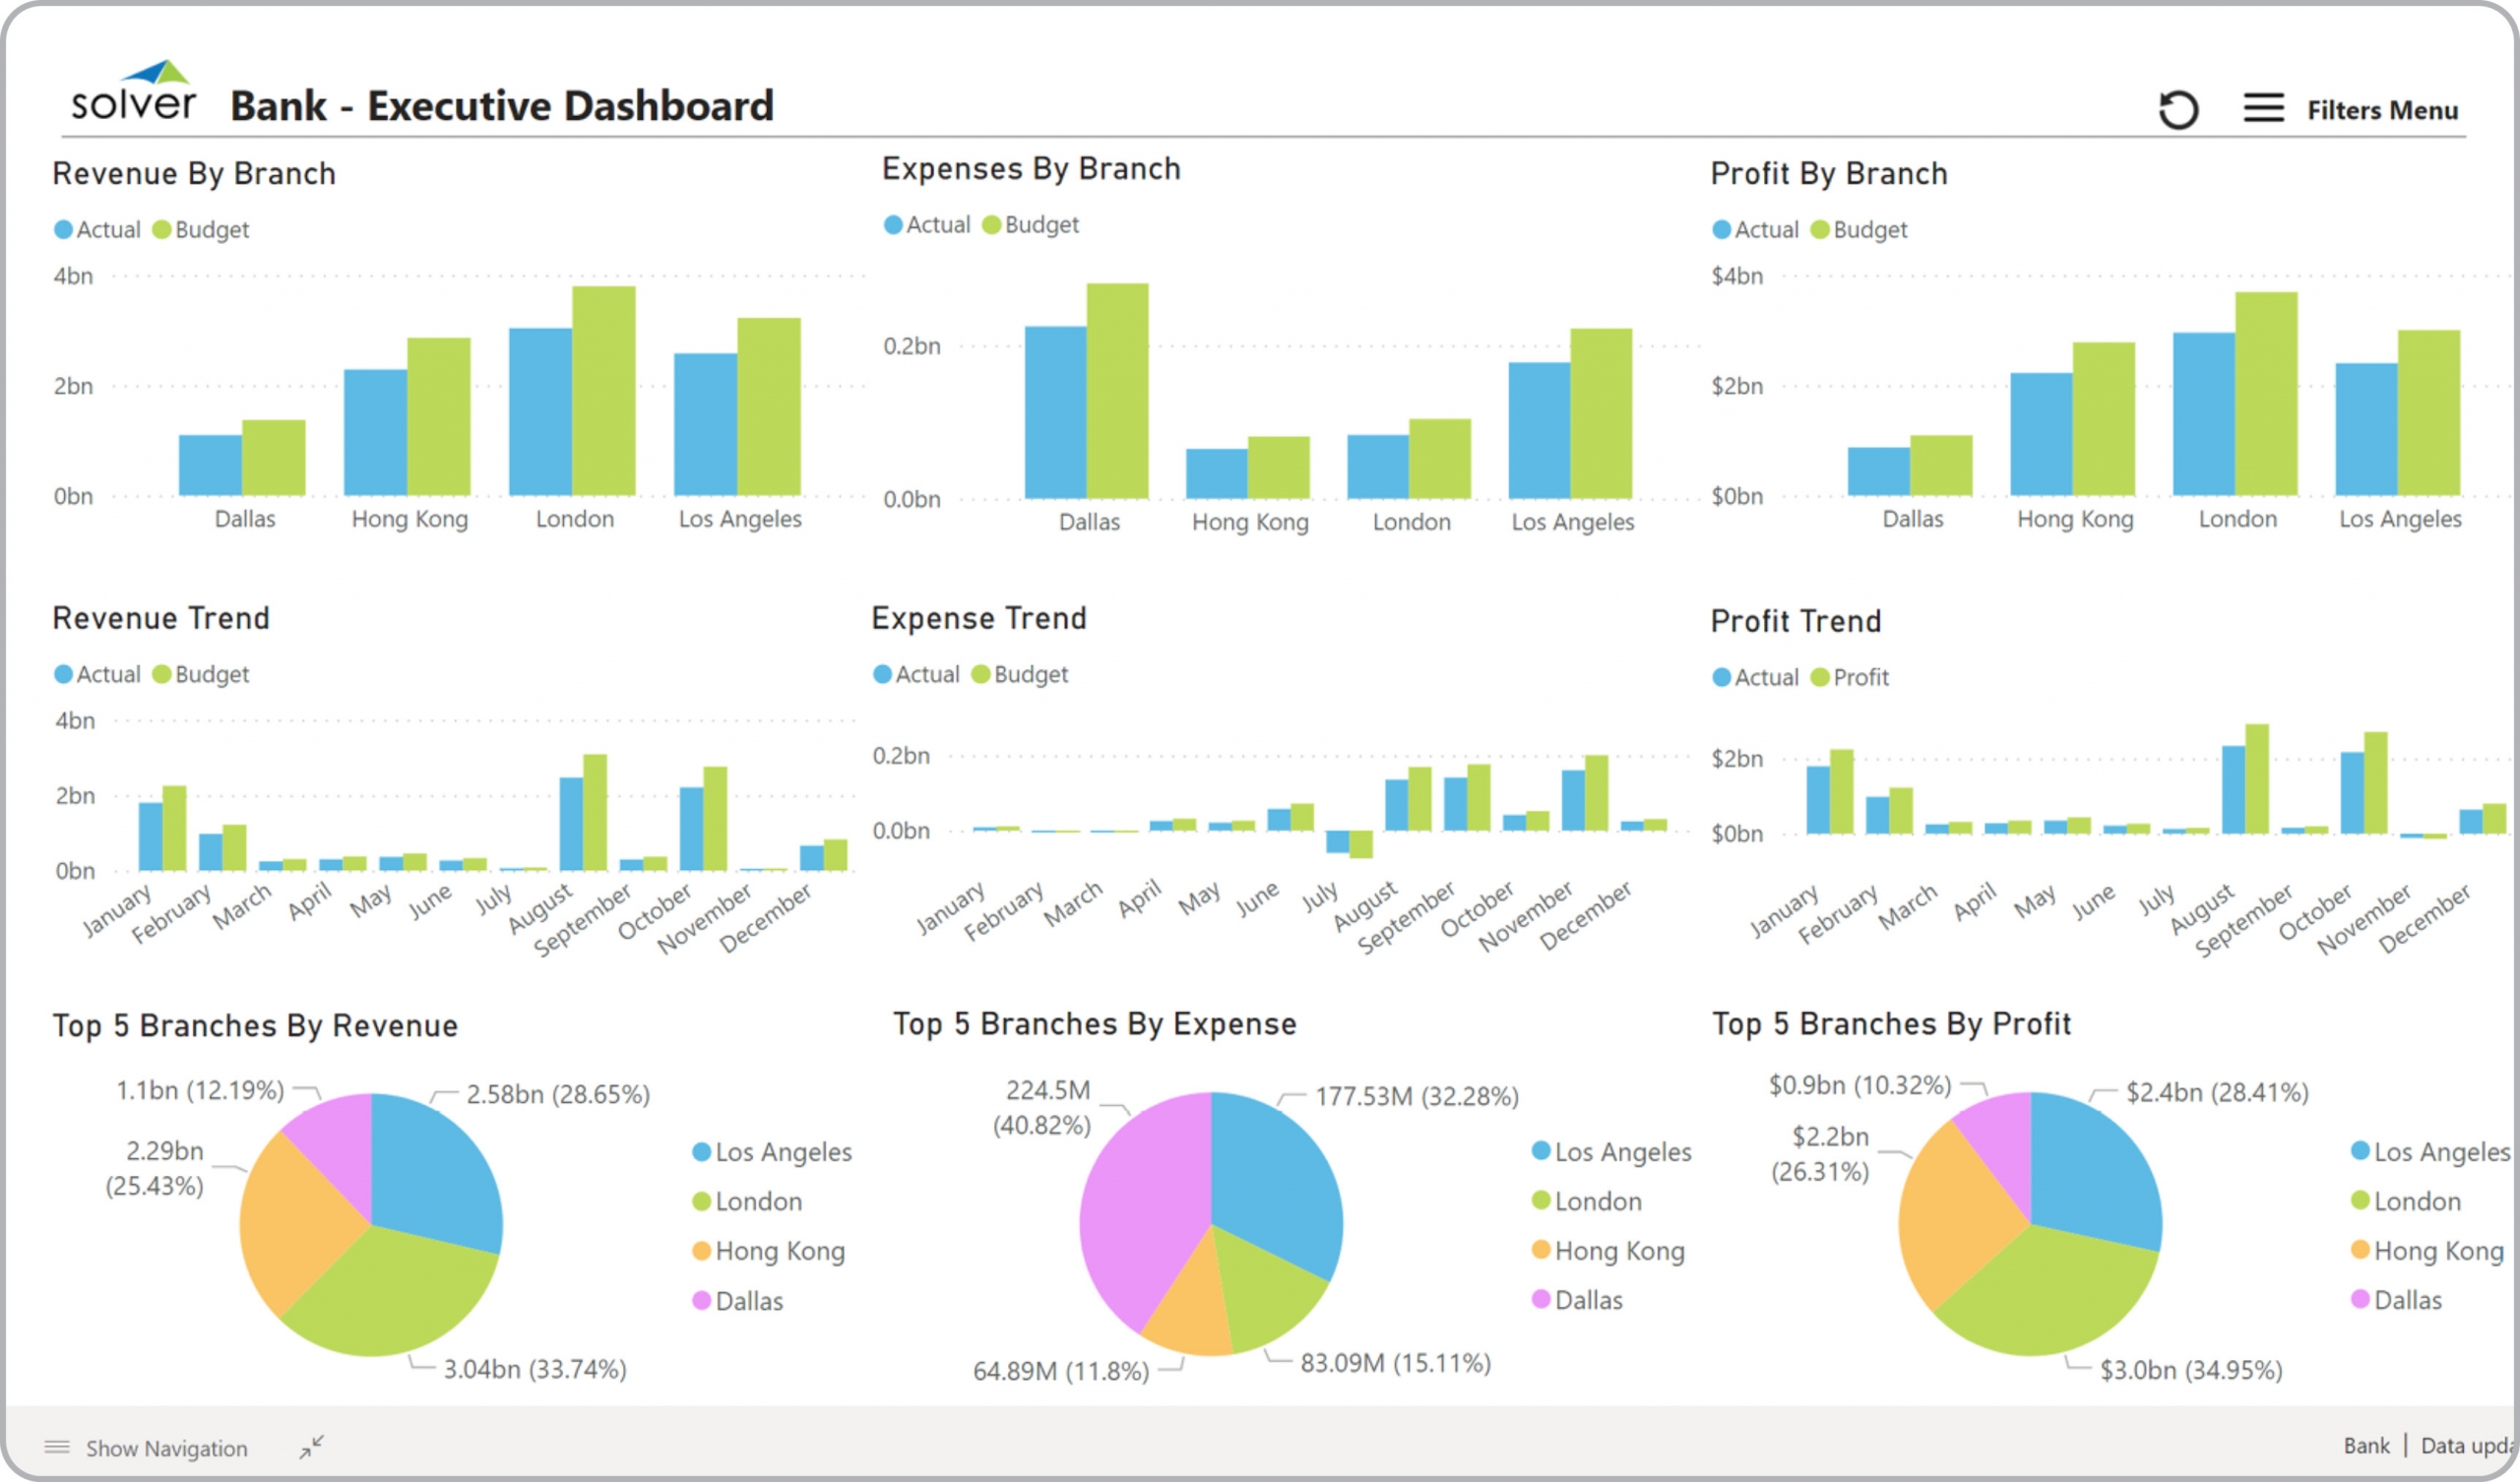
Bank – Executive Dashboard
Power BI dashboard for top KPIs for an executive incl. revenue and profit branch comparison and trend analysis.
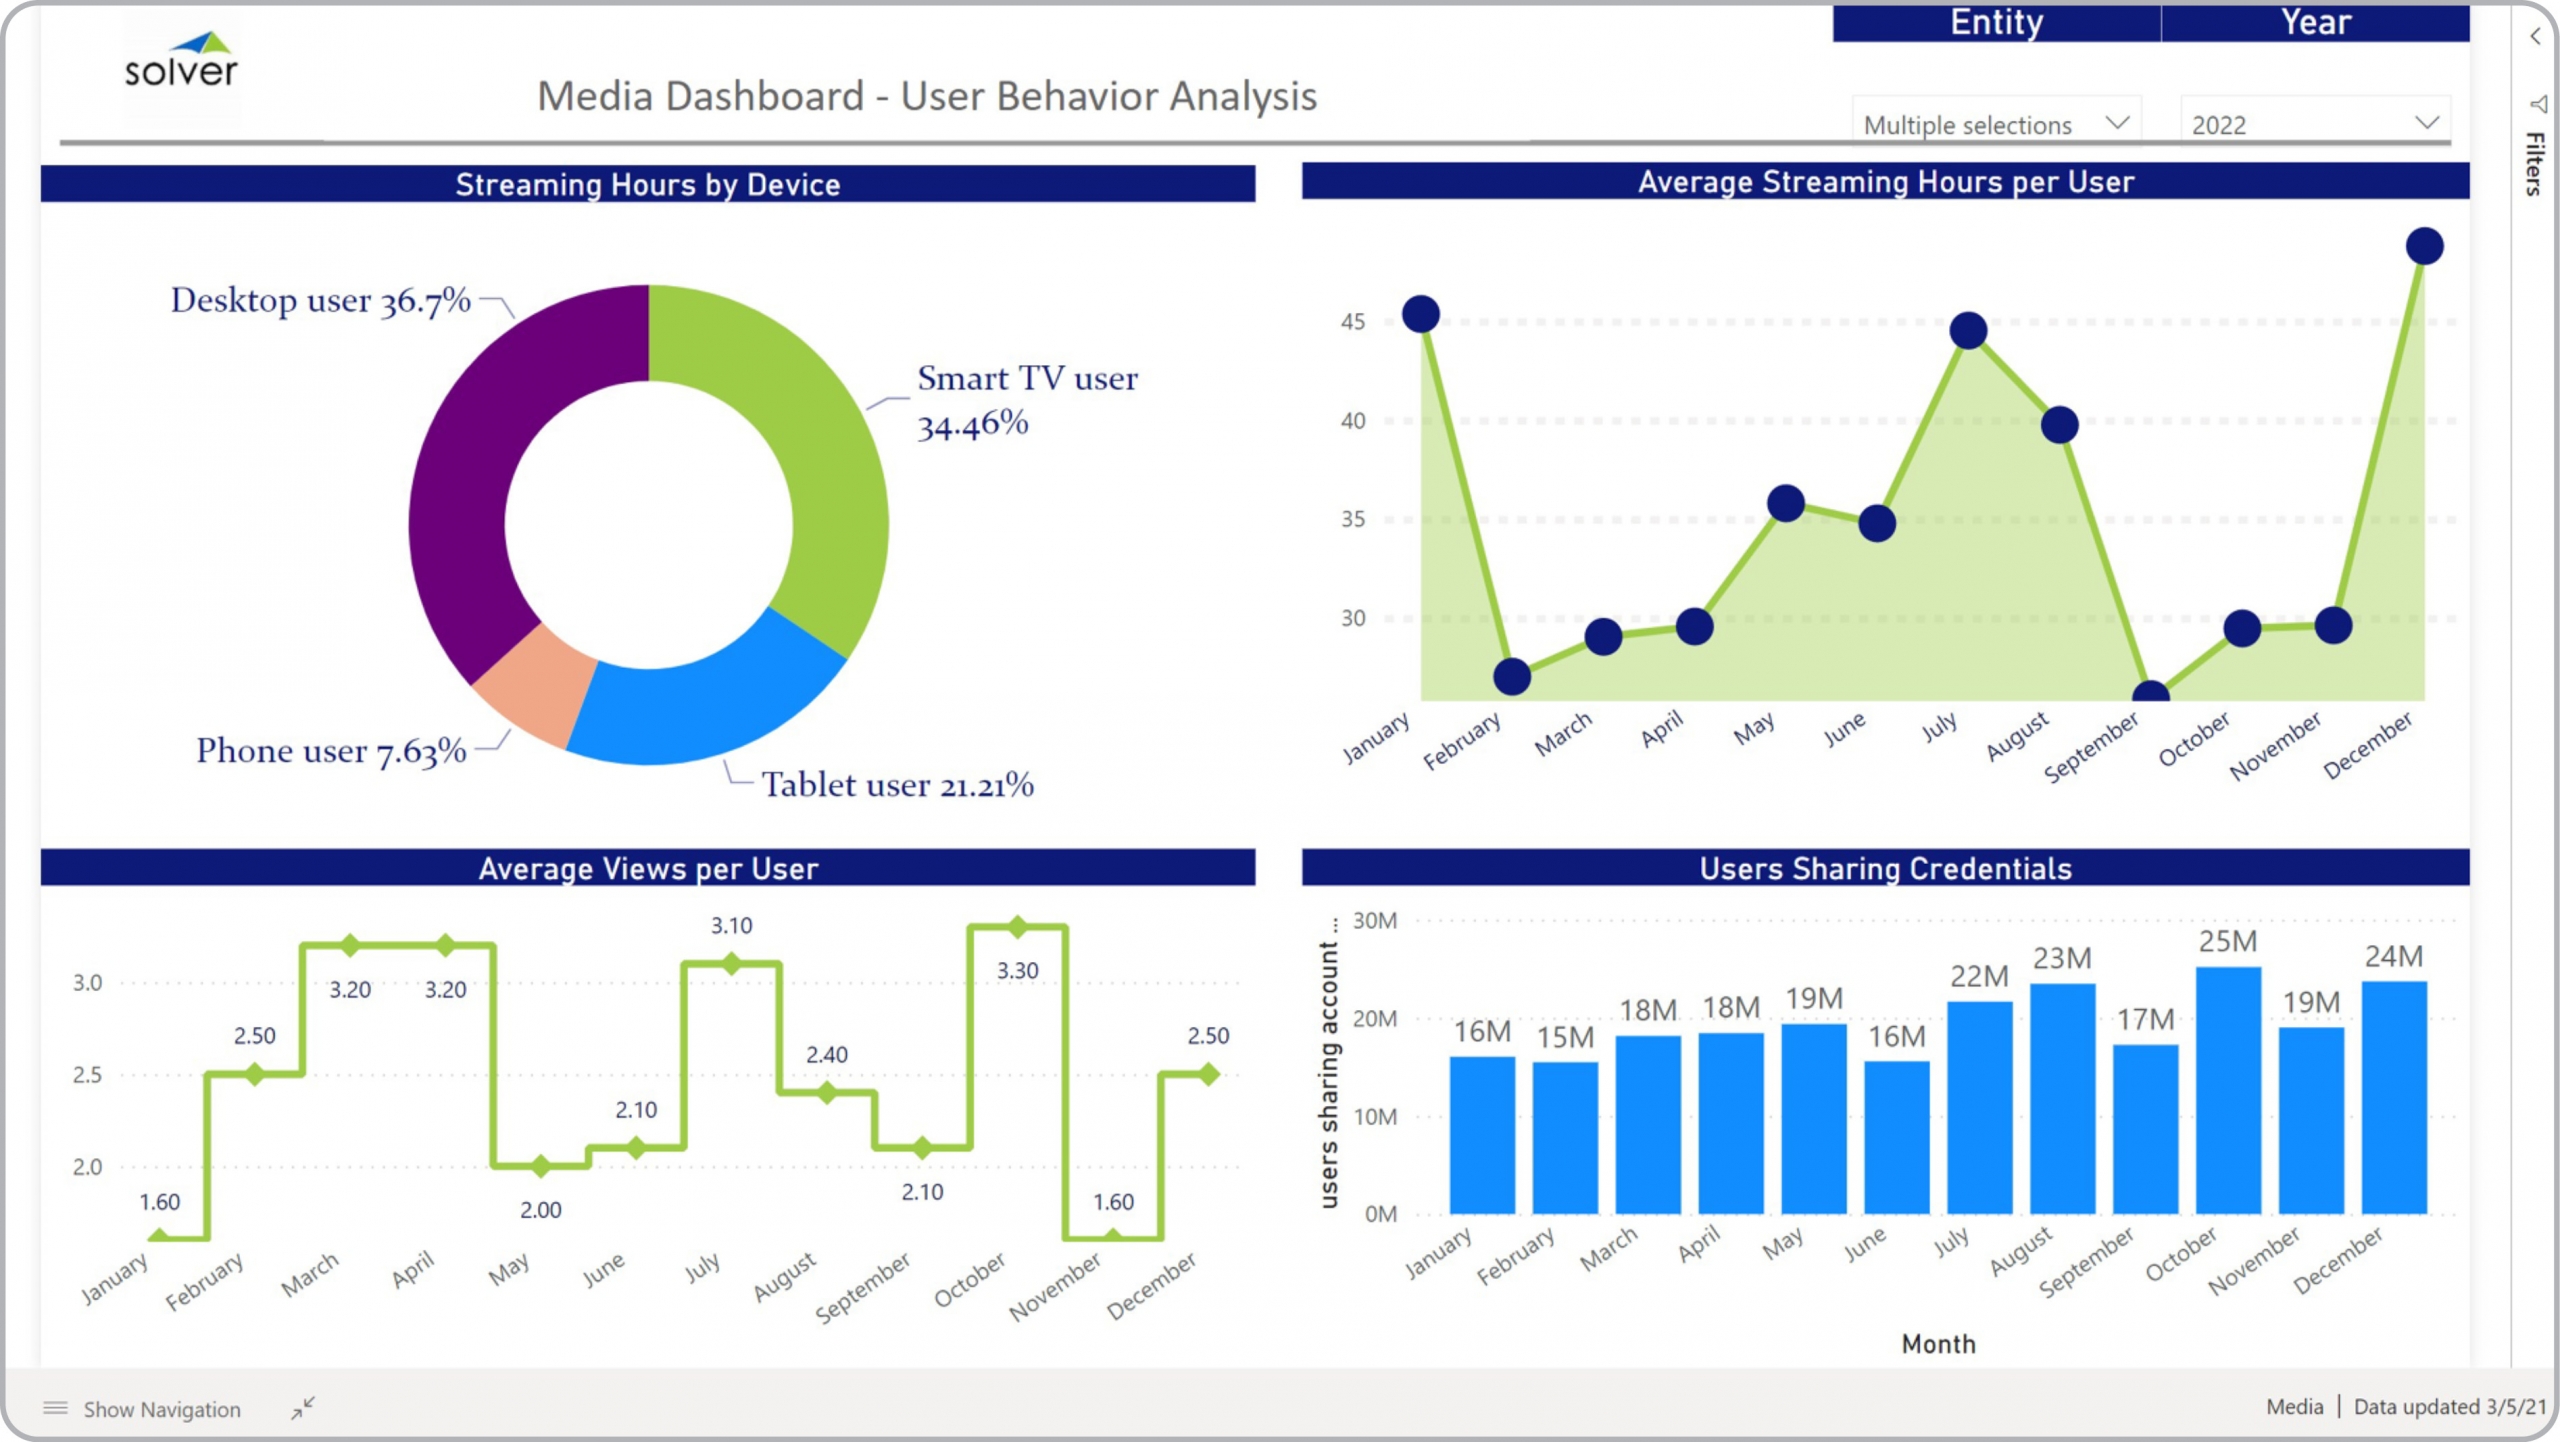
Media – User Behavior Analysis
Power BI dashboard for user KPIs with analysis of views per user, streaming hours and credential sharing.
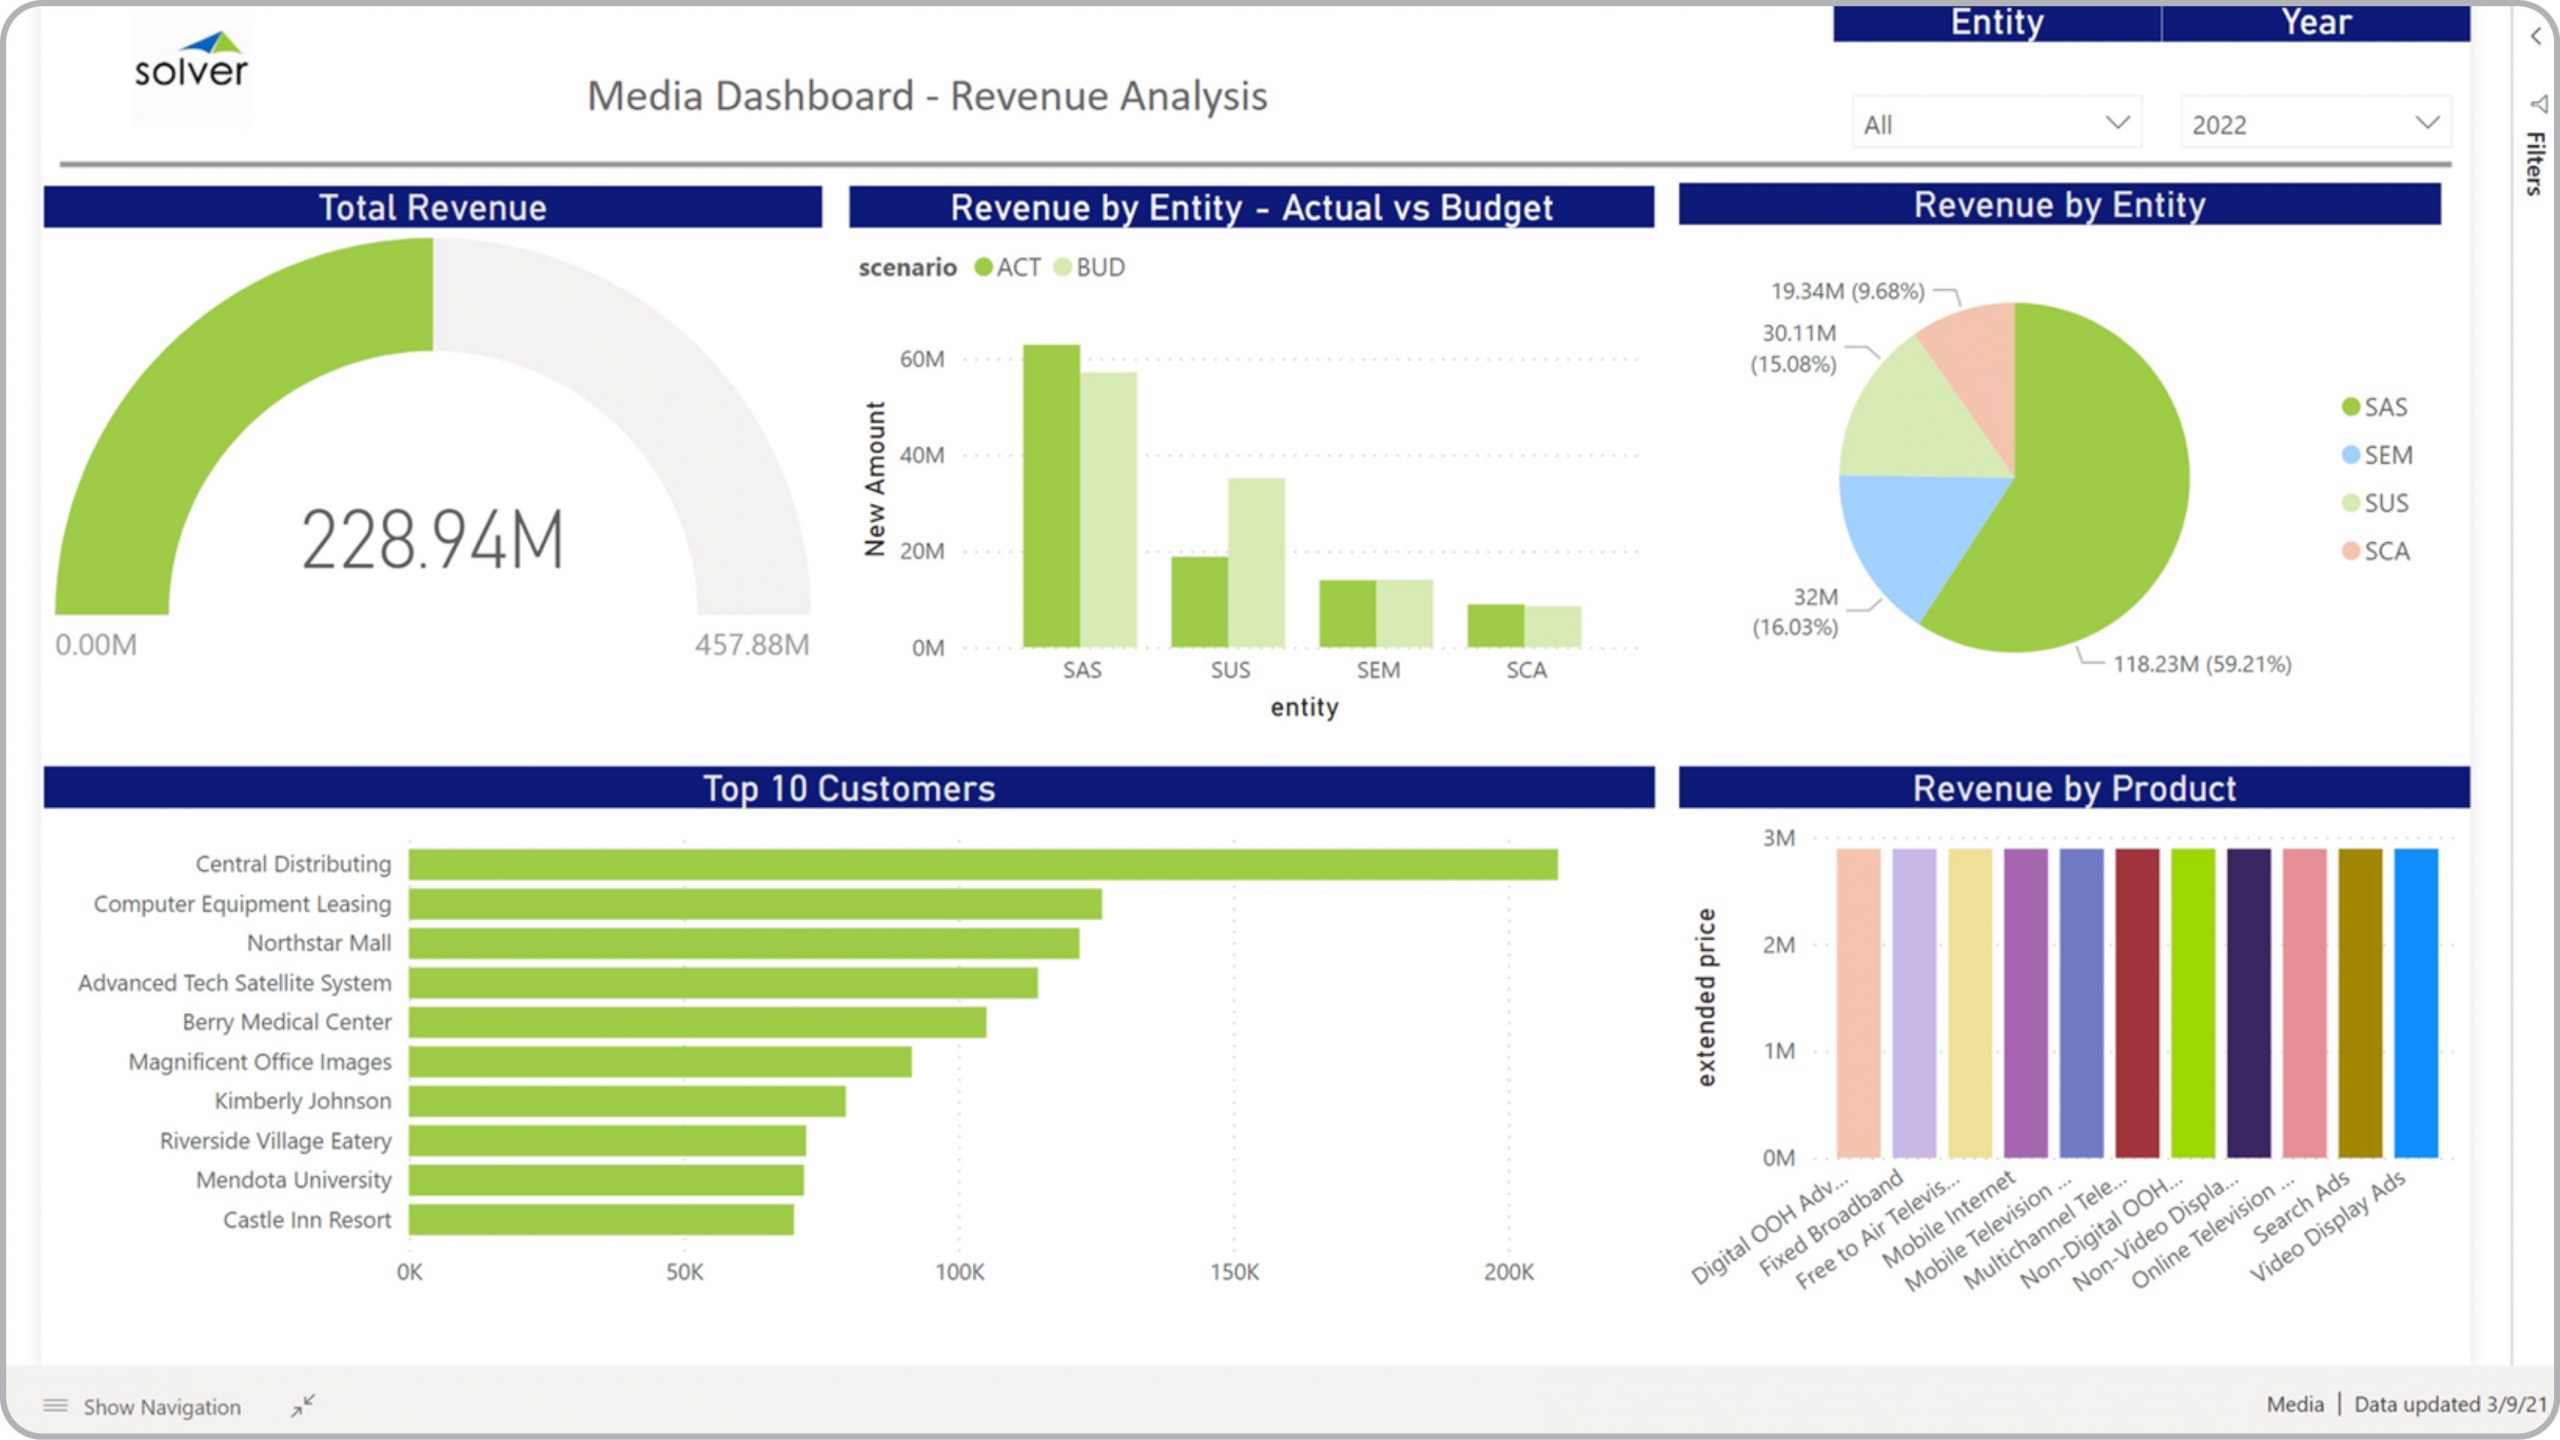
Media – Revenue Analysis
Power BI dashboard for revenue KPIs with detailed performance by entity, customer and product.
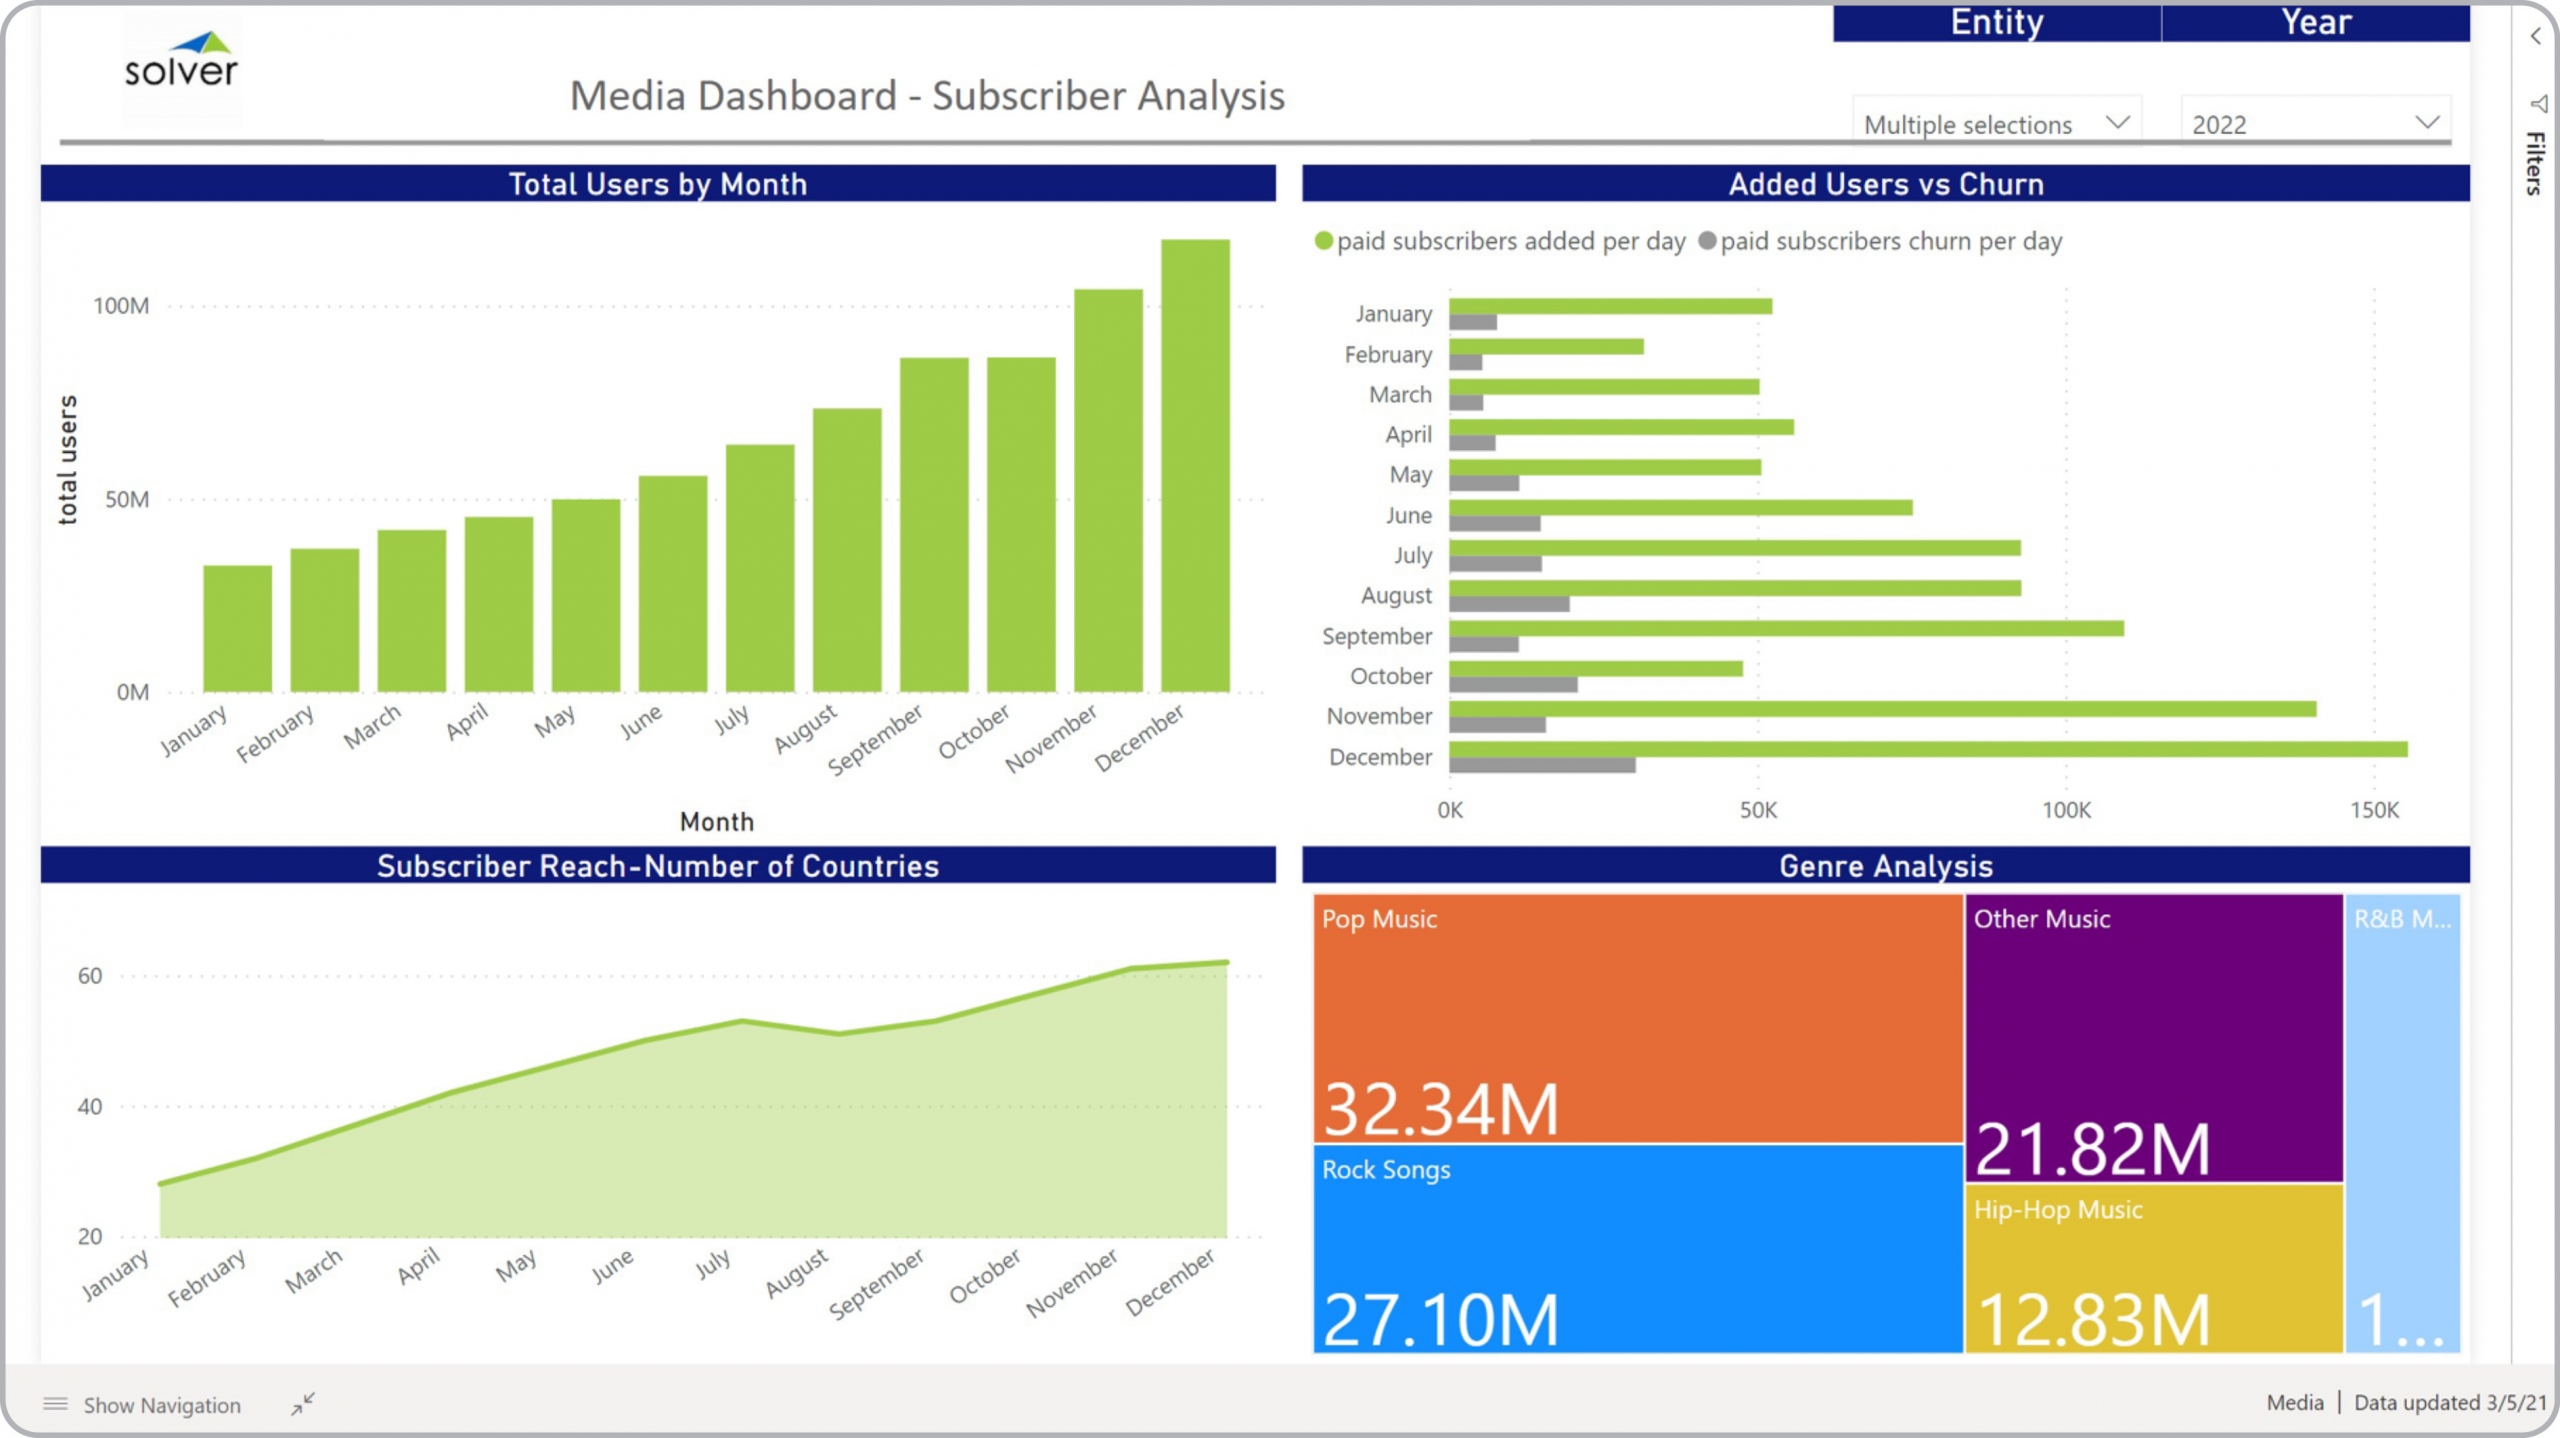
Media – Subscriber Analysis
Power BI dashboard for subscriber metrics including total users, churn, reach and genre analysis.
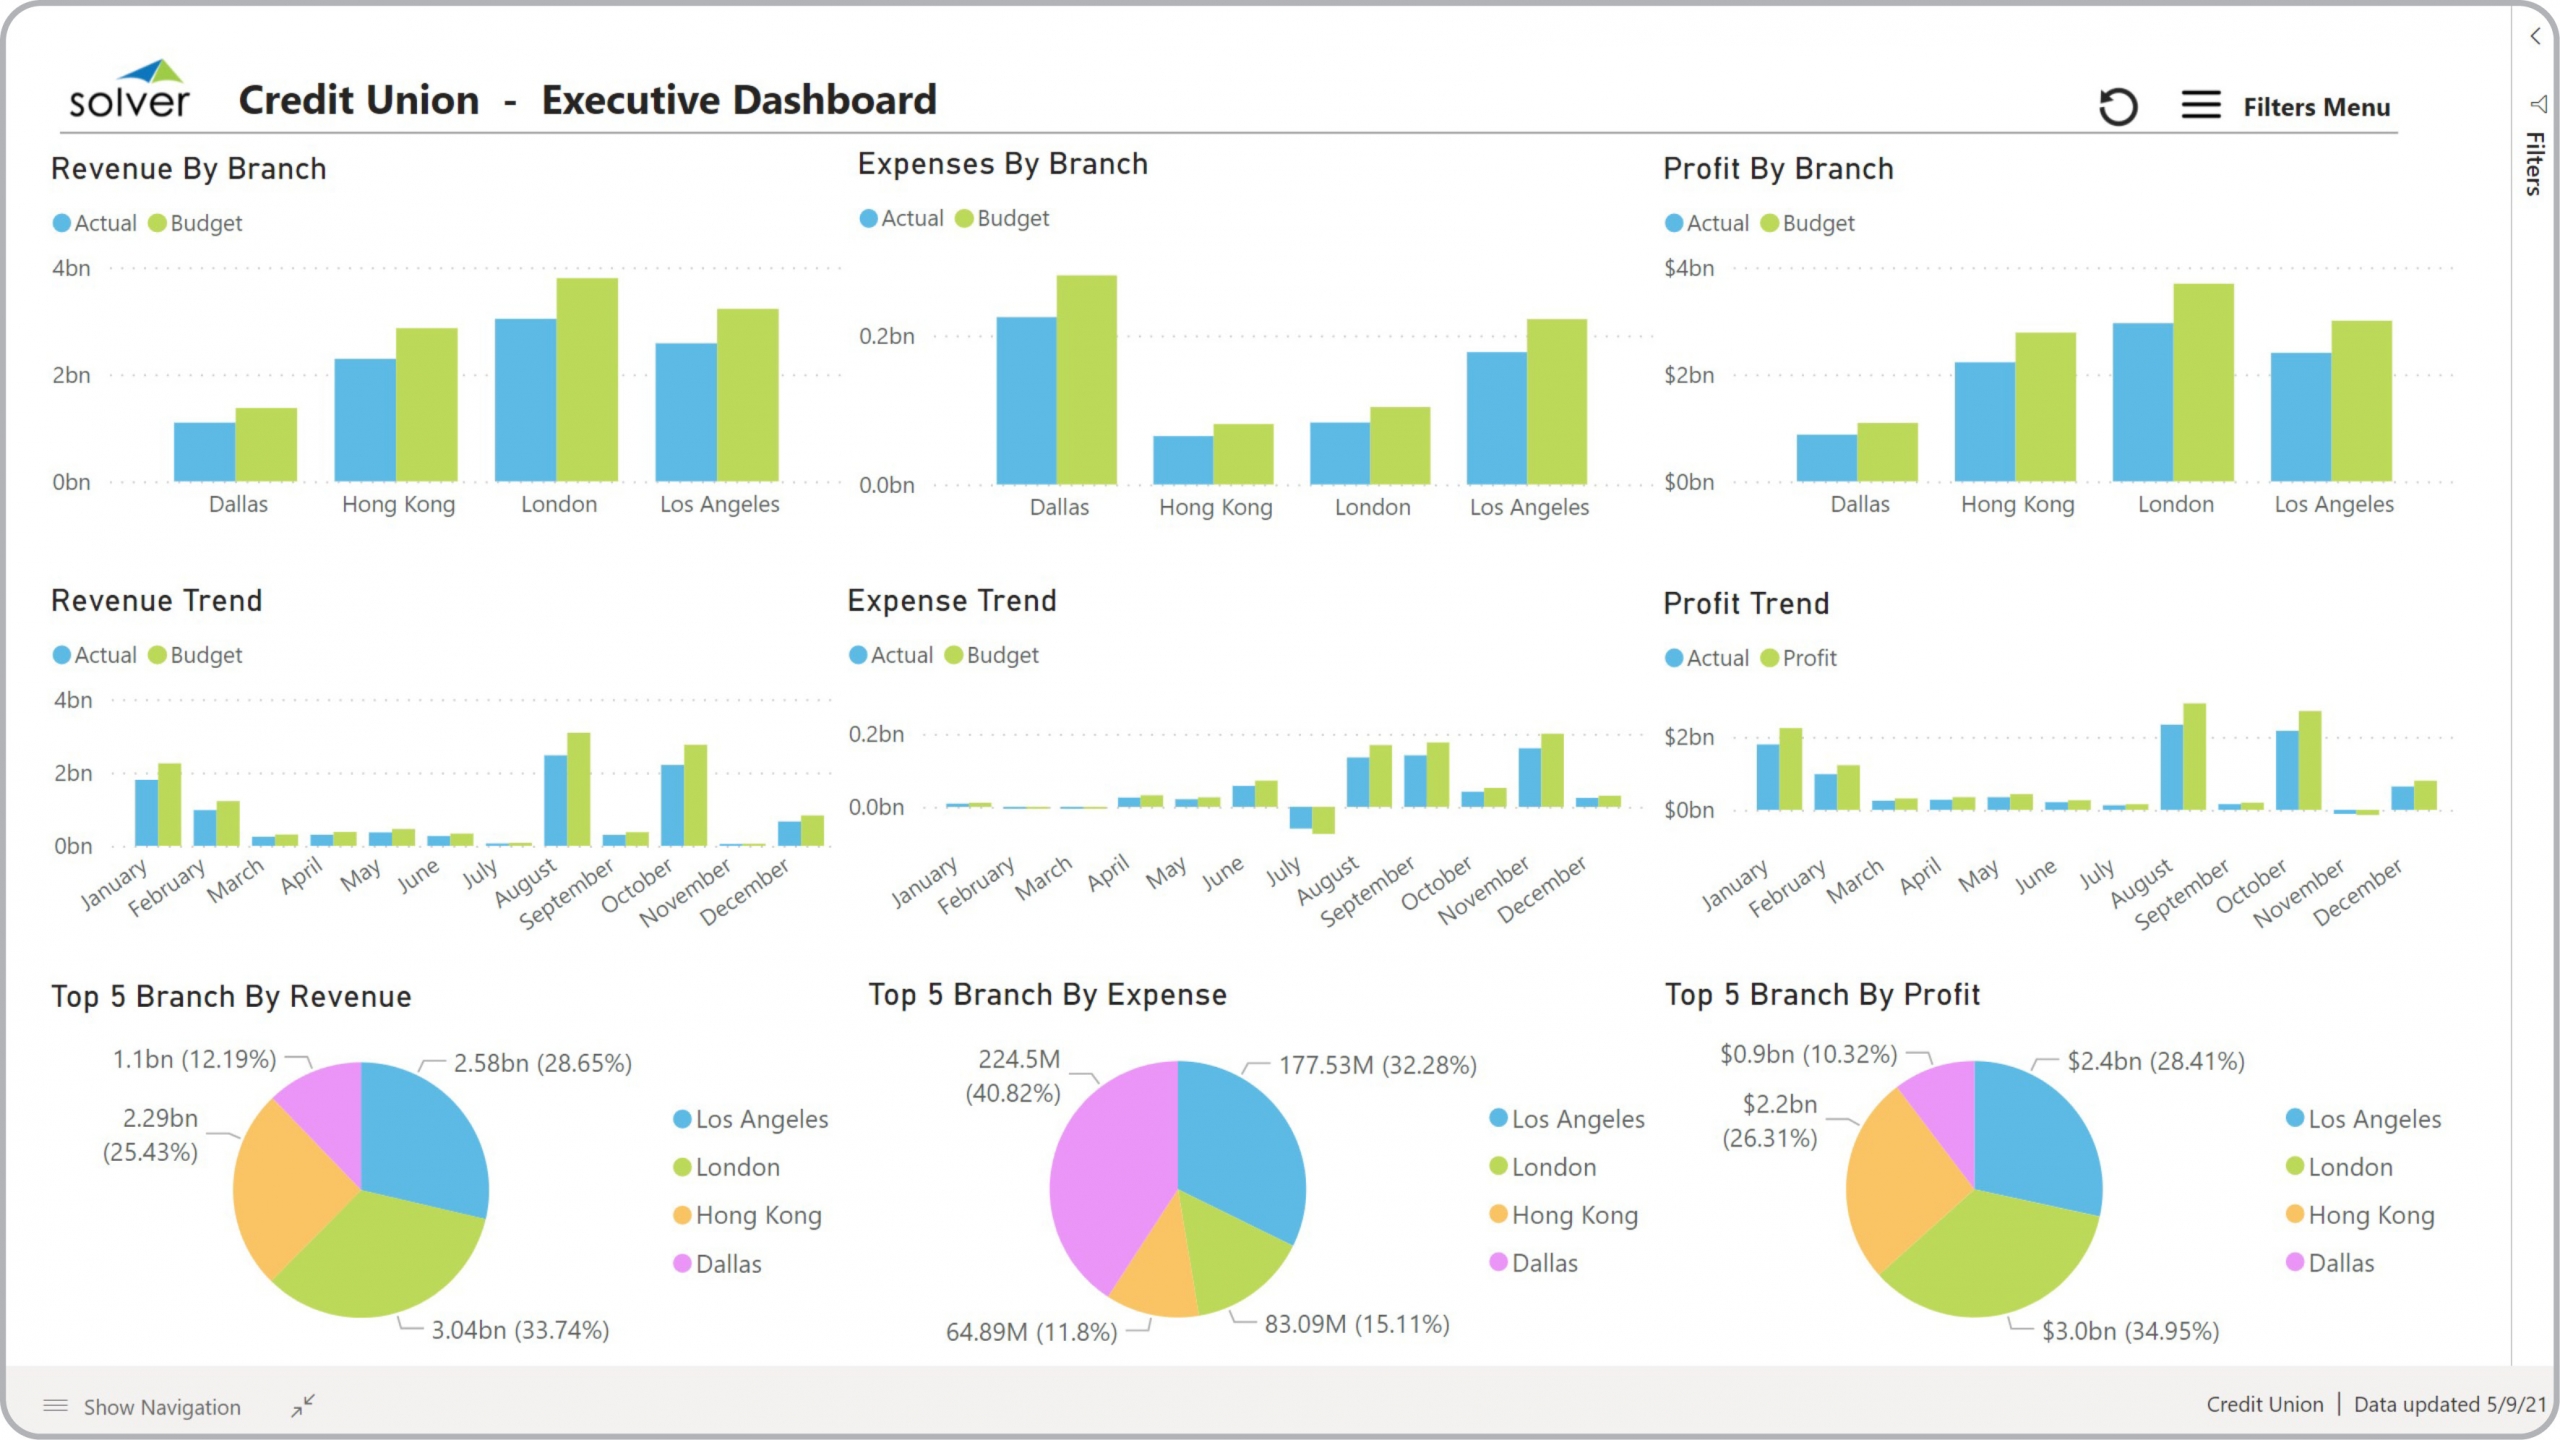
Credit Union – Executive Dashboard
Power BI dashboard for analysis and trends for revenues, expenses and profitability
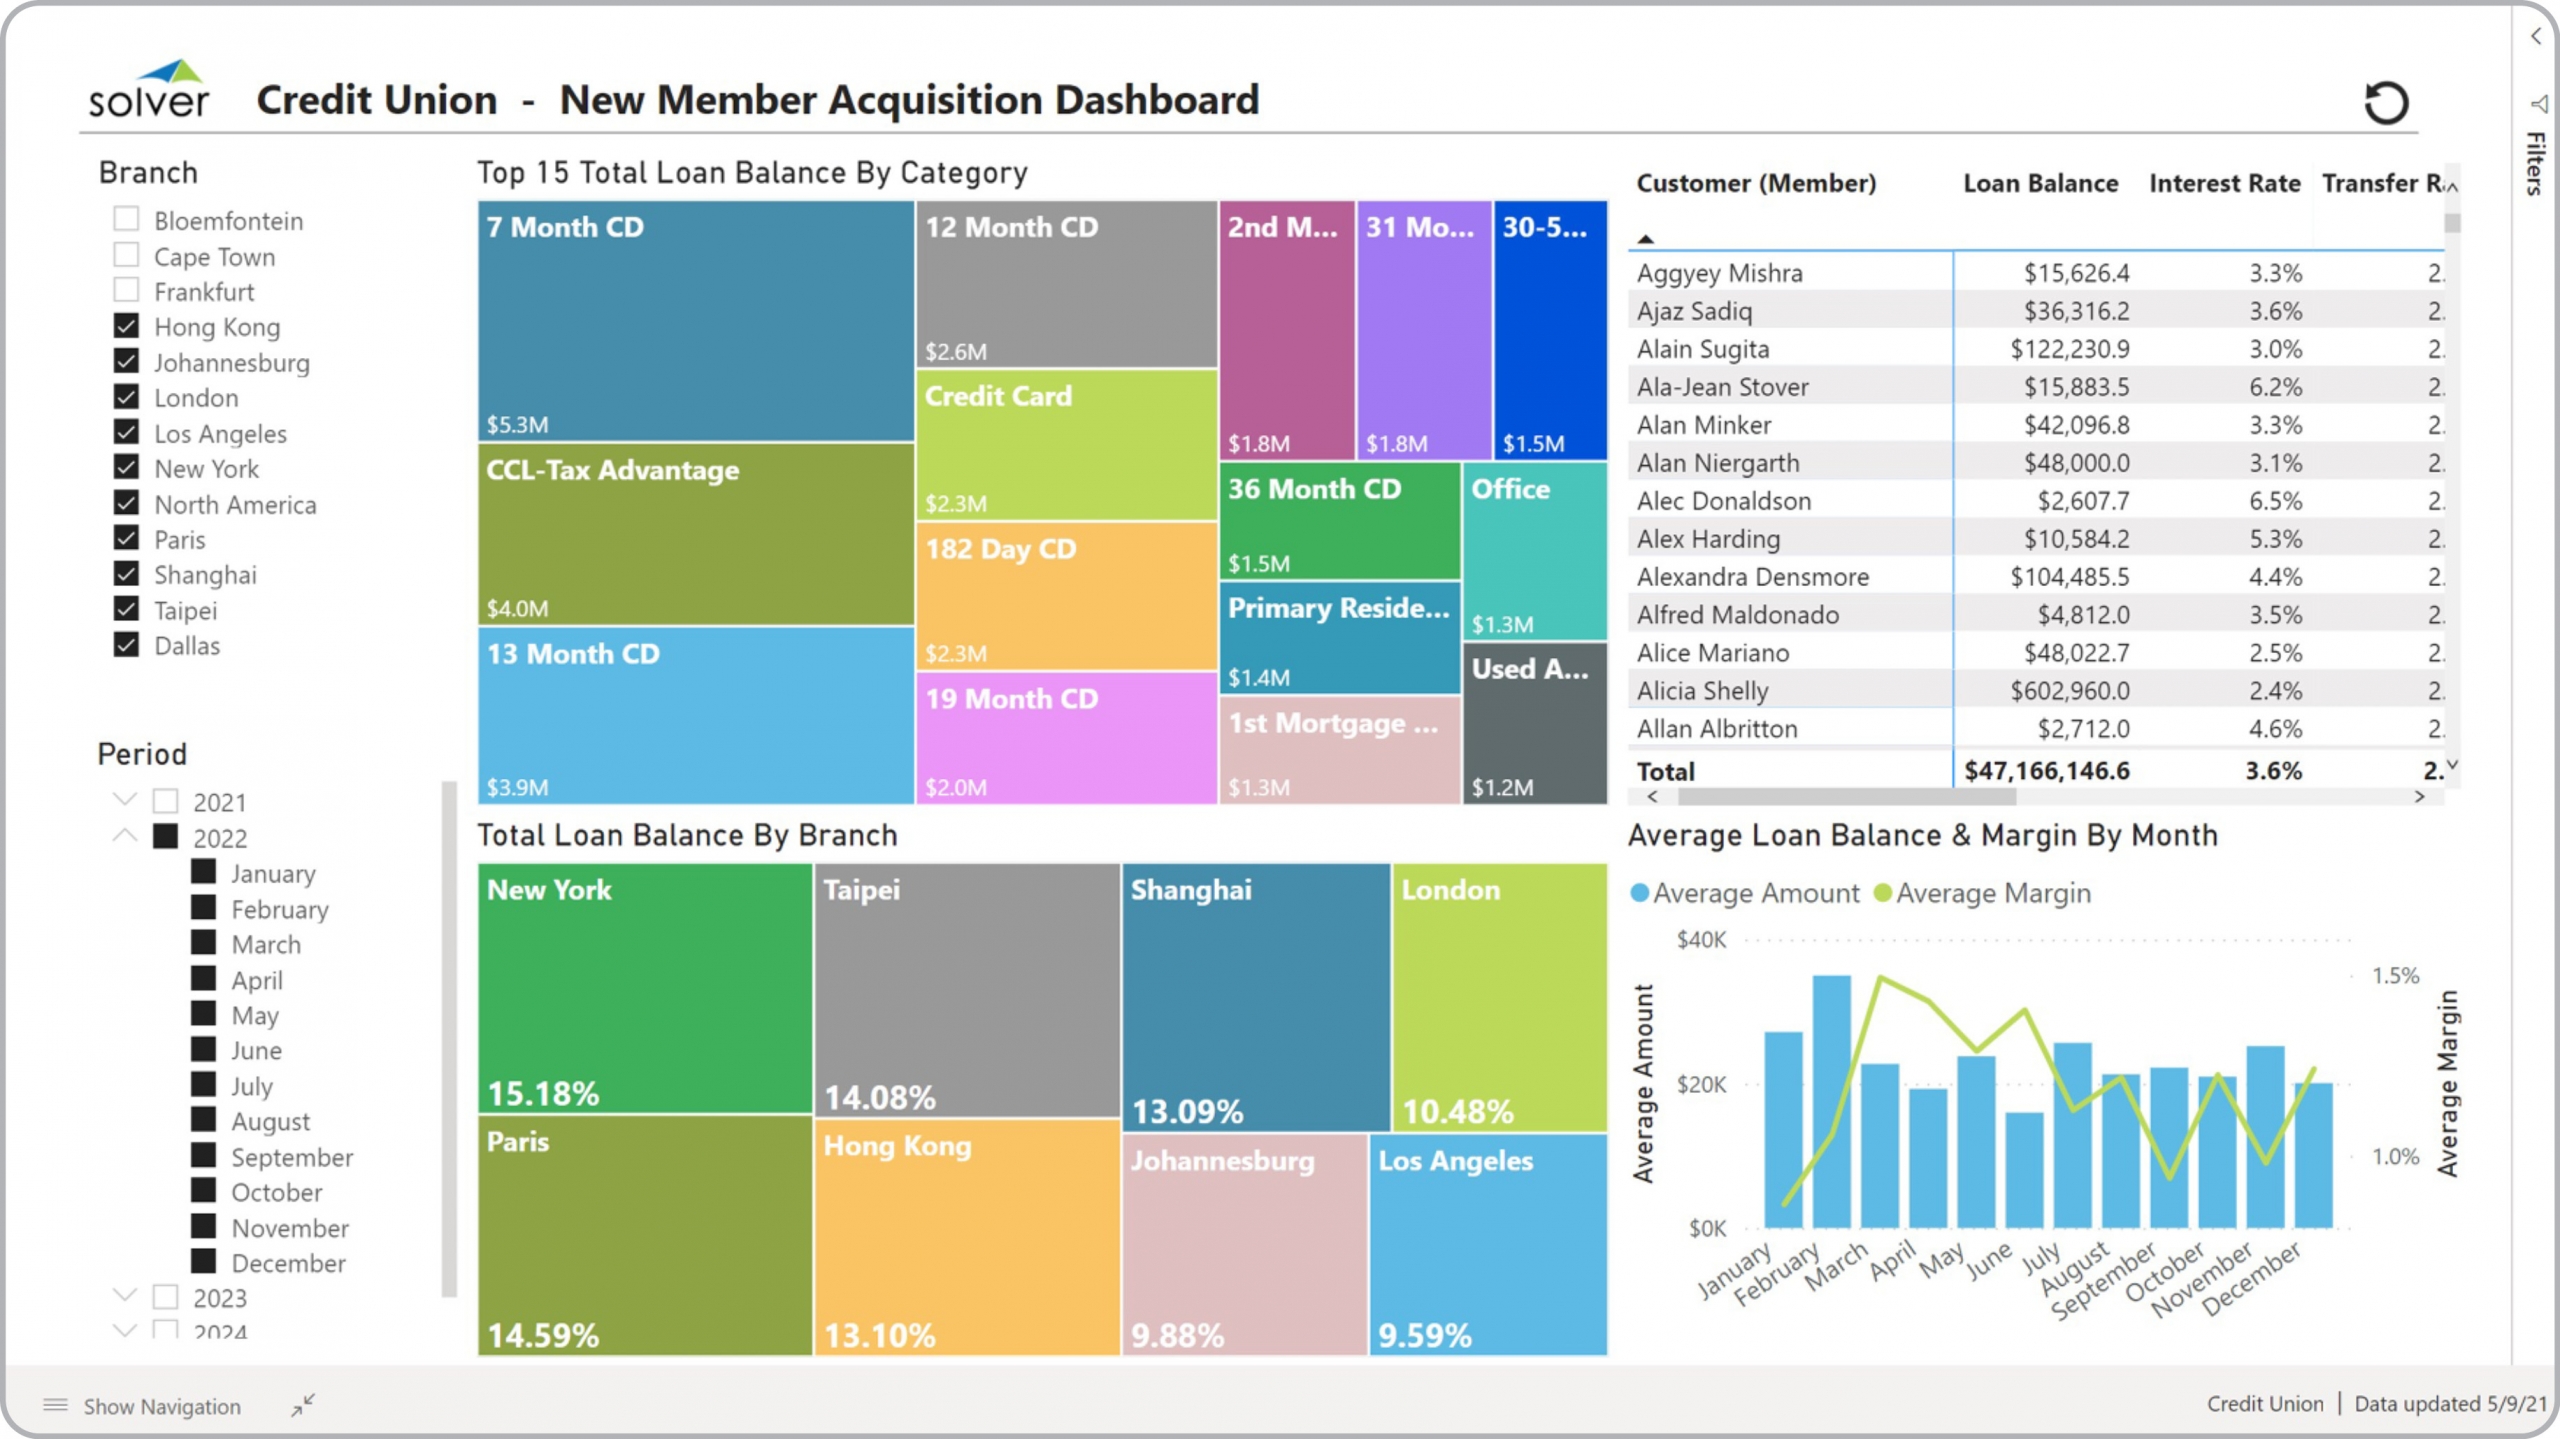
Credit Union – New Member Dashboard
Power BI dashboard for analysis of acquired customers and related loans and metrics
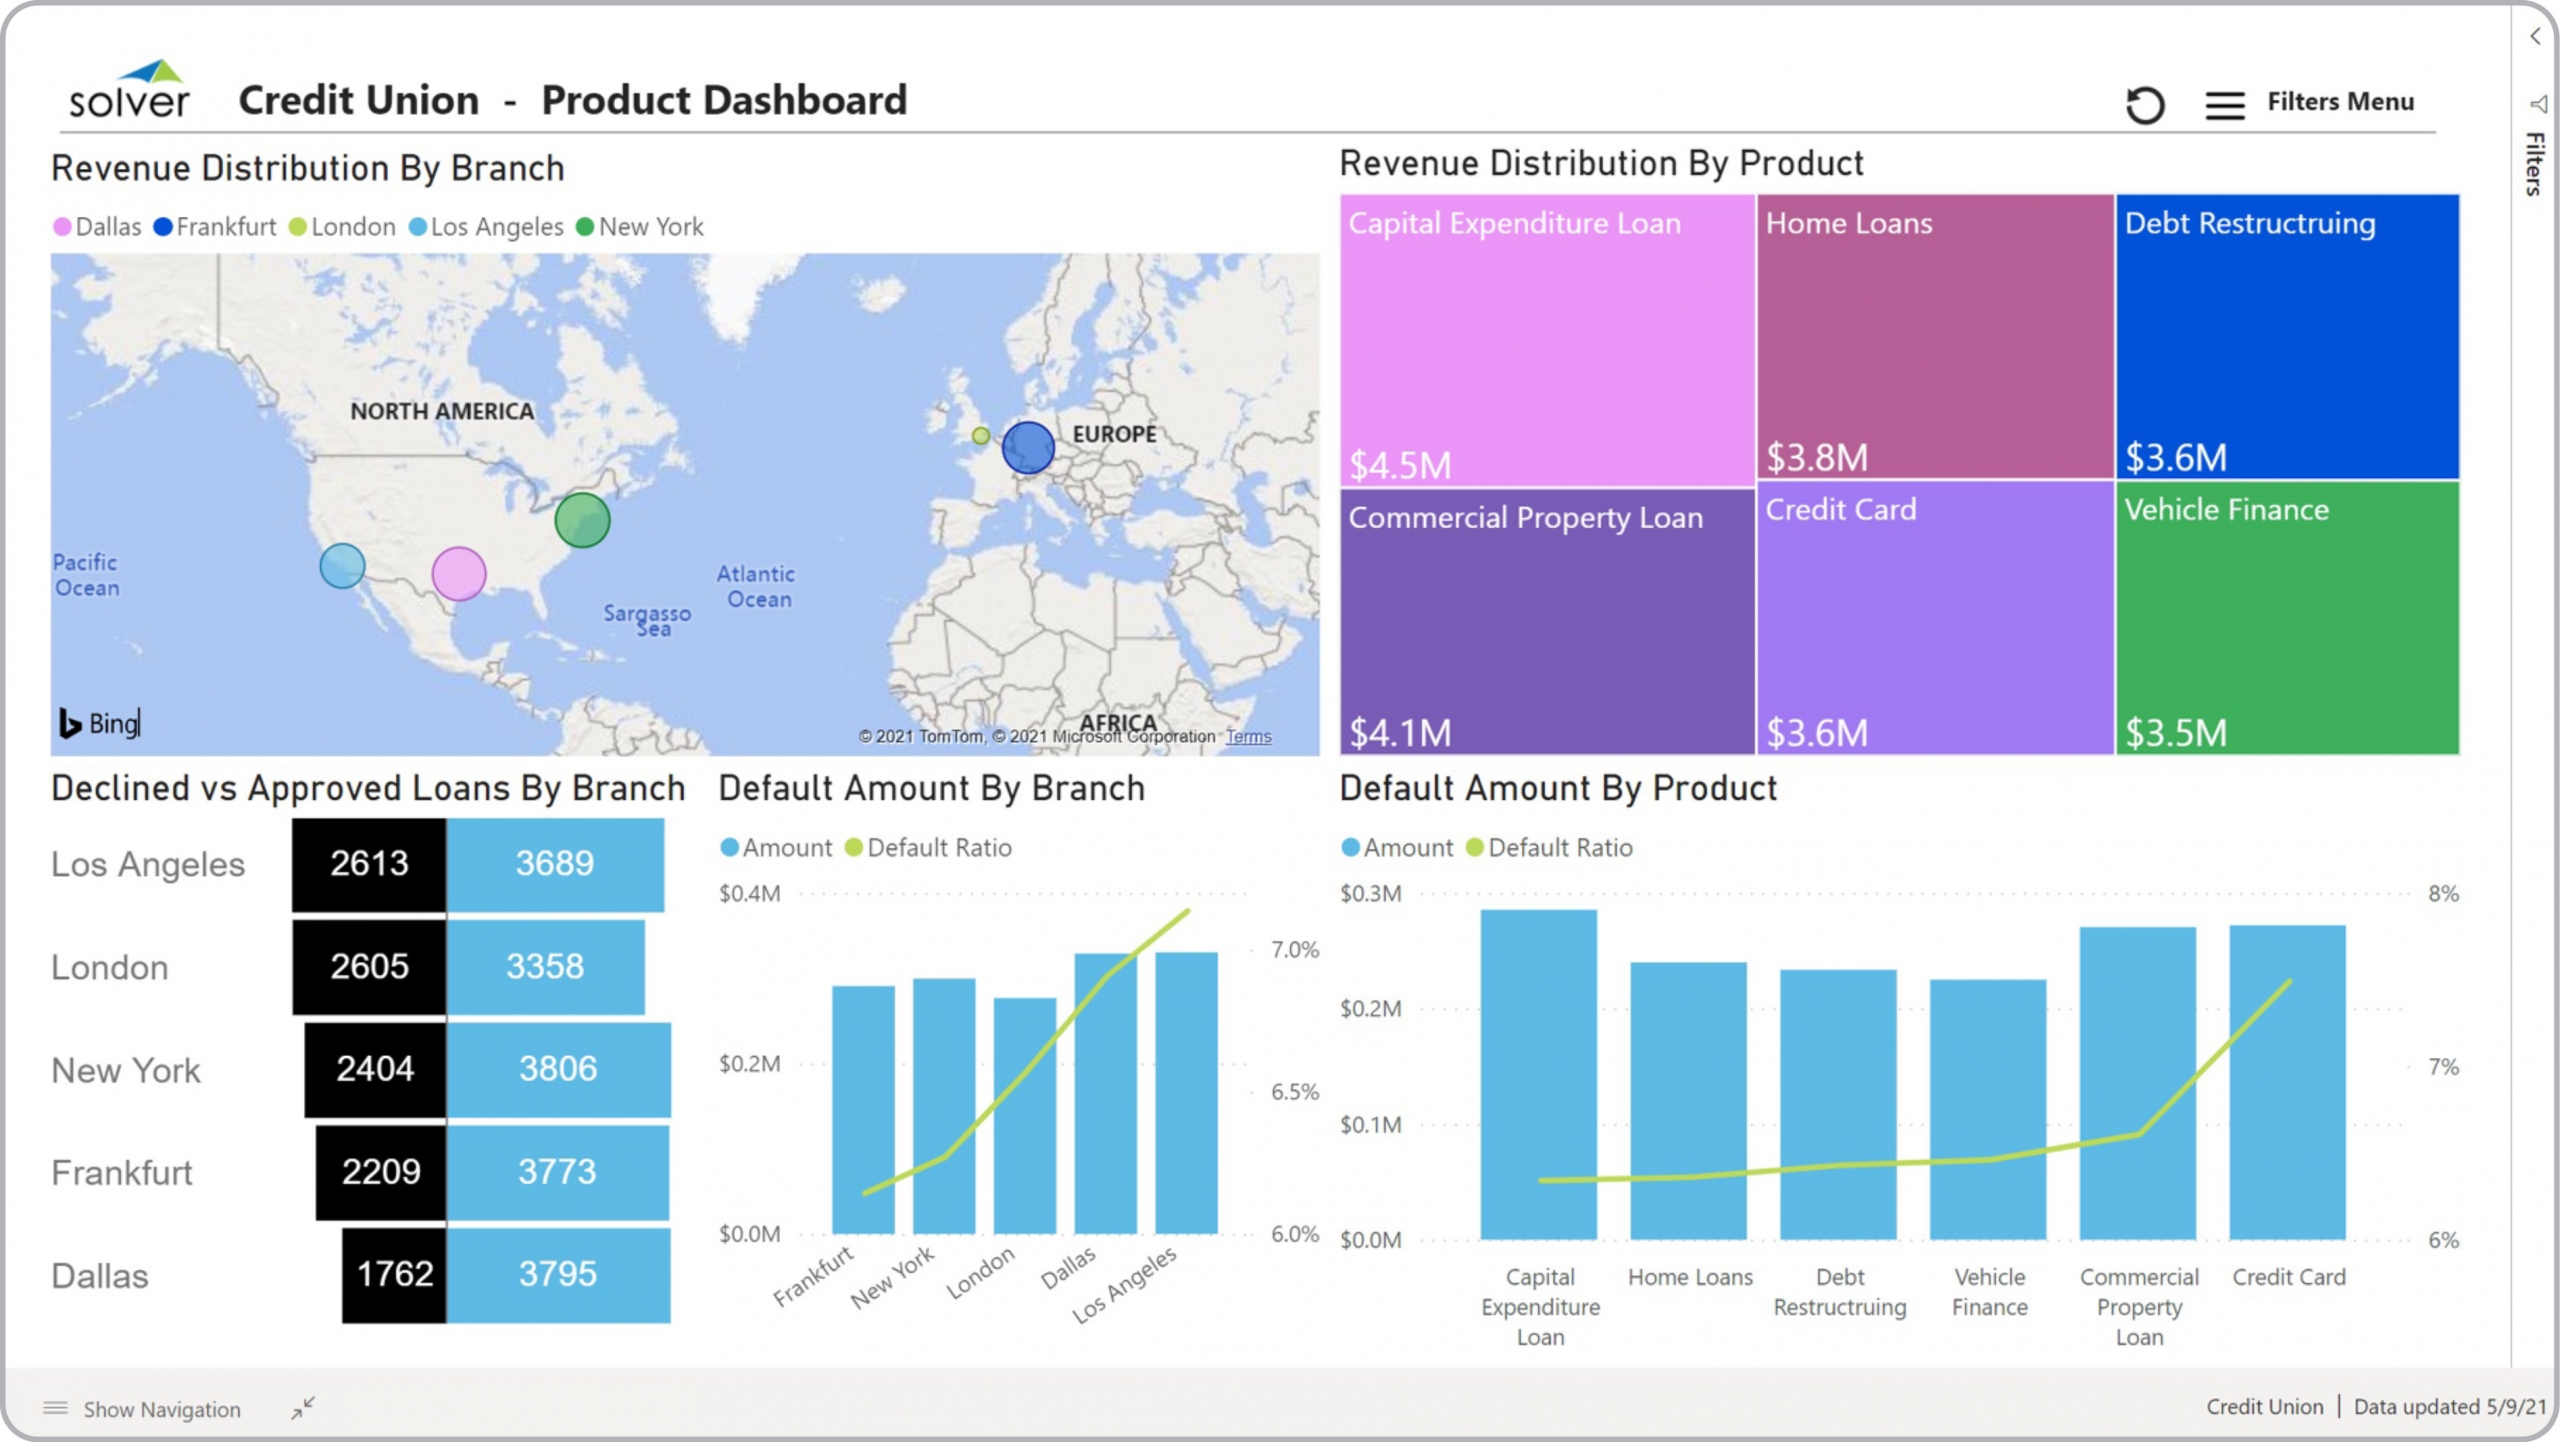
Credit Union – Product Dashboard
Power BI dashboard for analysis of declined and approved loans by branch, and revenue and defaults by product

Credit Union – Loan Dashboard
Power BI dashboard for declined vs approved loans by product, loan defaults by branch, default trend, loans approved

Credit Union – CFO Dashboard
Power BI dashboard for analysis and trends for revenues, expenses and profitability by product, department and branch
Ad Hoc Reporting Overview
See Ad Hoc Reporting in action & see how you can answer custom queries in seconds!